A Stochastic Optimization Model for Carbon Mitigation Path under Demand Uncertainty of the Power Sector in Shenzhen, China


1
Key Laboratory for Urban Habitat Environmental Science and Technology, School of Environment and Energy, Peking University Shenzhen Graduate School, Shenzhen 518055, China
2
College of Environmental Sciences and Engineering, Peking University, Beijing 100871, China
*
Author to whom correspondence should be addressed.
Sustainability 2017, 9(11), 1942; https://doi.org/10.3390/su9111942
Submission received: 20 September 2017
/
Revised: 14 October 2017
/
Accepted: 19 October 2017
/
Published: 26 October 2017
(This article belongs to the Collection Power System and Sustainability)
Abstract
:In order to solve problems caused by climate change, countries around the world should work together to reduce GHG (greenhouse gas) emissions, especially CO2 emissions. Power demand takes up the largest proportion of final energy demand in China, so the key to achieve its goal of energy-saving and emission reduction is to reduce the carbon emissions in the power sector. Taking Shenzhen as an example, this paper proposed a stochastic optimization model incorporating power demand uncertainty to plan the carbon mitigation path of power sector between 2015 and 2030. The results show that, in order to achieve the optimal path in Shenzhen’s power sector, the carbon mitigation technologies of existing coal and gas-fired power plants will be 100% implemented. Two-thirds and remaining one-third of coal-fired power plant capacities are going to be decommissioned in 2023 and 2028, respectively. Gas-fired power, distributed photovoltaic power, waste-to-energy power and CCHP (Combined Cooling, Heating, and Power) are going to expand their capacities gradually.
1. Introduction
The problems caused by climate change, such as global warming and sea level rise, have attracted increasing attention from all over the world. Greenhouse gas (GHG) emissions, especially CO2 emissions, are important drivers that lead to global climate change. The Paris Agreement, signed in New York on 22 April 2016, set out the goal of “holding the increase in the global average temperature to well below 2 °C and pursuing efforts to limit the temperature increase to 1.5 °C above pre-industrial levels” [1]. To achieve this goal, countries around the world should work together to reduce GHG emissions, especially CO2 emissions. As the world’s largest CO2 emitter, China has promised that, in 2030, the CO2 emission per unit of Gross Domestic Product (GDP) will decrease by 60–65% than that in 2005 in the Paris Agreement.
Among all sectors in China, the power sector contributed the largest share, upwards of 50%, in CO2 emissions in 2010 [2]. Although the efficiency of power usage is improving, the power demand is projected to increase with the growth of the economy, making the CO2 emissions in this sector even larger in the future [3]. To achieve the goal of energy-saving and emission reduction in China, the key is to reduce the carbon emissions in the power sector. Additionally, the fact that CO2 emissions from the power sector are centrally emitted from power plants, which are owned by the state, makes it easier to implement carbon mitigation measures in the power sector than sectors with distributed emissions, like the transportation sector.
Many scholars have proposed various measures to reduce CO2 emissions in the power sector. For example, Beér [4] argued that efficiency improvement for new plants and existing plants has become a key practical tool capable of reducing CO2 emission from fossil fuel plants in the short term. Liu et al. [5] found that renewable energy has great potential in CO2 mitigation and was important in the implementation of GHG control in the electricity supply sector of China. Jin et al. [6] and Yoro and Sekoai [7] suggested that Carbon Capture and Storage (CCS) in the power sector was an effective technology for reducing GHG emissions in response to climate change concerns. Mesarić et al. [8] argued that the sociotechnical transition towards smart grids is an on-going process. Due to its capability of improving reliability of performance and customers’ responsiveness, as well as encouraging greater efficiency decisions by customers and the utility provider, smart grids can avoid electricity waste, thus reducing energy consumption and achieving carbon mitigation [9]. Shi et al. [10] proposed an energy systems integration (ESI) operational scheduling model as an important form of a new energy system, which included the electrical, thermal and gas networks.
Considering carbon mitigation measures comprehensively, some scholars studied optimal planning in the power sector incorporating the environmental impacts. For example, Zhang et al. [3] presented a multi-period modelling and optimization framework for the optimal planning of China’s power sector between 2010 and 2050, considering impacts of carbon mitigation measures, including carbon cap and price, and the application of CCS. Ye et al. [11] built a multi-period optimization model for China’s power sector with considerations of SO2, NOX, and CO2 emission control. Cheng et al. [12] proposed a multi-region optimization model and considered how investment decisions to expand and alter the existing generation mix could be optimized across a timeframe from 2011 to 2050. Chen et al. [13] developed a deterministic linear programming model with consideration of the non-carbon externalities and applied it to China’s power sector for the period from 2015 to 2030. Lee [14] presented a mathematical programming model for multi-period planning of power plant retrofits with carbon capture technology and applied this model to energy planning in Malaysia and Taiwan.
It can be noted that, in the literature mentioned above [3,11,12,13,14], all parameters in the models are fixed. However, this is not real under tremendously complex environments which are full of uncertainties. Stochastic optimization model could be the effective way to solve this problem. Stochastic optimization is a method widely used in the field of energy planning [15,16], energy system planning [17,18,19,20,21,22,23], CCS infrastructure planning [24,25], and Combined Cooling, Heating, and Power (CCHP) generation systems [26]. In terms of studies on stochastic optimization in the power sector, there are a few studies [27,28,29,30]. Spangardt et al. [27] described the theory of stochastic optimization and discussed several characteristic applications in the power industry, such as short-term unit commitment, middle-term portfolio optimization, long-term investment planning and emission trading. Based on Zhang et al. [3], Zhang et al. [28] proposed a multi-period levelized optimization model for optimal planning of China’s power sector considering uncertain parameters including power demand, fuel price, and carbon policy. Koltsaklis et al. [29] presented an optimization-based approach to address the generation expansion planning problem of a large-scale, central power system in a highly uncertain and volatile electricity industry environment.
However, none of the literature studied detail carbon mitigation technologies implemented in power plants practicability. Additionally, very few studies took power demand uncertainty into consideration. Taking Shenzhen as an example, this aim of paper is to propose a stochastic optimization model incorporating power demand uncertainty to plan the carbon mitigation path of power sector between 2015 and 2030. Located in the south of Guangdong Province, Shenzhen is one of the special economic zones in China, and its economy is developing rapidly. Its GDP has reached to 1.75 trillion yuan in 2015, of which the tertiary industry contributes the most, up to 58.8% [30]. As a result, power demand took up the largest proportion of final energy demand, accounting for 59.9% of Shenzhen’s total energy consumption [30]. In China-US Joint Presidential Statement on Climate Change signed in September 2015, Shenzhen has set the goal of reaching the CO2 peak in 2022 [31]. To achieve the goal of energy-saving and emission reduction in Shenzhen, the key is to reduce the carbon emissions in the power sector. The practice of carbon mitigation measures in the power sector in Shenzhen can set a good example for other cities. The remainder of this paper is organized as follows: Section 2 demonstrates the model and data; Section 3 presents results and discussion; and Section 4 shows main conclusions of this paper and prospects.
2. Materials and Methods
2.1. Model Structure and Assumptions
The illustrative structure of the power sector stochastic optimization model for Shenzhen is shown in Figure 1, which includes three parts: the objective function, decision variables and constraints. The objective function is minimizing the total costs during planning period, including capital costs of newly constructed power plants, capital costs for retrofitting, operation and maintenance (O and M) costs, fuel costs and external power costs. Decision variables include the popularization rates of all types of carbon mitigation technologies and the decision of constructing new power plants and decommissioning coal-fired power plant early. Constraints include carbon mitigation constraints, power demand constraints, installed capacity constraints, fuel supply constraints, and non-negative constraints.
Based on the specific condition of Shenzhen, the proposed model considers five types of power generation plants, as is shown in Table 1. The coal-fired power plant can implement retrofitting of nine carbon mitigation technologies and can be decommissioned early in order to reduce carbon emission. The gas-fired power plant can implement retrofitting of four carbon mitigation technologies and can construct a new plant to increase the proportion of clean energy power. These technologies can help power plants to improve their efficiency of electricity generation, thus reducing energy consumption per generated electricity and consequently reduce CO2 emissions in the power sector. There are one coal-fired power plant and seven gas-fired power plants, affiliated with Shenzhen Energy Corporation and a few other corporations, so it is convenient to implement each carbon mitigation technology at once. Although CCS is regarded as effective way to reduce CO2 emission in the power sector, its high cost and difficulty in technology application make it unsuitable for carbon mitigation in a short period [32].
2.2. Mathematical Formulation
The objective function of this model is to minimize the accumulated costs of power sector during the planning horizon, as is shown in Equation (1). The physical meaning of each variable in the model is shown in Table 2:
Total capital costs of newly-constructed power plants contain capital costs of the newly-constructed gas-fired power plants, the newly-constructed distributed photovoltaic power plants, the newly-constructed waste-to-energy power plants and the newly-constructed CCHPs, as is shown in Equation (2):
Total capital costs for implementing carbon mitigation technologies contain capital costs for carbon mitigation retrofits of existing coal-fired and gas-fired power plants, as is shown in Equation (3):
Total O and M costs contain costs invested in operating and maintaining all types of power plants, as is shown in Equation (4):
Total fuel costs contain costs of all types of fuel consumed by power plants in the generation process, as is shown in Equation (5):
where refers to total costs of external power in year t.
The constraints are listed as follows:
- (1)
- Carbon mitigation constraints. Equation (8) means that the total amount of carbon mitigation of each technology should be greater than the planned amount of carbon emission :
- (2)
- Power demand constraints. The amount of power generated by all types of power plants each year should meet the power demand :Power demand is uncertain in the future because it is affected by many factors, such as economic growth rate and economic structure. Set the stochastic volatility of power demand is , then the power demand constraints can be expressed as:As for stochastic volatility , decision-makers need to make decisions before observing the changing value. This is called chance constrained programming, which assumes that some values in the variable are acceptable if they exceed a certain probability:where α is the confidence level that fulfills Equation (9).
- (3)
- Installed capacity constraints. Equation (10) means that the installed capacities of each type of power plant should be limited to the upper bound :
- (4)
- Fuel supply constraints. Equation (11) means that the supply of each type of fuel should be limited to the upper bound :
- (5)
- Non-negative constraints. The popularization rate of each type of technology should be set as a non-negative variable, as is shown in Equation (12). The retrofits of coal-fired and gas-fired power plants can be implemented at once, so the popularization rates of these technologies are 0 or 100% (Equation (13)):
2.3. Data Sources
The carbon mitigation technologies implemented by power plants are obtained from literature and field research. Firstly, we studied Promotional Catalogues of National Key Energy-saving and Low-carbon Technologies (2016, energy-saving) [33] published by the National Development and Reform Commission and Guiding Catalogues of National Key Industries’ Cleaner Production Technology [34] published by the National Development and Reform Commission to collect technologies that can be implemented in Shenzhen’s power sector. Then, we investigated all power plants in Shenzhen, and consulted the feasibility and practicability of each collected technology. Finally, we consulted relevant experts and made amendments of these technologies.
The original data of Shenzhen’s power sector, including the installed capacity, annual operating hours, fuel consumption, power generation, and carbon emissions were obtained from field research in Shenzhen’s power plants (including one coal-fired power plant, seven gas-fired power plants, and five waste-to-energy power plants).
The planned amount of carbon mitigation is calculated according to the 13th Five-Year Energy Plan [35] and the 13th Five-Year Renewable Energy Plan [36] published by National Energy Administration, Long-term Planning of Low Carbon Development in Shenzhen (2011–2020) [37] published by Development and Reform Commission of Shenzhen Municipality, as well as the original carbon emission data of Shenzhen. The power demand in Shenzhen is estimated using a bottom-up approach. Power demand can be divided into power demand of first industry, second industry, tertiary industry and residence. We estimated power demand of four sub-sections each year using method of electric elasticity coefficient and then added them as the whole power demand. The upper bounds of installed capacity of all types of power plants are calculated according to the original data of population and consumption in Shenzhen [30].
3. Results and Discussion
Based on the model and data presented in Section 2, the optimal carbon mitigation path of Shenzhen’s power sector under demand uncertainty is obtained.
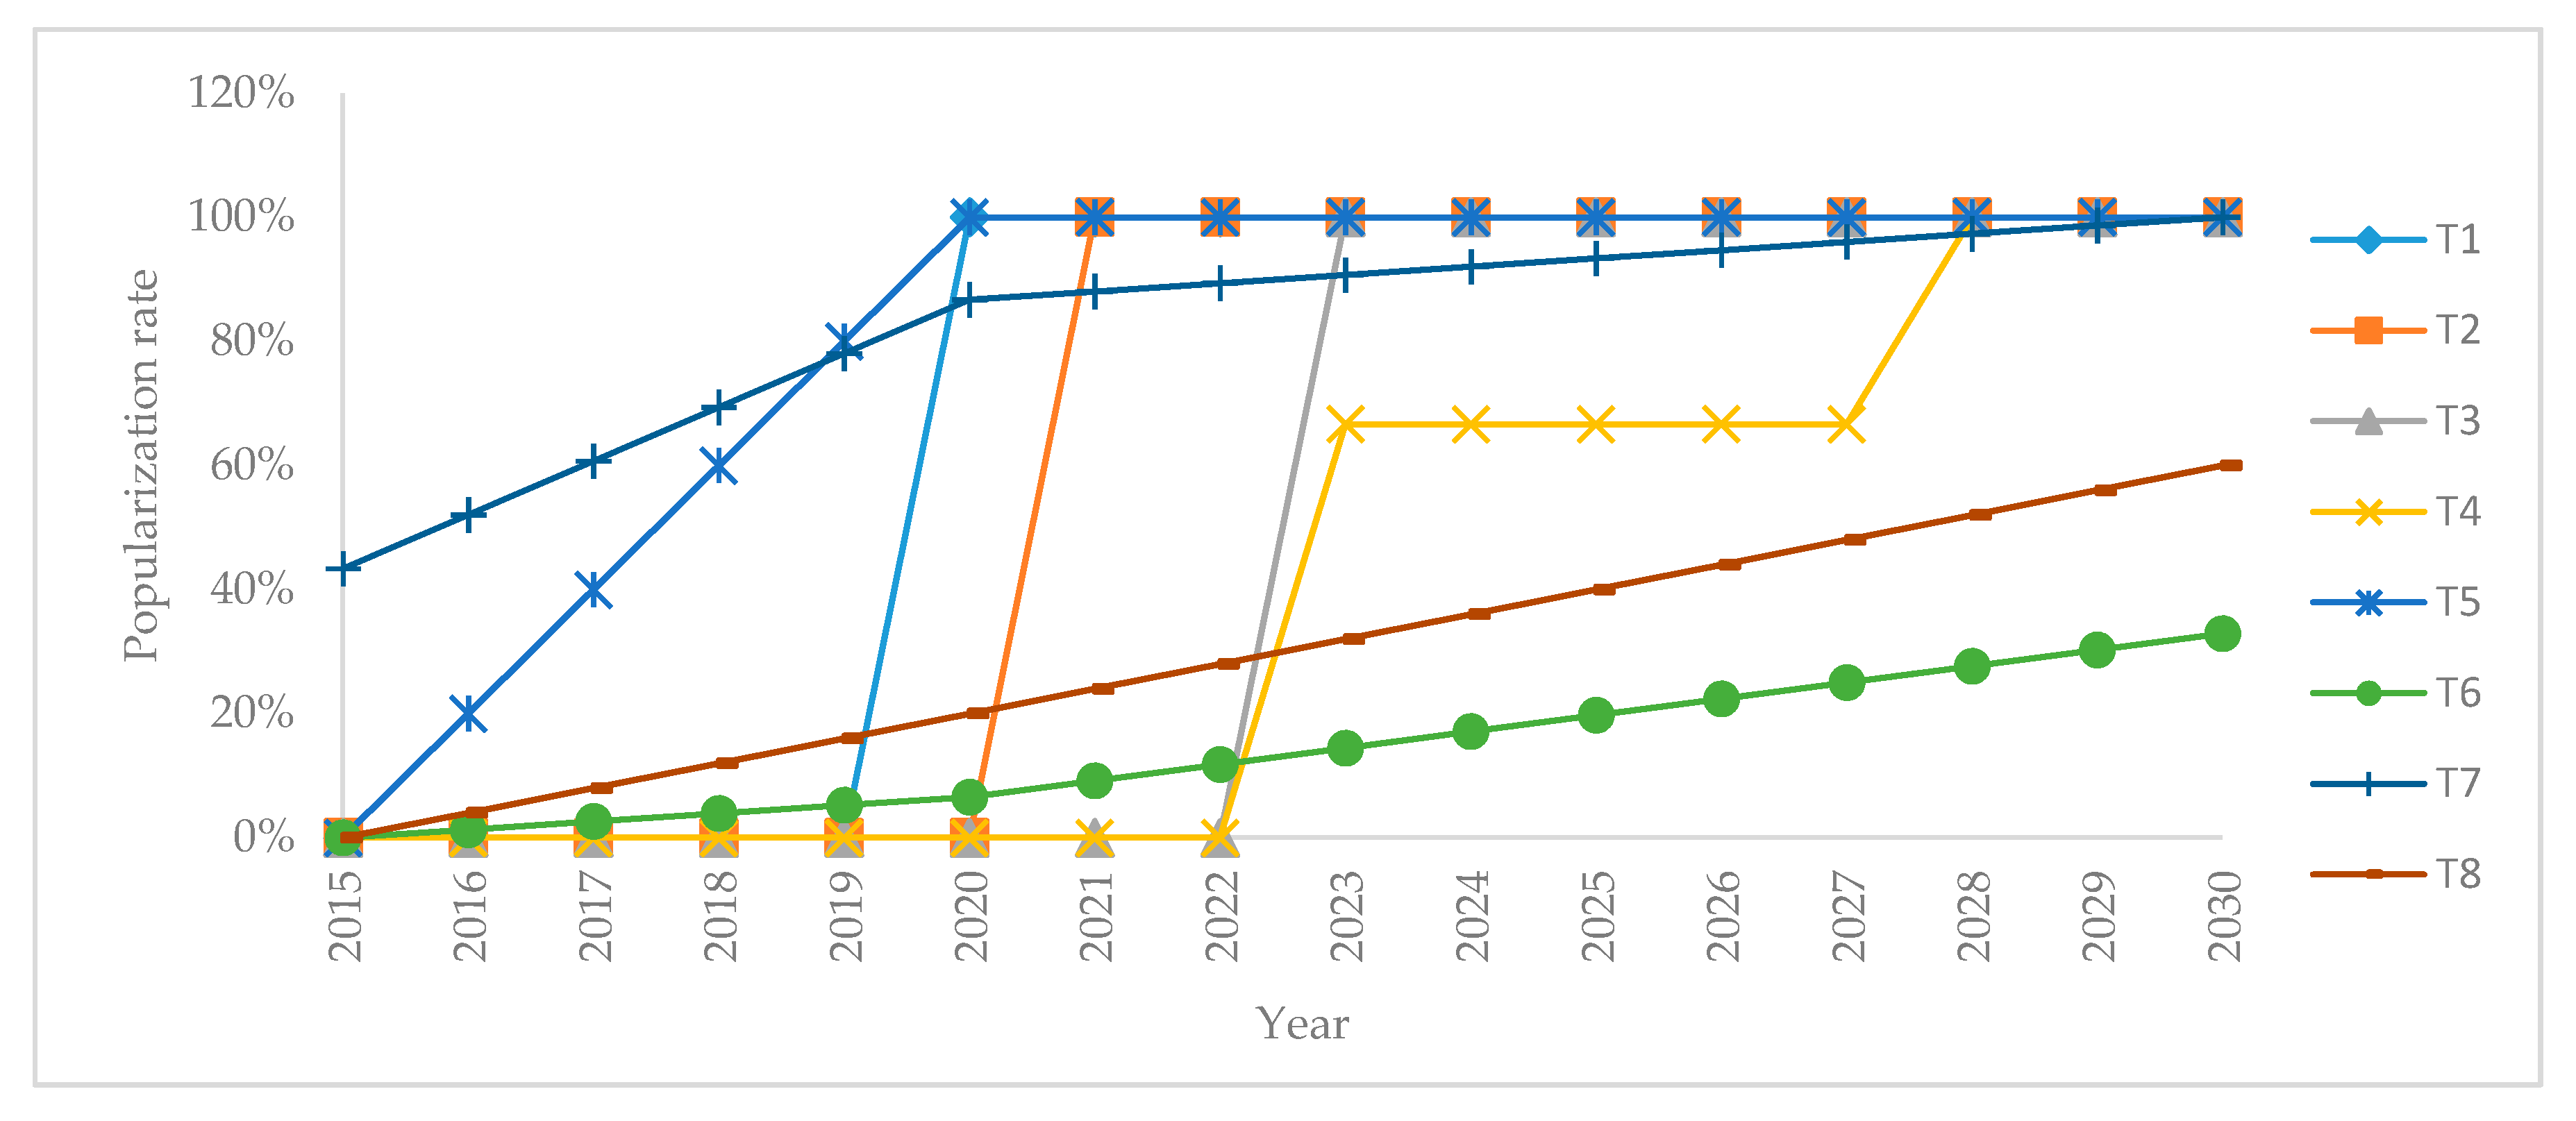
Figure 2 shows the popularization rate of each mitigation technology in Shenzhen’s power sector during the period between 2015 and 2030. Since some technologies have the same popularization rates, the technologies (denoted by i) have been integrated into eight sub-sets (denoted by T). Sub-set T1 includes i2, i11, i12, i13 and i14; T2 includes i1, i4, i5 and i6; T3 includes i3, i7, i8 and i9; T4 refers to i10; T5 refers to i15; T6 refers to i16; T7 refers to i17; and T8 refers to i18. The reason why different technologies have same popularization rates is mainly because their costs, investments and carbon mitigation efficiencies are pretty similar. As is shown in Figure 2, the technologies contained in subset T1 will be implemented in 2020, while those contained in subsets T2 and T3 will be implemented in 2021 and 2023, respectively. This is because the costs of implementing carbon mitigation technologies of T1 are relatively lower than others, while the carbon efficiencies are better than others. Distributed photovoltaic power (T6) is one kind of solar power, which is mainly used by companies and households. Distributed photovoltaic power plants do not generate carbon emission directly, so it is very significant for carbon mitigation in the power sector of Shenzhen. Due to the high cost of raw material and land, the total costs to build and operate distributed photovoltaic power plants are very high, which constrains the expansion of distributed photovoltaic power plants. Thus, the popularization rates of T6 increases from 0% in 2015 to only 27.63% in 2030. To improve the utilization of waste, the Shenzhen government has subsidized waste-to-energy power plants (T7), so the popularization rate is high during the planning horizon, from 43.35% in 2015 to 97.34% in 2030. On the one hand, the carbon emission factor in the coal-fired power plant is higher than external power, so it is reasonable to decommission the coal-fired power early and import more power from the Southern Power Grid. On the other hand, the power price of coal-fired power is lower than external power. Comprehensive consideration, including costs, emissions, and the lifespan of generator sets, should be taken before making decisions. Gas-fired power, distributed photovoltaic power, waste-to-energy power and CCHP have lower carbon emission factors than external power, so it is suitable to expand their capacities instead of importing power.
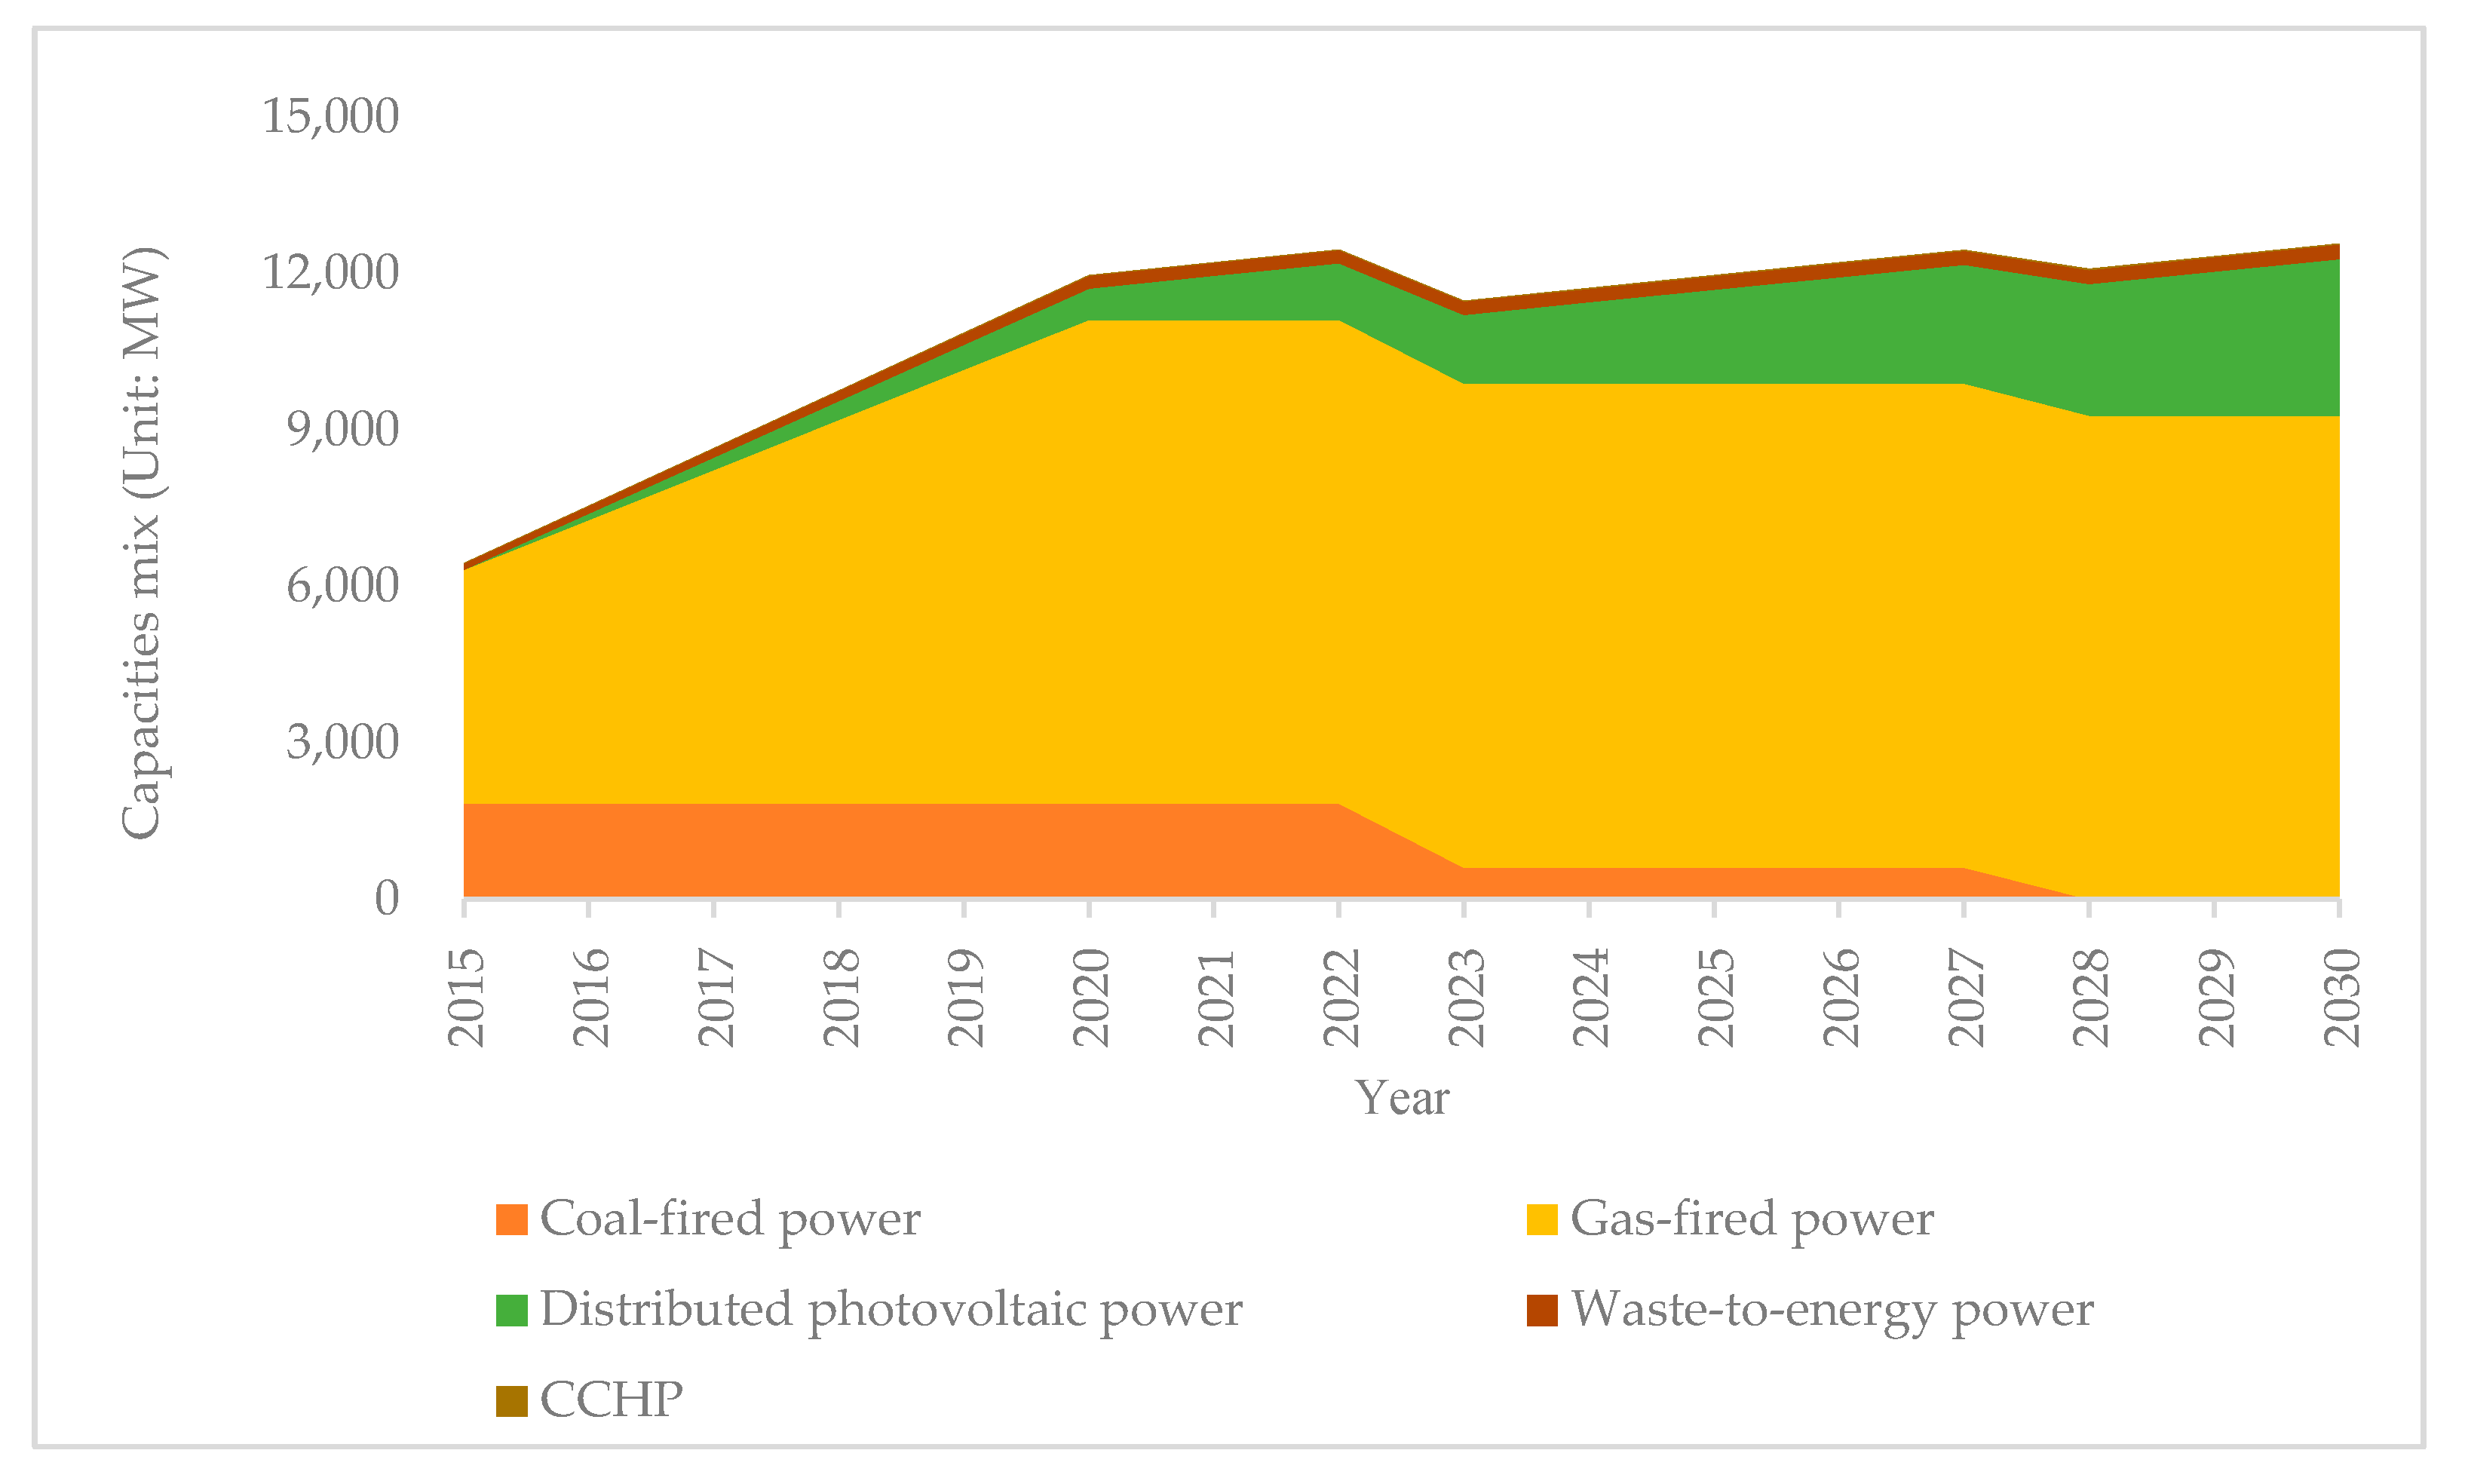
According to the popularization rates demonstrated above, installed generation capacities of all types of power plants are obtained. As is shown in Figure 3, the installed capacity of gas-fired power plants occupies the largest proportion of total capacity in the Shenzhen power sector. The installed capacities are increasing from 4481 MW (megawatt) in 2015 to 9281 MW in 2030, and the proportion increases from 69.55% to 73.78%. Due to the strict requirement of building gas-fired power plant, there is no more areas that are suitable for building new gas-fired power plants. To increase the capacity in the future, the existing gas-fired power plant will expand their scales. As two-thirds and one-third of the coal-fired power plant capacities are decommissioned in 2023 and 2028, respectively, the total capacities are decreased in the corresponding years. CCHP is applied to buildings that need cooling, heating and power all day, such as hospitals and hotels. The building areas suitable for CCHP in Shenzhen are limited, so the installed capacity of CCHP is quite low. The installed capacities of waste-to-energy power plants are increasing steadily, from 122 MW in 2015 to 281 MW in 2030. The popularization rate of distributed photovoltaic power is from 0 to 32.89%, leading to generation capacity rising from 0 MW in 2015 to 3000 MW in 2030.
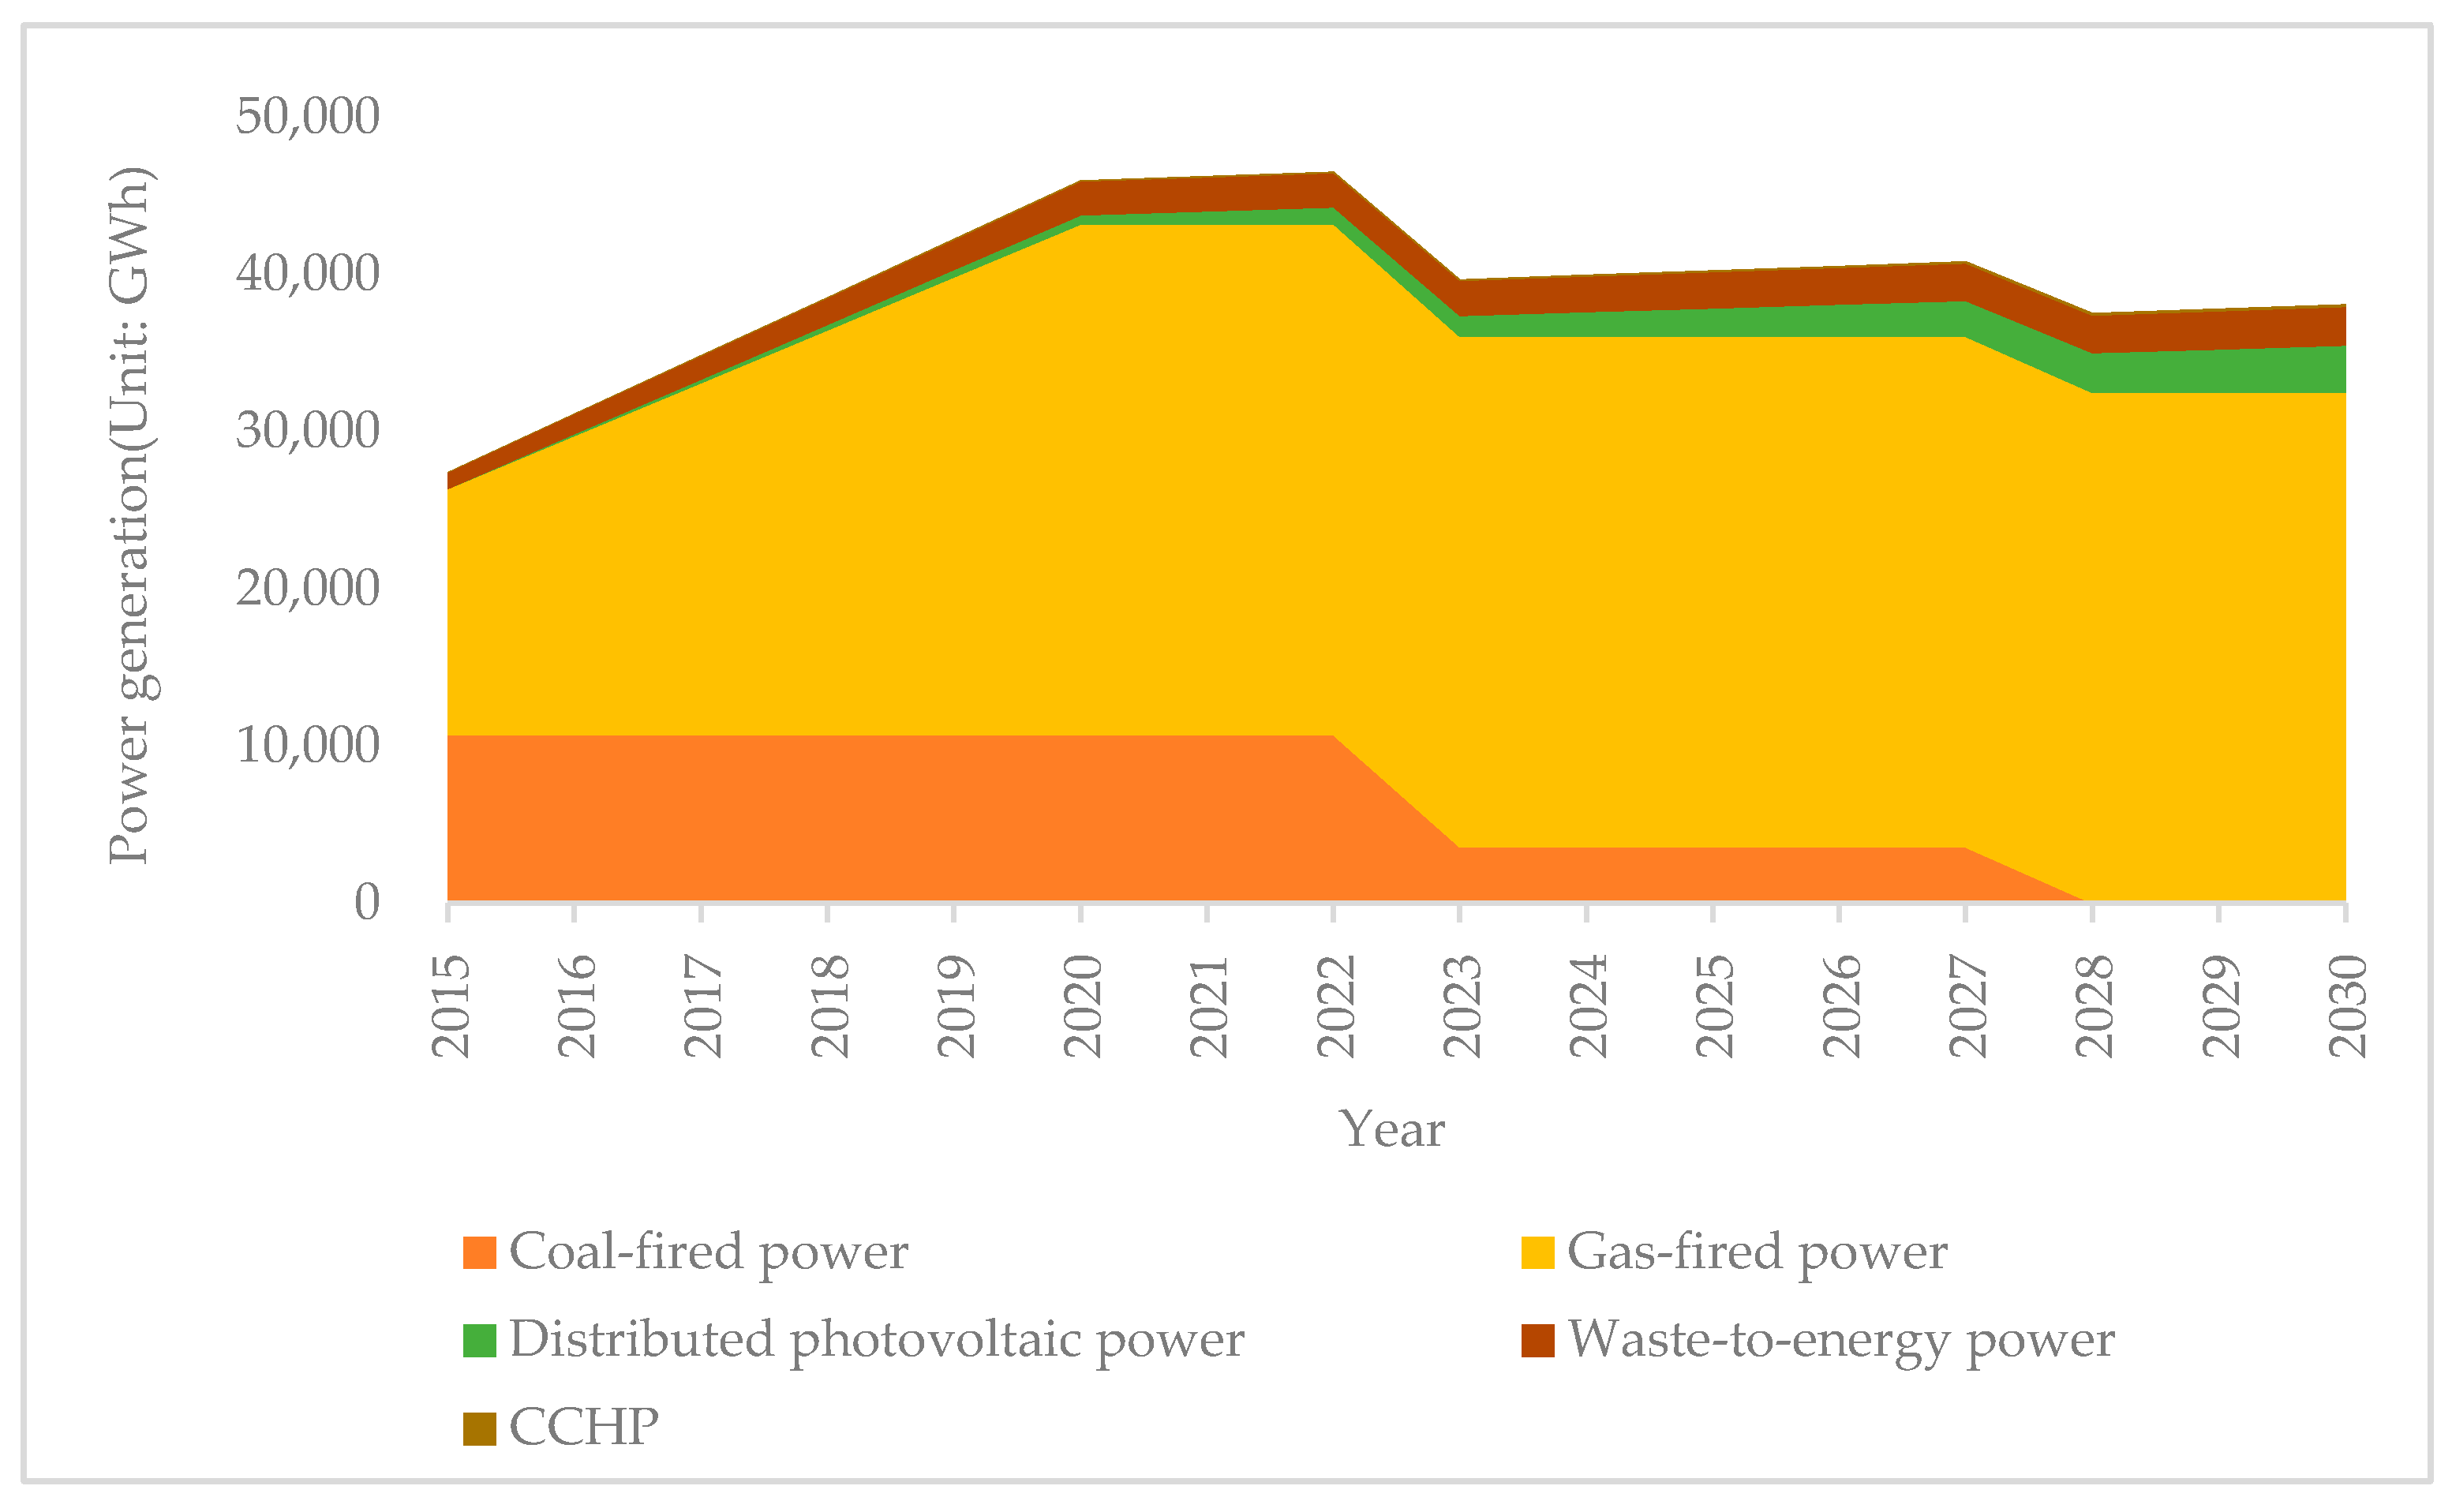
The power generation composition of each type of power plant in Shenzhen from 2015 to 2030 is shown in Figure 4. We can see that the total power generation is increasing firstly, then decreasing in 2022, and remaining steady after this. This is mainly because two-thirds of the coal-fired power plant capacity will be decommissioned in 2022; thus, the generation capacity and power generation will be decreasing quickly. The gas-fired power plant provides the maximum power generation during the planning horizon, and it is increasing rapidly, from 15,684 GWh (gigawatt hour) in 2015 to 32,484 GWh in 2030, with the proportion of total power generation from 57.15% to 85.25%. The installed capacity of distributed photovoltaic power arises from 0 in 2015 to 3000 MW in 2030, accounting for 0% to 23.85% of total capacity, respectively, while the proportion of its power generation to total generation is much less (0% and 7.87%, respectively). This is mainly because distributed photovoltaic power is highly affected by the weather and can only work during the sunny days, so the annual power generation hours are much lower than other power plants.
From Table 3, we can see that the total costs spent in the local optimization of the Shenzhen power sector during the planning horizon are 29.29 billion yuan. Among the total costs spent, new gas-fired power gets the highest costs, 18.67 billion yuan, followed by distributed photovoltaic power and waste-to-energy power, 8.24 billion yuan and 1.67 billion yuan, respectively. Most of the mitigation technologies have negative costs. This is because implementing these technologies can save fuels, thus reducing fuel costs.
During the planning horizon, there are 36.20 Mt CO2 emissions in the Shenzhen power sector. Corresponding with its total costs, the amount of carbon emission of new gas-fired power, 23.28 Mt CO2, accounts for the maximum part of the total carbon emission (64.31%). Compared with its high proportion of total costs (28.15%), distributed photovoltaic power generates much less carbon emission, only 1.25 Mt CO2 (3.46%). This means that building distributed photovoltaic power plants can reduce carbon emission effectively. Nine carbon mitigation technologies implemented in coal-fired power plant lead to the decline of carbon emissions of up to 0.33 Mt CO2, while four carbon mitigation technologies implemented in gas-fired power plants lead to the decline of carbon emissions of up to 0.39 Mt CO2. Therefore, the amount of carbon mitigation caused by these technologies are quite small, which is mainly because the existing coal-fired and gas-fired power plants have clean power generation technologies, so the potential to reduce carbon emissions by carbon mitigation technologies is small.
4. Conclusions
This paper proposed a stochastic optimization model incorporating power demand uncertainty to plan the carbon mitigation path of power sector. Based on this framework, we proposed an optimal carbon mitigation path under power demand uncertainty in the Shenzhen power sector from 2015 to 2030. The results are as follows:
- (1)
- The carbon mitigation technologies of existing coal-fired and gas-fired power plants will be 100% implemented in different years. Two-thirds and the remaining one-third capacity of the coal-fired power plants are going to be decommissioned in 2023 and 2028, respectively. Gas-fired power, distributed photovoltaic power, waste-to-energy power, and CCHP are going to expand their capacities gradually.
- (2)
- The installed capacity and power generation of each type of plant are changing according to their popularization rate. The installed capacity and power generation of the coal-fired power plant are decreasing, while those of other plants are increasing. The gas-fired power plants has the largest installed capacity, increasing from 69.55% to 73.78%.
- (3)
- The total costs spent in the local optimization of the Shenzhen power sector during the planning horizon are 29.29 billion yuan, and the total carbon emission is 36.20 Mt CO2. New gas-fired power has the highest costs as well as the carbon emission.
However, in this paper, we only consider the power demand to be a stochastic variable. In fact, there are some other variables that are affected by many factors and cannot be estimated precisely in the future, such as fuel price, construction investment, carbon mitigation policies, etc. In future studies, more stochastic variables need to be considered in order to obtain a more optimal carbon mitigation path.
Acknowledgments
All sources of funding of the study should be disclosed. Please clearly indicate grants that you have received in support of your research work. Clearly state if you received funds for covering the costs to publish in open access.
Author Contributions
All authors contributed extensively to the work presented in this paper. Guangxiao Hu and Xiaoming Ma conceived and designed the topic and method; Guangxiao Hu and Junping Ji collected and analyzed the data; and Guangxiao Hu wrote the paper.
Conflicts of Interest
The authors declare no conflict of interest.
References
- United Nations, Paris Agreement. Available online: https://unfccc.int/files/essential_background/convention/application/pdf/english_paris_agreement.pdf (accessed on 5 October 2016).
- State Grid Energy Research Institute, China Power Industry and Carbon Trading Research in 2014. Available online: http://www.doc88.com/p-6681817055456.html (accessed on 22 December 2014).
- Zhang, D.J.; Liu, P.; Ma, L.W.; Li, Z.; Ni, W.D. A multi-period modelling and optimization approach to the planning of China’s power sector with consideration of carbon dioxide mitigation. Comput. Chem. Eng. 2012, 37, 227–247. [Google Scholar] [CrossRef]
- Beér, J.M. High efficiency electric power generation: The environmental role. Prog. Energ. Combust. 2007, 33, 107–134. [Google Scholar] [CrossRef]
- Liu, T.; Xu, G.; Cai, P.; Tian, L.H.; Huang, Q.L. Development forecast of renewable energy power generation in China and its influence on the GHG control strategy of the country. Renew. Energ. 2011, 36, 1284–1292. [Google Scholar] [CrossRef]
- Jin, S.H.; Bai, L.; Kim, J.Y.; Jeong, S.J.; Kim, K.S. Analysis of GHG emission reduction in South Korea using a CO2 transportation network optimization model. Energies 2017, 10, 1027. [Google Scholar] [CrossRef]
- Yoro, K.O.; Sekoai, P.T. The potential of CO2 capture and storage technology in South Africa’s coal-fired thermal power plants. Environments 2016, 3, 24. [Google Scholar] [CrossRef]
- Mesarić, P.; Đukec, D.; Krajcar, S. Exploring the potential of energy consumers in smart grid using focus group methodology. Sustainability 2017, 9, 1463. [Google Scholar] [CrossRef]
- Siano, P. Demand response and smart grids—A survey. Renew. Sustain. Energy Rev. 2014, 30, 461–478. [Google Scholar] [CrossRef]
- Shi, J.Q.; Wang, Y.R.; Fu, R.B.; Zhang, J.H. Operating strategy for local-area energy systems integration considering uncertainty of supply-side and demand-side under conditional value-at-risk assessment. Sustainability 2017, 9, 1655. [Google Scholar] [CrossRef]
- Ye, M.H.; Cai, W.J.; Wang, C. A multi-period multi-region optimization model of China’s power sector considering synergetic CO2 and air pollutants control. Procedia Environ. Sci. 2013, 18, 397–403. [Google Scholar] [CrossRef]
- Cheng, R.; Xu, Z.F.; Liu, P.; Wang, Z.; Li, Z.; Jones, I. A multi-region optimization planning model for China’s power sector. Appl. Energy 2015, 137, 413–426. [Google Scholar] [CrossRef]
- Chen, H.; Tang, B.J.; Liao, H.; Wei, Y.M. A multi-period power generation planning model incorporating the non-carbon external costs: A case study of China. Appl. Energ. 2016, 183, 1333–1345. [Google Scholar] [CrossRef]
- Lee, J.Y. A multi-period optimization model for planning carbon sequestration retrofits in the electricity sector. Appl. Energy 2017, 198, 12–20. [Google Scholar] [CrossRef]
- Rong, A.; Lahdelma, R. CO2 emissions trading planning in combined heat and power production via multi-period stochastic optimization. Eur. J. Oper. Res. 2007, 176, 1874–1895. [Google Scholar] [CrossRef]
- Li, M.W.; Li, Y.P.; Huang, G.H. An interval-fuzzy two-stage stochastic programming model for planning carbon dioxide trading under uncertainty. Energy 2011, 36, 5677–5689. [Google Scholar] [CrossRef]
- Cai, Y.P.; Huang, G.H.; Yang, Z.F.; Tan, Q. Identification of optimal strategies for energy management systems planning under multiple uncertainties. Appl. Energy 2009, 86, 480–495. [Google Scholar] [CrossRef]
- Lin, Q.G.; Huang, G.H. Planning of energy system management and GHG-emission control in the municipality of Beijing—An inexact-dynamic stochastic programming model. Energy Policy 2009, 37, 4463–4473. [Google Scholar] [CrossRef]
- Pei, L.; Pistikopoulos, E.N.; Zheng, L. Decomposition based stochastic programming approach for polygeneration energy systems design under uncertainty. Ind. Eng. Chem. Res. 2010, 49, 3295–3305. [Google Scholar] [CrossRef]
- Chen, W.T.; Li, Y.P.; Huang, G.H.; Chen, X.; Li, Y.F. A two-stage inexact-stochastic programming model for planning carbon dioxide emission trading under uncertainty. Appl. Energy 2010, 87, 1033–1047. [Google Scholar] [CrossRef]
- Xie, Y.L.; Li, Y.P.; Huang, G.H.; Li, Y.F. An interval fixed-mix stochastic programming method for greenhouse gas mitigation in energy systems under uncertainty. Energy 2010, 35, 4627–4644. [Google Scholar] [CrossRef]
- Li, Y.P.; Huang, G.H.; Chen, X. Planning regional energy system in association with greenhouse gas mitigation under uncertainty. Appl. Energy 2011, 88, 599–611. [Google Scholar] [CrossRef]
- Khayyam, H.; Naebe, M.; Bab-Hadiashar, A.; Jamshidi, F.; Li, Q.; Atkiss, S.; Buckmaster, D.; Fox, B. Stochastic optimization models for energy management in carbonization process of carbon fiber production. Appl. Energy 2015, 158, 643–655. [Google Scholar] [CrossRef]
- Han, J.H.; Lee, I.B. Two-stage stochastic programming model for planning CO2 utilization and disposal infrastructure considering the uncertainty in the CO2 emission. Ind. Eng. Chem. Res. 2011, 50, 13435–13443. [Google Scholar] [CrossRef]
- Han, J.H.; Lee, I.B. Multiperiod stochastic optimization model for carbon capture and storage infrastructure under uncertainty in CO2 emissions, product prices, and operating costs. Ind. Eng. Chem. Res. 2012, 51, 11445–11457. [Google Scholar] [CrossRef]
- Hu, M.Q.; Cho, H.J. A probability constrained multi-objective optimization model for CCHP system operation decision support. Appl. Energy 2014, 116, 230–242. [Google Scholar] [CrossRef]
- Spangardt, G.; Lucht, M.; Handschin, E. Applications for stochastic optimization in the power industry. Electr. Eng. 2006, 88, 177–182. [Google Scholar] [CrossRef]
- Zhang, D.J.; Liu, P.; Ma, L.W.; Li, Z. A multi-period optimization model for optimal planning of China’s power sector with consideration of carbon mitigation—The optimal pathway under uncertain parametric conditions. Comput. Chem. Eng. 2013, 50, 196–206. [Google Scholar] [CrossRef]
- Koltsaklis, N.E.; Liu, P.; Georgiadis, M.C. An integrated stochastic multi-regional long-term energy planning model incorporating autonomous power systems and demand response. Energy 2015, 82, 865–888. [Google Scholar] [CrossRef]
- Shenzhen Government Online, Shenzhen Statistical Yearbook 2016. Available online: http://www.sz.gov.cn/cn/xxgk/zfxxgj/tjsj/tjnj/201701/W020170120506125327799.pdf (accessed on 20 January 2017).
- National Development and Reform Commission, China-US Joint Presidential Statement on Climate Change. Available online: http://www.ndrc.gov.cn/gzdt/201509/W020150922344556917878.pdf (accessed on 16 September 2015).
- Selosse, S.; Ricci, O. Carbon capture and storage: Lessons from a storage potential and localization analysis. Appl. Energy 2017, 188, 32–44. [Google Scholar] [CrossRef]
- National Development and Reform Commission, Promotional Catalogues of National Key Energy-Saving and Low-Carbon Technologies (2016, Energy-Saving). Available online: http://www.ndrc.gov.cn/gzdt/201701/t20170119_835583.html (accessed on 30 December 2016).
- Ministry of Environmental Protection of the People’s Republic of China. Guiding Catalogues of National Key Industries’ Cleaner Production Technology. Available online: http://www.mep.gov.cn/gkml/hbb/gwy/200910/t20091030_180702.htm (accessed on 27 February 2003).
- National Development and Reform Commission. The 13th Five-Year Energy Plan. Available online: http://www.ndrc.gov.cn/zcfb/zcfbtz/201701/W020170117335278192779.pdf (accessed on 26 December 2016).
- National Development and Reform Commission. The 13th Five-Year Renewable Energy Plan. Available online: http://www.ndrc.gov.cn/zcfb/zcfbtz/201612/W020161216659579206185.pdf (accessed on 10 December 2016).
- Development and Reform Commission of Shnzhen Municipality. Long-Term Planning of Low Carbon Development in Shenzhen (2011–2020). Available online: http://www.szpb.gov.cn/wx/wx_dtxx/fgzl_wx/zxgh/201310/t20131016_2223234.htm (accessed on 16 October 2013).
Figure 1.
An illustrative structure of the model.
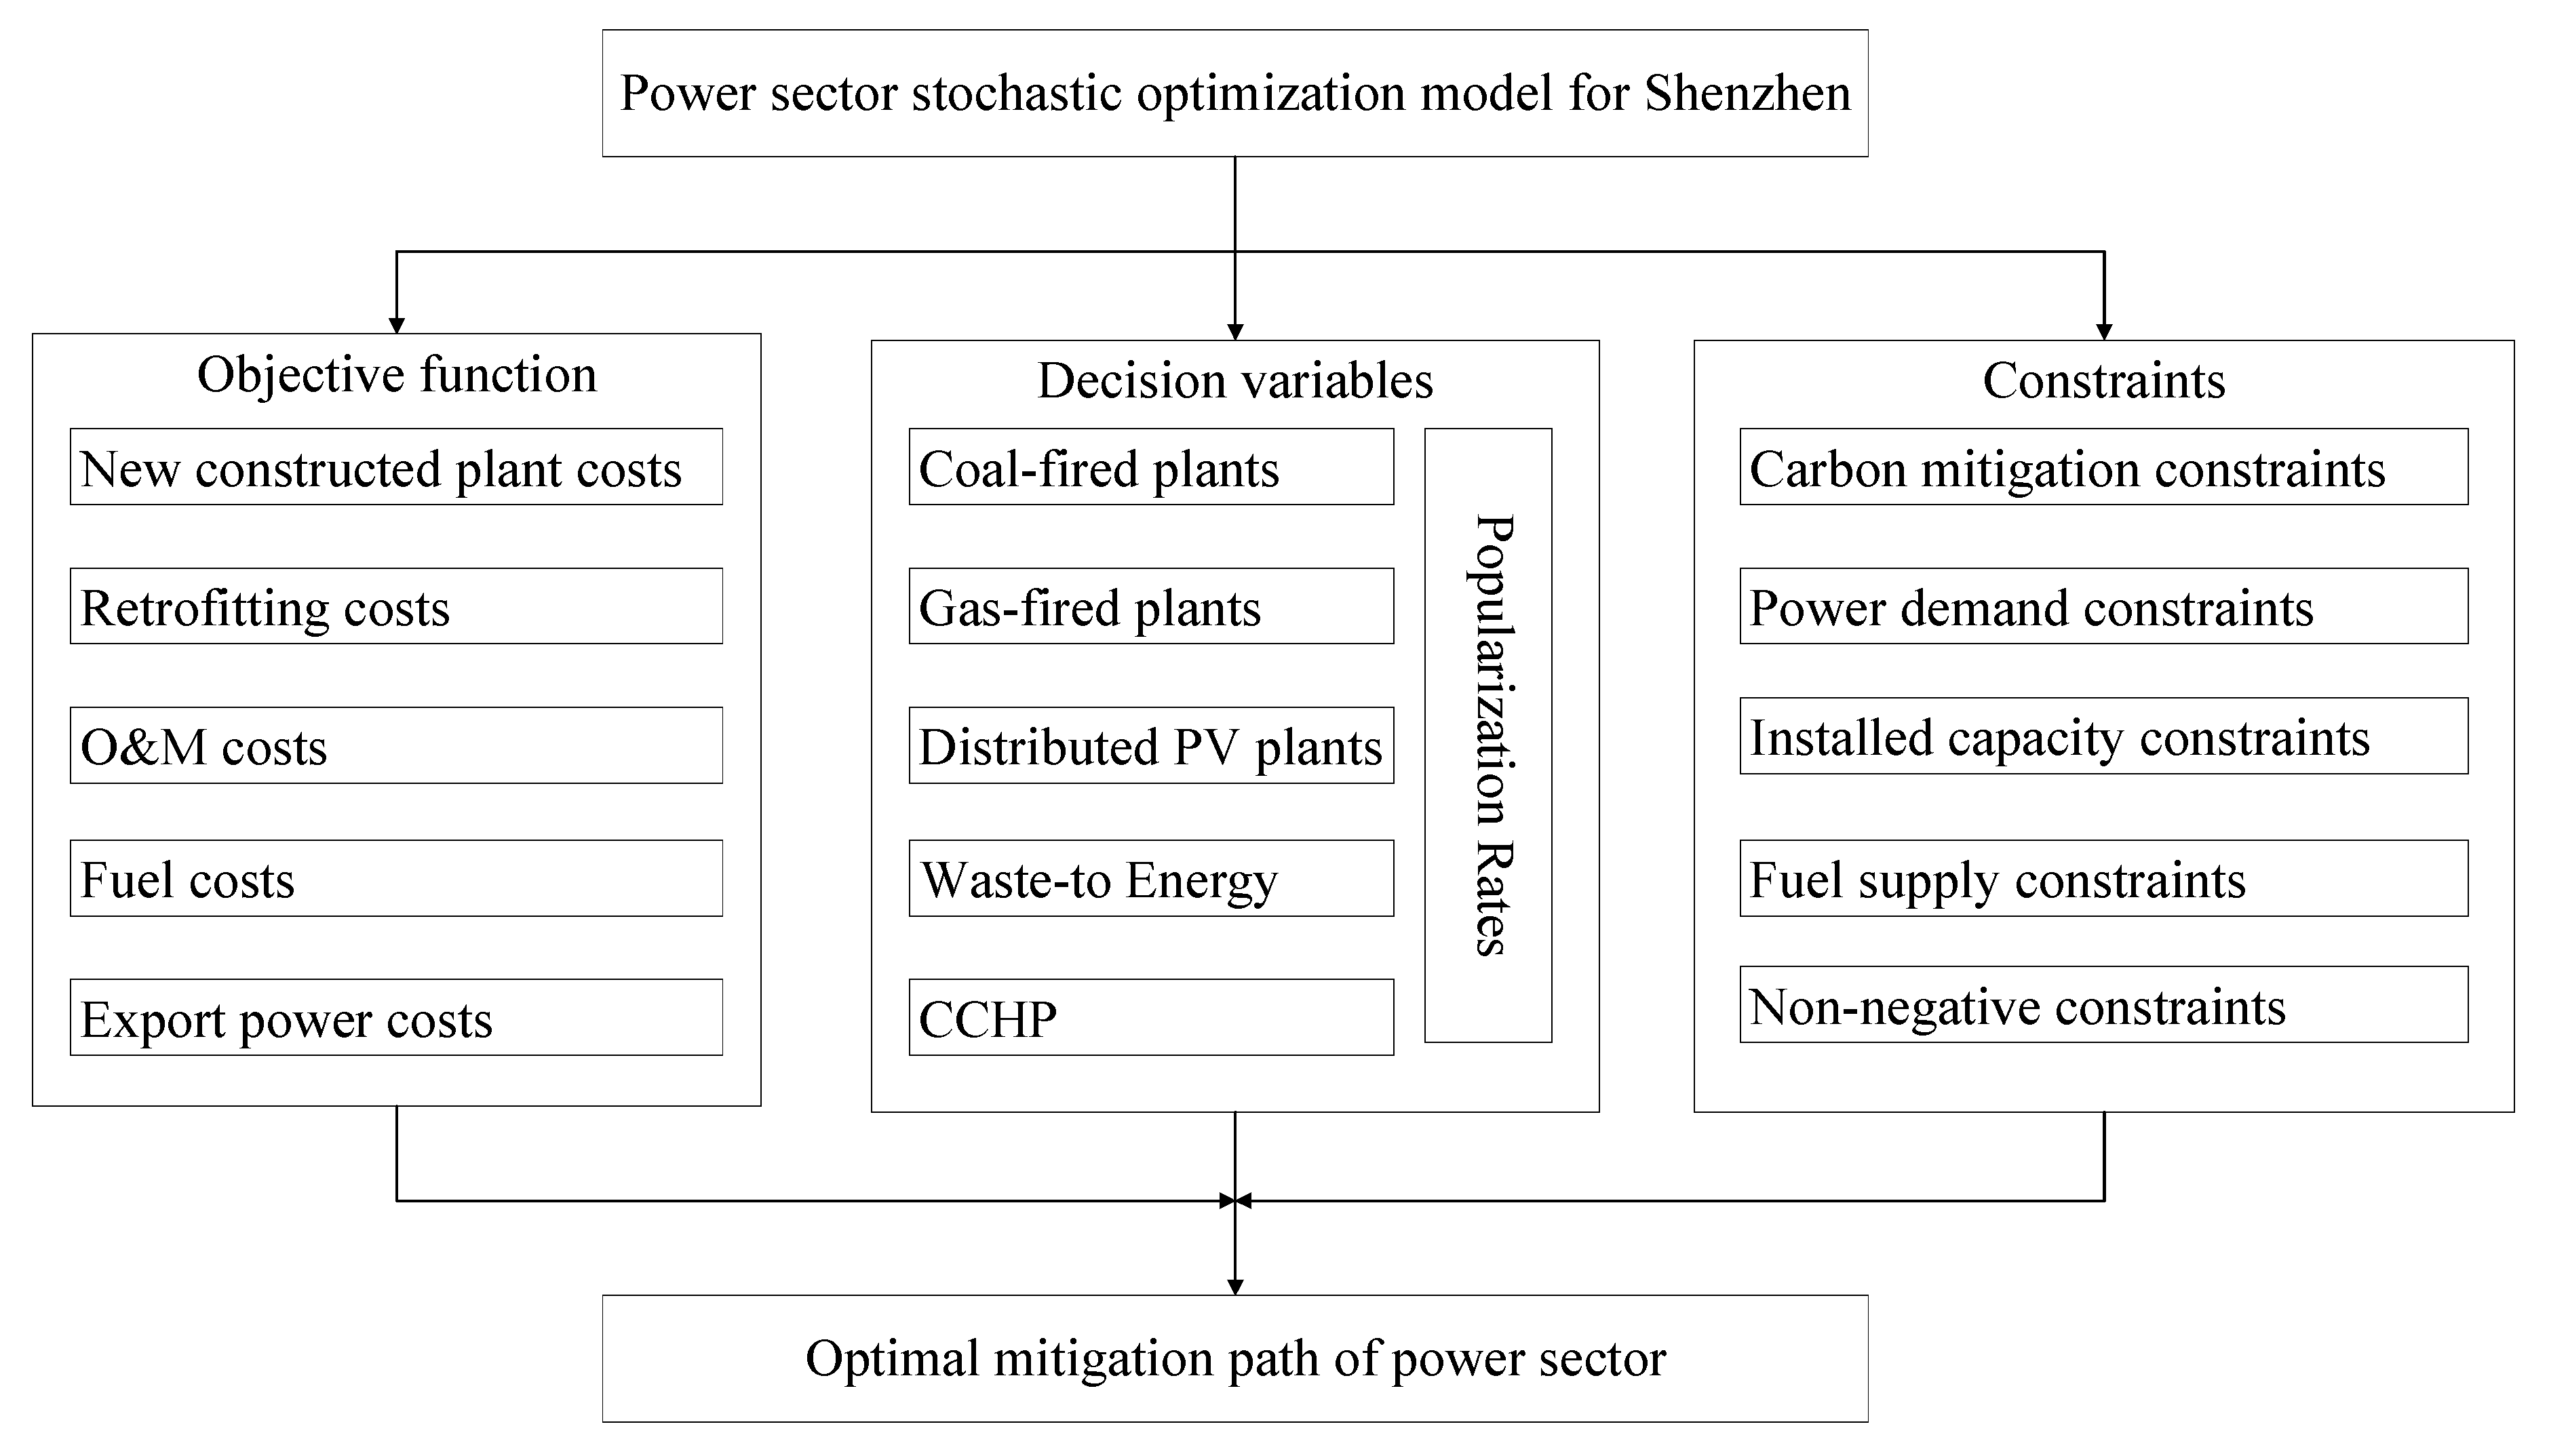
Figure 2.
Popularization rate of each technology during the planning horizon.

Figure 3.
Installed generation capacities mix during the planning horizon.

Figure 4.
Power generation composition during the planning horizon.

Table 1.
Power plant types and carbon mitigation technologies considered in the model.
| Plant Types | Symbol | Carbon Mitigation Types |
|---|---|---|
| Coal-fired power | i1 | Boiler intelligent blowing optimization |
| i2 | Gas ignition system | |
| i3 | Retrofitting of boiler air preheater | |
| i4 | Steam seal modification for steam turbine | |
| i5 | Condenser energy saving system | |
| i6 | Retrofit of steam turbine flow passage | |
| i7 | Generation capacity enlargement | |
| i8 | High voltage variable frequency speed | |
| i9 | High-efficiency motor replacement | |
| i10 | Coal-fired power decommissions early | |
| Gas-fired power | i11 | Increasing the heating surface of the boiler |
| i12 | Retrofitting of condensing steam turbine | |
| i13 | Waste heat utilization of gas turbine rotor | |
| i14 | inlet air cooling of gas turbine | |
| i15 | New Gas-fired power | |
| Solar power | i16 | Distributed photovoltaic power |
| Waste-to-energy | i17 | Waste-to-energy power |
| CCHP | i18 | CCHP |
Table 2.
Physical meanings of the variables in the model.
| Symbol | Physical Meaning |
|---|---|
| k | Power plant type () |
| t | Year |
| i | Carbon mitigation technology type () |
| f | Fuel type |
| The popularization of carbon mitigation technology i (%) | |
| The popularization of carbon mitigation technology implemented in power plant k (%) | |
| I | Discount rate (%) |
| Stochastic volatility | |
| Total capital costs of newly constructed power plants in year t | |
| Total capital costs of newly constructed power plant k in year t | |
| Total capital costs for implement carbon mitigation technologies in year t | |
| Total capital costs of power plant k for implement carbon mitigation technology i in year t | |
| Total operation and maintenance costs in year t | |
| Total operation and maintenance coat of power plant k in year t | |
| Costs of fuel f in year t | |
| Costs of fuel f in year t | |
| Price of fuel f in year t | |
| Demand for fuel f of power plant k in year t | |
| Total costs of export power in year t | |
| Installed capacity that can implement technology i in year t | |
| The annual saved amount of fuel j after implementing technology i | |
| Carbon emission factor of fuel f | |
| The planned amount of carbon mitigation in year t | |
| The installed capacity of power plant k in year t | |
| Annual operational hours of power plant k | |
| The maximum installed capacities of newly constructed power plant k in year t | |
| The maximum installed capacities of newly constructed power plant k | |
| Power demand in power sector in year t | |
| Export power supply | |
| The upper limit of installed capacity of power plant k | |
| The upper limit of fuel f supply in year t | |
| The probability of event A |
Table 3.
Total costs and carbon emissions in the Shenzhen power sector.
| Technology | Total Costs (Billion Yuan) | Proportion | Total Carbon Emission (Mt CO2) | Proportion |
|---|---|---|---|---|
| i1 | −0.0031 | −0.01% | −0.0277 | −0.08% |
| i2 | 0.0272 | 0.09% | 0.0228 | 0.06% |
| i3 | 0.0010 | 0.00% | −0.0177 | −0.05% |
| i4 | −0.0005 | 0.00% | −0.0055 | −0.02% |
| i5 | −0.0096 | −0.03% | −0.0998 | −0.28% |
| i6 | −0.0128 | −0.04% | −0.1802 | −0.50% |
| i7 | −0.0005 | 0.00% | −0.0166 | −0.05% |
| i8 | −0.0001 | 0.00% | −0.0026 | −0.01% |
| i9 | 0.0008 | 0.00% | −0.0063 | −0.02% |
| i10 | 0.7902 | 2.70% | 10.1535 | 28.05% |
| i11 | −0.0310 | −0.11% | −0.0529 | −0.15% |
| i12 | −0.1851 | −0.63% | −0.2881 | −0.80% |
| i13 | −0.0179 | −0.06% | −0.0309 | −0.09% |
| i14 | −0.0027 | −0.01% | −0.0158 | −0.04% |
| i15 | 18.6721 | 63.76% | 23.2824 | 64.31% |
| i16 | 8.2442 | 28.15% | 1.2516 | 3.46% |
| i17 | 1.6674 | 5.69% | 2.1611 | 5.97% |
| i18 | 0.1468 | 0.50% | 0.0770 | 0.21% |
| Total | 29.2866 | 100.00% | 36.2042 | 100.00% |
© 2017 by the authors. Licensee MDPI, Basel, Switzerland. This article is an open access article distributed under the terms and conditions of the Creative Commons Attribution (CC BY) license (http://creativecommons.org/licenses/by/4.0/).
Share and Cite
MDPI and ACS Style
Hu, G.; Ma, X.; Ji, J. A Stochastic Optimization Model for Carbon Mitigation Path under Demand Uncertainty of the Power Sector in Shenzhen, China. Sustainability 2017, 9, 1942. https://doi.org/10.3390/su9111942
AMA Style
Hu G, Ma X, Ji J. A Stochastic Optimization Model for Carbon Mitigation Path under Demand Uncertainty of the Power Sector in Shenzhen, China. Sustainability. 2017; 9(11):1942. https://doi.org/10.3390/su9111942
Chicago/Turabian StyleHu, Guangxiao, Xiaoming Ma, and Junping Ji. 2017. "A Stochastic Optimization Model for Carbon Mitigation Path under Demand Uncertainty of the Power Sector in Shenzhen, China" Sustainability 9, no. 11: 1942. https://doi.org/10.3390/su9111942
Note that from the first issue of 2016, this journal uses article numbers instead of page numbers. See further details here.