Sustainability in Chinese Higher Educational Institutions’ Social Science Research: A Performance Interface toward Efficiency

Department of Economics and Management, Southeast University, Nanjing 210096, China
*
Author to whom correspondence should be addressed.
Sustainability 2017, 9(11), 1952; https://doi.org/10.3390/su9111952
Submission received: 18 September 2017
/
Revised: 23 October 2017
/
Accepted: 25 October 2017
/
Published: 26 October 2017
Abstract
:Sustainability issues in higher educational institutions’ (HEIs) research, especially in the social science field, have attracted increasing levels of attention in higher education administration in recent decades as HEIs are confronted with a growing pressure worldwide to increase the efficiency of their research activities under a limited volume and relatively equitable division of public funding resources. This paper introduces a theoretical analysis framework based on a data envelopment analysis, separating the social science research process into a foundation stage and a construction stage, and then projecting each HEI into certain quadrants to form several clusters according to their overall and stage efficiencies and corresponding Malmquist Productivity Indices. Furthermore, the interfaces are formed in each cluster as feasible potential improvement directions. The empirical results in detail are demonstrated from a data set of Chinese HEIs in Jiangsu Province over the Twelfth Five-Year period as offering a closer approximation to the “China social science research best practice”.
1. Introduction
During the past 40 years there have been significant progresses in higher educational institutions (HEIs) as economic and social reforms deepen in China. Sustainable development is a strategic response to these nationwide changes in which HEIs not only increasingly act as the engine of economic and social reforms but also play a crucial role in shaping the competitiveness of countries, and we should promote the sustainability of HEIs through primary teaching and research activities [1] from the view of HEIs’ performance efficiencies. The implementation of the Action Plan for Invigorating Education (http://www.moe.edu.cn/), according to which a considerable amount of public funding has been assigned to HEIs, has raised the relevance of HEIs’ expenditures high in the agenda of public administration; besides this, local and central governments also emphasize education to improve regional attraction in the inner provinces. In recent years, the Ministry of Education of China has allocated funding to projects based on performance criteria in order to improve their research ability and accountability sustainably. This funding system based on performance is known as the base of university research activities, which is used to provide fair and transparent dialogue between governing bodies, funding providers, and HEIs. These abovementioned pragmatic factors stimulate HEIs to manage their resources—such as researchers and public project funding—more effectively to pursue sustainable development.
HEIs, especially the public ones, retain their certain key characteristics—“the lack of profit motive, goal diversity and uncertainty, diffuse decision-making, and poorly understood production technology” [2]. These attributes make it hard to provide an undisputed production function to express an HEI’s research process. In many cases, the immature marketization and incomplete real-time data system of social science research also lead to the basic problems inherent in the definition of a production function or the lack of exact quantitate data. One non-parametric frontier technique developed by Charnes, Cooper [3], called data envelopment analysis (DEA), has become a standard tool for evaluating efficiencies without exact production functions [4]. Previous studies have widely applied DEA to analyze the efficiency of HEIs in different countries or provinces, and can be classified into two broad branches. The first evaluates efficiencies by covering all activities provided by HEIs generally [5,6,7,8,9,10,11,12], whereas the second narrows evaluation down to a particular activity, teaching, or research [13,14,15,16].
This study on research activities concentrates on Jiangsu Province in order to reduce the impacts caused by different regional economic development and education support policies. Moreover, past studies mostly focus on nature science or integrate nature science and social science together with little concern about social science individually. It is therefore very important that this gap should be addressed. This paper aims at the social science field solely focusing on the HEIs with a relative comparable development level from the view of accomplishments in provincial and local government projects. Furthermore, in order to explore the internal linking activities, the impact of component inefficiency, and the overall dynamic development, we quote the multi-period two-stage DEA model proposed by Kao and Hwang [17] and MPIs (Malmquist Productivity Indices) [18] to evaluate performance via calculating the efficiencies and efficiency variances of different HEIs in different periods as well as stages; we then project the HEIs to construct clusters based on the respective overall and stage efficiencies, and form an interface inside each cluster to present an improvement direction for sustainable betterment.
The rest of the paper is organized as follows. Section 2—“The social science research context in HEIs”—is used to introduce the basic context and is illustrated by detailed research project data. Then, in Section 3, the theoretical framework and model are proposed to provide a description of the methodology. The special sample and the corresponding results are presented and discussed in Section 4. Finally, some conclusions and future research directions are drawn based on the preceding discussion.
2. The Social Science Research Context in HEIs
In general, an HEI should undertake two major tasks—teaching and research—to fulfill its economic and social responsibility and spread ethical values. In detail, the fundamental task of higher education is teaching, which grants students academic degrees in various majors, and then to help them find jobs; the next high-level task is research, which promotes knowledge innovation to realize scientific advancement and socioeconomic development [19]. With the rapid growth of enrolled students from 1,659,415 in 2011 to 1,715,749 in 2015 (http://www.stats.gov.cn), Jiangsu Province is regarded as one of the most developed provinces in China in terms of higher education. According to the data in the Humanities and Social Science Research Management System of the National Ordinary Institutions of Higher Learning (Jiangsu Province), at the end of 2015 there were about 157 HEIs, including 46 public regular HEIs, 60 public junior HEIs, and 51 Private and Chinese–foreign cooperatively-run HEIs. These HEIs have heterogeneous characteristics in terms of the proportion of teaching and research; funding support received from the central, provincial, and local government; and major setting. Most public HEIs are government-owned with financial support mainly from the national, provincial, and local government [20]. The funding of national and ministerial projects, provincial and local government projects, and others has an absolute volume growth and steady proportions at about 31%, 16%, and 51%, respectively (Table 1); at the same time, the according achievements like published works, published papers and research, and consulting reports, remain a relatively constant proportion, too (Table 2). In addition, since the funding of market projects should be distributed based on economic benefit instead of general research performance, we analyze social science research performance, concentrating on the implementation of the provincial and local government projects which mainly aim to improve research ability.
As elsewhere around the world, the science research production process is rather complex in China, and many studies put nature science and social science together without considering their essential differences [5,8]. Johnes and Li [21] applied DEA to analyze the relative research efficiency of 109 Chinese universities from 2003 to 2004 and the conclusions showed that the efficiencies were higher in comprehensive universities compared to specialist universities; the same results were also found for universities located in the coastal region compared with those in the western region. Liang, Li [22] developed a model which realistically considers the university production process, where outputs from the second stage can be fed back to the first stage, then applied this model to a set of Chinese universities. In this paper, we deconstruct the social science research process in HEIs into two-stage networks, taking the individual components and the data structure in the Humanities and Social Science Research Management System of the National Ordinary Institutions of Higher Learning (Jiangsu Province) into account, which can provide a mechanism where we can determine the inefficient stage exactly and prescribe specific improvement measures. In detail, the first stage is called the foundation stage, and the second is called the construction stage. The main purpose of the foundation stage is to get funding for more projects, while that of the construction stage is to create more achievements, which are also treated as the final results of the social science research. The two-stage research system is shown in Figure 1.
3. The Proposed Model
In order to promote sustainable research development, we should assess the research performances with a reasonable methodology and a set of factual performance indicators. This paper takes the provincial and local government projects as the target by which to judge the social science research performance of HEIs in order to provide a general intuitive apprehension and a reference for resource allocation.
Data envelopment analysis is a popular non-parametric linear programming methodology for estimating the relative efficiencies of a homogeneous set of DMUs (Decision-Making Units), based on the inputs that each DMU consumes and the outputs that it produces. The DEA model is now regarded as a popular method for solving multi-input (-output) decision-making problems under multi-criteria conditions [4].
In this section we demonstrate our proposed theoretical framework. First, we explain the basic theoretical framework and the overall analysis approach, and then we present the three steps in detail with models and specific purposes.
3.1. Theoretical Framework
The theoretical framework of the present paper is composed of two successive steps: Step 1 is efficiency measurement with DEA, and Step 2 is projecting the DMUs into the appropriate zones according to their stage efficiencies and then constructing interfaces of each zone. We first calculate the dynamic overall and stage efficiencies and MPIs with the multi-period two-stage model under the general research evaluation criteria. Then we formulate four quadrants (zones), namely the developing zone, the prudent zone, the innovative zone, and the progressive zone. Based on the calculation results, we project the DMUs into certain zones where some clusters may form and then construct an interface for each cluster as an improvement direction. Figure 2 displays the simplified theoretical framework.
3.2. Model
3.2.1. The Multi-Period Two-Stage DEA Model
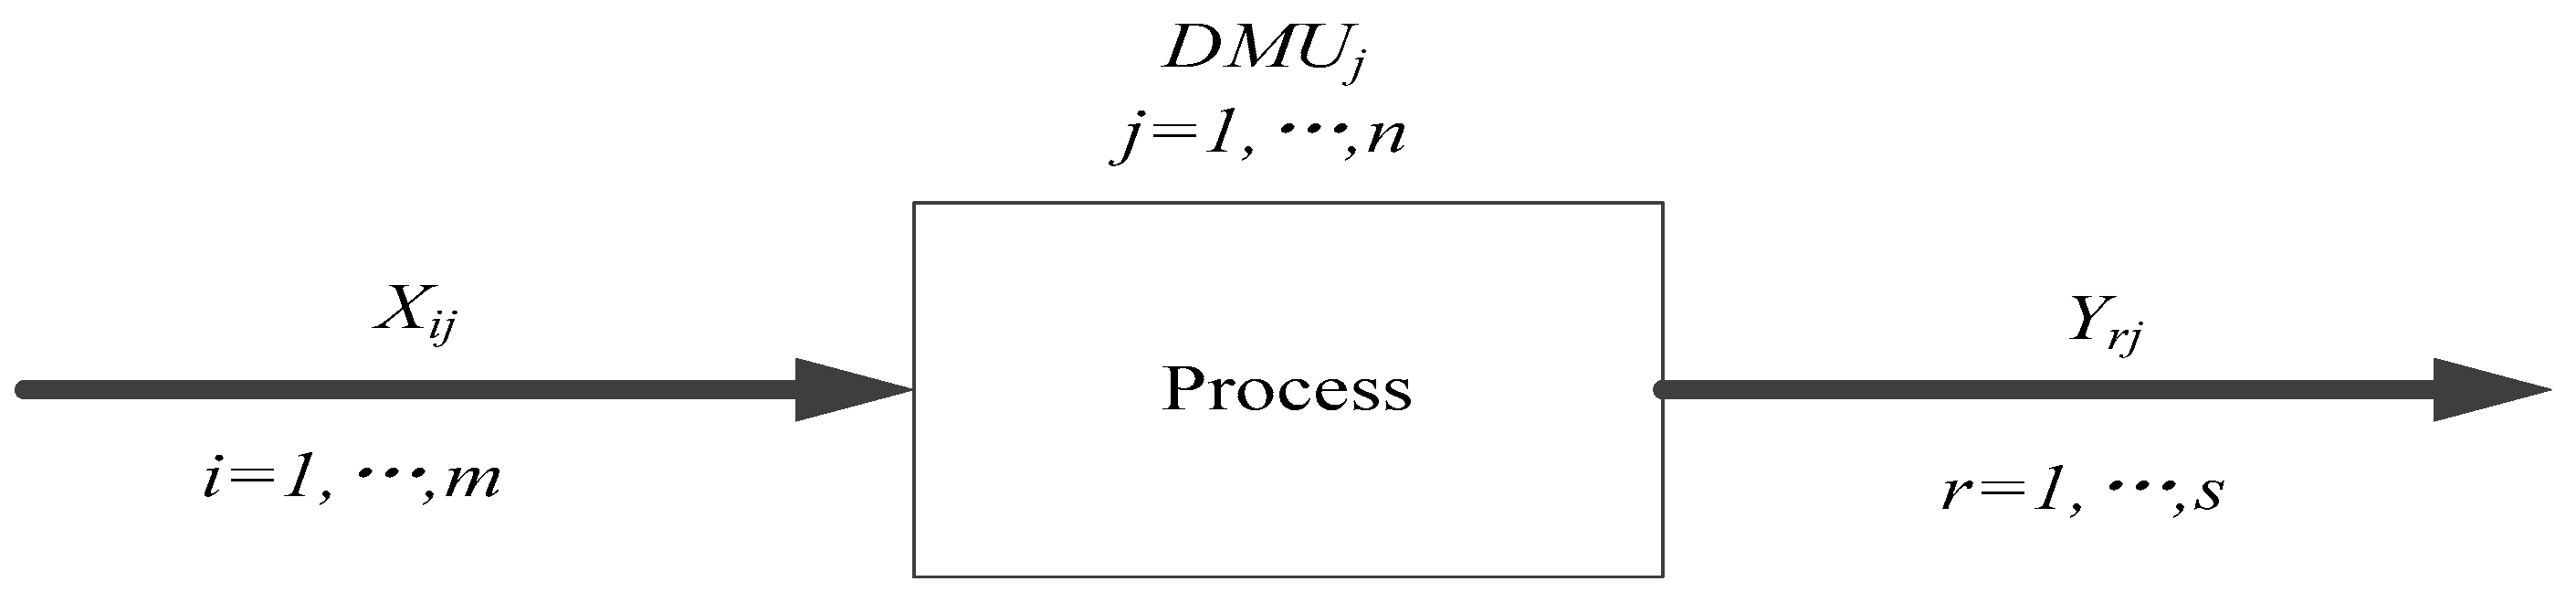
DEA proposed by Charnes, Cooper [3] is regarded as an approach to determining the best performance and ranking all the DMUs according to certain criteria in the presence of multiple inputs and outputs. In general, assume that there are m inputs and s outputs for n DMUs (here, DMUs refers to HEIs) in the social science research process. Figure 3 shows the basic process in detail.
For the jth () HEI, its inputs and outputs are denoted by , and , , respectively. Similarly to previous studies which employed an input-oriented DEA model to analyze the performance of HEIs [22,23], we also regard that HEIs in Jiangsu Province have a larger degree of control over their inputs and adopt input orientation. Considering the time span only covering the Twelfth Five-Year period, we assume that the context is under constant returns to scale (CRS), and that the optimal efficiency for the kth HEI can be calculated through the basic linear programming formulation.
The basic input-oriented CCR (Charnes, Cooper, and Rhodes) model [3] is
where and are virtual multipliers and is a small non-Archimedean number imposed upon the two virtual multipliers to avoid ignoring any factors in the efficiencies measurement [24]. During the loop-computing process, where every HEI is free to choose its own input–output weights in order to maximize its relative performance efficiency, the results can provide an assessment of the relative efficiency of each HEI in a [0, 1] value, and the overall efficiency is
The classic CCR model treats the production process as a black box without consideration of the internal process. With the help of specific systems in which the production process is featured as a multistage link, a lot of studies have been conducted; among these, some typical studies use a two-stage process to detect the realistic individual stage efficiencies and specific inefficient stages [22,23,25,26], which coincides with Section 2, and the basic process is shown in Figure 4. Similarly, for the jth () HEI, its inputs, intermediate variables, and outputs are represented by , , and , respectively. The model employed here is a centralized DEA, which has an essence of the same factor with the same multiplier no matter how and where it is used [27,28].
The basic two-stage centralized model is
Model (2) calculates the overall efficiency of the two-stage process. The first inequality is used to ensure that the system efficiency is equal to or less than 1, and the second and third inequalities are adopted to guarantee that the two-stage efficiencies are equal to or less than 1. In addition, the first inequality constraint is redundant since it is the sum of the second and third inequality constraints. Assume that the above model (2) yields a unique solution; we then obtain the efficiencies for the first and second stages, namely
The system efficiency is the product of and . The nonuniqueness value of each stage will be further addressed later.
In order to further probe the performance of HEIs, we explore the possibility of calculating the relative dynamic efficiencies among the HEIs in several continuous years, with the same production frontier. Comparing with general two-stage models, which measure the overall performance of a production system composed of two stages (processes) in a specified period, this paper takes the individual periods into account and adopts the multi-period two-stage DEA model developed by Kao and Hwang [17], which is able to measure the overall and period efficiencies at the same time with an assumption of constant technology. Suppose the panel data covers q periods and each DMUj endures the same two-stage production system in different years. Let , , and represent the inputs, intermediate variables, and outputs of DMUj in period p, respectively, and let the totals of DMUj of all periods be , , and .
For this purpose, the overall multi-period efficiencies analysis and according models are described as follows.
- System constraints:
- Stage 1 constraints:
- Stage 2 constraints:
The system and stage constraints show that the aggregate outputs should be less than or equal to the aggregate inputs. Suppose we get the optimal value to model (4) uniquely, then the system efficiency () of q periods of DMUk is:
Liang, Cook [28] and Kao and Hwang [17] developed a procedure for testing uniqueness using game theory concepts. It is well known that, generally, as time goes on the performance keeps metabolizing with a relative expansion of the national funding, so we assume a common basis that the year is prior to the stage. In detail, the efficiency of the first year is given the first priority, and the priority decreases year by year. Meanwhile Stage 2 is prior to Stage 1 after identifying the system efficiency of each year. This setting can partly offset the uncontrollable context and environmental influence and make efficiencies among different HEIs more comparable. According to this criterion, the efficiency of period 1 can be calculated while holding the system efficiency of . That is,
The efficiency () of DMUk is
In a similar way, the efficiency of period 2 can be calculated while holding the efficiency of the system () and of period 1 ().
The efficiency of period 2 of DMUk () is
By the same token that the overall system efficiency and system efficiency of period 1 to period (t-1) are uniquely determined, each system efficiency of each period () can be calculated.
Then the according stage efficiency can be obtained from the following model on the premise of Stage 2 prior to Stage 1 for each period [17,28]. Take the period t as an example.
The efficiency of Stage 2 of period t of DMUk () is
Under the general relationship of system efficiency and stage efficiencies of a relational model ([17], the efficiency of Stage 1 of period t of DMUk () is
3.2.2. Malmquist Productivity Index
When panel data are available, the efficiencies of each period and stage can be uniquely calculated, and we can then trace the efficiency changes over time with the Malmquist Productivity Index (MPI). Similar to the multi-period efficiency calculation setting with all q periods used to construct the efficiency frontier, we measure the efficiencies and MPIs which have a property of circularity [29] with the global technology of all q periods [30]. Considering that a different frontier facet makes the efficiencies less comparable, we adopt the global common-weight MPIs [17,31,32,33] to conduct further analysis.
We can calculate the efficiency of any period from the above models, for example, , , and the according MPI between periods t and h is as follows:
By the same token, changes in performance for Stage 1 (and Stage 2) between period t and h can be measured from the ratio of (or ) to (or ).
It is obvious that MPI values higher than 1 indicate productivity improvements, whereas low values less than 1 correspond to productivity decay in the given period.
3.2.3. Clustering the DMUs into Four Quadrants and Constructing Interfaces
The aforementioned models are used to calculate the system and stage efficiencies in each year, and MPIs of certain periods, of each DMU with consideration of the decision-maker's preferences. The position of each DMU is dependent upon its stage efficiencies in a certain year and MPIs of two years. Therefore, we can project each DMU into a specific quadrant in light of its stage efficiencies and get a dynamic piecewise linear model according to MPIs in this period. Based on the two stage efficiencies, we divide the two-dimensional plane into four quadrants with 0.5 (just an example) as the boundary, namely, the developing zone, the prudent zone, the innovative zone, and the progressive zone, as shown in Figure 5.
In detail: The developing zone (Ι) refers to HEIs that have low efficiencies in Stage 1 and Stage 2, and these HEIs must acquire more project funding and produce more achievements to reach breakthrough. The prudent zone (II) includes HEIs that have high efficiency in Stage 1 and low efficiency in Stage 2. These HEIs are mature organizations with relatively little need for applying for projects and seeking funding support, but they need to promote more achievements. The innovative zone (III) consists of HEIs with low efficiency in Stage 1 and high efficiency in Stage 2. These HEIs have potential to produce achievements, but may need more project investment to strengthen Stage 1. Finally, the progressive zone (IV) refers to HEIs with high efficiency in both Stage 1 and Stage 2, and they have an overall relatively perfect performance.
4. Application Analysis and Results
4.1. Sample
From Section 2, we can get a general understanding of HEIs in Jiangsu Province during the Twelfth Five-Year period. In this section, we probe into the performance of 18 representative homogeneous HEIs, all of which are public comprehensive universities with relatively high research performance in Jiangsu Province. This study provides an advantage especially in offering a closer approximation to “China social science research best practice” due to the prominent research ability of Jiangsu Province in China. The primary data source for this research is the Humanities and Social Science Research Management System of the National Ordinary Institutions of Higher Learning (Jiangsu Province), whose data are provided by each HEI and verified by the Education Department of Jiangsu Province annually. As mentioned earlier in Section 2, we choose the data concentrating on provincial and local government research projects. Considering the production and technology level and feasible unique solutions for some lower priority years, this study just focuses on the most recent three years of the Twelfth Five-Year period, so the data used in this part consists of a panel of 18 HEIs’ annual data from 2013 to 2015.
4.2. Variables and Data
In essence, the performance measurement depends on the given states of the social science research and the choice of the variables. Different approaches to determining the input and output variables for measuring the efficiency of HEIs have been discussed in the literature [9,34]. According to the basic development guidelines of higher education in China, every year, HEIs apply for projects, and only some of them can be approved. Once approval is given, the HEI will get project funding or subsidies and is responsible for producing some creative achievements based on approved projects. The inputs, intermediate variables, and outputs are all closely related to the research process, and capable of representing the consumption and achievement. This paper is a synthetical and deconstructive attempt, to the best of our practical experience, theoretical knowledge, and the most effective use of existing data, striving to truthfully reflect the research process. In the foundation stage, the inputs—staff, expenditure, and equipment—are applied to produce intermediate products [35], i.e., the newly approved projects and the completed projects for the year. These intermediate products are the critical elements that the HEIs’ research relies on in order to produce the final outputs, i.e., published works, published papers and research, and consulting reports [15,36].
Considering the practical situations, we only choose people with a graduate degree or above to represent the input for the provision of the research work, since they more readily engage in research collaboration and co-authorship. The total expenditures over the year act as basic resources for science research. Meanwhile, the research equipment is shared by many production activities and hardly allotted at a reasonable use rate in terms of different activities, so we remove this variable. In view of the research and consulting reports having a certain phase-out rate in the process of application, this paper converts it with a utilization rate [36]. In addition, the weight coefficients of the published works are almost all equal to zero when we initially compute the model with those variables, which shows that the published works as composite achievements make no difference to the simulation results, so we delete this variable in the following section.
Consulting the general rules of variable choice [37], some existing relative studies [9,19,38,39], and the abovementioned analysis, this paper adopts two outputs, two intermediate variables and two inputs to support the multi-period two-stage DEA model. The inputs (X1, X2), intermediate variables (Z1, Z2), outputs (Y1, Y2), and the summary statistics of them for the 18 HEIs over the period from 2013 to 2015 are shown in Table 3.
Table 4 shows the data aggregation of inputs, intermediate variables, and outputs of the 18 HEIs in the three years (2013–2015).
4.3. Overall Efficiency and Performance Interface
A preliminary investigation can be made from the data contained in Table 4, and the overall research performance interfaces among universities can be easily captured and demonstrated. The overall system efficiencies and two stage efficiencies of the 18 HEIs can be calculated via Models (4) and (5); the results are shown in the right part of Table 5 with a comparison of “Basic two-stage centralized model” via Model (2) [17]. Compared with the basic two-stage centralized model, the Multi-period model takes the performance of each year into consideration, and the according results are shown in the right part of Table 5. From the left parts of Table 5, it is obvious that only one university is efficient in an overall sense, while two universities are efficient in Stage 1, and four in Stage 2. The efficiency scores in the right part are relatively smaller than those in the left part and all the three-year system and stage efficiencies are less than 1 due to stronger constraints, while the rankings of the 18 universities under the two models change slightly. In an overall sense, the efficiency of Stage 1 is a little bit higher than that of Stage 2, as shown in the last two columns of Table 5.
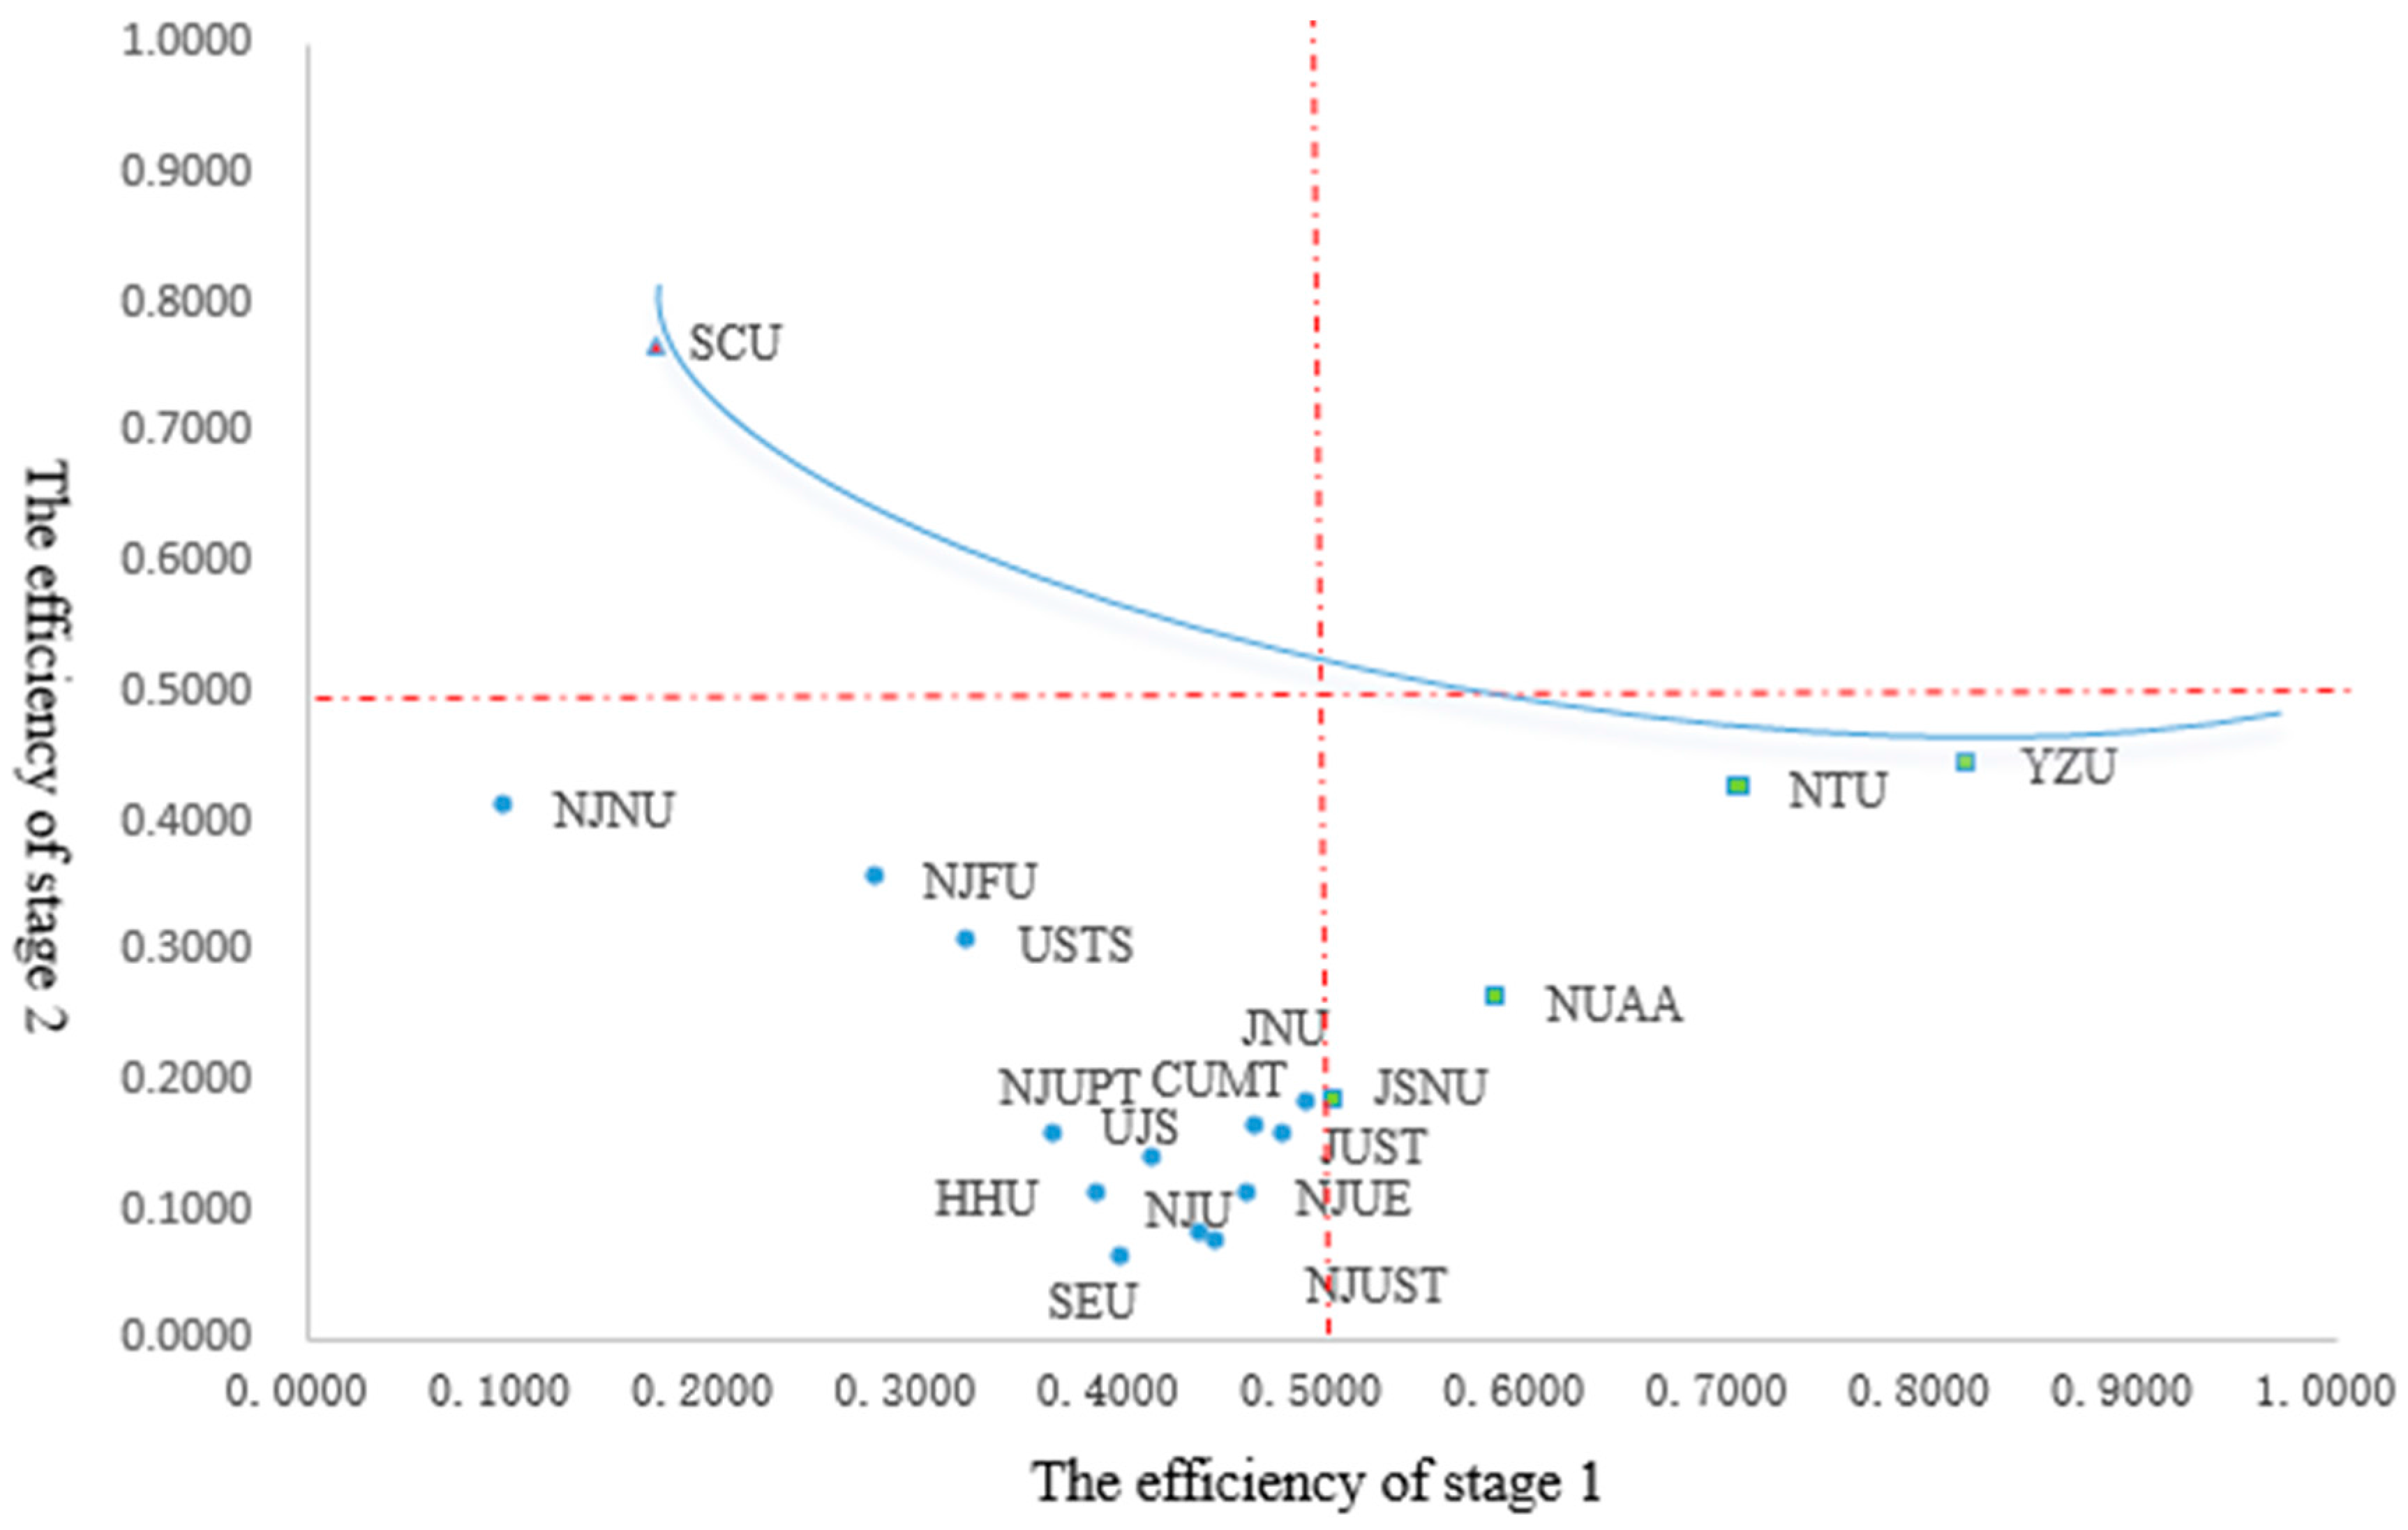
We project the DMUs according to their stage efficiencies shown in Table 5 and form several clusters; the corresponding interface is then constructed. These clusters and the resulting distributions are shown in Figure 6, where the two stage efficiencies determine each HEI’s location, which is an overall static performance indicator. The node colors here show the different clusters in terms of the overall stage efficiencies, taking 0.5 as an efficiency boundary and labeled by the red dotted lines. In general, YZU and NTU (located in the prudent zone) have better practices than others in Stage 1, while SCU (located in the innovative zone) surpasses others in Stage 2. The blue curve identifies an interface of these HEIs in an overall sense, and it can provide a potential direction for performance improvement.
4.4. Yearly Efficiencies and Performance Interfaces
A detailed investigation can be made from the yearly data in a similar way to Section 4.3. Table 6 shows the detailed system and stage efficiencies of each DMU obtained from Models (4)–(14). The values in the last three rows of Table 6 are the average efficiencies and MPIs of the 18 HEIs for the three years. The average yearly system efficiencies—0.0823 for 2013, 0.0835 for 2014, and 0.0.3515 for 2015—indicate that year 2015 has the best performance, even though we set this year as the least priority. There are four stage best-practices in this three-year period, i.e., SCU in 2015, CUMT in 2013, JSNU in 2015, and YZU in 2014, and they also rank at the top in the Table 5. The efficiencies in Table 6 show the sources of inefficiency for each HEI in the three-year period. For example, YZU, as the best performance HEI, has an overall efficiency of 0.3633, as shown in the right part of Table 5. Table 6 indicates that the inefficient part (1–0.3633) is caused by its relatively unsatisfactory performances in 2013 (with an efficiency score of 0.3519) and 2014 (with an efficiency score of 0.2864), which are the result of unsatisfactory performances in different stages.
In order to assess the changes of each DMU over time, the detailed results for the Malmquist Productivity Index through models (15)–(16) are reported in Table 6, exhibited with all components, including system and process MPIs of each DMU in a certain intertemporal period, and the neighboring and start–stop efficiency comparisons. The average system MPI from 2013 to 2015—7.0417—indicates that the general social science research performance of the 18 HEIs has improved substantially in this period. The average system MPIs for 2013–2014 (1.2983) and 2014–2015 (5.3466) further indicate that this improvement is due to the progress in these two segmented intervals.
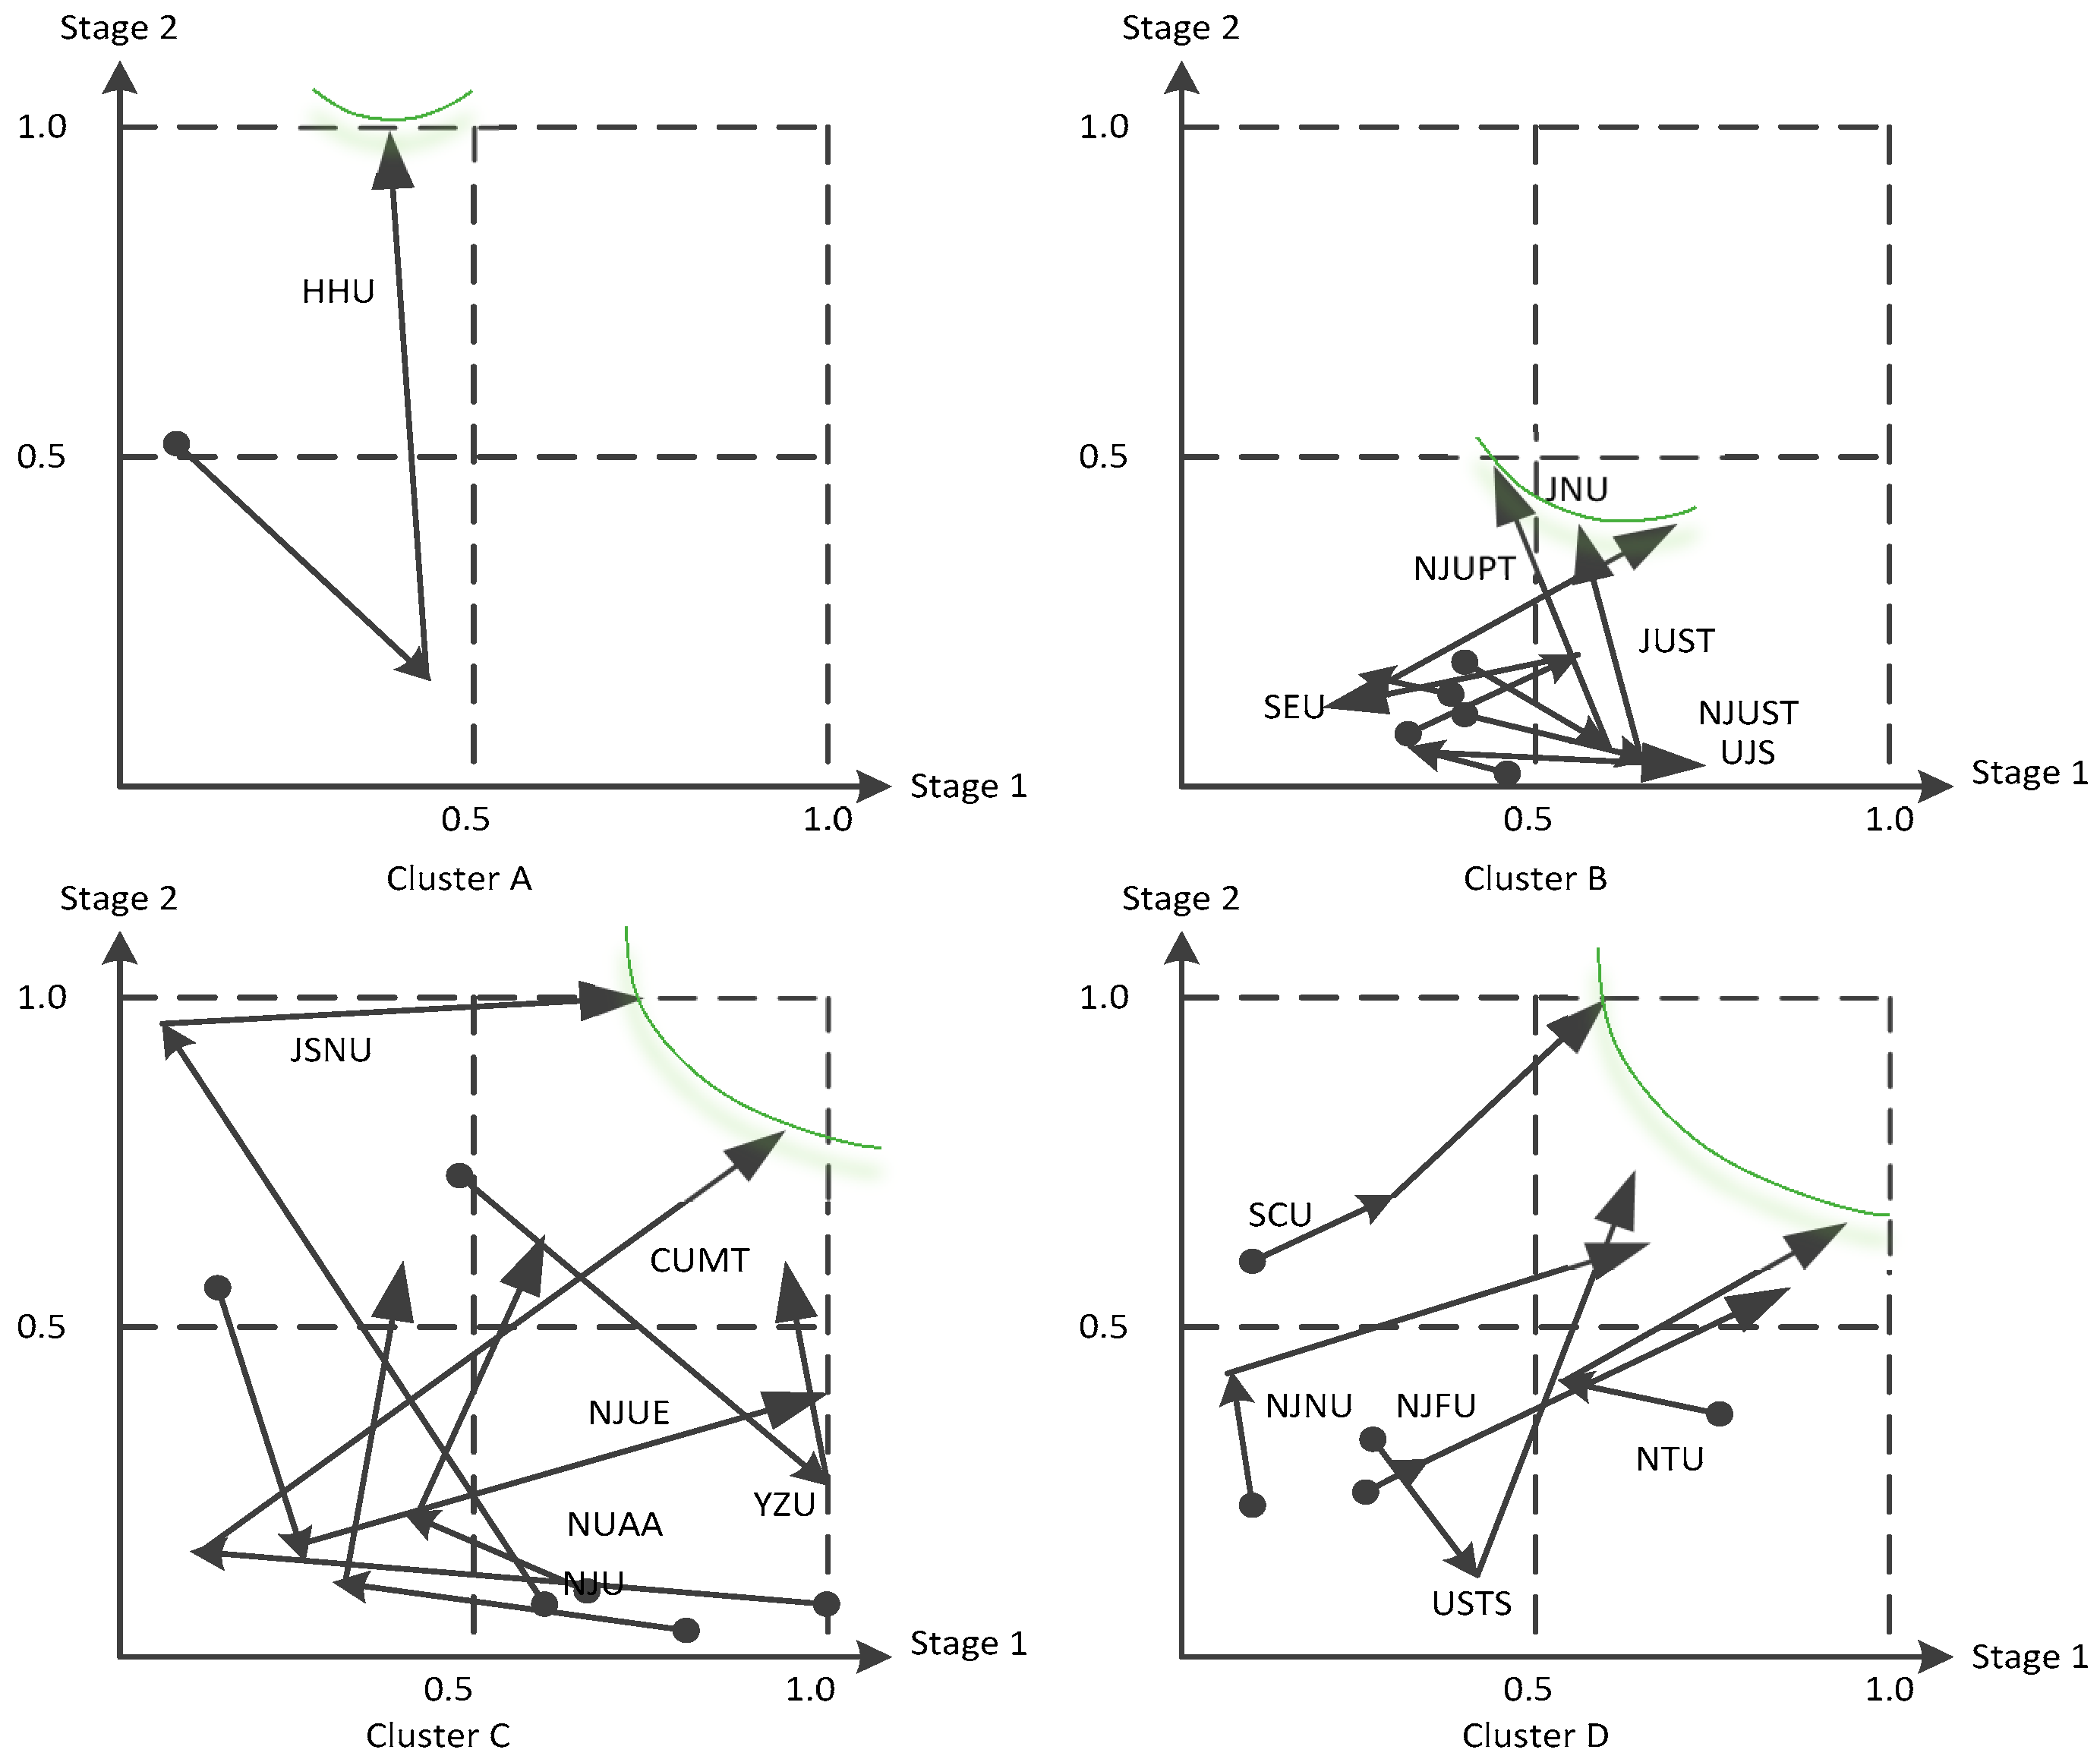
Similarly, we project every DMU into a specific quadrant according to its yearly stage efficiencies using the data of Table 6. After connecting them in time order, the efficiency changes can be traced by a piecewise line. Based on the yearly stage efficiency locations, we divide these 18 HEIs into four clusters as shown in Figure 7. HEIs in cluster A have a relatively high efficiency in Stage 2 but low in Stage 1, while HEIs in cluster B are completely on the contrary with a relatively high efficiency in Stage 1 but low in Stage 2. The stage efficiencies of HEIs in cluster C show a wavy shape, and the HEIs in cluster D have rapid progress. For example, the isolated HHU hovers between the developing zone and the innovative zone by a main pull of efficiency variance in Stage 2, and composes the cluster A on its own. JNU, NJUPT, JUST, SEU, NJUST, and UJS construct cluster B, hovering between the developing zone and the prudent zone, by main pulls of efficiency variance in Stage 1. These HEIs have a common trait in that they both have relatively low efficiencies in two stages and make little progress in this period. JSNU, CUMT, YZU, NJUE, NUAA, and NJU construct cluster C with a trend of radical shifting through different zones by main pulls of efficiency variance in two stages. SCU, NJNU, NJFU, USTS, and NTU form cluster D, moving from other zones to the progressive zone directly by obvious pulls of the two stages.
We can construct a performance interface for each cluster according to its DMUs’ footholds, shown by the green curves in Figure 7, which indicate the improvement direction of a better sustainable performance, but not necessarily the efficient zones. A cluster may or may not involve an efficient DMU but at each cluster there is an interface formed by several DMUs that are the better performers compared with others. The interface shows the best practices that are possible for each inefficient DMU to follow through stage improvements. The DMUs far away from the interface are more inefficient, but it costs too much effort and time to push them toward the interface. Besides this, these interfaces can provide important information for both the HEI itself and the related education administrative departments. For example, the HEI in cluster A should do its best to step forward in the foundation stage and be endowed with more funding support or projects in order to jump into the progressive zone. As to the HEIs in cluster B, in order to get closer to the progressive zone, they should strive to move forward in the construction stage and be given more innovation guides to make full use of their existing resources. The HEIs in cluster C have a great efficiency variance with footprints of three quadrants, and ought to be supported with persistent policies in order to develop their social science research efficiently and directly settle in the progressive zone. The HEIs in cluster D show perfect efficiency trends which have great improvements and can be set as pilots for others.
5. Concluding Remarks
For the sustainable promotion of higher education, governments have been spending large amounts of resources through project support [16], and a great number of studies have been conducted in order to assess the utilization efficiency of these resources. The main purpose of this paper is to address a gap in the emerging field of sustainability development in social science research by HEIs in China, through taking into account the internal structure and dynamic efficiency variance to detect existent relatively inefficient stages during the Twelfth Five-Year period. Since HEIs in Jiangsu Province bear a large degree of responsibility in social science research and take the lead in reasonably allocating public funding, this study provides a closer approximation to the “China social science research best practice”. This paper evaluates efficiencies in a representative sample of universities in Jiangsu Province, and, to assess the variance of the global common-weight MPIs, we project these HEIs into different clusters and construct efficiency interfaces. Meanwhile, this paper also expands the uniqueness solutions of the multi-period two-stage DEA model [17] and demonstrates this in the application part, taking the periods and stages into account with different priorities. For HEIs, this analysis will enlighten them in the rational disposal of higher educational resources in order to realize sustainable development. Besides this, the related administrative departments and practitioners can adopt the efficiency evaluation and clustering tool to group all HEIs as well, and then provide a specific improvement direction for each group and cooperation among groups according to the constructed interfaces. Based on the projection quadrants and interface locations, an HEI itself can determine the internal deficiencies and inter-cluster improvement path and strive for sustainable development.
The present analysis is subject to some limitations. First, the results present in this study are based solely on the data in the Humanities and Social Science Research Management System of the National Ordinary Institutions of Higher Learning (Jiangsu Province), and, therefore, the quality of statistical information may affect the reliability of the application results. Nevertheless, the logging and reviewing data are guided by the Education Department of Jiangsu Province, which reduces the risk of poor data quality. Second, the variables used here are confined to the database, and there may be other variables that could better encapsulate the research process which are, however, not presented in the body of the Humanities and Social Science Research Management System of the National Ordinary Institutions of Higher Learning (Jiangsu Province), which is the only database recording the realistic development of HEIs in Jiangsu Province by taking into account the time span of the analysis and all the HEIs involved. Third, our efficiency and interface analysis solely focus on provincial and local government research project accomplishment to reflect social research ability, so the application results and the improvement measures are restrictive but pertinent.
We propose two directions on the basis of these remarks. One possibility is to consider other variables which may be related to the research process; the quality of them may enhance credibility but should be supported by first-hand data provided by each HEI. The extension of this research on a national scale could also promote the sustainable development of social science and provide feasible access for the HEIs.
Acknowledgments
The authors thank Cherng George Ding and two anonymous reviewers in virtue of 77th Annual of Management, Atlanta, 2017. Their constructive and insightful comments have improved the quality of this paper significantly. We gratefully acknowledge financial support from the National Natural Science Foundation of China (Nos. 71173036, 71473037), Research Fund for the Doctoral Program of Research Innovation of Jiangsu Province (No. KYLX16_0173).
Author Contributions
Xianmei Wang and Hanhui Hu built the conceptual framework, the according DEA Model, and performed the research together. Xianmei Wang studied the target institutes, analyzed the data, and wrote the manuscript. Xianmei Wang revised the manuscript under the suggestion of Hanhui Hu. All authors have read and approved the final manuscript.
Conflicts of Interest
The authors declare no conflict of interest.
References
- Evangelinos, K.I.; Jones, N.; Panoriou, E.M. Challenges and opportunities for sustainability in regional universities: A case study in Mytilene, Greece. J. Clean. Prod. 2009, 17, 1154–1161. [Google Scholar] [CrossRef]
- Lindsay, A.W. Institutional performance in higher education: The efficiency dimension. Rev. Educ. Res. 1982, 52, 175–199. [Google Scholar] [CrossRef]
- Charnes, A.; Cooper, W.W.; Rhodes, E. Measuring the efficiency of decision making units. Eur. J. Oper. Res. 1978, 2, 429–444. [Google Scholar] [CrossRef]
- Cook, W.D.; Seiford, L.M. Data envelopment analysis (DEA)–Thirty years on. Eur. J. Oper. Res. 2009, 192, 1–17. [Google Scholar] [CrossRef]
- Avkiran, N.K. Investigating technical and scale efficiencies of Australian universities through data envelopment analysis. Socio-Econ. Plan. Sci. 2001, 35, 57–80. [Google Scholar] [CrossRef]
- Athanassopoulos, A.D.; Shale, E. Assessing the comparative efficiency of higher education institutions in the UK by the means of data envelopment analysis. Educ. Econ. 1997, 5, 117–134. [Google Scholar] [CrossRef]
- Johnes, J. Data envelopment analysis and its application to the measurement of efficiency in higher education. Econ. Educ. Rev. 2006, 25, 273–288. [Google Scholar] [CrossRef]
- Abbott, M.; Doucouliagos, C. The efficiency of Australian universities: A data envelopment analysis. Econ. Educ. Rev. 2003, 22, 89–97. [Google Scholar] [CrossRef]
- Thanassoulis, E.; Kortelainen, M.; Johnes, G.; Johnes, J. Costs and efficiency of higher education institutions in England: A DEA analysis. J. Oper. Res. Soc. 2011, 62, 1282–1297. [Google Scholar] [CrossRef] [Green Version]
- Singh, S.; Ranjan, P. Efficiency analysis of non-homogeneous parallel sub-unit systems for the performance measurement of higher education. Ann. Oper. Res. 2017, 1–26. [Google Scholar] [CrossRef]
- Wolszczak-Derlacz, J.; Parteka, A. Efficiency of European public higher education institutions: A two-stage multicountry approach. Scientometrics 2011, 89, 887–917. [Google Scholar] [CrossRef] [PubMed]
- Andersson, C.; Antelius, J.; Månsson, J.; Sund, K. Technical efficiency and productivity for higher education institutions in Sweden. Scand. J. Educ. Res. 2017, 61, 1–19. [Google Scholar] [CrossRef]
- Thanassoulis, E.; Dey, P.K.; Petridis, K.; Goniadis, I.; Georgiou, A.C. Evaluating higher education teaching performance using combined analytic hierarchy process and data envelopment analysis. J. Oper. Res. Soc. 2017, 68, 431–445. [Google Scholar] [CrossRef]
- Munoz, D.A. Assessing the research efficiency of higher education institutions in Chile: A data envelopment analysis approach. Int. J. Educ. Manag. 2016, 30, 809–825. [Google Scholar] [CrossRef]
- Lee, B.L.; Worthington, A.C. A network DEA quantity and quality-orientated production model: An application to Australian university research services. Omega 2016, 60, 26–33. [Google Scholar] [CrossRef]
- Sagarra, M.; Molinero, C.M.; Agasisti, T. Exploring the Efficiency of Mexican Universities: Integrating Data Envelopment Analysis and Multidimensional Scaling. Omega 2014, 55, 1324–1325. [Google Scholar] [CrossRef]
- Kao, C.; Hwang, S.-N. Multi-period efficiency and Malmquist productivity index in two-stage production systems. Eur. J. Oper. Res. 2014, 232, 512–521. [Google Scholar] [CrossRef]
- Caves, D.W.; Christensen, L.R.; Diewert, W.E. The Economic Theory of Index Numbers and the Measurement of Input, Output, and Productivity. Econometrica 1982, 50, 1393–1414. [Google Scholar] [CrossRef]
- Beasley, J.E. Determining teaching and research efficiencies. J. Oper. Res. Soc. 1995, 46, 441–452. [Google Scholar] [CrossRef]
- Lee, B.L. Efficiency of research performance of Australian Universities: A reappraisal using a bootstrap truncated regression approach. Econ. Anal. Policy 2011, 41, 195–203. [Google Scholar] [CrossRef]
- Johnes, J.; Li, Y. Measuring the research performance of Chinese higher education institutions using data envelopment analysis. China Econ. Rev. 2008, 19, 679–696. [Google Scholar] [CrossRef]
- Liang, L.; Li, Z.-Q.; Cook, W.D.; Zhu, J. Data envelopment analysis efficiency in two-stage networks with feedback. IIE Trans. 2011, 43, 309–322. [Google Scholar] [CrossRef]
- Kao, C.; Hung, H.-T. Efficiency analysis of university departments: An empirical study. Omega 2008, 36, 653–664. [Google Scholar] [CrossRef]
- Charnes, A.; Cooper, W.W. Preface to topics in data envelopment analysis. Ann. Oper. Res. 1984, 2, 59–94. [Google Scholar] [CrossRef]
- Chen, Y.; Cook, W.D.; Li, N.; Zhu, J. Additive efficiency decomposition in two-stage DEA. Eur. J. Oper. Res. 2009, 196, 1170–1176. [Google Scholar] [CrossRef]
- Seiford, L.M.; Zhu, J. Profitability and marketability of the top 55 US commercial banks. Manag. Sci. 1999, 45, 1270–1288. [Google Scholar] [CrossRef]
- Kao, C.; Hwang, S.-N. Efficiency decomposition in two-stage data envelopment analysis: An application to non-life insurance companies in Taiwan. Eur. J. Oper. Res. 2008, 185, 418–429. [Google Scholar] [CrossRef]
- Liang, L.; Cook, W.D.; Zhu, J. DEA models for two-stage processes: Game approach and efficiency decomposition. Nav. Res. Logist. 2008, 55, 643–653. [Google Scholar] [CrossRef]
- Pastor, J.T.; Lovell, C.K. Circularity of the Malmquist productivity index. Econ. Theory 2007, 33, 591–599. [Google Scholar] [CrossRef]
- Pastor, J.T.; Lovell, C.K. A global Malmquist productivity index. Econ. Lett. 2005, 88, 266–271. [Google Scholar] [CrossRef]
- Kao, C. Malmquist productivity index based on common-weights DEA: The case of Taiwan forests after reorganization. Omega 2010, 38, 484–491. [Google Scholar] [CrossRef]
- Kao, C.; Hung, H.-T. Data envelopment analysis with common weights: The compromise solution approach. J. Oper. Res. Soc. 2005, 56, 1196–1203. [Google Scholar] [CrossRef]
- Sueyoshi, T.; Aoki, S. A use of a nonparametric statistic for DEA frontier shift: The Kruskal and Wallis rank test. Omega 2001, 29, 1–18. [Google Scholar] [CrossRef]
- Johnes, J. Measuring teaching efficiency in higher education: An application of data envelopment analysis to economics graduates from UK Universities 1993. Eur. J. Oper. Res. 2006, 174, 443–456. [Google Scholar] [CrossRef]
- Saaty, T.L.; Vargas, L.G. Models, Methods, Concepts & Applications of the Analytic Hierarchy Process; Springer: New York, NY, USA, 2012. [Google Scholar]
- Wang, X.; Hu, H. Sustainable Evaluation of Social Science Research in Higher Education Institutions Based on Data Envelopment Analysis. Sustainability 2017, 9, 644. [Google Scholar] [CrossRef]
- Cooper, W.; Seiford, L.; Tone, K.; Zhu, J. Some models and measures for evaluating performances with DEA: past accomplishments and future prospects. J. Prod. Anal. 2007, 28, 151–163. [Google Scholar] [CrossRef]
- Avkiran, N.K. Opening the black box of efficiency analysis: An illustration with UAE banks. Omega 2009, 37, 930–941. [Google Scholar] [CrossRef]
- Zhu, J. Quantitative Models for Performance Evaluation and Benchmarking: Data Envelopment Analysis with Spreadsheets; Springer: Berlin, Germany, 2014; Volume 213. [Google Scholar]
Figure 1.
A two-stage research system.
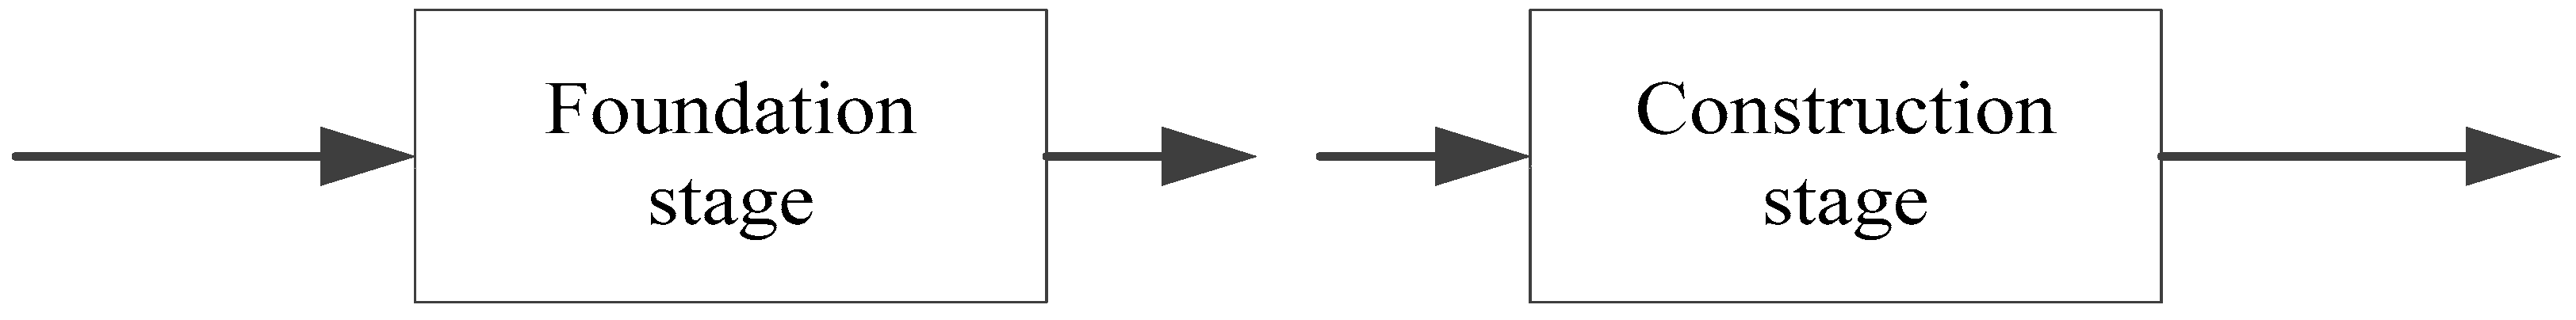
Figure 2.
The simplified theoretical framework. MPIs: Malmquist Productivity Indices; DMUs: Decision-Making Units; DEA: Data Envelopment Analysis.
Figure 2.
The simplified theoretical framework. MPIs: Malmquist Productivity Indices; DMUs: Decision-Making Units; DEA: Data Envelopment Analysis.

Figure 3.
The basic process. DMUj denotes the jth HEI; Xij denotes the ith input of DMUj; Yrj denotes the rth output of DMUj.
Figure 3.
The basic process. DMUj denotes the jth HEI; Xij denotes the ith input of DMUj; Yrj denotes the rth output of DMUj.

Figure 4.
The basic two-stage process. Zfj denotes the fth intermediate variable of DMUj.
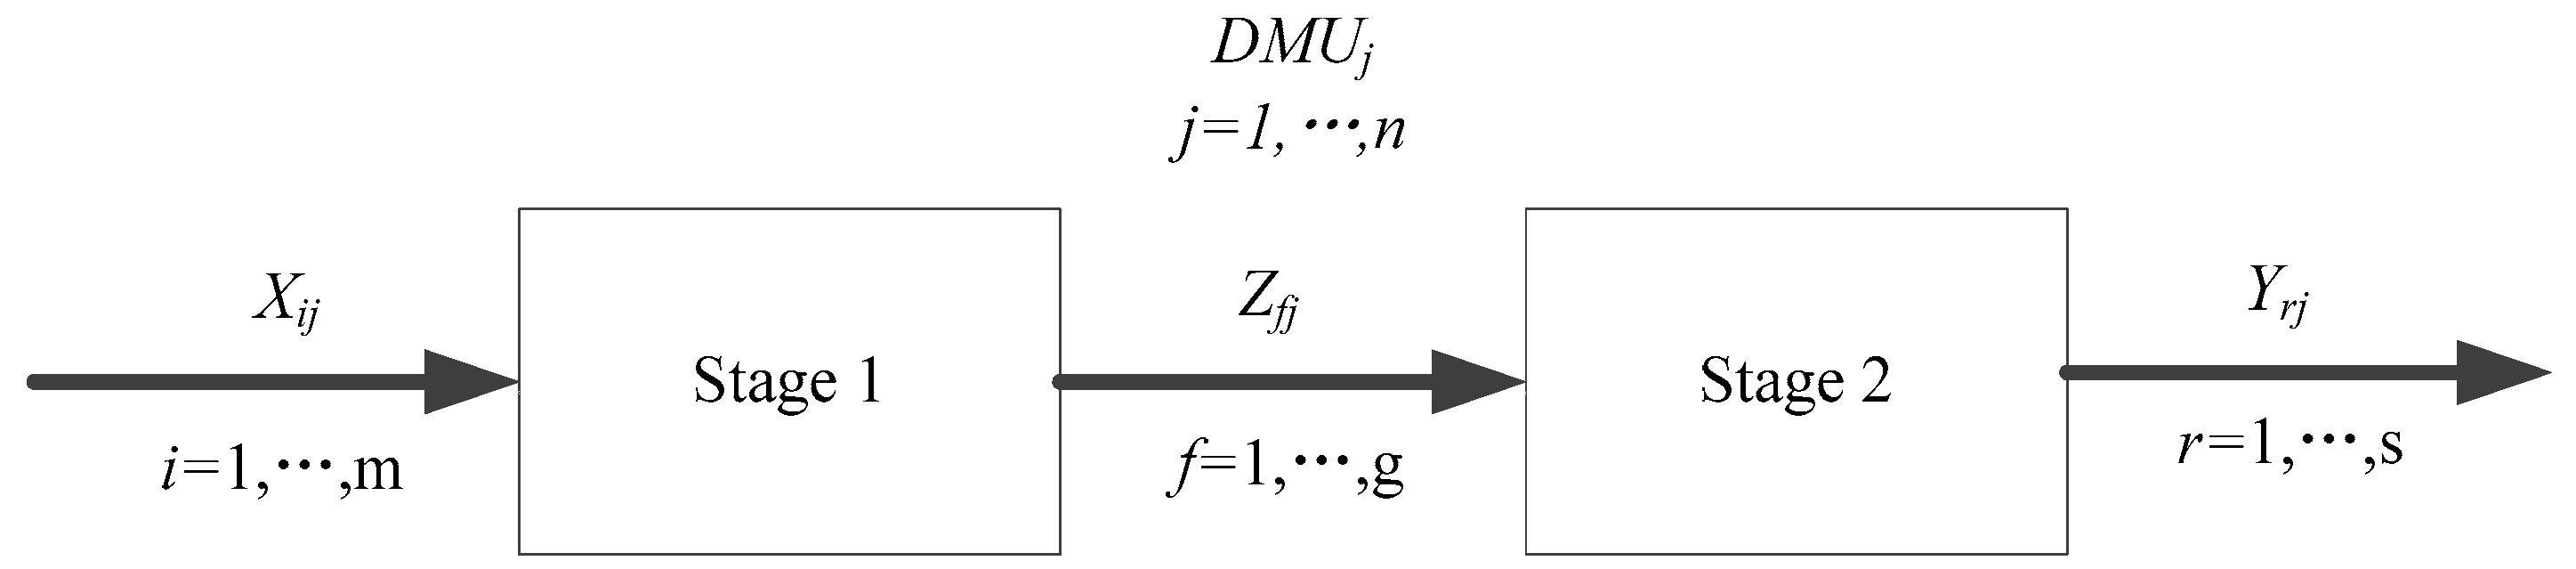
Figure 5.
The four performance quadrants.
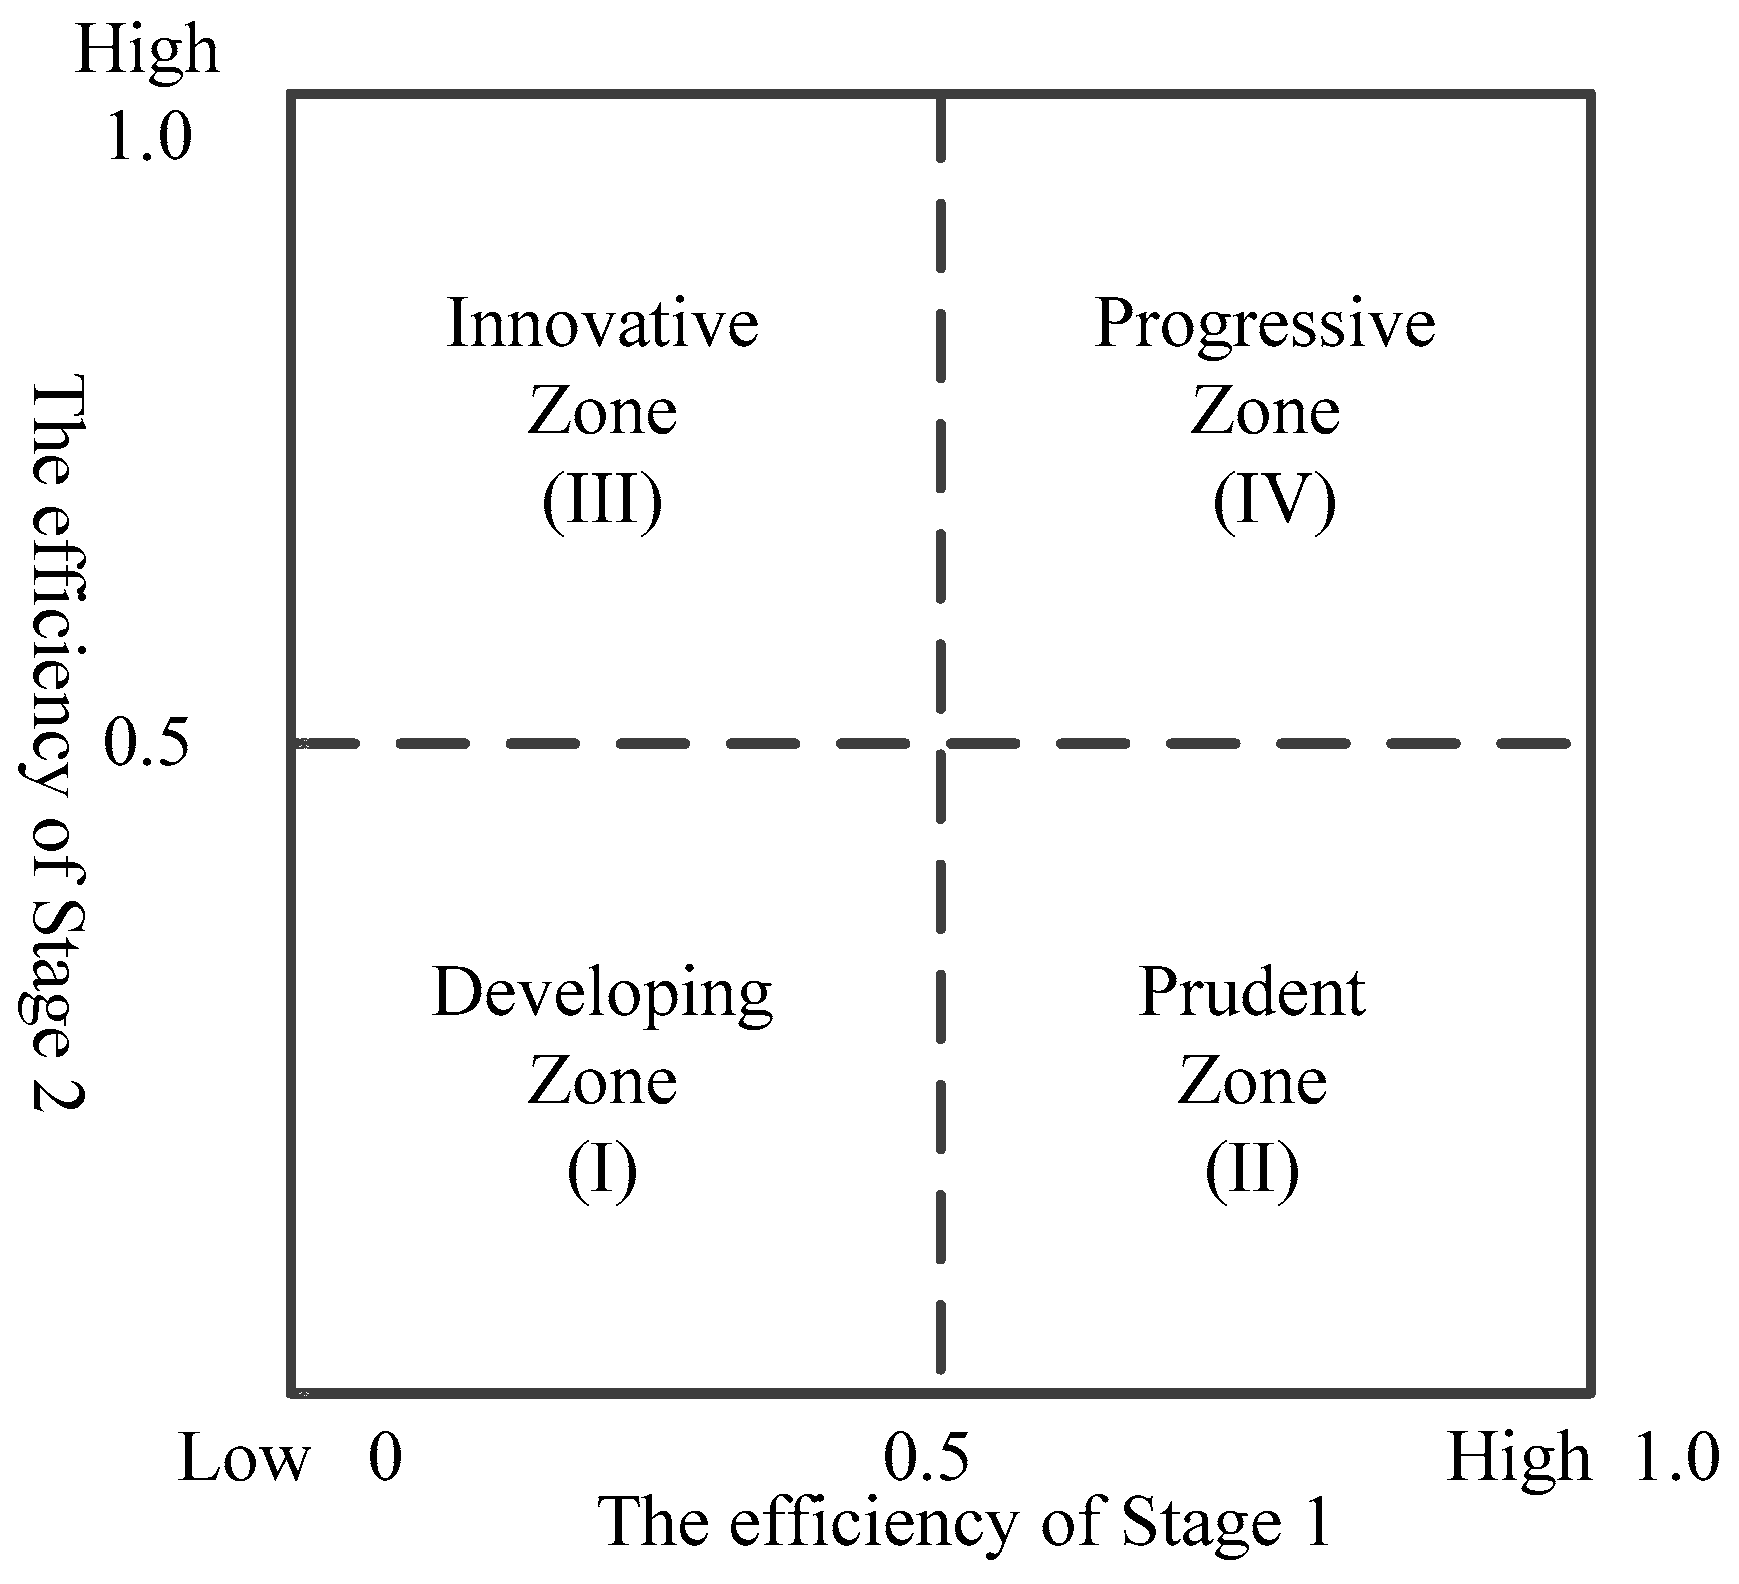
Figure 6.
The overall performance distribution and their interface.

Figure 7.
The performance interfaces of each cluster.

Table 1.
Statement of different project sources of funding of higher educational institutions (HEIs) in Jiangsu, 2011–2015 (Hundreds Yuan).
Table 1.
Statement of different project sources of funding of higher educational institutions (HEIs) in Jiangsu, 2011–2015 (Hundreds Yuan).
| Year | Total | National and Ministerial Projects | Provincial and Local Government Projects | Others |
|---|---|---|---|---|
| 2011 | 3,041,486.3 | 942,132.2 | 442,252.75 | 1,657,101.34 |
| % | 100.00% | 30.98% | 14.54% | 54.48% |
| 2012 | 3,563,611.5 | 1,073,472 | 548,751.56 | 1,941,387.93 |
| % | 100.00% | 30.13% | 15.40% | 54.48% |
| 2013 | 4,116,724.3 | 1,325,320.4 | 637,562.35 | 2,153,841.59 |
| % | 100.00% | 32.20% | 15.49% | 52.31% |
| 2014 | 4,325,654.78 | 1,359,643.5 | 769,491.25 | 2,196,519.99 |
| % | 100.00% | 31.43% | 17.79% | 50.78% |
| 2015 | 4,334,898.2 | 1,397,557.4 | 874,739.4 | 2,062,601.4 |
| % | 100.00% | 32.24% | 20.18% | 47.58% |
| Average | 3,876,475.02 | 1,219,625.10 | 654,559.46 | 2,002,290.45 |
| % | 100.00% | 31.46% | 16.89% | 51.65% |
Data source: Humanities and Social Science Research Management System of the National Ordinary Institutions of Higher Learning (Jiangsu Province) (similarly hereinafter).
Table 2.
Statement of different sources of achievements of HEIs in Jiangsu, 2011–2015.
| Year | Types | Total | National and Ministerial Projects | Provincial and Local Government Projects | Others |
|---|---|---|---|---|---|
| 2011 | Published Works | 646 | 211 | 245 | 190 |
| % | 100.00% | 32.67% | 37.92% | 29.41% | |
| Published Papers | 10184 | 3288 | 3676 | 3220 | |
| % | 100.00% | 32.28% | 36.10% | 31.62% | |
| Research and consulting reports | 258 | 23 | 65 | 170 | |
| % | 100.00% | 8.92% | 25.19% | 65.89% | |
| 2012 | Published Works | 808 | 251 | 292 | 265 |
| % | 100.00% | 31.06% | 36.14% | 32.80% | |
| Published Papers | 12662 | 3822 | 4652 | 4188 | |
| % | 100.00% | 30.18% | 36.74% | 33.07% | |
| Research and consulting reports | 523 | 40 | 132 | 351 | |
| % | 100.00% | 7.65% | 25.24% | 67.11% | |
| 2013 | Published Works | 842 | 340 | 261 | 241 |
| % | 100.00% | 40.38% | 31.00% | 28.62% | |
| Published Papers | 14,341 | 4482 | 5201 | 4658 | |
| % | 100.00% | 31.25% | 36.27% | 32.48% | |
| Research and consulting reports | 638 | 48 | 222 | 368 | |
| % | 100.00% | 7.52% | 34.80% | 57.69% | |
| 2014 | Published Works | 948 | 382 | 337 | 229 |
| % | 100.00% | 40.30% | 35.55% | 24.16% | |
| Published Papers | 16,107 | 5212 | 6491 | 4404 | |
| % | 100.00% | 32.35% | 40.30% | 27.34% | |
| Research and consulting reports | 1014 | 82 | 321 | 611 | |
| % | 100.00% | 8.09% | 31.65% | 60.25% | |
| 2015 | Published Works | 644 | 292 | 217 | 135 |
| % | 100.00% | 45.34% | 33.70% | 20.97% | |
| Published Papers | 16,922 | 4962 | 7380 | 4580 | |
| % | 100.00% | 29.32% | 43.62% | 27.07% | |
| Research and consulting reports | 1181 | 52 | 368 | 761 | |
| % | 100.00% | 4.40% | 31.16% | 64.44% | |
| Average | Published Works | 777.6 | 295.2 | 270.4 | 212 |
| % | 100% | 37.96% | 34.77% | 27.26% | |
| Published Papers | 14,043.2 | 4353.2 | 5480 | 4210 | |
| % | 100% | 31.00% | 39.02% | 29.98% | |
| Research and consulting reports | 722.8 | 49 | 221.6 | 452 | |
| % | 100% | 6.78% | 30.66% | 62.56% |
Table 3.
Some statistics for the 18 HEIs in Jiangsu Province.
| Variables | Definitions | Mean | Std.Dev. | Min | Max |
|---|---|---|---|---|---|
| Y1 | Published papers | 110.74 | 66.81 | 37.00 | 384.00 |
| Y2 | Adopted Research and consulting reports | 11.44 | 15.73 | 1.00 | 80.00 |
| Z1 | The funding of newly approved projects (Million Yuan) | 74.07 | 32.68 | 13.00 | 149.00 |
| Z2 | The amount of accomplished projects | 20.69 | 33.36 | 0.76 | 180.39 |
| X1 | Total researchers (graduate degrees or above) | 18.69 | 43.98 | 0.20 | 74.90 |
| X2 | Total expenditure in the current year (Million Yuan) | 17.54 | 28.61 | 0.68 | 169.00 |
Table 4.
Three-year data aggregation of inputs, intermediate variables, and outputs of the 18 HEIs.
| HEI | Y1 | Y2 | Z1 (Million Yuan) | Z2 | X1 | X2 (Million Yuan) |
|---|---|---|---|---|---|---|
| NJU | 239 | 74 | 224 | 153.81 | 60.50 | 118.71 |
| SCU | 848 | 49 | 313 | 66.95 | 23.70 | 66.95 |
| SEU | 394 | 69 | 382 | 184.15 | 139.90 | 154.48 |
| NUAA | 248 | 44 | 107 | 25.73 | 32.10 | 15.84 |
| NJUST | 148 | 9 | 75 | 35.87 | 40.40 | 27.85 |
| JUST | 188 | 3 | 172 | 17.36 | 75.10 | 13.74 |
| CUMT | 197 | 34 | 277 | 28.92 | 49.60 | 25.17 |
| NJUPT | 244 | 15 | 233 | 23.05 | 106.70 | 24.34 |
| HHU | 665 | 194 | 234 | 299.32 | 94.90 | 259.40 |
| JNU | 368 | 19 | 267 | 30.71 | 143.00 | 22.83 |
| NJFU | 166 | 6 | 136 | 25.54 | 7.10 | 13.16 |
| UJS | 178 | 6 | 134 | 20.42 | 43.20 | 18.56 |
| NTU | 471 | 8 | 346 | 30.94 | 3.60 | 25.99 |
| NJNU | 373 | 15 | 254 | 62.13 | 39.10 | 72.99 |
| JSNU | 432 | 32 | 246 | 36.90 | 95.10 | 26.92 |
| NJUE | 254 | 8 | 154 | 36.89 | 34.70 | 29.13 |
| USTS | 342 | 28 | 289 | 23.88 | 18.70 | 21.99 |
| YZU | 225 | 5 | 157 | 14.95 | 1.70 | 8.96 |
| Average | 332.22 | 34.33 | 222.22 | 62.08 | 56.06 | 56.61 |
Table 5.
Three-year efficiencies for 18 HEIs in Jiangsu.
| HEI | Basic Two-Stage Centralized Model | Multi-Period Model | ||||
|---|---|---|---|---|---|---|
| ES | EΙ | EΙΙ | ES | EΙ | EΙΙ | |
| NJU | 0.1901 [17] | 0.6759 | 0.2813 | 0.0360 [16] | 0.4428 | 0.0814 |
| SCU | 0.5193 [8] | 0.5193 | 1.0000 | 0.1314 [4] | 0.1710 | 0.7684 |
| SEU | 0.1353 [18] | 0.6144 | 0.2202 | 0.0251 [18] | 0.4026 | 0.0623 |
| NUAA | 0.8372 [3] | 0.8372 | 1.0000 | 0.1518 [3] | 0.5885 | 0.2579 |
| NJUST | 0.2142 [15] | 0.6075 | 0.3526 | 0.0317 [17] | 0.4501 | 0.0705 |
| JUST | 0.5449 [7] | 0.7452 | 0.7312 | 0.0750 [9] | 0.4820 | 0.1556 |
| CUMT | 0.4116 [10] | 0.5922 | 0.6950 | 0.0739 [10] | 0.4688 | 0.1576 |
| NJUPT | 0.4046 [11] | 0.5492 | 0.7367 | 0.0562 [11] | 0.3708 | 0.1515 |
| HHU | 0.2423 [14] | 0.6392 | 0.3790 | 0.0437 [14] | 0.3913 | 0.1116 |
| JNU | 0.6425 [6] | 0.7669 | 0.8377 | 0.0869 [8] | 0.4926 | 0.1765 |
| NJFU | 0.5023 [9] | 1.0000 | 0.5023 | 0.0992 [6] | 0.2813 | 0.3525 |
| UJS | 0.3820 [12] | 0.5893 | 0.6483 | 0.0562 [11] | 0.4180 | 0.1343 |
| NTU | 0.9885 [2] | 0.9957 | 0.9928 | 0.2989 [2] | 0.7084 | 0.4220 |
| NJNU | 0.2036 [16] | 0.4217 | 0.4828 | 0.0404 [15] | 0.0990 | 0.4079 |
| JSNU | 0.6677 [4] | 0.7313 | 0.9131 | 0.0915 [7] | 0.5085 | 0.1800 |
| NJUE | 0.3472 [13] | 0.6291 | 0.5520 | 0.0523 [13] | 0.4675 | 0.1119 |
| USTS | 0.6592 [5] | 0.6592 | 1.0000 | 0.0997 [5] | 0.3281 | 0.3038 |
| YZU | 1.0000 [1] | 1.0000 | 1.0000 | 0.3633 [1] | 0.8214 | 0.4424 |
| Average | 0.4940 | 0.6985 | 0.6847 | 0.1007 | 0.4385 | 0.2416 |
Table 6.
Period efficiencies and MPIs for 18 HEIs in Jiangsu.
| HEI | Year | Period [t-h] | Period | Process Ι | Process ΙΙ | |||
|---|---|---|---|---|---|---|---|---|
| ES(p) | MPIS(p) | EΙ(p) | MPIΙ(p) | EΙΙ(p) | MPIΙΙ(p) | |||
| NJU | 2013 | [13-14] | 0.0281 | 1.0478 | 0.6993 | 0.4271 | 0.0403 | 2.4531 |
| 2014 | [14-15] | 0.0295 | 5.5493 | 0.2987 | 1.0425 | 0.0987 | 5.3231 | |
| 2015 | [13-15] | 0.1637 | 5.8144 | 0.3114 | 0.4453 | 0.5256 | 13.0580 | |
| SCU | 2013 | [13-14] | 0.0629 | 2.0460 | 0.1013 | 1.9587 | 0.6208 | 1.0446 |
| 2014 | [14-15] | 0.1287 | 4.6265 | 0.1985 | 2.9998 | 0.6485 | 1.5420 | |
| 2015 | [13-15] | 0.5954 | 9.4661 | 0.5953 | 5.8757 | 1.0000 | 1.6108 | |
| SEU | 2013 | [13-14] | 0.0195 | 1.0313 | 0.2910 | 1.7332 | 0.0670 | 3.3808 |
| 2014 | [14-15] | 0.0201 | 3.8894 | 0.5043 | 0.7294 | 0.2264 | 0.9385 | |
| 2015 | [13-15] | 0.0782 | 4.0112 | 0.3678 | 1.2642 | 0.2125 | 3.1729 | |
| NUAA | 2013 | [13-14] | 0.1215 | 1.2878 | 0.7124 | 0.6791 | 0.1706 | 1.8962 |
| 2014 | [14-15] | 0.1565 | 2.3038 | 0.4838 | 1.2285 | 0.3234 | 1.8753 | |
| 2015 | [13-15] | 0.3605 | 2.9667 | 0.5943 | 0.8343 | 0.6065 | 3.5559 | |
| NJUST | 2013 | [13-14] | 0.0185 | 1.9918 | 0.4895 | 0.6198 | 0.0378 | 3.2139 |
| 2014 | [14-15] | 0.0369 | 1.6965 | 0.3034 | 2.3949 | 0.1215 | 0.7084 | |
| 2015 | [13-15] | 0.0625 | 3.3791 | 0.7266 | 1.4842 | 0.0861 | 2.2769 | |
| JUST | 2013 | [13-14] | 0.0542 | 1.0455 | 0.3233 | 1.9079 | 0.1675 | 0.5480 |
| 2014 | [14-15] | 0.0566 | 4.0871 | 0.6169 | 0.9625 | 0.0918 | 4.2476 | |
| 2015 | [13-15] | 0.2314 | 4.2729 | 0.5938 | 1.8364 | 0.3899 | 2.3277 | |
| CUMT | 2013 | [13-14] | 0.0996 | 0.2126 | 1.0000 | 0.1723 | 0.0996 | 1.2339 |
| 2014 | [14-15] | 0.0212 | 3.8372 | 0.1723 | 5.7989 | 0.1229 | 6.6145 | |
| 2015 | [13-15] | 0.0813 | 0.8158 | 0.9991 | 0.9991 | 0.8132 | 8.1616 | |
| NJUPT | 2013 | [13-14] | 0.0527 | 0.4932 | 0.3946 | 0.8117 | 0.1335 | 0.6076 |
| 2014 | [14-15] | 0.0260 | 10.8294 | 0.3203 | 2.1840 | 0.0811 | 4.9577 | |
| 2015 | [13-15] | 0.2815 | 5.3414 | 0.6996 | 1.7728 | 0.4023 | 3.0124 | |
| HHU | 2013 | [13-14] | 0.0200 | 2.8415 | 0.0384 | 11.7904 | 0.5208 | 0.2410 |
| 2014 | [14-15] | 0.0569 | 6.7514 | 0.4529 | 0.8789 | 0.1255 | 7.6813 | |
| 2015 | [13-15] | 0.3838 | 19.1842 | 0.3981 | 10.3626 | 0.9642 | 1.8512 | |
| JNU | 2013 | [13-14] | 0.0777 | 0.7726 | 0.4243 | 1.3637 | 0.1830 | 0.5666 |
| 2014 | [14-15] | 0.0600 | 3.9929 | 0.5787 | 0.8410 | 0.1037 | 4.7476 | |
| 2015 | [13-15] | 0.2395 | 3.0848 | 0.4867 | 1.1469 | 0.4922 | 2.6899 | |
| NJFU | 2013 | [13-14] | 0.0622 | 1.6164 | 0.2563 | 1.2815 | 0.2425 | 1.2613 |
| 2014 | [14-15] | 0.1005 | 4.5134 | 0.3285 | 2.5559 | 0.3059 | 1.7668 | |
| 2015 | [13-15] | 0.4535 | 7.2953 | 0.8396 | 3.2754 | 0.5405 | 2.2284 | |
| UJS | 2013 | [13-14] | 0.0200 | 2.3941 | 0.4277 | 0.9042 | 0.0707 | 1.7532 |
| 2014 | [14-15] | 0.0479 | 5.6853 | 0.3867 | 1.6634 | 0.1239 | 3.4190 | |
| 2015 | [13-15] | 0.2724 | 13.6113 | 0.6433 | 1.5040 | 0.4236 | 5.9941 | |
| NTU | 2013 | [13-14] | 0.2630 | 0.8427 | 0.7543 | 0.6929 | 0.3486 | 1.2163 |
| 2014 | [14-15] | 0.2216 | 2.6948 | 0.5226 | 1.8542 | 0.4240 | 1.4533 | |
| 2015 | [13-15] | 0.5972 | 2.2710 | 0.9690 | 1.2847 | 0.6162 | 1.7676 | |
| NJNU | 2013 | [13-14] | 0.0274 | 1.5713 | 0.1065 | 0.8375 | 0.2570 | 1.8763 |
| 2014 | [14-15] | 0.0430 | 9.9149 | 0.0892 | 7.1296 | 0.4823 | 1.3908 | |
| 2015 | [13-15] | 0.4263 | 15.5794 | 0.6357 | 5.9707 | 0.6708 | 2.6096 | |
| JSNU | 2013 | [13-14] | 0.0397 | 1.5606 | 0.5769 | 0.1077 | 0.0688 | 14.4929 |
| 2014 | [14-15] | 0.0619 | 11.5616 | 0.0621 | 11.5212 | 0.9965 | 1.0035 | |
| 2015 | [13-15] | 0.7157 | 18.0435 | 0.7157 | 1.2406 | 1.0000 | 14.5433 | |
| NJUE | 2013 | [13-14] | 0.0750 | 0.6535 | 0.1392 | 1.8855 | 0.5389 | 0.3466 |
| 2014 | [14-15] | 0.0490 | 8.3379 | 0.2625 | 3.8046 | 0.1868 | 2.1910 | |
| 2015 | [13-15] | 0.4088 | 5.4489 | 0.9988 | 7.1736 | 0.4092 | 0.7594 | |
| USTS | 2013 | [13-14] | 0.0872 | 1.1464 | 0.2485 | 1.5627 | 0.3510 | 0.7336 |
| 2014 | [14-15] | 0.1000 | 3.9331 | 0.3884 | 1.4279 | 0.2575 | 2.7546 | |
| 2015 | [13-15] | 0.3933 | 4.5088 | 0.5546 | 2.2313 | 0.7092 | 2.0207 | |
| YZU | 2013 | [13-14] | 0.3519 | 0.8140 | 0.4947 | 2.0214 | 0.7113 | 0.4027 |
| 2014 | [14-15] | 0.2864 | 2.0347 | 1.0000 | 0.9978 | 0.2864 | 2.0383 | |
| 2015 | [13-15] | 0.5828 | 1.6563 | 0.9978 | 2.0169 | 0.5839 | 0.8209 | |
| Average | 2013 | [13-14] | 0.0823 | 1.2983 | 0.4155 | 1.7087 | 0.2572 | 2.0705 |
| 2014 | [14-15] | 0.0835 | 5.3466 | 0.3872 | 2.7786 | 0.2782 | 3.0363 | |
| 2015 | [13-15] | 0.3515 | 7.0417 | 0.6737 | 2.8177 | 0.5803 | 4.0256 | |
© 2017 by the authors. Licensee MDPI, Basel, Switzerland. This article is an open access article distributed under the terms and conditions of the Creative Commons Attribution (CC BY) license (http://creativecommons.org/licenses/by/4.0/).
Share and Cite
MDPI and ACS Style
Wang, X.; Hu, H. Sustainability in Chinese Higher Educational Institutions’ Social Science Research: A Performance Interface toward Efficiency. Sustainability 2017, 9, 1952. https://doi.org/10.3390/su9111952
AMA Style
Wang X, Hu H. Sustainability in Chinese Higher Educational Institutions’ Social Science Research: A Performance Interface toward Efficiency. Sustainability. 2017; 9(11):1952. https://doi.org/10.3390/su9111952
Chicago/Turabian StyleWang, Xianmei, and Hanhui Hu. 2017. "Sustainability in Chinese Higher Educational Institutions’ Social Science Research: A Performance Interface toward Efficiency" Sustainability 9, no. 11: 1952. https://doi.org/10.3390/su9111952
Note that from the first issue of 2016, this journal uses article numbers instead of page numbers. See further details here.