Motivations Underlying Consumers’ Preference for Farmers’ Markets in Klang Valley: A Means-End Chain Approach

1
Institute of Agricultural and Food Policy Studies, Universiti Putra Malaysia, Putra Infoport, Jalan Kajang-Puchong, 43400 UPM Serdang, Selangor, Malaysia
2
Department of Agricultural Technology, Jenderal Soedirman University, Purwokerto 53123, Central Java, Indonesia
3
School of Agriculture, Food and Wine, The University of Adelaide, Urrbrae 5064, South Australia, Australia
4
Putra Business School, 43400 UPM Serdang, Selangor, Malaysia
*
Author to whom correspondence should be addressed.
Sustainability 2017, 9(11), 1958; https://doi.org/10.3390/su9111958
Submission received: 29 September 2017
/
Revised: 21 October 2017
/
Accepted: 24 October 2017
/
Published: 27 October 2017
(This article belongs to the Section Sustainable Agriculture)
Abstract
:In an increasingly competitive market environment, understanding why consumers purchase fresh produce from farmers’ markets is pivotal to understanding the markets’ value and to strengthening the rural economy. This is the first study to employ a means-end chain (MEC) framework to analyze the motivations underlying consumer preference for farmers’ markets. The linkages between these motivators are important steps in understanding why consumers purchase fresh produce from farmers’ markets. Based on in-depth interviews with 212 shoppers at the farmers’ markets in the Klang Valley, Malaysia, we identified the attributes ‘fresh’, ‘nearby’, ‘variety’, and ‘cheap’ as the means of achieving self-directed personal values (e.g., ‘expenses are better managed’), security values (‘live longer’), and benevolent values (e.g., ‘close the ties’). The insights gained should prove useful to policy-makers and to the farmers’ market sector, allowing them to more effectively communicate with consumers from the basis of a better understanding of the attributes, benefits, and personal values influencing them.
1. Introduction
Farmers’ markets continue to gain popularity due to their win-win appeal. By selling their produce at a farmers’ market, growers can enhance their income since consumers are willing to pay higher than ex-farm gate prices, Consumers, in turn, get fresh produce at better prices than they can when purchasing in traditional (wet markets) and modern retail outlets [1]. Offering a more economic option and improving access to healthy foods, farmers’ markets are now a part of nutrition enhancement programs [2,3]. Farmers’ markets also have benefits for communities (e.g., create a socialization platform and job opportunities) and the environment (e.g., low food miles and preservation of local resources) [4].
While farmers’ markets are less prevalent in developing countries, this alternative has economic significance in respect to Malaysian agricultural development and poverty alleviation. Under the purview of Federal Agricultural Marketing Authority (FAMA), local farmers’ markets have undergone introductory (1985–1994), strengthening (1995–2003), modernization (2004–2010), and post-modernization (2011–present) phases [5]. At their inception in 1985 there were just 12 sites [6]. At the time of writing, there are some 604 farmers’ markets throughout the country [7] and they have recorded a 23.31% compound annual growth rate in sales [8].
It can be supposed that the rapid expansion of farmers’ markets indicates a change in Malaysian consumer preference. In an early study commissioned by FAMA, seven out of 10 consumers indicated preference to purchase agricultural products from modern markets (e.g., super- and hypermarket chains) [9]. In view of their economies of scale and relatively shorter value chains, the ability of traditional markets (e.g., provision shops, grocery shops, wet markets, mini markets, and farmers’ markets) to fend off the competition was questioned [10]. The innovations of modern markets, in fact, resulted in positive spillover effects (e.g., productivity and quality) on traditional markets [11]. Traditional markets learned the importance of value [12]. A recent study demonstrated that Malaysian consumers regard both traditional and modern markets as comparable [13]. Farmers’ markets, in particular, have emerged as a popular channel for fresh food [14].
Research has found a range of factors that motivate consumers to shop at farmers’ markets. Attributes that are commonly cited to explain their choice include freshness (i.e., [15,16,17]), quality (i.e., [18,19,20]), food safety [21], taste [22,23], organic and chemical-free attributes [24], convenience [15], and price [21,25]. Social motivation, such as human interaction with the environment through local food purchasing [17,26,27], exchange of information [28], and social appeal [18,24] also influence shopping preference. Lifestyle traits, such as an enjoyment of cookery [22,29], gardening [30,31], and an interest in healthy foods [29,30] lead consumers to prefer farmers’ markets. The choice is also associated with movement to establish cultural and personal identity [32] by acting upon concerns about environmental and social sustainability [33], supporting farmers and the local economy [16,23], and is related to religious reasons [29,31].
In a comprehensive review, Byker et al. [34] conclude that consumer behavior is driven by a continuum of motivations ranging from personal preferences for concrete attributes at one end to relatively abstract consequences and personal values at the other end. Given the relative importance of these diverse motivations, they are hypothesized as plausible predictors of a preference for farmers’ markets [30,31].
Despite being treated as independent factors in previous literature, these concrete and abstract motivations have been integrated, through means-end chain (MEC) analysis, into a single framework in a related research subject—preference for local food [35,36]. The studies have conclusively demonstrated that Gutman’s [37] MEC explores various motivations through a cognitive framework by linking concrete attributes (the means) to abstract personal values (the ends) through their associated consequences. The means-end flows offer insight into the relationships between product-based motivations (attributes) and self-driven motivations (personal values) or, in short, how products become meaningful to consumers. Given such usefulness, MEC analysis will generate additional knowledge which complementing existing research approaches in understanding and influencing preference towards farmers’ markets.
Consequently, by using the MEC approach, the objective of this study is to elicit the motivators driving the choice of shopping at farmers’ markets. This method has successfully been applied to studies unboxing factors affecting destination choice behavior in tourism [38,39]. Naspetti and Zanoli [40] used the MEC approach to understand drivers behind consumers’ purchases of organic food products at certain stores. In these studies, laddering interview techniques have proven useful in leading respondents to share multi-stage cognitive information with respect to their behavioral choices. Following the precedent of these studies, we will uncover various motivations and integrate them into a cognitive structure. As more research on different aspects of farmers’ markets is needed [41], our work will make a meaningful contribution to the literature.
2. Means-End Chain Theory
In general, MEC theory explains how consumers think about a product [37]. It explores the important meanings that consumers associate with a product through a cognitive structure built upon the relationship between product attributes, their associated consequences and consumers’ personal values.
Product attributes are relatively concrete and generally observable. For example, a farmers’ market might be described as offering fresh produce. Consequences are more abstract and represent the perceived benefits (or costs) associated with specific attributes. ‘Fresh produce’, then, might be linked to the consequence of ‘nutritious’. Finally, personal values are highly abstract and refer to the end states that consumers seek to achieve through consumption [38]. To complete the previous example, ‘nutritious’ might be a desirable personal attribute because it might be thought to lead one to feel and stay ‘healthy’.
Taken together, the connections between attributes and consequences and between consequences and personal values facilitate the accomplishment of desired end states via the consequences accruing from the attributes [37].
Attribute → Consequence → Personal value
This cognitive structure is a means-end chain. Concrete features and their associated benefits motivate preference for a product. Such benefits, in turn, are determined by the values they engender in the mind of consumers, in order to achieve individual goals [42]. In the MEC approach, therefore, personal values are the main driver underlying choice behavior [43,44,45].
Reynolds and Gutman [46] offer a general methodology, known as a laddering interview technique, for uncovering means-end cognitive structures. The procedure begins with an a priori list either asking respondents to elicit basic distinctions that they use to differentiate products or a straightforward question asking respondents to indicate the main distinctions underlying a preferred product choice. Commonly, these basic distinctions refer to concrete attributes or, less frequently, to relatively abstract consequences and personal values.
Respondents are then asked a series of “why is (this distinction) important to you?” questions. Such questions aim to uncover higher-level associations. The response is then used as the subject of the next “why is (this distinction) important to you?” question. The questioning process ends when the question can no longer be answered. This laddering procedure is called soft laddering.
Another alternative is the hard laddering technique. In paper-and-pencil and computerized laddering methods, respondents are asked to write or type one answer as to why an attribute or consequence is important using a priori lists of elements (attributes, consequences, and personal values). Unlike the soft laddering technique, multiple responses to a question are not allowed. To more closely mirror soft laddering, an improved paper-and pencil and computerized laddering method allows respondents to select more than one answer from a list of pre-determined elements when completing branching “charts” [47].
Both soft and hard laddering techniques are distinctive in the nature of their application. Since an a priori list is required, hard laddering is preferable when previous knowledge exists about cognitive structures related to the consumption of a product [48]. Given that responses can only be selected from the a priori list, such rigidity may force respondents to report false associations [49]. On the other hand, soft laddering allows respondents to freely express their responses. Using this unrestrained technique, soft laddering improves the probability of uncovering important elements and their associations not previously noted by the literature [50]. Taking both data reliability and knowledge exploration into consideration, it is reasonable to observe that researchers, even in areas where a priori knowledge was readily available, most commonly use soft laddering for this reason.
Consequently the soft laddering interview technique was deemed most appropriate to this study since we attempt to uncover the means-end structural links consumers perceive as important when selecting farmers’ markets as their preferred shopping destination for fresh produce.
3. Methodology
3.1. Study Area
Selangor, a Malaysian state, was selected as our study area. According to the Department of Statistics Malaysia [51], the state of Selangor is the most urbanized (91.4%) and populous (5.46 million) in Malaysia. It is the largest economy in the country. Approximately 1.6% of its RM239.968 billion (roughly US$56.5 billion) contribution to the national gross domestic product (GDP) came from the agricultural industry, which used one-third of the 743,028.06 hectares of land in the state [52].
A low return on land use is reflected in farmers’ incomes, which were generally less than the half of the RM6241 (roughly US$1468.47) which constituted Malaysia’s median monthly household income in 2014 [53]. Consumers in Selangor faced rising living costs, which were exacerbated by the implementation of a Goods and Services Tax (GST) in April 2015. Although fresh agricultural products are zero-rated, the GST is charged on all other goods and services. Consequently, it impacted household expenditure.
To assist both farmers and consumers combat these escalating costs, significant public investment has been made in attempting to eliminate intermediaries. This has been accomplished through the instigation of farmers’ markets in high-density areas of the state of Selangor (see Figure 1).
At the time of our study (May 2016), there were 49 farmers’ markets in Selangor. They are made up of a mix of ordinary farmers’ markets, wholesale farmers’ markets, mega farmers’ markets, agricultural caravans, permanent farmers’ markets, and desaraya (grocery) farmers’ markets. Most sites open on a selected day (especially on weekends) in order to take advantage of consumers’ weekly grocery shopping patterns. Only a wholesale farmers’ market in Puchong, a permanent farmers’ market in Kuala Selangor, and a desaraya (grocery) farmers’ market in Tanjung Karang operate seven days a week.
3.2. Data Collection
The data collection was carried out at 10 random farmers’ markets (as marked in Figure 1) over two weeks in May 2016. A total of 212 shoppers participated in one-to-one in-depth soft laddering interviews described earlier. Shoppers passing by a booth (near the organizing committee—FAMA’s counter) were approached by one of four interviewers. If it was a family, only the decision-maker who made most of the household shopping decisions was interviewed. Trained interviewers introduced themselves as (agricultural) students from the Universiti Putra Malaysia and not as affiliates with FAMA. They sought the targets’ agreement to participate voluntarily in the paper-based survey. Interviewers emphasized that the interview information would be strictly used for research and that the results would be tabulated in a manner such that no individual participants could be identified.
Respondents were interviewed individually for approximately 15–20 min. As a start, they were asked to indicate the main reasons underlying their preference for shopping at farmers’ markets. We took their answers as attributes of farmers’ markets and used them as the starting point for the soft laddering questioning process with “why is (a reported reason) important to you?” Their response was then used as the subject of the next “why is (the response) important to you?” question and the questioning process was repeated to elicit those higher-level concepts with which it was associated.
If the respondents’ initial response was recognized as a consequence, interviewers probed for both the supporting attribute and the relevant personal value.
After collecting all important information for the MEC, respondents were asked to provide information on their demography. This is summarized in Table 1. It was generally observed that most respondents are married (85%). More than half of the respondents are women (59%). Nearly half of the respondents had annual income of less than RM39,999 (approximately US$9411.53), and a quarter of them were considered as middle-income earners with RM40,000–RM59,999 (approximately US$9411.76–US$14,117.41) per annum. It was particularly noted that 89% of the respondents are Malays. This figure was confirmed by our anecdotal observation of the study sites since local residents and vendors at farmers’ markets are primarily Malays.
3.3. Means-End Chain Analysis
The initial stage of MEC analysis is called content analysis. In order to develop appropriate MEC elements and classify them into ‘attribute’, ‘consequence’, or ‘value’ according to context, this process began with a careful review of the data collected. Items presenting similar content or meaning were grouped into one element. Clarification was sought from the interviewers in cases where meanings were unclear. After a list of elements was developed, each response was coded and classified to allow for the aggregation of the responses. Two analysts carried out both exercises separately. Disagreements were discussed and jointly resolved. The final tabulation was then entered into MECAnalyst computer software, which was developed jointly by Skymax-DG et al. [56].
Structural analysis was then conducted to identify the connections between elements. This involved generating a summary implication matrix (SIM) in which the rows and columns refer to the elements identified in the content analysis. The entries are the frequency with which each pair of elements is associated in the soft laddering interviews, and help us understand their direct and indirect associations.
As an illustration, an MEC of A → B → C indicates direct associations present from A to B and from B to C. An indirect association exists in the link from A to C. In such an inter-element association, following the recommendations of Olson and Reynolds [57] and Reynolds and Gutman [46], they were treated as equivalent measures and the total number of direct and indirect associations were recorded in a SIM.
The SIM was then used as the input for constructing a hierarchical value map (HVM)—a tree-link network depicting an MEC hierarchical cognitive structure. Given the large number of insignificant cells (at zero or near zero count) SIM, a cut-off level was necessitated to capture the significant associations as identified by their sum value in the SIM. In respect to this, recommendations vary. Reynolds and Gutman [46] suggest a cut-off level of between 3 and 5 for a small sample size; Pieters et al. [58] and Bagozzi and Dabholkar [59] recommend researchers identify a cut-off level representing 60–70% of associations; Leppard et al. [60] encourage trial using multiple cut-off levels to identify the one, which, in turn, produces a manageable HVM.
In view of our larger sample size, we experimented with cut-off levels of 4, 5, and 6, and the outputs returned 58.1%, 50.7%, and 44.9% representation of active links, respectively. As the HVMs resulting from cut-off level 4 proved too complex and cut-off level of 6 proved too simple, the cut-off level of 5 was selected as a relatively robust HVM.
The process of generating the HVM also produces abstractness ratios and centrality indices, which range between 0 and 1. The abstractness ratios help to identify the hierarchical level (attribute, consequence or value) of each element in the HVM by computing the ratio of in-degrees over the sum of in-degrees and out-degrees. A low abstractness ratio indicates that an element is a means; a high abstractness ratio shows that an element is an end. By summing the column for a particular element in the SIM, in-degrees denote the frequencies with which an element is the object or end of other elements in respondent ladders. Out-degrees represent the frequencies with which a variable serves as the source of origin for other elements, and can be determined by summing the appropriate row for that element in the SIM. The out-degrees are also known as centrality indices, which are used to examine the proportion of linkages that run through a particular element. A high centrality measure indicates an element as a dominant point.
4. Findings
At cut-off level of 5, the resultant abstractness ratios and centrality indices for the 33 significant elements is presented in Table 2. The ‘fresh’, ‘variety’, ‘nearby’, ‘variety’, and ‘cheap’ elements with low abstractness ratios (close to zero) refer to the attributes of farmers’ markets. Amongst these attributes, as measured by the centrality index, ‘fresh’ was a dominant starting point in respondents’ cognitive ladders. In contrast, the elements ranging from 0.71 to 1 in the abstractness ratio all refer to personal values. Their centrality index was similarly low, suggesting a seemingly equal end-point of the ladders. In between these attributes and personal values were 17 elements classified as consequences. Their abstractness ratios ranged between 0.42 and 0.58. Those consequences with lower abstractness ratios are related to relatively tangible (such as ‘compare prices’ and ‘quality product’), immediate (such as ‘convenience’ and ‘reduce cost of living’), and functional (such as ‘time with family’ and ‘expenses are better managed’) benefits linked with experiencing the attributes of farmers’ markets. Those consequences with higher abstractness ratios refer to relatively abstract psychosocial benefits (such as ‘health for family’ and ‘for the living’). The centrality index indicates that “stay healthy’ and ‘save time’ were popular consequences for individual respondents.
As demonstrated above, the distinction between the attributes of farmers’ markets, the consequences of visiting farmers’ markets and the associated personal values are clearly consistent with the MEC concept.
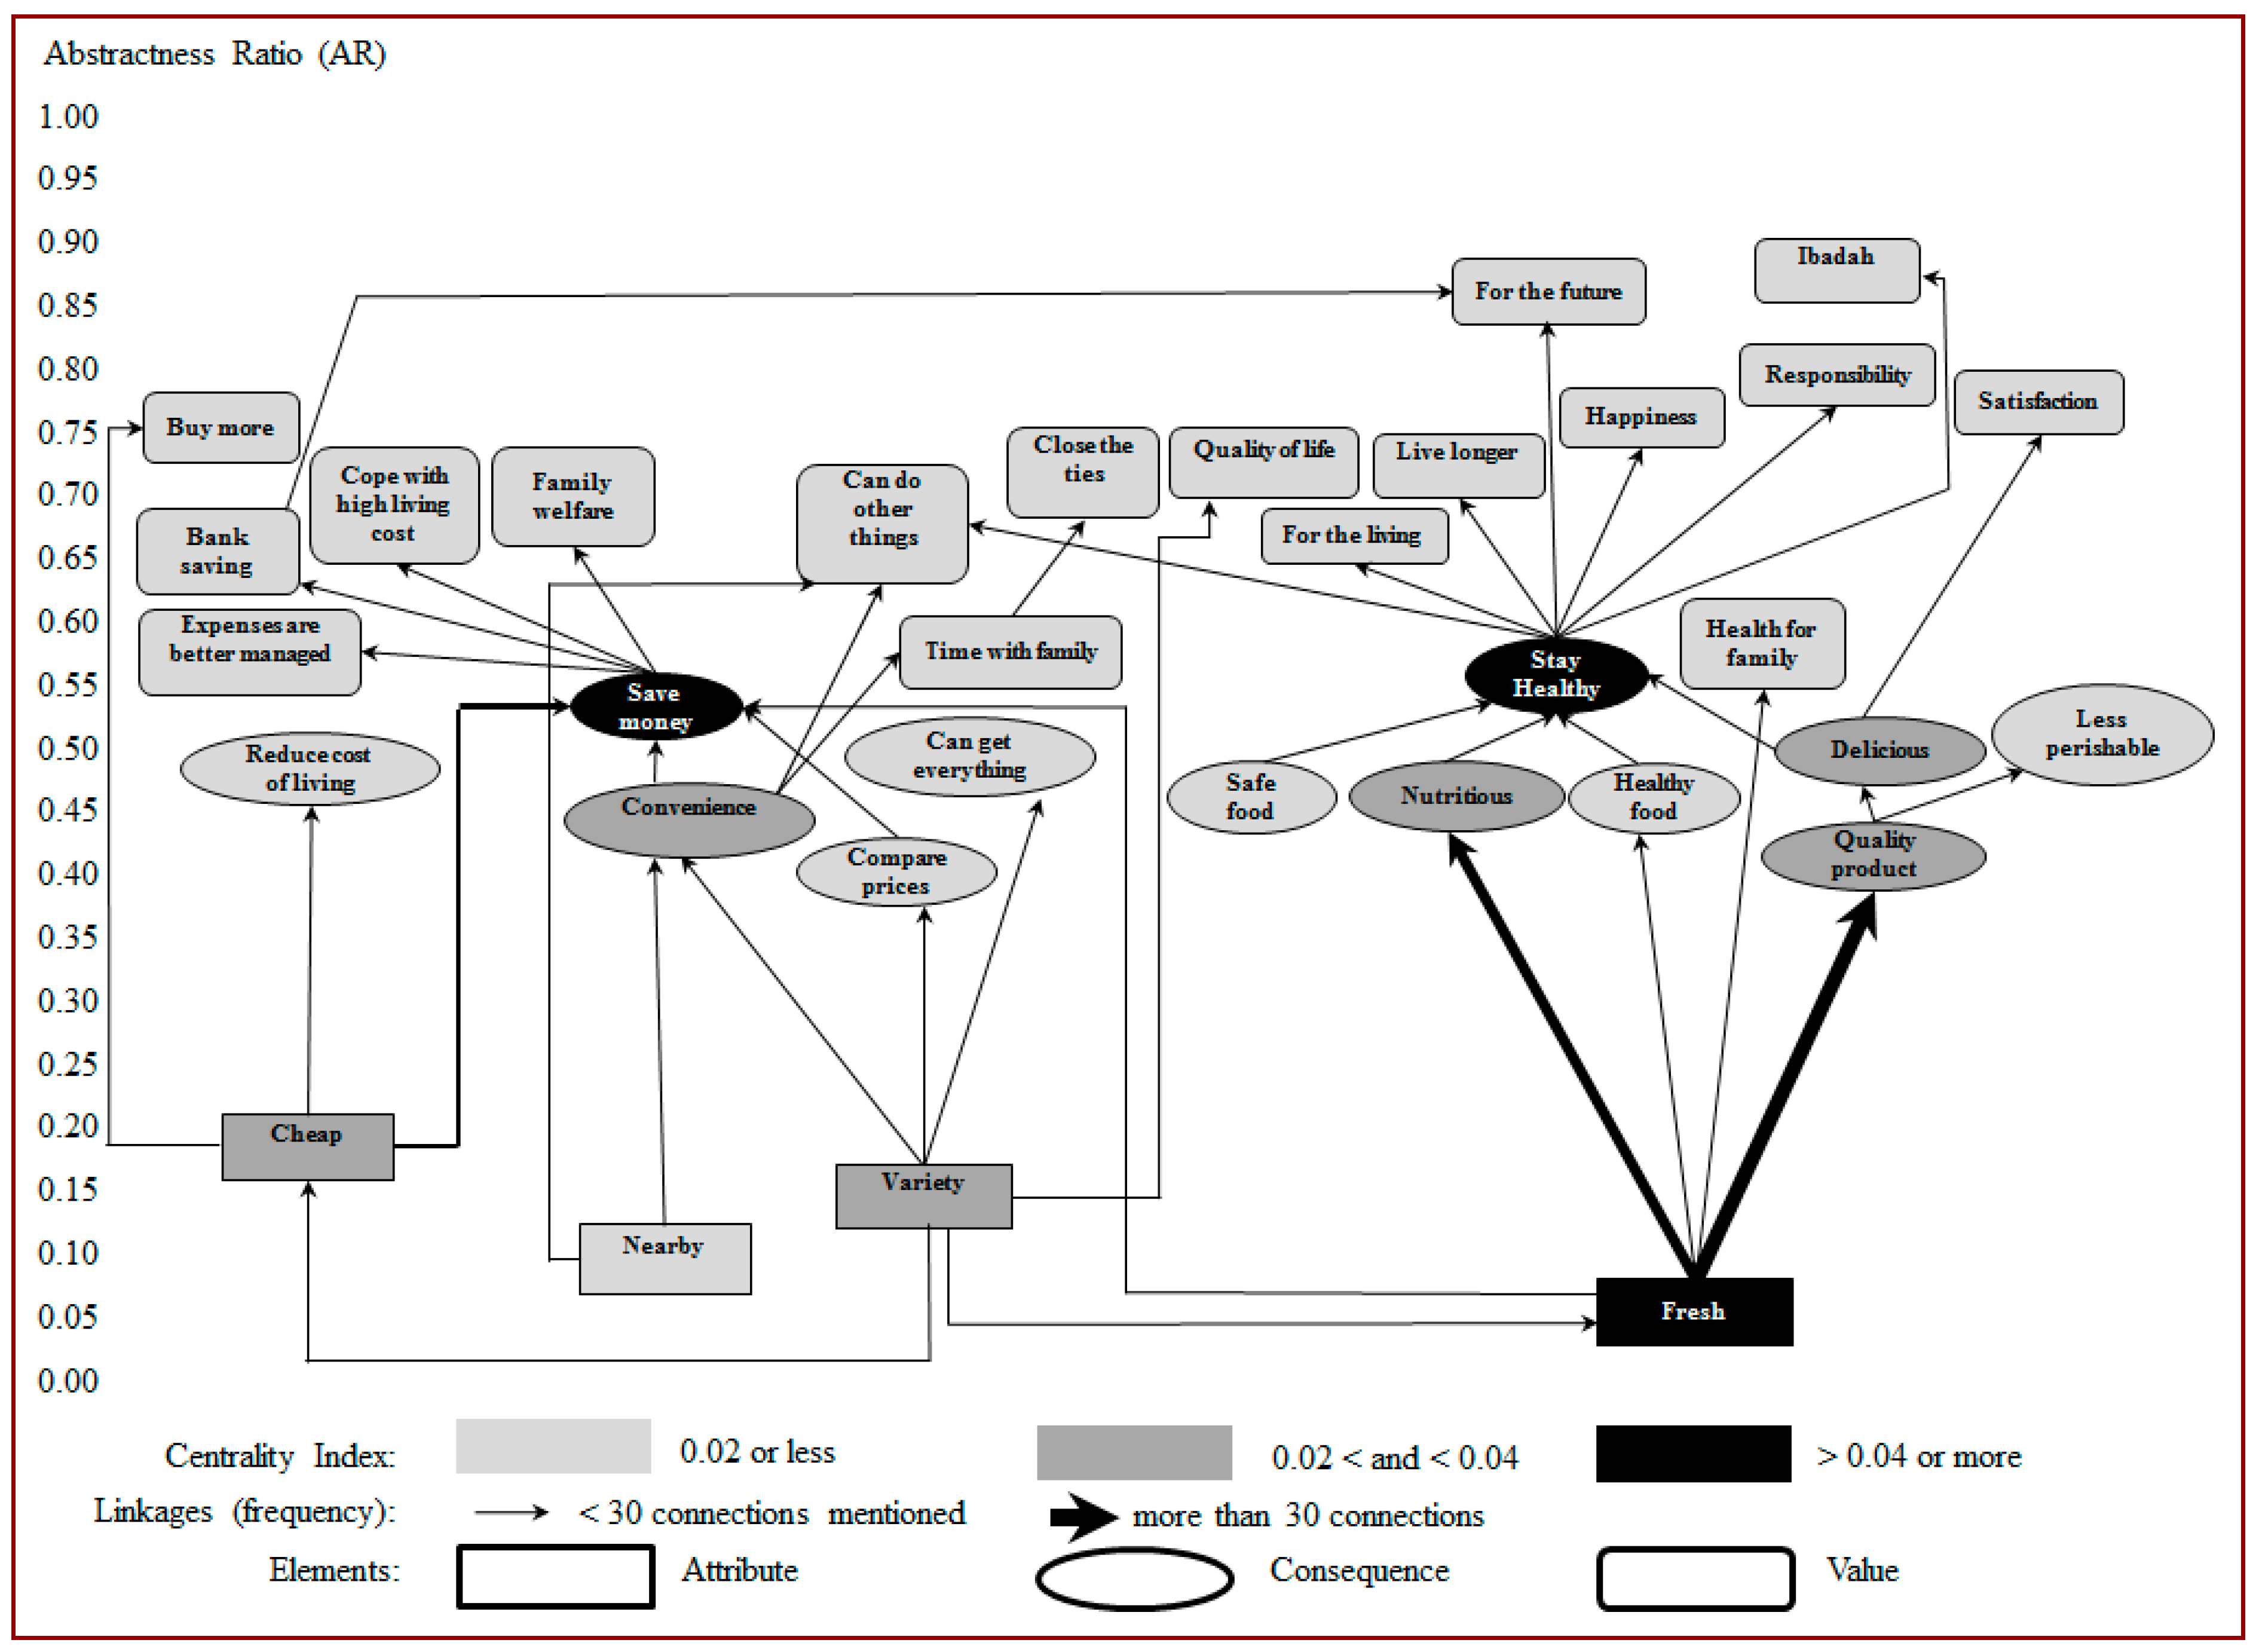
Based on their relative abstractness ratio, they were positioned in the HVM—a cognitive structure of MEC presented in Figure 2. In general, the most concrete elements were located at the bottom of the hierarchy and the most abstract elements at the top. Attributes, consequences, and values are denoted by rectangle, oval, and round cornered rectangle. Light grey boxes represent elements with low centrality indices, while darker grey boxes depict elements with higher centrality indices. Finally, the arrow thickness joining one element to another increases with the frequency of their association.
In general, there are 78 significant pathways departing from elements at the attribute level to elements at the personal values level. Direct and indirect linkages make up these pathways. For example, the indirect pathway traced between the attribute ‘variety’ and the personal value ‘buy more’ consists of two direct linkages made up by the pairing of ‘variety’ and ‘cheap’ and by the pairing of ‘cheap’ and ‘buy more’.
Importantly, as indicated by the thickness of the arrows, six of these significant pathways are worthy of further elaboration. These linkages were among the most frequently mentioned by respondents, suggesting their centrality in the farmers’ markets choice process. The six main pathways are:
- Pathway 1: ‘Fresh’ → ‘quality product’ → ‘nutritious’ → ‘stay healthy’ → ‘live longer’
- Pathway 2: ‘Fresh’ → ‘quality product’ → ‘delicious’ → ‘stay healthy’ → ‘live longer’
- Pathway 3: ‘Fresh’ → ‘save money’ → ‘expenses are better managed’
- Pathway 4: ‘Fresh’ → ‘save money’ → ‘bank savings’ → ‘for the future’
- Pathway 5: ‘Variety’ → ‘cheap’ → ‘save money’ → ‘expenses are better managed’
- Pathway 6: ‘Variety’ → ‘convenience’ → ‘time with family’ → ‘close the ties’
In general, the pathways share some similarities in terms of both means and ends. Pathways 1 and 2, which appear to be the most dominant, begin with the attribute ‘fresh’. The attribute was associated with the consequences ‘quality product’, ‘nutritious’, ‘delicious’, and ‘stay healthy’, which, in turn, links to the personal value ‘live longer’. The dominance of their association in the HVM suggests that shoppers are concerned with hedonic and functional benefits—the most desirable combination in achieving enhanced wellbeing.
Pathways 3, 4, and 5 focus on shoppers’ concerns about freshness and the variety of choice at farmers’ markets. Interestingly, respondents’ attention to these attributes was driven by personal values ‘expenses are better managed’ and ‘for the future’ as two interrelated reasons. The first reflected a focus on product freshness, which minimizes wastage, thus yielding the benefit ‘save money’ since no extra expenditure is necessary for to acquire the required quantity of consumable food. The second involved the opportunity to compare a variety of choices (e.g., across fresh produce and vendors) in order to buy ‘cheap’ and ‘save money’, which was believed to result in boosting ‘bank savings’.
Pathway 6 included the attribute ‘variety’ and the benefits ‘convenience’ and ‘time with family’, which were believed would lead to the personal value of ‘close the ties’. These elements reflect a concern for the convenience or temporal aspects of not needing to travel to another market in order to acquire the desired variety of products. Such extra time commitment potentially detracts from spending quality time with family members.
5. Discussion
This study demonstrates that, the MEC method has proved plausible and offers a viable and additional research approach when researching the motivations underlying retail market choice. In general, past studies have disparately shown that motivation ranges from concrete attributes to relatively abstract consequences, and those personal values have a strong influence on a consumers’ choice for farmers’ markets. The interrelationship of these associations, however, has remained unexplored. Since such interrelationships are critical to consumer choice, the MEC methodology explores a critical gap in our understanding in this area.
The laddering interview technique applied in our study has demonstrated itself a useful tool for enhancing our knowledge of that gap. It has allowed the aggregation of elicited attributes, consequences, and personal values and, importantly, provided a means of illustrating those meanings and relationships that are salient to consumers.
Our study has identified ‘fresh’, ‘nearby’, ‘variety’, and ‘cheap’ as important attributes of farmers’ markets in Malaysia. American consumers also perceived fresh produce as a primary reason for attending farmers’ markets [15,16,17]. Coming directly from the farm, farmers’ markets improve consumers’ access to fresh produce, at lower costs. Farmers’ markets were preferred over supermarkets by more than 70% of Alabama consumers for both the attributes ‘fresh’ and ‘cheap’ [25]. Although shopping convenience has generally been regarded as an attribute [15,25], it was identified as a consequence preceding the attributes ‘nearby’ and ‘variety’ in our study. This suggests that both proximity and heterogeneous offering affect perceived convenience.
These findings demonstrate the existence of different degrees of abstraction among elements and their interrelationships. This is important since motivations are treated equally and homogenously, and posited to directly affect preference, as have occurred in past studies. Such differentiation becomes clear when we climb the cognitive ladders discovered in this study. Our application of the MEC approach revealed that patronage of farmers’ markets is undertaken to satisfy values. Our findings indicate that farmers’ markets are chosen for the values that the associated attributes can help achieve, not for the attributes per se. Consider, in this context, the main path of the primary attribute ‘fresh’, which was found to indirectly lead to the value ‘live longer’ through health benefits associated with its resultant quality.
In that main cognitive ladder, the consequence ‘quality product’ was dominantly derived from the attribute ‘fresh’. By contrast, in the literature, product quality is generally described through multiple attributes without distinction. It has been posited to influence patronage decisions directly (i.e., [18,19,20]). In our study, the consequence ‘quality product’ was perceived as being ‘nutritous’ and ‘delicious’. When put in relative terms, the demand for these benefits in the context of farmers’ markets was found to be a greater motivator than of the desire to purchase the equivalent product in a supermarket. In fact, this motivator appears strong enough to offset the less ambient shopping settings of farmers’ markets [18]. We further found that functional and palatable properties are instrumental to ‘stay healthy’ without posing any serious challenge to consumers. Interest in health has also been exhibited to lead consumers to prefer farmers’ markets [29,30]. Improved wellbeing, as perceived by our respondents, could eventually lead them to ‘live longer’.
Since the goal actualization process is demonstrated, personal values can also be interpreted in the light of general personal values reflecting what the patrons of farmers’ markets thought was important in guiding their behavior. The revealed values ‘expenses are better managed’, ‘for the living’, ‘bank saving’, ‘cope with high living cost’, ‘buy more’, ‘for the future’, are related to a self-direction to attain better financial wellbeing. The values ‘quality of life’, ‘satisfaction’, and ‘happiness’ refer to hedonism or self-gratification. The values ‘time with family’, ‘health for family’, ‘family welfare’, ‘close the ties’, and ‘responsibility’ may be ascribed as benevolence whose purpose is to enhance family welfare. The values ‘live longer’ and ‘ibadah’ are related to security and conformity, respectively.
6. Implications and Conclusions
This study demonstrates that MEC, through the use of a structured laddering technique, can be used to uncover the motivations and their relationships underlying consumers’ decisions with respect to shopping at farmers’ markets. Preference for farmers’ markets was based on their perceived attributes (primarily ‘fresh’ and ‘variety’), consequences (primarily ‘stay healthy’ and ‘save money’) associated with these attributes, and desired values (primarily ‘live longer’ and ‘expenses are better managed’) that can be fulfilled through the consequences. They exhibit a hierarchical relationship, with values serving as the major guides directing goal actualization behavior.
Such insights can help management and the vendors at farmers’ markets, using the lens of the consumer’s perspective, to respond to the most desired attributes of the markets. A training program could be organized to make vendors (farmers) aware of consumers’ wants and their meanings to consumers. For example, based on the dominant attributes ‘fresh’ and ‘variety’, management is encouraged to strategize a vendor/product mix. Vendors should be educated on sourcing both food produce variety and the means to keep it fresh.
It should, however, be noted that attributes are just the entry points. By focusing the marketing efforts on attributes, a connection between consumers’ beliefs and their desire to achieve a particular end-state is lost [17]. For example, by sourcing from farmers’ markets, our interviewees predominantly believed that product freshness and quality give rise to health benefits and longevity.
Consequently, insights derived by the application of MEC can be used to evaluate both existing and developing promotion strategies. Additionally, they provide guidance for positioning farmers’ markets For example, marketing communication/advertising programs could be developed to exploit ‘live longer’ and ‘expenses are better managed’ since they are indirectly associated with the farmers’ markets attributes ‘fresh’ and ‘variety’. While scientific evidence is required to validate any health claims, such marketing initiatives would be congruent with consumer predispositions and, therefore, they are likely to be effective.
Policy formulation would also benefit from understanding these hierarchical cognitive ladders with respect to the patronage of farmers’ markets. Priority should be given to considering important attribute-consequence-value paths since consumers hold them as important. For instance, such insight could be used to encourage patronage of farmers’ markets as a means of reducing the household financial burden since there has been a rise in the urban poor population in Malaysia. Based on the consumer perspective, as revealed in our study, farmers’ markets help to improve consumer access to affordable healthy foods, making them relevent in both nutritional enhancement and food security programs.
Nevertheless, we acknowledge the limitations of our work in terms of generalizability since the MEC methodology draws on the implicit cultural, geo-political and spatial background of respondents. Therefore, the MEC knowledge structures uncovered in this study are likely to be differing from one area to the next. As one illustration, the revealed attributes ‘fresh’, ‘nearby’, ‘variety’, and ‘cheap’ that are identified in this study were perceived as the means to achieving self-directed personal values (e.g., ‘expenses are better managed’) and benevolent personal values (e.g., ‘close the ties’). These findings, based on our case study in Klang Valley, differ from those found in developed countries. Attributes like food safety and production processes (e.g., organic and chemical-free) were valued by consumers in Michigan [21] and Illinois [24], respectively. Universalism-led personal values concerning support for the environmental and social sustainability [32] of farmers and for the local economy [16,23] were commonly evident in the West. These obvious differences are attributable to situational effects, such as spatial and geo-political factors, and are inevitable, especially when analyzed through the prism of Maslow’s Hierarchy of Needs. Future research should, therefore, consider the situational effects, since these, in turn, have important implications for enhancing the ability of farmers’ markets’ to better cater for consumer demand in their own context.
Acknowledgements
We would like to thank FAMA officers for sharing insight into farmers’ markets.
Author Contributions
Yeong Sheng Tey and Mark Brindal reviewed literature of farmers’ markets, conceived the research objective and designed the research framework; Chi Teen Teoh and Han Wei Lim designed the questionnaire, supervised data collection, and conducted content analysis; Poppy Arsil performed the MEC analysis; all authors wrote their respective section(s) of the paper and the entire work was aligned by Yeong Sheng Tey.
Conflicts of Interest
The authors declare no conflict of interest.
References
- Govindasamy, R.; Nayga, R.M. Determinants of farmer-to-consumer direct market visits by type of facility: A logit analysis. Agric. Resour. Econ. Rev. 1997, 26, 31–38. [Google Scholar] [CrossRef]
- Sadler, R.C. Strengthening the core, improving access: Bringing healthy food downtown via a farmers’ market move. Appl. Geogr. 2016, 67, 119–128. [Google Scholar] [CrossRef]
- Kahin, S.A.; Wright, D.S.; Pejavara, A.; Kim, S.A. State-level farmers’ market activities: A review of cdc-funded state public health actions that support farmers’ markets. J. Public Health Manag. Pract. 2017, 23, 96–103. [Google Scholar] [CrossRef] [PubMed]
- Brown, C.; Miller, S. The impacts of local markets: A review of research on farmers’ markets and community supported agriculture (csa). Am. J. Agric. Econ. 2008, 90, 1298–1302. [Google Scholar] [CrossRef]
- Federal Agricultural Marketing Authority. Kertas Maklumat Status Pembangunan Pasar Tani Di Bawah Program Pembangunan Usahawan; Federal Agricultural Marketing Authority: Kuala Lumpur, Malaysia, 2009; (In Bahasa Malaysia).
- Federal Agricultural Marketing Authority. Pasar Tani: Pasar Pilihan; Federal Agricultural Marketing Authority: Kuala Lumpur, Malaysia, 2016; (In Bahasa Malaysia).
- Senarai jadual operasi pasar tani. Available online: http://www.fama.gov.my/documents/10157/0aa936d8-8c17-435b-b5d0-a16b4411e102 (accessed on 21 August 2017).
- Federal Agricultural Marketing Authority. Prestasi Nilai Jualan Pasar Tani 1985–2015; Federal Agricultural Marketing Authority: Kuala Lumpur, Malaysia, 2016; (In Bahasa Malaysia).
- Shamsudin, M.N.; Selamat, J. Changing retail food sector in Malaysia. PECC Pac. Food Syst. Outlook 2005, 6, 11–13. [Google Scholar]
- Abdullah, A.M.; Arshad, F.M.; Latif, I.A. The impacts of supermarkets and hypermarkets from the perspectives of fresh fruit and vegetables wholesalers and retailers. J. Agribus. Mark. 2011, 4, 21–37. [Google Scholar]
- Kaliappan, S.R.; Alavi, R.; Abdullah, K.; Zakaullah, M.A. Spillover effects of foreign hypermarkets on domestic suppliers in Malaysia. Int. J. Retail. Distrib. Manag. 2009, 37, 226–249. [Google Scholar] [CrossRef]
- Roslin, R.M.; Melewar, T.C. Hypermarkets and the small retailers in Malaysia: Exploring retailers’ competitive abilities. J. Asia-Pac. Bus. 2008, 9, 329–343. [Google Scholar] [CrossRef]
- Terano, R.; Yahya, R.; Mohamed, Z.; Saimin, S. Factor influencing consumer choice between modern and traditional retailers in Malaysia. Int. J. Soc. Sci. Humanit. 2015, 5, 509. [Google Scholar] [CrossRef]
- Chamhuri, N.; Batt, P.J. Exploring the factors influencing consumers’ choice of retail store when purchasing fresh meat in Malaysia. Int. Food Agribus. Manag. Rev. 2013, 16, 99–122. [Google Scholar]
- Baker, D.; Hamshaw, K.; Kolodinsky, J. Who shops at the market? Using consumer surveys to grow farmers’ markets: Findings from a regional market in northwestern vermont. J. Ext. 2009, 47, 1–9. [Google Scholar]
- Colasanti, K.J.; Conner, D.S.; Smalley, S.B. Understanding barriers to farmers’ market patronage in michigan: Perspectives from marginalized populations. J. Hunger. Environ. Nutr. 2010, 5, 316–338. [Google Scholar] [CrossRef]
- Hunt, A.R. Consumer interactions and influences on farmers’ market vendors. Renew. Agric. Food Syst. 2007, 22, 54–66. [Google Scholar] [CrossRef]
- Elepu, G.; Mazzocco, M. Consumer segments in urban and suburban farmers’ markets. Int. Food Agribus. Manag. Rev. 2010, 13, 1–18. [Google Scholar]
- Varner, T.; Otto, D. Factors affecting sales at farmers’ markets: An iowa study. Rev. Agric. Econ. 2008, 176–189. [Google Scholar] [CrossRef]
- Bond, J.K.; Thilmany, D.; Bond, C.A. Direct marketing of fresh produce: Understanding consumer purchasing decisions. Choices 2006, 21, 229–236. [Google Scholar]
- Conner, D.; Colasanti, K.; Ross, R.B.; Smalley, S.B. Locally grown foods and farmers’ markets: Consumer attitudes and behaviors. Sustainability 2010, 2, 742–756. [Google Scholar] [CrossRef]
- Wolf, M.M.; Spittler, A.; Ahern, J. A profile of farmers’ market consumers and the perceived advantages of produce sold at farmers’ markets. J. Food Distrib. Res. 2005, 36, 192–201. [Google Scholar]
- Conner, D.S.; Montri, A.D.; Montri, D.N.; Hamm, M.W. Consumer demand for local produce at extended season farmers’ markets: Guiding farmer marketing strategies. Renew. Agric. Food Syst. 2009, 24, 251–259. [Google Scholar] [CrossRef]
- Velasquez, C.; Eastman, C.; Masiunas, J. An assessment of illinois farmers’ market patrons’ perceptions of locally-grown vegetables. J. Veg. Sci. 2005, 11, 17–26. [Google Scholar] [CrossRef]
- Onianwa, O.; Mojica, M.; Wheelock, G. Consumer characteristics and views regarding farmers’ markets: An examination of on-site survey data of Alabama consumers. J. Food Distrib. Res. 2006, 37, 119. [Google Scholar]
- Hinrichs, C.C. Embeddedness and local food systems: Notes on two types of direct agricultural market. J. Rural Stud. 2000, 16, 295–303. [Google Scholar] [CrossRef]
- Jarosz, L. Understanding agri-food networks as social relations. Agric. Hum. Values 2000, 17, 279–283. [Google Scholar] [CrossRef]
- Baber, L.M.; Frongillo, E.A. Family and seller interactions in farmers’ markets in upstate new york. Am. J. Altern. Agric. 2003, 18, 87–94. [Google Scholar] [CrossRef]
- Bellows, A.C.; Alcaraz, G.; Hallman, W.K. Gender and food, a study of attitudes in the USA towards organic, local, us grown, and gm-free foods. Appetite 2010, 55, 540–550. [Google Scholar] [CrossRef] [PubMed]
- Zepeda, L.; Li, J. Who buys local food? J. Food Distrib. Res. 2006, 37, 1. [Google Scholar]
- Zepeda, L. Which little piggy goes to market? Characteristics of us farmers’ market shoppers. Int. J. Consum. Stud. 2009, 33, 250–257. [Google Scholar] [CrossRef]
- Delind, L.B. Of bodies, place, and culture: Re-situating local food. J. Agric. Environ. Ethics 2006, 19, 121–146. [Google Scholar] [CrossRef]
- Alkon, A.H. From value to values: Sustainable consumption at farmers’ markets. Agric. Hum. Values 2008, 25, 487–498. [Google Scholar] [CrossRef]
- Byker, C.; Shanks, J.; Misyak, S.; Serrano, E. Characterizing farmers’ market shoppers: A literature review. J. Hunger. Environ. Nutr. 2012, 7, 38–52. [Google Scholar] [CrossRef]
- Arsil, P.; Li, E.; Bruwer, J.; Lyons, G. Exploring consumer motivations towards buying local fresh food products: A means-end chain approach. Br. Food. J. 2014, 116, 1533–1549. [Google Scholar] [CrossRef]
- Roininen, K.; Arvola, A.; Lähteenmäki, L. Exploring consumers’ perceptions of local food with two different qualitative techniques: Laddering and word association. Food Qual. Preference 2006, 17, 20–30. [Google Scholar] [CrossRef]
- Gutman, J. A means-end chain model based on consumer categorization processes. J. Mark. 1982, 46, 60–72. [Google Scholar] [CrossRef]
- Klenosky, D.B.; Gengler, C.E.; Mulvey, M.S. Understanding the factors influencing ski destination choice: A means-end analytic approach. Consum. Behav. Travel. Tour. 1993, 25, 59–80. [Google Scholar]
- Klenosky, D.B. The “pull” of tourism destinations: A means-end investigation. J. Travel. Res. 2002, 40, 396–403. [Google Scholar] [CrossRef]
- Naspetti, S.; Zanoli, R. Do consumers care about where they buy organic products? A means-end study with evidence from Italian data. Mark. Trends Org. Food 21stCentury 2004, 1, 238–255. [Google Scholar]
- Brown, A. Farmers’ market research 1940–2000: An inventory and review. Am. J. Altern. Agric. 2002, 17, 167–176. [Google Scholar] [CrossRef]
- Peter, J.P.; Olson, J.C.; Grunert, K.G. Consumer Behavior and Marketing Strategy; McGraw-Hill London: London, UK, 1999. [Google Scholar]
- Rokeach, M. The Nature of Human Values; Free press New York: New York, NY, USA, 1973; Volume 438. [Google Scholar]
- Schwartz, S.H.; Bilsky, W. Toward a universal psychological structure of human values. J. Personal. Soc. Psychol. 1987, 53, 550. [Google Scholar] [CrossRef]
- Gutman, J. Means–end chains as goal hierarchies. Psychol. Mark. 1997, 14, 545–560. [Google Scholar] [CrossRef]
- Reynolds, T.J.; Gutman, J. Laddering theory, method, analysis, and interpretation. J. Advert. Res. 1988, 28, 11–31. [Google Scholar]
- Russell, C.G.; Busson, A.; Flight, I.; Bryan, J.; van Pabst, J.v.L.; Cox, D.N. A comparison of three laddering techniques applied to an example of a complex food choice. Food Qual. Preference 2004, 15, 569–583. [Google Scholar] [CrossRef]
- Arsil, P.; Li, E.; Bruwer, J. Using means-end chain analysis to reveal consumers’ motivation for buying local foods: An exploratory study. Gadjah Mada Int. J. Bus. 2016, 18, 285–300. [Google Scholar]
- Jervis, M.; Drake, M. The use of qualitative research methods in quantitative science: A review. J. Sens. Stud. 2014, 29, 234–247. [Google Scholar] [CrossRef]
- Grunert, K.G.; Grunert, S.C. Measuring subjective meaning structures by the laddering method: Theoretical considerations and methodological problems. Int. J. Res. Mark. 1995, 12, 209–225. [Google Scholar] [CrossRef]
- Department of Statistics Malaysia. Population Distribution and Basic Demographic Characteristic Report 2010; Department of Statistics: Putrajaya, Malaysia, 2011. Available online: https://www.dosm.gov.my/v1/index.php?r=column/ctheme&menu_id=L0pheU43NWJwRWVSZklWdzQ4TlhUUT09&bul_id=MDMxdHZjWTk1SjFzTzNkRXYzcVZjdz09 (accessed on 10 June 2017).
- Department of Town and Country Planning Selangor State. Selangor State Structure Plan 2035; Menteri Besar Selangor Incorporated: Shah Alam, Malaysia, 2015. Available online: http://eps.mbpj.gov.my/web2015/Draf_RSN_2035.pdf (accessed on 10 June 2017).
- Department of Statistics Malaysia. Household Income and Basic Amenities Survey 2014; Department of Statistics: Putrajaya, Malaysia, 2015. Available online: https://www.dosm.gov.my/v1/index.php?r=column/pdfPrev&id=aHhtTHVWNVYzTFBua2dSUlBRL1Rjdz09 (accessed on 10 June 2017).
- Menteri Besar Selangor Incorporated. Smart Selangor Blueprint; Menteri Besar Selangor Incorporated: Shah Alam, Selamgor, 2016; Available online: http://www.selangorsmartcity2016.com/SmartSelangor.pdf (accessed on 10 June 2017).
- FAMA. Farmer’s Market Entrepreneur Programme. Available online: http://www.fama.gov.my/en/pasar-tani (accessed on 21 June 2017).
- Skymax-DG. MECanalyst Cognitive Consumer Mapping Software User Guide; Skymax-DG: Ancona, Italy, 2006; Available online: http://skymax-dg.com/mecanalyst/bin/MECanalyst_Manual.pdf (accessed on 30 June 2017).
- Olson, J.C.; Reynolds, T.J. Understanding consumers’ cognitive structures: Implications for advertising strategy. Advert. Consum. Psychol. 1983, 1, 77–90. [Google Scholar]
- Pieters, R.; Baumgartner, H.; Allen, D. A means-end chain approach to consumer goal structures. Int. J. Res. Mark. 1995, 12, 227–244. [Google Scholar] [CrossRef]
- Bagozzi, R.P.; Dabholkar, P.A. Discursive psychology: An alternative conceptual foundation to means-end chain theory. Psychol. Mark. 2000, 17, 535–586. [Google Scholar] [CrossRef]
- Leppard, P.; Russell, C.G.; Cox, D.N. Improving means-end-chain studies by using a ranking method to construct hierarchical value maps. Food Qual. Preference 2004, 15, 489–497. [Google Scholar] [CrossRef]
Figure 1.
Farmers’ market sites in the state of Selangor, Malaysia (as of April 2016).
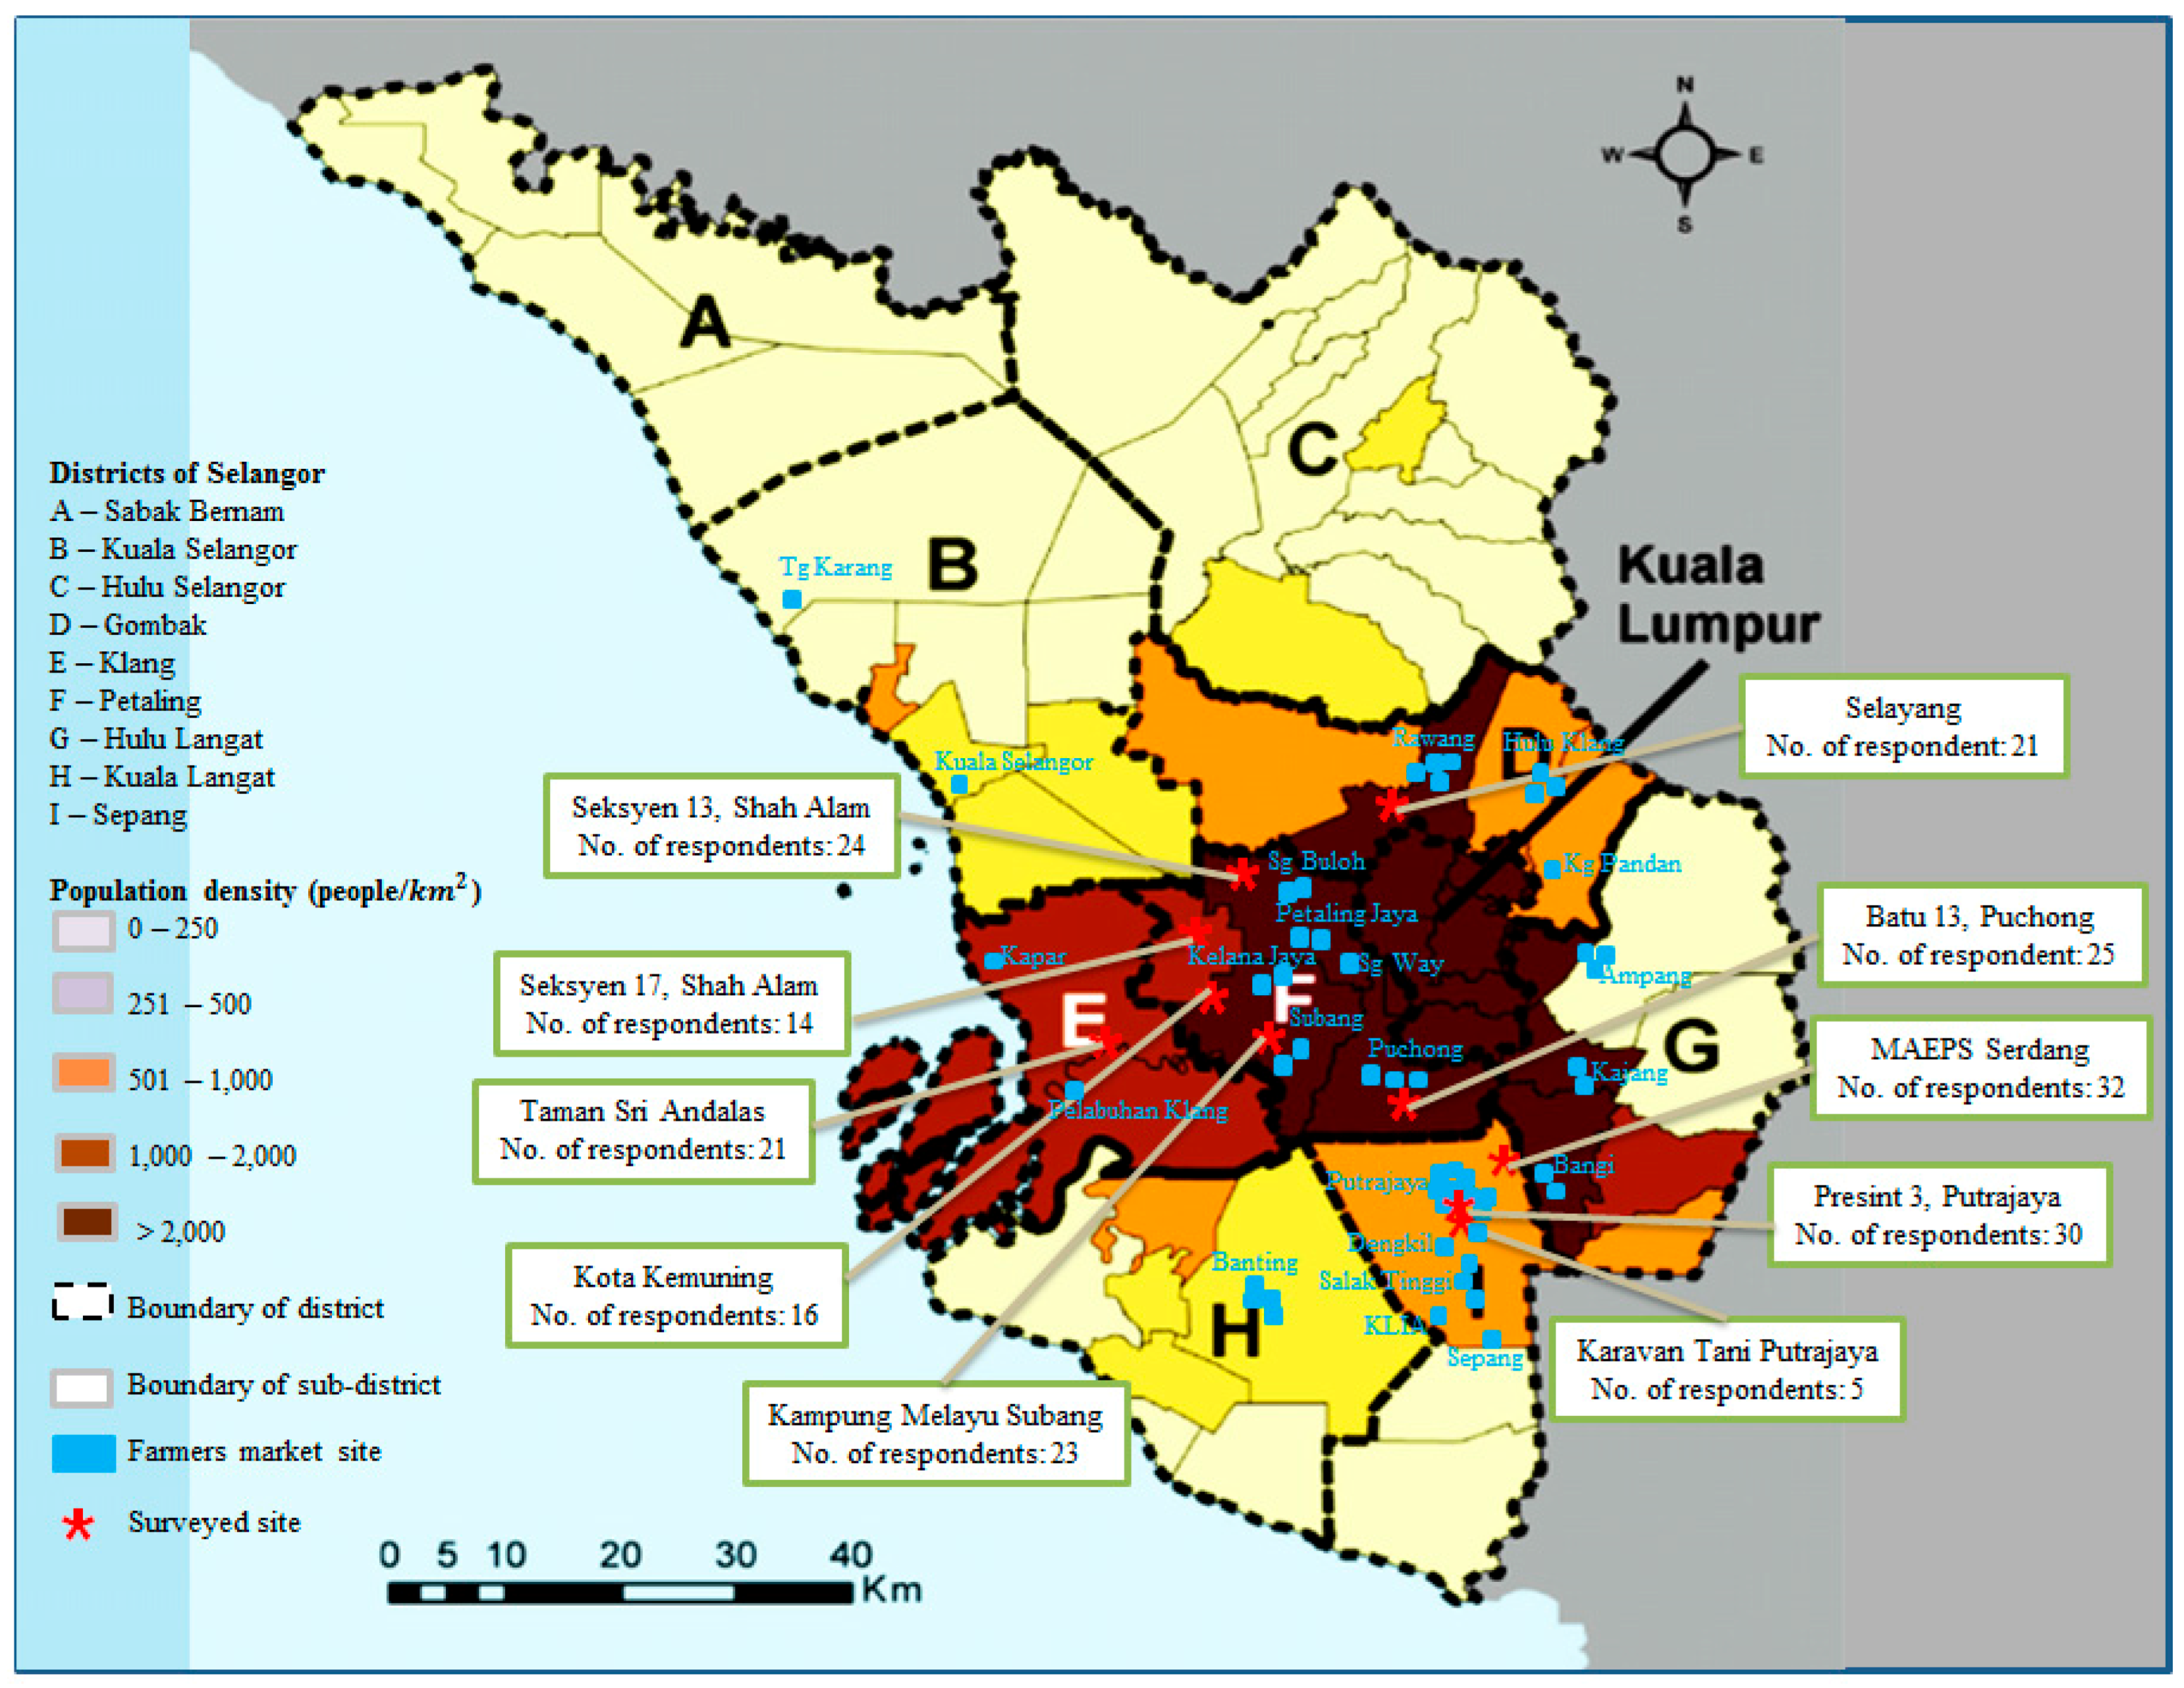
Figure 2.
Hierarchical value map (at cut-off level of 5) for shopping at farmers’ markets.


Table 1.
Demographic profile of respondents (n = 212).
| Item | Percentage |
|---|---|
| Gender | |
| Male | 41% |
| Female | 59% |
| Marital status | |
| Married | 85% |
| Single | 15% |
| Ethnic | |
| Malay | 89% |
| Chinese | 7% |
| Indian | 2% |
| Others | 2% |
| Household income/annum | |
| <RM39,999 | 53% |
| RM40,000–RM59,999 | 24% |
| RM60,000–RM79,999 | 10% |
| RM80,000–RM99,999 | 5% |
| >RM100,000 | 8% |
| Education level | |
| Primary | 4% |
| Secondary | 37% |
| Diploma | 26% |
| Degree | 27% |
| Postgraduates | 6% |
Table 2.
Abstractness ratio (AR) and centrality index (CI) for the 31 elements.
| Categories | Content Elements | Abstractness | Centrality |
|---|---|---|---|
| Attributes | Fresh | 0.10 | 0.09 |
| Nearby | 0.13 | 0.02 | |
| Variety | 0.16 | 0.04 | |
| Cheap | 0.20 | 0.04 | |
| Consequences | Compare prices | 0.42 | 0.02 |
| Quality product | 0.43 | 0.05 | |
| Convenience | 0.46 | 0.03 | |
| Safe food | 0.50 | 0.01 | |
| Healthy food | 0.50 | 0.01 | |
| Nutritious | 0.50 | 0.04 | |
| Reduce cost of living | 0.50 | 0.02 | |
| Delicious | 0.53 | 0.03 | |
| Can get everything | 0.53 | 0.01 | |
| Less perishable | 0.55 | 0.02 | |
| Save money | 0.55 | 0.08 | |
| Stay Healthy | 0.58 | 0.10 | |
| Personal values | Expenses are better managed | 0.61 | 0.02 |
| Time with family | 0.61 | 0.02 | |
| Health for family | 0.62 | 0.01 | |
| For the living | 0.67 | 0.01 | |
| Bank saving | 0.68 | 0.02 | |
| Cope with high living cost | 0.72 | 0.01 | |
| Family welfare | 0.74 | 0.01 | |
| Live longer | 0.74 | 0.02 | |
| Close the ties | 0.75 | 0.01 | |
| Quality of life | 0.75 | 0.01 | |
| Buy more | 0.78 | 0.01 | |
| Happiness | 0.78 | 0.01 | |
| Satisfaction | 0.79 | 0.02 | |
| Responsibility | 0.82 | 0.01 | |
| For the future | 0.89 | 0.01 | |
| Ibadah (obedience, submission, and devotion to Allah) | 0.90 | 0.01 |
© 2017 by the authors. Licensee MDPI, Basel, Switzerland. This article is an open access article distributed under the terms and conditions of the Creative Commons Attribution (CC BY) license (http://creativecommons.org/licenses/by/4.0/).
Share and Cite
MDPI and ACS Style
Tey, Y.S.; Arsil, P.; Brindal, M.; Teoh, C.T.; Lim, H.W. Motivations Underlying Consumers’ Preference for Farmers’ Markets in Klang Valley: A Means-End Chain Approach. Sustainability 2017, 9, 1958. https://doi.org/10.3390/su9111958
AMA Style
Tey YS, Arsil P, Brindal M, Teoh CT, Lim HW. Motivations Underlying Consumers’ Preference for Farmers’ Markets in Klang Valley: A Means-End Chain Approach. Sustainability. 2017; 9(11):1958. https://doi.org/10.3390/su9111958
Chicago/Turabian StyleTey, Yeong Sheng, Poppy Arsil, Mark Brindal, Chi Teen Teoh, and Han Wei Lim. 2017. "Motivations Underlying Consumers’ Preference for Farmers’ Markets in Klang Valley: A Means-End Chain Approach" Sustainability 9, no. 11: 1958. https://doi.org/10.3390/su9111958
Note that from the first issue of 2016, this journal uses article numbers instead of page numbers. See further details here.