Safety-Culture Exploration in Taiwan’s Metal Industries: Identifying the Workers’ Background Influence on Safety Climate

1
Department of Industrial Management, National Taiwan University of Science and Technology, 43, Keelung Road, Da’an District, Taipei 106, Taiwan
2
Department of Industrial Engineering, Telkom University, Telekomunikasi Terusan Buah Batu, Bandung 40257, Indonesia
3
Department of Business Management, Institut Teknologi Sepuluh Nopember (ITS), Surabaya 60111, Indonesia
*
Author to whom correspondence should be addressed.
Sustainability 2017, 9(11), 1965; https://doi.org/10.3390/su9111965
Submission received: 14 September 2017
/
Revised: 21 October 2017
/
Accepted: 24 October 2017
/
Published: 28 October 2017
Abstract
:The present study aims to assess the safety-climate level in Taiwan’s metal industries, as well as to identify the influence of workers’ backgrounds on the safety climate. An earlier report showed that a poor safety culture was related to the cause of accidents in Taiwan’s traditional manufacturing industries. This study surveyed a total of 839 workers who voluntarily participated and completed the safety-culture questionnaires. These workers were from a Taiwanese metal company and its five satellite companies. Three safety-climate factors, namely safety perception, safety communication and safety-management systems, were assessed. Confirmatory factor analysis (CFA) was conducted by developing structural equation modeling to ensure the questionnaire’s validity. The influence of workers’ backgrounds on the safety climate was identified by using one-way ANOVA. The reliability result of the questionnaire was above the acceptable level. The overall safety-climate score was 4.22 out of a five-point scale for safety perception, 4.23 for safety-management systems and 3.97 for safety communication. The scores indicate a good level of safety climate, with room for improvement in safety communication. Additionally, the influence of workers’ backgrounds on the safety climate was confirmed. Based on the validity test, it was also found that the questionnaire could be improved by reconstructing its questions in its development process in order to increase the safety-climate model’s reliability and validity, as well as its model fit.
1. Introduction
Occupational accidents are serious issues in Taiwan’s traditional manufacturing industries. It is mentioned in the Industrial Safety and Health Association of the R.O.C Taiwan (ISHA), where the most-recent annual report in 2017 reported that the rate of occupational accidents in 2015 was 3.191 among 1000 full-time equivalent workers in Taiwan [1]. This rate has slowly reduced from five years ago, where the accident rate was 4.176 among 1000 full-time equivalent workers. However, this reduction is far from the zero-accident goal that has been campaigned by ISHA since 2006, which was more than a decade ago.
Recently, more attention has been devoted to safety culture [2] as researchers proved that safety culture is related to accident occurrence [3]. Since it has been known by scholars that many accidents, especially the high-profile ones, were caused by poor safety culture [4], the Taiwanese government was motivated to improve Taiwan industries’ safety culture. Vinodkumar and Bhasi’s study [5] addressed the idea that a valid and reliable safety-culture scale is applicable for predicting safety outcomes and behavior. Such findings motivated researchers to develop various questionnaires to assess organization safety culture [6]. Developing a safety culture questionnaire is, hence, becoming a critical role in helping to accomplish ISHA’s zero-accident goal in Taiwan. This research aims to assess the safety-climate level in Taiwan’s metal industries as well as to identify the influence of workers’ background towards safety climate. The expected result from this study is the recommended strategy to improve the safety climate level in Taiwanese industries.
2. Theoretical Background
2.1. Safety Culture and Safety Climate Assessment
Another term that is commonly used to replace “safety culture” in studies is “safety climate”. According to many studies, safety culture and safety climate are often used interchangeably [7,8] since both concepts have the same goal to accomplish [9]. On the other hand, some researchers stated that safety culture has a different approach compared to safety climate [9,10,11]. As a result, different approaches led to different interpretations among researchers regarding the use of either safety culture or safety climate in the studies.
The safety-culture concept gained its publicity since the occurrence of the Chernobyl accident [7,12,13,14,15]. Since then, safety culture has become a highly considered issue in many accident investigations. However, culture is something too complex to be interpreted easily. It is more than an individual agreement and even more than the sum of individual attitudes, since it is an interconnected system [16].
By referring to Schein’s concept of levels of safety [17,18], Guldenmund [9] stated that safety culture consists of three layers: artefacts, a layer that is visible (e.g., logo, dress code, personal protective equipment); espoused values, a layer that is conscious and explicit (e.g., formal statements, policies, minutes of meetings); and basic assumptions, a layer that is implicit (e.g., risky behaviors likely shown by the workers). Those three layers explain the complexity of cultures. Guldenmund [9] also pointed out that safety-culture study has three main approaches: the academic approach (past state), pragmatic approach (future state) and analytical approach (present state). The academic approach uses ethnography methods to describe a culture of an organization in the past. The pragmatic approach is grounded in expert judgment and experiences and is directed to change the future of organizations. The analytical approach uses a self-administered questionnaire to capture a snapshot of the present safety state in an organization. On the other hand, the organizational culture analysis methods also ranged from thorough and time-consuming ethnography to simple quantitative questionnaire surveys [19]. The questionnaire has some limitations for capturing every aspect of the safety culture [17], since predicting safety culture in a survey is not easy [20]. However, the questionnaire does show shared attitudes [11]. This indicates that the questionnaire is able to capture parts of cultures.
According to some researchers, safety climate is a distinct concept compared to safety culture. Kennedy and Kirwan [10] stated that safety culture is an abstract concept and safety climate expresses safety culture in a more tangible way. In general, safety climate, as the safety-culture’s snapshot, is often used in research due to safety-culture complexity [5,10]. Thus, some literature merely focuses on using the questionnaire to assess safety climate. Mearns and Flinn [8] mentioned that safety climate is assessed by using a questionnaire that measures the current safety state. Kjestveit et al. [21] also pointed out that a questionnaire is a commonly used tool to assess the safety climate and that there is an increasing popularity of using a questionnaire in assessing the safety climate in the industry. This research takes the subtle differences between safety culture and safety climate into consideration. In the next parts of this research, further use of the term “safety climate” will occur more often.
Assessing safety climate in an organization leads to good safety outcomes and behaviors [22,23,24]. Hence, it is important to assess the safety climate in Taiwan’s high-risk industries, including metal industries, as the focus point of this research. Prior to the safety-climate assessment analysis, the questionnaire validity and reliability need to be confirmed, since, according to Kines et al. [25], it is important for safety-climate questionnaires to be valid and reliable. There are not many valid and reliable safety-climate questionnaires with clear theoretical bases.
2.2. Workers’ Backgrounds Influence Identification of Safety-Climate Factors
Safety-climate studies have focused extensively on identifying the safety-climate relationship with its moderators, antecedents, mediators or other constructs [26]. Many studies indicate that workers’ backgrounds had influence on safety climate. Zohar [27] studied whether better understanding of group differences can facilitate the implementation of an effective culture change program. Wu et al. [28] examined the influences of organization, gender, job title, training and worksite on the safety climate in universities. Findley et al. [29] explored the safety climate among different job positions in a nuclear decommissioning and demolition industry. Probst et al. [30] studied workers’ backgrounds and safety climate in the construction industry. Vinodkumar and Bhasi [5] investigated workers’ backgrounds and safety climate in the chemical industry in India. Beus et al. [31] explored the safety climate among workers with different socialization levels in chemical processing and manufacturing industries. Luria and Yagil [23] investigated the safety-climate perception between permanent employees and temporary employees in metal, chemical, food, plastic and aviation industries. Milijic et al. [32] examined the safety climate of workers from various manufacturing industries. In a nutshell, different studies chose different ranges of workers’ background information alongside various safety-climate or safety-culture scales. The targeted industry and country of interest also varied. Nevertheless, many of these studies’ hypotheses have a common ground. They are either replicated or were extended from similar studies. As Findley et al. [29] and Atchley et al. [33] pointed out, better understanding of the different levels of safety perceptions among different groups inside an organization can facilitate more effectively the implementation of safety-culture change programs in the organization.
2.3. Purposes and Hypotheses
Based on the extensive literature review mentioned in Section 2.2, there is still no research related to assessing the safety climate in Taiwan’s metal industries. The purposes of this research are not only to explore Taiwan’s metal industries’ safety climate but also to identify workers’ background influence on the safety climate. As a result, the authors formulated each of the following hypotheses rigorously based on the above literature studies:
Hypothesis 1.
There is a significant difference in the safety-climate perception among workers of different genders.
Hypothesis 2.
There is a significant difference in the safety-climate perception among workers of different job positions.
Hypothesis 3.
There is a significant difference in the safety-climate perception among workers with different job attributes.
Hypothesis 4.
There is a significant difference in the safety-climate perception among workers who work in different organizations.
Hypothesis 5.
There is a significant difference in the safety-climate perception among workers with different statuses.
Hypothesis 6.
There is a significant difference in the safety-climate perception among workers with different numbers of training sessions.
3. Materials and Methods
3.1. Questionnaire
The questionnaire was developed by ISHA and the Foundation of Taiwan Industry Service (FTIS), and was funded by the Industrial Development Bureau of the Taiwan Ministry of Economic Affairs. The questionnaire consists of two parts. The first part of the questionnaire captures safety-climate information. There are three safety-climate factors: safety perception, which consists of nine items; safety communication, which consists of seven items; and safety-management systems, which consists of nine items. The second part of the questionnaire captures workers’ background information. Six elements of workers’ background information were included: gender; job position; job attribute; organization; status; and number of training sessions. A five-point Likert scale was used to capture the safety-climate variables in the questionnaire, ranging from 1 as ‘strongly disagree’ to 5 as ‘strongly agree’. Another five-point Likert scale with designated cognitive interpretations was used for specific questions that were marked with the ‘*’ sign. Specifically speaking, in this five-point scale: 1 means ‘there is no awareness among the workers’; 2 means ‘the workers are aware of the safety-culture program but they don’t do any action’; 3 means ‘the safety culture-related programs have been implemented but the improvement results are not visible’; 4 means ‘the safety culture-related programs have been set, but the positive impact was not visible in the past year’; and 5 means ‘the related programs have been implemented, and the results are satisfying’. The five-point Likert scale is the most-common measuring scale that is used in safety-climate questionnaires [5,23,32]. An average score that is higher than 3 (a neutral response) is considered as a positive or good safety climate [34]. A five-point Likert scale was suggested to have better data quality, reliability and discriminant validity compared to a four-point-type Likert scale [35].
3.2. Participants and Procedure
A revised questionnaire that was better fit for the metal industry was distributed directly to the company workers. The assessed company is one of the largest of Taiwan’s metal companies. The company is listed in Taiwan’s top 1000 enterprises [36] and plays a leading role in Taiwan’s metal-industry sector. The company employs more than 3500 workers as of 2016 [37]. A total of 839 workers (792 males and 47 females) voluntarily participated in the survey of this study. All participants have a minimum 6th-grade educational diploma or certificate. As shown in detail in Table 1, Respondent Demographics, the term of “workers” in this study represents all levels of full-time employees, which include executives, middle managers, site supervisors and frontline workers. The workers’ backgrounds consist of workers’ gender, job position, job attribute, organization, status and extent of training. None of the female participants are frontline workers. These participants came from the company’s main campus, as well as from its five satellite (subsidiary) companies that are located in different cities. We abbreviated these satellite companies as Satellite Company 1 through Satellite Company 5.
3.3. Statistical Analysis
Due to some missing data in the questionnaire as a result of unfilled questions, multiple imputations as the general solution for missing data [38] were used to fulfill the values for the missing data. Confirmatory factor analysis (CFA) was conducted by using structural equation modeling (SEM) with Analysis of Moment Structure (AMOS) 20 software package to ensure the validity of the questionnaire. The internal consistency reliability was calculated by using SPSS 17. Furthermore, Cronbach’s alpha test was used to measure the reliability of the questionnaire. The safety-climate scores were obtained by calculating the mean value for each safety-climate factor included in the questionnaire. To identify the influence of workers’ background on safety climate, one-way analysis of variance (one-way ANOVA) was used in this study. Post-hoc testing was also conducted to draw a more-precise finding if the ANOVA resulted in a statistically significant difference among the studied groups, although such a test was rarely used in many similar safety-climate researches, the latter of which merely drew their conclusions based on one-way ANOVA.
4. Results
The questionnaire response retrieved from the 839 workers of the metal company resulted in a fairly representative sample. The respondents’ demographics information is presented in Table 1.
4.1. Questionnaire Validation and Safety-Climate Assessment
The three proposed safety-climate factors were tested by CFA by using SEM with multiple-factor models as previously researched in [39]. The model assumes that each factor represents the safety climate. The safety-climate factors in this model are connected to each other by using the covariance symbols, which indicate the un-analyzed association, or no effect of the direction is implied [40]. This model was tested in SEM with the assumption that all exogenous variables are covaried. In SEM, the factors are allowed to be covaried if each of them has at least three indicators (items) [40]. The multiple-factors model was used because this research only focused on testing the validity of the three proposed safety-climate factors.
According to Huang et al. [39], the CFA was adopted to confirm the safety-climate scale construct validity. It is stated by Hair et al. [41] that CFA measures the construct validity and goodness-of-fit of the model. The construct validity is confirmed through convergent validity and discriminant validity. The goodness-of-fit index examines the model quality.
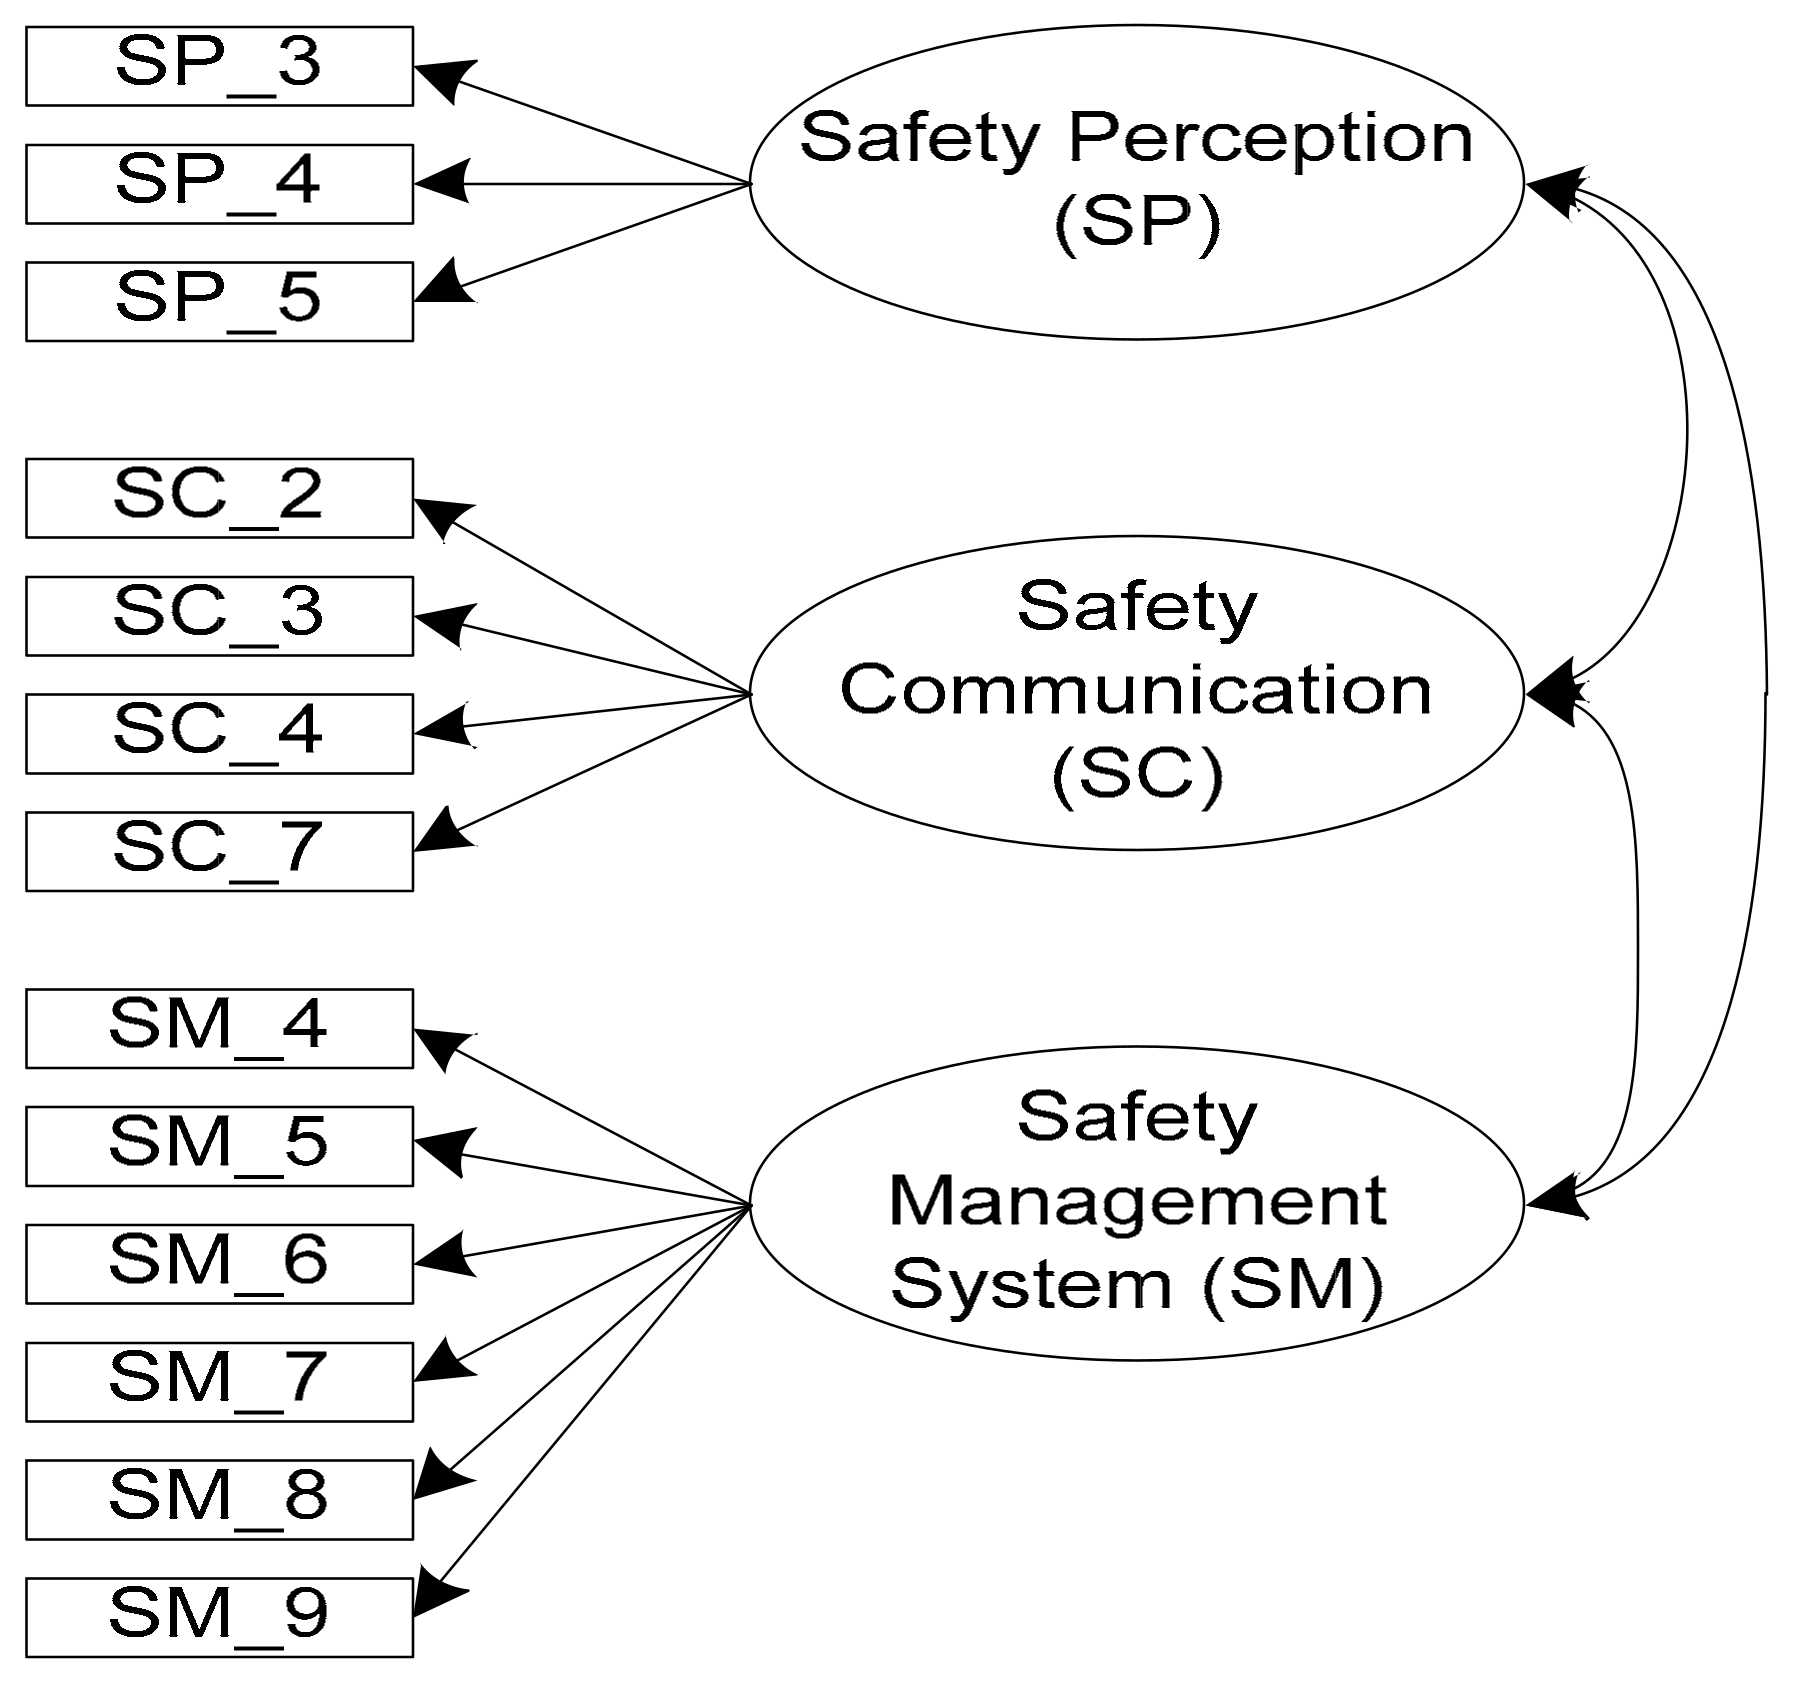
In the CFA test, items with low factor loading (<0.6) need to be removed [42]. As a result, 13 out of 25 items were retained in this study. These items include three items for safety perception, four items for safety communication and six items for safety-management systems. The constructed multiple-factor safety-climate model is shown in Figure 1 and is itemized in Table 2.
Two criteria are used for examining the convergent validity: construct reliability (CR) (>0.7) and average variance extracted (AVE) (>0.5) [41]. According to [41], CR confirms the internal consistency of the measures of a construct in representing that same construct. On the other hand, AVE is the convergence summary indicator regarding a set of construct items [41,43].
Hair et al. [41] mentioned that the threshold for the value of the factor loading is 0.5, or 0.7 for an ideal factor loading. When the factor loading is above 0.5, it indicates that the item has a high correspondence with its associated factor. As illustrated in Table 3, only one item’s value of the factor loading (0.697) was below 0.7, while all of the other 12 items’ values were above 0.7. The resulting Cronbach’s alpha scores indicated a good questionnaire reliability since its scores for all three safety-climate factors were above the threshold value of 0.7 [41,44,45,46,47]. By ensuring questionnaire reliability, the measured construct consistency is confirmed. This indicates that the questionnaire with the 13 retained items is an appropriate mechanism to measure safety climate. Furthermore, the resulting value of CR and AVE of the proposed model were also good because they were above the thresholds [41,44,45,46,47] (0.7 for CR and 0.5 for AVE).
Another measure to confirm construct validity is discriminant validity [41], which indicates one construct or one factor is distinctive from the other construct or factor in the model. It is tested by comparing the AVE score to the squared interconstruct correlation (SIC) score. If AVE is higher than SIC, which can be seen in Table 4, the discriminant validity of the model is confirmed.
Researchers have different preferences regarding the use of the model-fit indices. Vinodkumar and Bhasi [5] recommended the use of (χ2/df), root-mean-squared error of approximation (RMSEA), comparative fit index (CFI) and the Tucker–Lewis index (TLI) in their research with a large sample size. Additionally, goodness-of-fit (GFI) and standardized root-mean-residual (SRMR) are considered as two of the most widely used indices [49]. Hox and Bechger [50] used the adjusted goodness-of-fit (AGFI) as one of the fit indices for model complexity [50]. Each fit index has its threshold value. Researchers sometimes have a degree of variation regarding the threshold value used for fit indices. This study used all of the above-mentioned seven fit indices to test the proposed model’s goodness-of-fit, and the results are shown in Table 5.
Chi-square is used to evaluate the overall model fit [51] due to the chi-square sensitivity towards the sample size [59]; the relative chi-square (χ2/df) was preferred to be used in this study. The χ2/df obtained in this study is 3.853, which is acceptable [51,52,53]. Higher CFI and TLI mean higher fit on the correspondence data. The CFI and TLI obtained in this study are 0.970 and 0.962, respectively. Since they pass the threshold of 0.9 [41,44,58] and 0.95 [51], respectively, the goodness-of-fit is confirmed. RMSEA indicates the appreciative error regarding the population’s expected degree of freedom. The RMSEA obtained in this study is 0.058, which is acceptable because it is under 0.08 [51,57]. The SRMR is an alternative test statistic based on residuals [41]. The SRMR obtained in this study is 0.003 and is acceptable because it is under 0.08 [51,56]. The GFI, as an early attempt to produce a fit statistic, and AGFI as the GFI adjustment for a more complex model [50], are both acceptable in this study as they both are above 0.9 [41,51,54,55].
Table 6 shows the safety-climate level based on the final safety-climate model. Since the mean score for safety perception, safety communication and safety management is 4.22, 3.97 and 4.23, respectively, it shows a good level of safety climate based on similar safety-climate studies [5,23,32,34,35]. Furthermore, more attention should be directed to this safety communication because of its lower score compared to the other two factors.
4.2. Identifying Workers’ Background Influence on Safety Climate
All six proposed hypotheses were tested by using one-way ANOVA to investigate the relationship of workers’ background towards safety climate.
(1) Workers’ gender and safety climate
When workers were categorized based on gender, one-way ANOVA results in Table 7 show that the workers’ perception of safety communication statistically differs between females and males, with the females’ average value of 4.215 vs the males’ average value of 4.051.
(2) Workers’ job position and safety climate
Workers were categorized into four groups based on job position (executives, middle managers, site supervisors, frontline workers). One-way ANOVA results show that for all three safety-climate factors, there are differences among workers’ job position. As can be seen in Table 8, there is an indication that safety-climate scores decrease when the job position lowers from the executive group to the frontline workers’ group.
Since the one-way ANOVA test was significant, a post-hoc test was conducted to perform a pairwise comparison among the four groups to confirm the findings. While pairwise comparisons showed a mixed result among the four different groups, it did strongly indicate that for all three safety-climate factors, group 1 (executive) has a higher score than the scores of group 4 (frontline worker).
(3) Workers’ job attribute and safety climate
Workers were categorized into seven groups based on job attribute (operation, maintenance, R&D, transport and storage, industrial safety and environmental protection, administrative management, and other). One-way ANOVA results in Table 9 show that for any of the three safety-climate factors, there are no significant differences among the job attribute groups.
(4) Workers’ organization vs safety climate
Workers were categorized into six groups based on organization (main company, satellite company 1–satellite company 5). One-way ANOVA results in Table 10 show that for all three safety-climate factors, there are significant differences among the six organization groups.
Since the one-way ANOVA test was significant, a post-hoc test was conducted to perform a pairwise comparison among the six groups. While pairwise comparisons showed a mixed result among the six different groups, they did strongly indicate that for all three safety-climate factors, which include safety perception, safety communication and safety-management systems, group 2 (satellite company 1) has the highest scores compared to group 1 (main company), group 3 (satellite company 2), group 5 (satellite company 4) and group 6 (satellite company 2). On the other hand, group 3 (satellite company 2) has the lowest scores compared to group 1 (main company), group 2 (satellite company 1) and group 5 (satellite company 4).
(5) Workers’ status and safety climate
Workers were categorized into two groups based on workers’ status (main-company workers, satellite-company workers). One-way ANOVA results in Table 11 show that for safety perception and safety-management systems, main-company workers differ from the satellite-company workers. While satellite-company workers had higher safety-perception scores, their safety-management systems scores were actually lower.
(6) Number of training sessions and safety climate
Workers were categorized into four groups based on the number of in-house training sessions they received from the qualified safety and hygiene professionals (never, once, twice, three times, four times or more). One-way ANOVA results in Table 12 show that for all three safety-climate factors, there are significant differences in terms of the number of training sessions. For the safety-management system, the safety-climate score increases with the number of training sessions received.
Since the one-way ANOVA test was significant, a post-hoc test was conducted to perform a pairwise comparison among the six groups. While pairwise comparisons showed a mixed result among the five different groups, they did strongly indicate that for all three safety-climate factors, group 1 (no training) has a lower score than group 4 (three-times training) and group 5 (four-times-or-more training).
5. Discussion
This research explored the safety culture of Taiwan’s metal industries by conducting a safety-climate assessment in a large Taiwan metal company and its five subsidiary companies with a questionnaire developed by the Taiwanese government. The proposed safety-climate model was validated by using the confirmatory factor analysis conducted in Analysis of Moment Structure (AMOS) 20 statistical software package. One-way ANOVA was used to identify the influence of workers’ backgrounds on the safety climate.
Three safety-climate factors, namely safety perception, safety communication and the safety-management system, were examined: six types of workers’ background information, which included gender, job position, job attribute, organization, status, and number of training instances, were analyzed regarding their influences towards the safety climate. This study has two main findings: the first finding is that the proposed safety-climate model was validated; the second finding is that five out of the six types of workers’ backgrounds have influences on the safety climate.
5.1. Questionnaire Validity and Reliability Investigation
Ensuring the reliability and validity of the safety-climate questionnaire is critical [5]. A reliable and valid questionnaire gains an advantage over the traditional safety measures [12].
As per the CFA result, the proposed safety-climate model retains 13 out 25 questions to assert the model’s reliability and validity. Such model adjustment is common in that there is no common ground on the ideal number of safety-climate factors [32], which varies significantly among different industries.
5.2. The Evaluation of the Safety-Climate Questionnaire-Development Process
The original safety-culture questionnaire is a general questionnaire for Taiwan industries. Hence, it can be, and should be, modified by safety professionals to fit the industry that is to be investigated. This study’s first author and members of FTIS discussed with the organization’s safety and hygiene department and revised the questionnaire. The department then distributed the revised questionnaire, collected it, and input data into its database. The authors then analyzed the collected data.
The development of valid and reliable safety-climate questionnaires is quite complex. According to Huang [39], there are six steps to develop a safety-climate questionnaire:
- Step one:
- information gathering (literature and accident inquiries review, experts’ input, in-depth interviews with workers and supervisors, and field observation);
- Step two:
- development of questionnaire items;
- Step three:
- questionnaire testing (interviews with workers, questionnaire revision, pre-test survey, pilot test);
- Step four:
- analysis (pilot-test data analysis and questionnaire finalization);
- Step five:
- questionnaire implementation; and
- Step six:
- further analysis (reliability and validity analysis and safety-climate examination).
According to the above six safety-climate questionnaire development steps, the Taiwan safety-culture questionnaire is missing step three, questionnaire testing. This also needs to be confirmed by fewer items in the validated questionnaire model compared to the original questionnaire model, as previously found. Therefore, the Taiwan safety-culture questionnaire development process can be improved by several thorough studies. The authors suggest that the safety-climate model in its development process should be reconstructed to fit the industry in order to gain better reliability and validity, as well as to increase its model fit.
5.3. Safety-Climate Level in Taiwan’s Metal Industries
Overall, Taiwan’s metal industries showed a good safety-climate performance. The safety perception score of 4.224 (out of a five-point scale) indicates that the workers have a good understanding of and compliance with safety procedures. The safety-management system score of 4.231 indicates that the company has been implementing safety programs. According to the workers, programs, such as automatic safety inspection, safety weeks, safety months and the use of safety posters and banners, were either in practice or in planning. The safety communication score of 3.970 indicates a good understanding of communications such as the importance of immediate coworker response from different departments regarding a dangerous situation, and encouragement for workers to be involved and to communicate in the organization’s overall and frontline site’s safety improvement. When compared to the above two factors, safety communication has the lowest score.
Since communication is a critical factor in reducing safety-norm ambiguity [60], workers need to be encouraged more to speak out to help improve the organization’s safety culture.
5.4. The Influence of Workers’ Backgrounds on the Safety Climate
This study investigates the safety-climate difference among workers with different backgrounds and found that gender, job position, organization, status and number of training sessions all have influence on the safety climate. Similar findings can be referenced across various studies.
This study revealed that female workers have better safety communication compared to male workers. However, Wu et al. [28] found that male workers have a better safety climate compared to female workers in emergency response, which was interpreted in their study as a plausible association with male spatial ability. A plausible explanation for our result is that none of the female workers who participated in this study were frontline workers.
This study revealed that the job position influenced the safety climate significantly in three safety-climate factors: safety perception, safety communication and the safety management system. It is found in this research that the safety climate decreased as the job position lowered. More specifically, the post-hoc test confirmed that the executive group has a higher safety-climate score compared to frontline workers. This finding is similar to the finding of Wu et al. [28], that the manager has a better safety climate compared to faculty and staff. The study associates the difference to the different job functionalities. In this study, the executive and the frontline workers have similar years of working in the industry, which indicates that the different safety-climate levels are associated with different job responsibility towards safety culture, with top positions bearing the most safety-culture responsibility.
This study, like Wu et al.’s [28] study, did not find safety-climate difference among workers with different job attributes. However, Vinodkumar et al.’s [5] study found that safety-climate variability is related to different safety management and organization styles.
According to Vinodkumar et al. [5], workers’ safety climate differs among different companies. This study’s finding is in tune with their study that even in the organization, different subsidiaries have some degree of difference in the safety climate.
In terms of this study, it was found that the satellite-company workers have higher scores in safety perception than that of the main-company workers, but with scores lower in the safety-management system. This inconsistent result underlined the dynamism of safety-climate research. Finally, according to Beus et al.’s [31] study, they speculated that socialization reduces safety-climate variability, which means it enhances the safety-climate strength. Training, as described in Beus et al.’s study, is an important attribute to formal socialization. This study, with a post-hoc test, confirmed their speculation with the finding that workers with training, no matter how many times he or she received training, have higher scores in safety perception versus the workers without any safety training.
6. Conclusions
The zero-accident goal announced by the Taiwanese government underlines the importance of safety climate as the current safety concern. The safety-culture questionnaire developed by the Taiwanese government was aimed at improving the Taiwan industries’ safety performance. However, similar to many other questionnaires developed by researchers or industrial practitioners, there is a lack of clear theoretical basis, and it falls short on validity and reliability tests [25]. This study surveyed various safety-culture and safety-climate studies, revised and evaluated the questionnaire’s validity and reliability, which has never been done previously, and then constructed the safety-climate model. This study identified the influence of workers’ background on the safety climate.
In summary, the Taiwan safety-climate questionnaire has a modest validity. Based on the three validated safety-climate factors, it could be stated that, from an industry perspective, overall, Taiwan’s metal industries have a good safety climate. However, improvement is suggested in safety communication.
Additionally, five out of six types of workers’ background were found to have influence on the safety climate. A strong relationship occurred in the number of trainings, workers’ organization and workers’ job position. A moderate relationship occurred in gender and workers’ status. Post-hoc tests showed that any number of training sessions results in higher safety climate than no training at all. Hence, a mandatory safety-training program is strongly recommended. Various training programs are also highly recommended to fit different workers’ backgrounds to raise the overall safety climate to the same, or similar level, of understanding.
Finally, based on the modest validity of the safety-culture questionnaire developed by the Taiwanese government, it could be, and should be, improved by reconstructing its questions in its development process and putting more effort into researching and conducting more comprehensive studies, in order to increase the safety-climate model’s reliability and validity, as well as its model fit.
Acknowledgments
The authors would like to thank the FTIS and ISHA for making the original questionnaire and for all the organization’s personnel that helped the study. Thanks to Albert Lin from Reagan High School at San Antonio, TX, USA for completely revising the manuscript.
Author Contributions
Shu-Chiang Lin initiated and guided the research process, as well as revised the manuscript. Ilma Mufidah helped conduct the research and literature survey, analyzed the data, and wrote the initial manuscript. Satria Fadil Persada helped revise the initial manuscript.
Conflicts of Interest
The authors declare no conflict of interest.
References
- Ministry of Labor Republic of China. Occupational Injury Incidence Rate under Labor Insurance. Available online: http://statdb.mol.gov.tw/html/mon/c6080.htm (accessed on 1 September 2016).
- Strauch, B. Can We Examine Safety Culture in Accident Investigations, or Should We? Saf. Sci. 2015, 77, 102–111. [Google Scholar] [CrossRef]
- Leitão, S.; Greiner, B.A. Organisational safety climate and occupational accidents and injuries: An epidemiology-based systematic review. Work Stress 2016, 30, 71–90. [Google Scholar] [CrossRef]
- Wadsworth, E.; Smith, A. Safety culture, advice and performance. Policy Pract. Health Saf. 2009, 7, 5–31. [Google Scholar] [CrossRef]
- Vinodkumar, M.; Bhasi, M. Safety climate factors and its relationship with accidents and personal attributes in the chemical industry. Saf. Sci. 2009, 47, 659–667. [Google Scholar] [CrossRef]
- Olsen, E. Exploring the possibility of a common structural model measuring associations between safety climate factors and safety behaviour in health care and the petroleum sectors. Accid. Anal. Prev. 2010, 42, 1507–1516. [Google Scholar] [CrossRef] [PubMed]
- Glendon, A.I.; Stanton, N.A. Perspectives on safety culture. Saf. Sci. 2000, 34, 193–214. [Google Scholar] [CrossRef]
- Mearns, K.J.; Flin, R. Assessing the state of organizational safety—Culture or climate? Curr. Psychol. 1999, 18, 5–17. [Google Scholar] [CrossRef]
- Guldenmund, F.W. Understanding and Exploring Safety Culture; TU Delft, Delft University of Technology: Delft, The Netherlands, 2010. [Google Scholar]
- Kennedy, R.; Kirwan, B. Development of a hazard and operability-based method for identifying safety management vulnerabilities in high risk systems. Saf. Sci. 1998, 30, 249–274. [Google Scholar] [CrossRef]
- Guldenmund, F.W. The use of questionnaires in safety culture research—An evaluation. Saf. Sci. 2007, 45, 723–743. [Google Scholar] [CrossRef]
- Seo, D.-C.; Torabi, M.R.; Blair, E.H.; Ellis, N.T. A cross-validation of safety climate scale using confirmatory factor analytic approach. J. Saf. Res. 2004, 35, 427–445. [Google Scholar] [CrossRef] [PubMed]
- De Castro, B.L.; Gracia, F.J.; Peiró, J.M.; Pietrantoni, L.; Hernandez, A. Testing the validity of the international atomic energy agency (IAEA) safety culture model. Accid. Anal. Prev. 2013, 60, 231–244. [Google Scholar] [CrossRef] [PubMed]
- Høivik, D.; Tharaldsen, J.E.; Baste, V.; Moen, B.E. What is most important for safety climate: The company belonging or the local working environment—A study from the norwegian offshore industry. Saf. Sci. 2009, 47, 1324–1331. [Google Scholar] [CrossRef]
- Reiman, T.; Rollenhagen, C. Does the concept of safety culture help or hinder systems thinking in safety? Accid. Anal. Prev. 2014, 68, 5–15. [Google Scholar] [CrossRef] [PubMed]
- Myers, D.J.; Nyce, J.M.; Dekker, S.W. Setting culture apart: Distinguishing culture from behavior and social structure in safety and injury research. Accid. Anal. Prev. 2014, 68, 25–29. [Google Scholar] [CrossRef] [PubMed]
- Schein, E.H. Organizational Culture and Leadership; Jossey-Bass: San Francisco, CA, USA, 2004. [Google Scholar]
- Schein, E.H. Organizational Culture and Leadership, 2nd ed.; Jossey Bass: San Francisco, CA, USA, 1992. [Google Scholar]
- Burchell, N.; Kolb, D. Pattern matching organisational cultures. J. Manag. Org. 2003, 9, 50–61. [Google Scholar] [CrossRef]
- Frazier, C.B.; Ludwig, T.D.; Whitaker, B.; Roberts, D.S. A hierarchical factor analysis of a safety culture survey. J. Saf. Res. 2013, 45, 15–28. [Google Scholar] [CrossRef] [PubMed]
- Kjestveit, K.; Tharaldsen, J.; Holte, K.A. Young and strong: What influences injury rates within building and construction? Saf. Sci. Monit. 2011, 15, 1–15. [Google Scholar]
- Kapp, E. The influence of supervisor leadership practices and perceived group safety climate on employee safety performance. Saf. Sci. 2012, 50, 1119–1124. [Google Scholar] [CrossRef]
- Luria, G.; Yagil, D. Safety perception referents of permanent and temporary employees: Safety climate boundaries in the industrial workplace. Accid. Anal. Prev. 2010, 42, 1423–1430. [Google Scholar] [CrossRef] [PubMed]
- Zhou, Q.; Fang, D.; Wang, X. A method to identify strategies for the improvement of human safety behavior by considering safety climate and personal experience. Saf. Sci. 2008, 46, 1406–1419. [Google Scholar] [CrossRef]
- Kines, P.; Lappalainen, J.; Mikkelsen, K.L.; Olsen, E.; Pousette, A.; Tharaldsen, J.; Tómasson, K.; Törner, M. Nordic safety climate questionnaire (NOSACQ-50): A new tool for diagnosing occupational safety climate. Int. J. Ind. Ergon. 2011, 41, 634–646. [Google Scholar] [CrossRef]
- Zohar, D. Thirty years of safety climate research: Reflections and future directions. Accid. Anal. Prev. 2010, 42, 1517–1522. [Google Scholar] [CrossRef] [PubMed]
- Zohar, D. A group-level model of safety climate: Testing the effect of group climate on microaccidents in manufacturing jobs. J. Appl. Psychol. 2000, 85, 587. [Google Scholar] [CrossRef] [PubMed]
- Wu, T.-C.; Liu, C.-W.; Lu, M.-C. Safety climate in university and college laboratories: Impact of organizational and individual factors. J. Saf. Res. 2007, 38, 91–102. [Google Scholar] [CrossRef] [PubMed]
- Findley, M.; Smith, S.; Gorski, J.; O’neil, M. Safety climate differences among job positions in a nuclear decommissioning and demolition industry: Employees’ self-reported safety attitudes and perceptions. Saf. Sci. 2007, 45, 875–889. [Google Scholar] [CrossRef]
- Probst, T.M.; Brubaker, T.L.; Barsotti, A. Organizational injury rate underreporting: The moderating effect of organizational safety climate. J. Appl. Psychol. 2008, 93, 1147. [Google Scholar] [CrossRef] [PubMed]
- Beus, J.M.; Bergman, M.E.; Payne, S.C. The influence of organizational tenure on safety climate strength: A first look. Accid. Anal. Prev. 2010, 42, 1431–1437. [Google Scholar] [CrossRef] [PubMed]
- Milijic, N.; Mihajlovic, I.; Strbac, N.; Zivkovic, Z. Developing a questionnaire for measuring safety climate in the workplace in serbia. Int. J. Occup. Saf. Ergon. 2013, 19, 631–645. [Google Scholar] [CrossRef] [PubMed]
- Atchley, P.; Shi, J.; Yamamoto, T. Cultural foundations of safety culture: A comparison of traffic safety culture in china, japan and the united states. Transp. Res. Part F Traffic Psychol. Behav. 2014, 26, 317–325. [Google Scholar] [CrossRef]
- Listyowardojo, T.A.; Yan, X.; Leyshon, S.; Ray-Sannerud, B.; Yu, X.Y.; Zheng, K.; Duan, T. A safety culture assessment by mixed methods at a public maternity and infant hospital in China. J. Multidiscip. Healthc. 2017, 10, 253. [Google Scholar] [CrossRef] [PubMed]
- Østerås, N.; Gulbrandsen, P.; Garratt, A.; Benth, J.Š.; Dahl, F.A.; Natvig, B.; Brage, S. A randomised comparison of a four-and a five-point scale version of the norwegian function assessment scale. Health Qual. Life Outcomes 2008, 6, 14. [Google Scholar] [CrossRef] [PubMed] [Green Version]
- Yieh Phui. Yieh Phui Company Profile. Available online: https://www.yiehphui.com.tw/upload/myfiles/catalog/Company_Profile.pdf (accessed on 24 July 2017).
- Times, F. Yieh phui Enterprise Co. Ltd. Available online: http://markets.ft.com/data/equities/tearsheet/profile?s=2023:TAI (accessed on 24 July 2017).
- Fichman, M.; Cummings, J.N. Multiple imputation for missing data: Making the most of what you know. Org. Res. Methods 2003, 6, 282–308. [Google Scholar] [CrossRef]
- Huang, Y.-H.; Zohar, D.; Robertson, M.M.; Garabet, A.; Murphy, L.A.; Lee, J. Development and validation of safety climate scales for mobile remote workers using utility/electrical workers as exemplar. Accid. Anal. Prev. 2013, 59, 76–86. [Google Scholar] [CrossRef] [PubMed]
- Ullman, J.B. Structural equation modeling: Reviewing the basics and moving forward. J. Personal. Assess. 2006, 87, 35–50. [Google Scholar] [CrossRef] [PubMed]
- Hair, J.F.; Black, W.C.; Babin, B.J.; Anderson, R.E.; Tatham, R.L. Multivariate Data Analysis, 6th ed.; Pearson Prentice Hall: Upper Saddle River, NJ, USA, 2006. [Google Scholar]
- Afthanorhan, W.; Ahmad, S.; Mamat, I. Pooled confirmatory factor analysis (PCFA) using structural equation modeling on volunteerism program: A step by step approach. Int. J. Asian Soc. Sci. 2014, 4, 642–653. [Google Scholar]
- Fornell, C.; Larcker, D.F. Evaluating structural equation models with unobservable variables and measurement error. J. Mark. Res. 1981, 18, 39–50. [Google Scholar] [CrossRef]
- Nadlifatin, R.; Lin, S.-C.; Rachmaniati, Y.P.; Persada, S.F.; Razif, M. A pro-environmental reasoned action model for measuring citizens’ intentions regarding ecolabel product usage. Sustainability 2016, 8, 1165. [Google Scholar] [CrossRef]
- Nadlifatin, R.; Razif, M.; Lin, S.-C.; Persada, S.F.; Belgiawan, P.F. An assessment model of indonesian citizens’ intention to participate on environmental impact assessment (EIA): A behavioral perspective. Procedia Environ. Sci. 2015, 28, 3–10. [Google Scholar] [CrossRef]
- Lin, S.-C.; Nadlifatin, R.; Amna, A.R.; Persada, S.F.; Razif, M. Investigating citizen behavior intention on mandatory and voluntary pro-environmental programs through a pro-environmental planned behavior model. Sustainability 2017, 9, 1289. [Google Scholar] [CrossRef]
- Chin, J.; Lin, S.-C. Investigating users’ perspectives in building energy management system with an extension of technology acceptance model: A case study in indonesian manufacturing companies. Procedia Comput. Sci. 2015, 72, 31–39. [Google Scholar] [CrossRef]
- Chin, J.; Lin, S.-C. A behavioral model of managerial perspectives regarding technology acceptance in building energy management systems. Sustainability 2016, 8, 641. [Google Scholar] [CrossRef]
- Hammervold, R.; Olsson, U.H. Testing structural equation models: The impact of error variances in the data generating process. Qual. Quant. 2012, 46, 1547–1570. [Google Scholar] [CrossRef] [Green Version]
- Hox, J.; Bechger, T. An introduction to structural equation modelling. Fam. Sci. Rev. 1998, 11, 354–373. [Google Scholar]
- Hooper, D.; Coughlan, J.; Mullen, M. Structural equation modelling: Guidelines for determining model fit. Articles 2008, 2, 53–60. [Google Scholar]
- Wheaton, B.; Muthen, B.; Alwin, D.F.; Summers, G.F. Assessing reliability and stability in panel models. Sociol. Methodol. 1977, 8, 84–136. [Google Scholar] [CrossRef]
- Tabachnick, B.; Fidell, L. Using Multivariate Statistics, 5th ed.; Allyn and Bacon: Boston, MA, USA, 2007. [Google Scholar]
- Persada, S.; Lin, S.; Nadlifatin, R.; Razif, M. Investigating the citizens’ intention level in environmental impact assessment participation through an extended theory of planned behavior model. Glob. NEST J. 2015, 17, 847–857. [Google Scholar]
- Lin, S.-C.; Persada, S.F.; Nadlifatin, R. A study of student behavior in accepting the blackboard learning system: A technology acceptance model (TAM) approach. In Proceedings of the 2014 IEEE 18th International Conference on Computer Supported Cooperative Work in Design (CSCWD), Hsinchu, Taiwan, 21–23 May 2014; pp. 457–462. [Google Scholar]
- Hu, L.T.; Bentler, P.M. Cutoff criteria for fit indexes in covariance structure analysis: Conventional criteria versus new alternatives. Struct. Equ. Model. Multidiscip. J. 1999, 6, 1–55. [Google Scholar] [CrossRef]
- Jani, M.A.; Sari, G.I.P.; Pribadi, R.C.H.; Nadlifatin, R.; Persada, S.F. An investigation of the influential factors on digital text voting for commercial competition: A case of indonesia. Procedia Comput. Sci. 2015, 72, 285–291. [Google Scholar] [CrossRef]
- Lin, S.-C.; Persada, S.F.; Nadlifatin, R.; Tsai, H.-Y.; Chu, C.-H. Exploring the influential factors of manufacturers’ initial intention in applying for the green mark ecolabel in taiwan. Int. J. Precis. Eng. Manuf. Green Technol. 2015, 2, 359–364. [Google Scholar] [CrossRef]
- Lei, P.W.; Wu, Q. Introduction to structural equation modeling: Issues and practical considerations. Educ. Meas. Issues Pract. 2007, 26, 33–43. [Google Scholar] [CrossRef]
- Hicks, G.; Buttigieg, D.; De Cieri, H. Safety climate, strain and safety outcomes. J. Manag. Org. 2016, 22, 19. [Google Scholar] [CrossRef]
Figure 1.
The final safety-climate model.

Table 1.
Respondent demographics.
| Variable | N | % |
|---|---|---|
| Gender | ||
| Male | 792 | 94.4 |
| Female | 47 | 5.6 |
| Job position | ||
| Executive | 19 | 2.3 |
| Middle manager | 20 | 2.4 |
| Site supervisor | 140 | 16.7 |
| Frontline workers | 660 | 78.7 |
| Job attribute | ||
| Operational | 394 | 47.0 |
| Maintenance | 142 | 16.9 |
| Research and Development | 22 | 2.6 |
| Transport and storage | 59 | 7.0 |
| ndustrial safety and environmental protection | 19 | 2.3 |
| Administrative or management | 150 | 17.9 |
| Others | 53 | 6.3 |
| Organization | ||
| Main company | 609 | 72.6 |
| Satellite company 1 | 62 | 7.4 |
| Satellite company 2 | 17 | 2.0 |
| Satellite company 3 | 9 | 1.1 |
| Satellite company 4 | 61 | 7.3 |
| Satellite company 5 | 81 | 9.7 |
| Status | ||
| Main-company worker | 609 | 72.6 |
| Satellite-company worker | 230 | 27.4 |
| Number of training sessions | ||
| Never | 162 | 19.3 |
| Once | 230 | 27.4 |
| Twice | 227 | 27.1 |
| Three times | 74 | 8.8 |
| Four times or more | 146 | 17.4 |
Table 2.
Confirmatory Factor Analysis (CFA) variable result.
| Factors | Measurement Items | |
|---|---|---|
| Safety Perception | SP_3 | I comply and fully understand the contents of operational procedure in my own work |
| SP_4 | Most supervisors will remind colleagues to be careful and strictly comply with written procedures | |
| SP_5 | I will remind my colleagues to take care if they do not follow safety rules or failure to comply with written procedures | |
| Safety Communication | SC_2 | When a ‘dangerous situation’ is reported out, the company can indeed find solutions (including the implementation of improvement projects and acceptable programs) |
| SC_3 | The management will understand the typical statistical data about safety | |
| SC_4 | I have been encouraged to put forward ‘suggestions for improvement’, and a good improvement recommendation would normally be adopted | |
| SC_7 | The assistance of safety matters combination can be given among various department | |
| Safety-Management System | SM_4 | * Company has already implemented automatic safety inspections, main inspections, round inspections and examinations |
| SM_5 | * The company has conducted safety posters, safety signs and safety banners | |
| SM_6 | * Company has already implemented Safety Week, Safety Month | |
* Indicated that the questions are answered using five-point Likert scale with designated cognitive interpretations.
Table 3.
Questionnaire reliability and convergent validity result.
| Factor | Item | Factor Loading (≥0.6) [42] | Cronbach’s Alpha (≥0.7) [41,45,46,47,48] | Construct Reliability (≥0.7) [41,45,46,47,48] | Average Variance Extracted (≥0.5) [41,45,46,47,48] |
|---|---|---|---|---|---|
| Safety Perception (SP) | SP_3 | 0.696 | 0.769 | 0.772 | 0.531 |
| SP_4 | 0.779 | ||||
| SP_5 | 0.708 | ||||
| Safety Communication (SC) | SC_2 | 0.745 | 0.847 | 0.848 | 0.582 |
| SC_3 | 0.786 | ||||
| SC_4 | 0.801 | ||||
| SC_7 | 0.718 | ||||
| Safety-Management System (SM) | SM_4 | 0.747 | 0.905 | 0.907 | 0.621 |
| SM_5 | 0.76 | ||||
| SM_6 | 0.751 | ||||
| SM_7 | 0.82 | ||||
| SM_8 | 0.803 | ||||
| SM_9 | 0.842 |
Table 4.
Inter-construct Correlation and Squared Inter-construct Correlation result.
| Factors | IC | SIC |
|---|---|---|
| Safety Perception <--> Safety Communication | 0.70 | 0.50 |
| Safety Perception <--> Safety-Management System | 0.63 | 0.40 |
| Safety Communication <--> Safety-Management System | 0.72 | 0.52 |
Table 5.
Model fit test.
| Goodness-of-Fit Model Index | Threshold | Result |
|---|---|---|
| χ2/df | 2 ≤ x ≤ 5 [51,52,53] | 3.853 |
| GFI | ≥0.9 [41,54] | 0.957 |
| AGFI | ≥0.9 [51,55] | 0.936 |
| SRMR | <0.08 [51,56] | 0.0030 |
| RMSEA | x ≤ 0.08 [51,57] | 0.058 |
| CFI | ≤0.90 [41,44,58] | 0.970 |
| TLI | ≤0.95 [51] | 0.962 |
χ2: Chi-square, df: Degree of freedom, GFI:Goodness-of-Fit Index, AGFI: Adjusted Goodness-of-Fit Index, SRMR: Standardized Root-Mean-Residual, CFI: Comparative Fit Index, TLI: Tucker–Lewis Index.
Table 6.
Safety-climate level of the proposed model.
| Factors | Item | Mean | Grand Mean |
|---|---|---|---|
| Safety Perception | SP_3 | 4.265 | 4.224 |
| SP_4 | 4.279 | ||
| SP_5 | 4.129 | ||
| Safety Communication | SC_2 | 3.957 | 3.970 |
| SC_3 | 3.995 | ||
| SC_4 | 3.938 | ||
| SC_7 | 3.988 | ||
| Safety-Management System | SM_4 | 4.280 | 4.231 |
| SM_5 | 4.321 | ||
| SM_6 | 4.172 | ||
| SM_7 | 4.244 | ||
| SM_8 | 4.098 | ||
| SM_9 | 4.269 |
Table 7.
Workers’ Gender vs Safety Climate.
| Factor | Workers’ Background: Gender | |||
|---|---|---|---|---|
| Mean | One-Way ANOVA (Significance) | |||
| 1. Male | 2. Female | |||
| Safety perception | 4.236 | 4.341 | 0.166 | n.s. |
| Safety communication | 4.051 | 4.215 | 0.048 | p < 0.05 |
| Safety-management system | 4.251 | 4.164 | 0.403 | n.s. |
Table 8.
Workers’ job position vs safety climate.
| Factor | Workers’ Background: Job Position | |||||
|---|---|---|---|---|---|---|
| Mean | One-Way ANOVA (Significance) | |||||
| 1. Executive | 2. Middle Manager | 3. Site Supervisor | 4. Frontline Workers | |||
| Safety perception | 4.474 | 4.317 | 4.302 | 4.221 | 0.049 | p < 0.05 |
| Safety communication | 4.329 | 4.066 | 4.065 | 4.021 | 0.043 | p < 0.05 |
| Safety-management system | 4.735 | 4.409 | 4.321 | 4.224 | 0.000 | p < 0.01 |
Table 9.
Workers’ job attribute vs safety climate.
| Factor | Workers’ Background: Job Attribute | ||||||||
|---|---|---|---|---|---|---|---|---|---|
| Mean | One-Way ANOVA (Significance) | ||||||||
| 1. Opr. | 2. Maint. | 3. R & D. | 4. Trans. & Stor. | 5. Industrial Safety and Env. Protection | 6. Adm. Man. | 7. Other | |||
| Safety perception | 4.260 | 4.218 | 4.185 | 4.301 | 4.114 | 4.232 | 4.208 | 0.217 | n.s. |
| Safety communication | 4.035 | 4.047 | 4.011 | 4.092 | 3.861 | 4.058 | 3.905 | 0.486 | n.s. |
| Safety-management system | 4.238 | 4.243 | 4.195 | 4.316 | 4.290 | 4.293 | 4.073 | 0.276 | n.s. |
Table 10.
Workers’ organization vs safety climate.
| Factor | Workers‘ Background: Organization | |||||||
|---|---|---|---|---|---|---|---|---|
| Mean | One-Way ANOVA (Significance) | |||||||
| 1. Main Comp. | 2. Sat. Comp.1 | 3. Sat. Comp.2 | 4. Sat. Comp.3 | 5. Sat. Comp.4 | 6. Sat. Comp.5 | |||
| Safety perception | 4.2144 | 4.6605 | 3.9294 | 4.2386 | 4.3095 | 4.1103 | 0.000 | p < 0.01 |
| Safety communication | 4.0401 | 4.3911 | 3.4531 | 4.1071 | 4.1254 | 3.8585 | 0.000 | p < 0.01 |
| Safety-management system | 4.3015 | 4.5137 | 3.5529 | 3.6667 | 4.0692 | 3.8895 | 0.000 | p < 0.01 |
Table 11.
Workers’ status vs safety climate.
| Factor | Worker Background: Status | |||
|---|---|---|---|---|
| Mean | One-Way ANOVA (Significance) | |||
| 1. Main-Company Workers | 2. Satellite-Company Workers | |||
| Safety perception | 4.214 | 4.315 | 0.009 | p < 0.01 |
| Safety communication | 4.039 | 4.087 | 0.263 | n.s. |
| Safety-management system | 4.302 | 4.072 | 0.000 | p < 0.01 |
Table 12.
Workers’ number of training sessions vs safety climate.
| Factor | Worker Background: Number of Trainings | ||||||
|---|---|---|---|---|---|---|---|
| Mean | One-Way ANOVA (Significance) | ||||||
| 1. Never | 2. Once | 3. Twice | 4. Three Times | 5. Four Times or More | |||
| Safety perception | 4.068 | 4.189 | 4.240 | 4.383 | 4.368 | 0.000 | p < 0.01 |
| Safety communication | 3.984 | 3.951 | 4.019 | 4.250 | 4.198 | 0.000 | p < 0.01 |
| Safety-management system | 4.0251 | 4.1888 | 4.2676 | 4.3601 | 4.4862 | 0.000 | p < 0.01 |
© 2017 by the authors. Licensee MDPI, Basel, Switzerland. This article is an open access article distributed under the terms and conditions of the Creative Commons Attribution (CC BY) license (http://creativecommons.org/licenses/by/4.0/).
Share and Cite
MDPI and ACS Style
Lin, S.-C.; Mufidah, I.; Persada, S.F. Safety-Culture Exploration in Taiwan’s Metal Industries: Identifying the Workers’ Background Influence on Safety Climate. Sustainability 2017, 9, 1965. https://doi.org/10.3390/su9111965
AMA Style
Lin S-C, Mufidah I, Persada SF. Safety-Culture Exploration in Taiwan’s Metal Industries: Identifying the Workers’ Background Influence on Safety Climate. Sustainability. 2017; 9(11):1965. https://doi.org/10.3390/su9111965
Chicago/Turabian StyleLin, Shu-Chiang, Ilma Mufidah, and Satria Fadil Persada. 2017. "Safety-Culture Exploration in Taiwan’s Metal Industries: Identifying the Workers’ Background Influence on Safety Climate" Sustainability 9, no. 11: 1965. https://doi.org/10.3390/su9111965
Note that from the first issue of 2016, this journal uses article numbers instead of page numbers. See further details here.