Land Use Alters the Plant-Derived Carbon and Nitrogen Pools in Terraced Rice Paddies in a Mountain Village


1
Memuro Research Station, Hokkaido Agricultural Research Center, National Agriculture and Food Research Organization (NARO/HARC/M), Shinsei, Memuro, Kasai, Hokkaido 082-0081, Japan
2
Field Studies Institute for Environmental Education, Tokyo Gakugei University, 4-1-1 Nukuikitamachi, Koganeishi, Tokyo 184-0015, Japan
*
Author to whom correspondence should be addressed.
Sustainability 2017, 9(11), 1973; https://doi.org/10.3390/su9111973
Submission received: 27 September 2017
/
Revised: 17 October 2017
/
Accepted: 26 October 2017
/
Published: 28 October 2017
(This article belongs to the Special Issue Carbon Input into Agricultural Soils)
Abstract
:In Japan, terraced paddies in mountain villages are symbolic of the traditional landscape, but they are gradually being abandoned. To compare plant-derived C and N among land uses, we compared adjacent forest floor (FF), agricultural paddy (AP), and post-agricultural paddy (PP) sites. Long-term litter accumulation could explain the significantly higher litter C and belowground biomass C in FF than in AP and PP. The low-density-fraction (LF) soil C was significantly higher in FF than in PP and better reflected land use than the whole-soil C. The AP soil held more N than FF and PP at 20–30 cm, associated with higher LF soil N. Periodic tillage in AP maintains the LF soil N, but N supplied to the surface soil reduced with depth following abandonment. Differences in recycling of organic matter and nutrients among land uses are crucial to plant-derived C and N contents of soil.
1. Introduction
The production of rice (Oryza sativa L.) is a major agricultural land use in the temperate regions of East Asia. In mountain villages, terraced paddies are symbolic of the traditional landscape, along with forests. The landscapes formed of terraced paddies and their surroundings (such as levees and adjacent secondary forests) harbor high biodiversity maintained by conventional agricultural practices [1,2,3]. However, most paddies in mountain villages have gradually been abandoned or fallowed because of a rapid decrease in the farming population [4].
In northern Japan, rice is grown with continuous flooding during spring and summer and drainage before harvest in autumn [5]. The crop residues are later turned into the soil. Paddy field abandonment ends flooding and soil turning. The change from submerged to drained conditions may hasten the decomposition of crop residues, but also enhance carbon (C) sequestration, because the fast development of root systems incorporates C rapidly into the soil [6]. Thus, the balance between conditions that determine organic matter (OM) build up and decomposability are crucial to C and nitrogen (N) dynamics after abandonment. The low-density fraction (LF) of soil is composed mainly of partially decomposed plant fragments that are not associated with mineral particles [7]. In general, litter is transported into the soil via the LF [8]. The study of dominant plant species can help to explain the transport of plant-derived OM into soil [9]. However, little information is available on the differences in plant-derived C and N among different land uses.
Terraced paddies abut forests and grasslands, and Japanese cedar (Cryptomeria japonica) plantations are common in our study area. Their dense canopy blocks sunlight, and only sunflecks reach the forest floor to support limited species. The shift to grassland following paddy abandonment provides an opportunity to investigate the soil response to aeration and the shift of plant cover. As well as providing food security, paddies maintain soil and water resources, preserve biodiversity, and ensure the viability of rural communities [10]. Long-term fallowing and abandonment of paddies reduces these services.
The aim of this study was to investigate the effects of land use on plant-derived C and N pools. Land use influences above- and belowground C availability by determining the quantity and quality of leaf litter that is incorporated into the soil. To understand plant nutrient use and litter C and N accumulation, we compared mineral and labile soil C and N among forest floor (FF), post-agricultural paddy (PP), and agricultural paddy (AP) sites.
2. Materials and Methods
2.1. Site Description
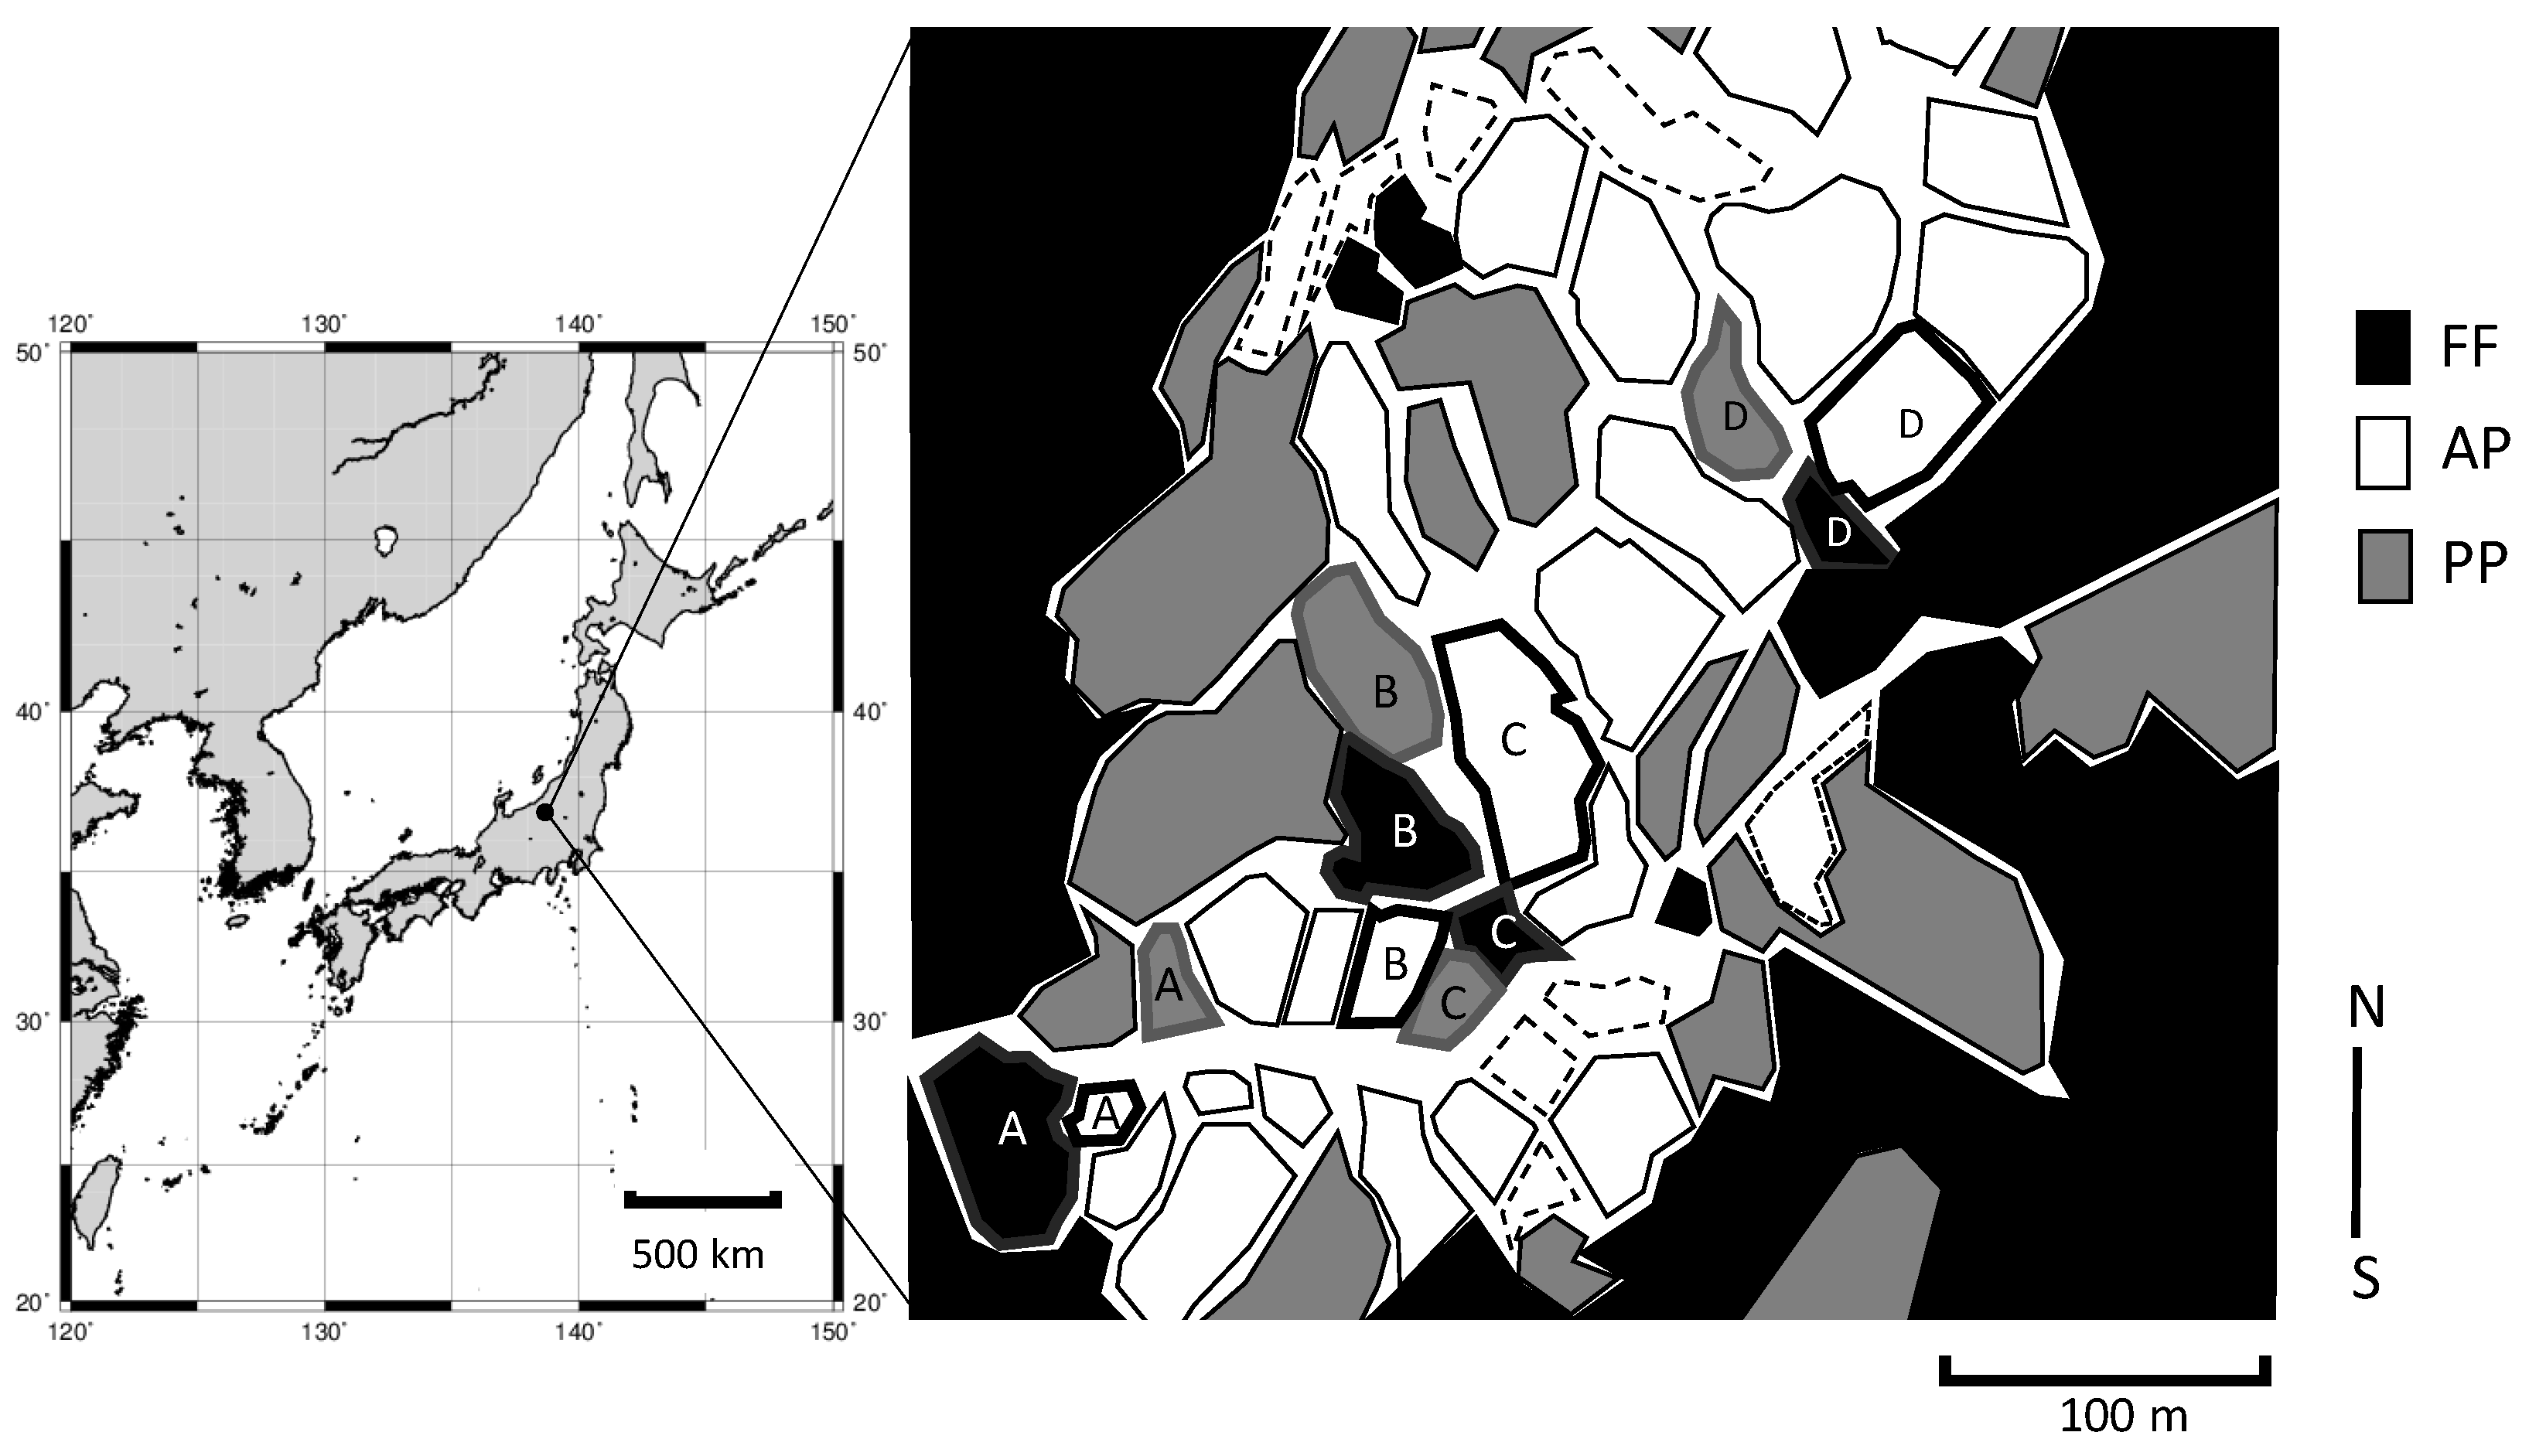
The study site was located in a village in Tokamachi city, southeastern Niigata Prefecture, Japan (37°03′ N, 138°37′ E) (Figure 1). Most of the terraced paddies cover slopes formed by ancient landslides on unconsolidated tertiary sediments [10]. The fields are composed of gray upland Gleysol with a fine texture. The local people believe that the terraces were established about 500 years ago. The maximum snow depth in winter exceeds 2 m.
We focused on the differences in C and N stocks among three land uses: FF, AP, and PP (n = 4). Previous study suggested that soil organic matter was linked with fields situated at the lower slope positions of a terrace sequence [11,12]. Experimental plots matched for elevation were established at 441, 431, 427, and 420 m of sea levels in A–D (Figure 1) to avoid imbalance of soil fertility among land uses. Aerial photographs (http://mapps.gsi.go.jp/maplibSearch.do#1) show that the area of abandoned fields has increased markedly in the last 20 years in this region. FF is dominated by Cryptomeria japonica forest, and PP by perennial grasses such as Miscanthus sinensis, both typical of such regions in Japan. The survey point in FF was set on the forest floor. Rice cv. Koshihikari is generally grown in AP sites. To reveal differences in plant-derived C and N and the effects of land use on plants composition and soil, we selected flat sites to avoid the influence of soil erosion and the heterogeneity of soil properties.
2.2. Estimation of Soil and Plant C and N
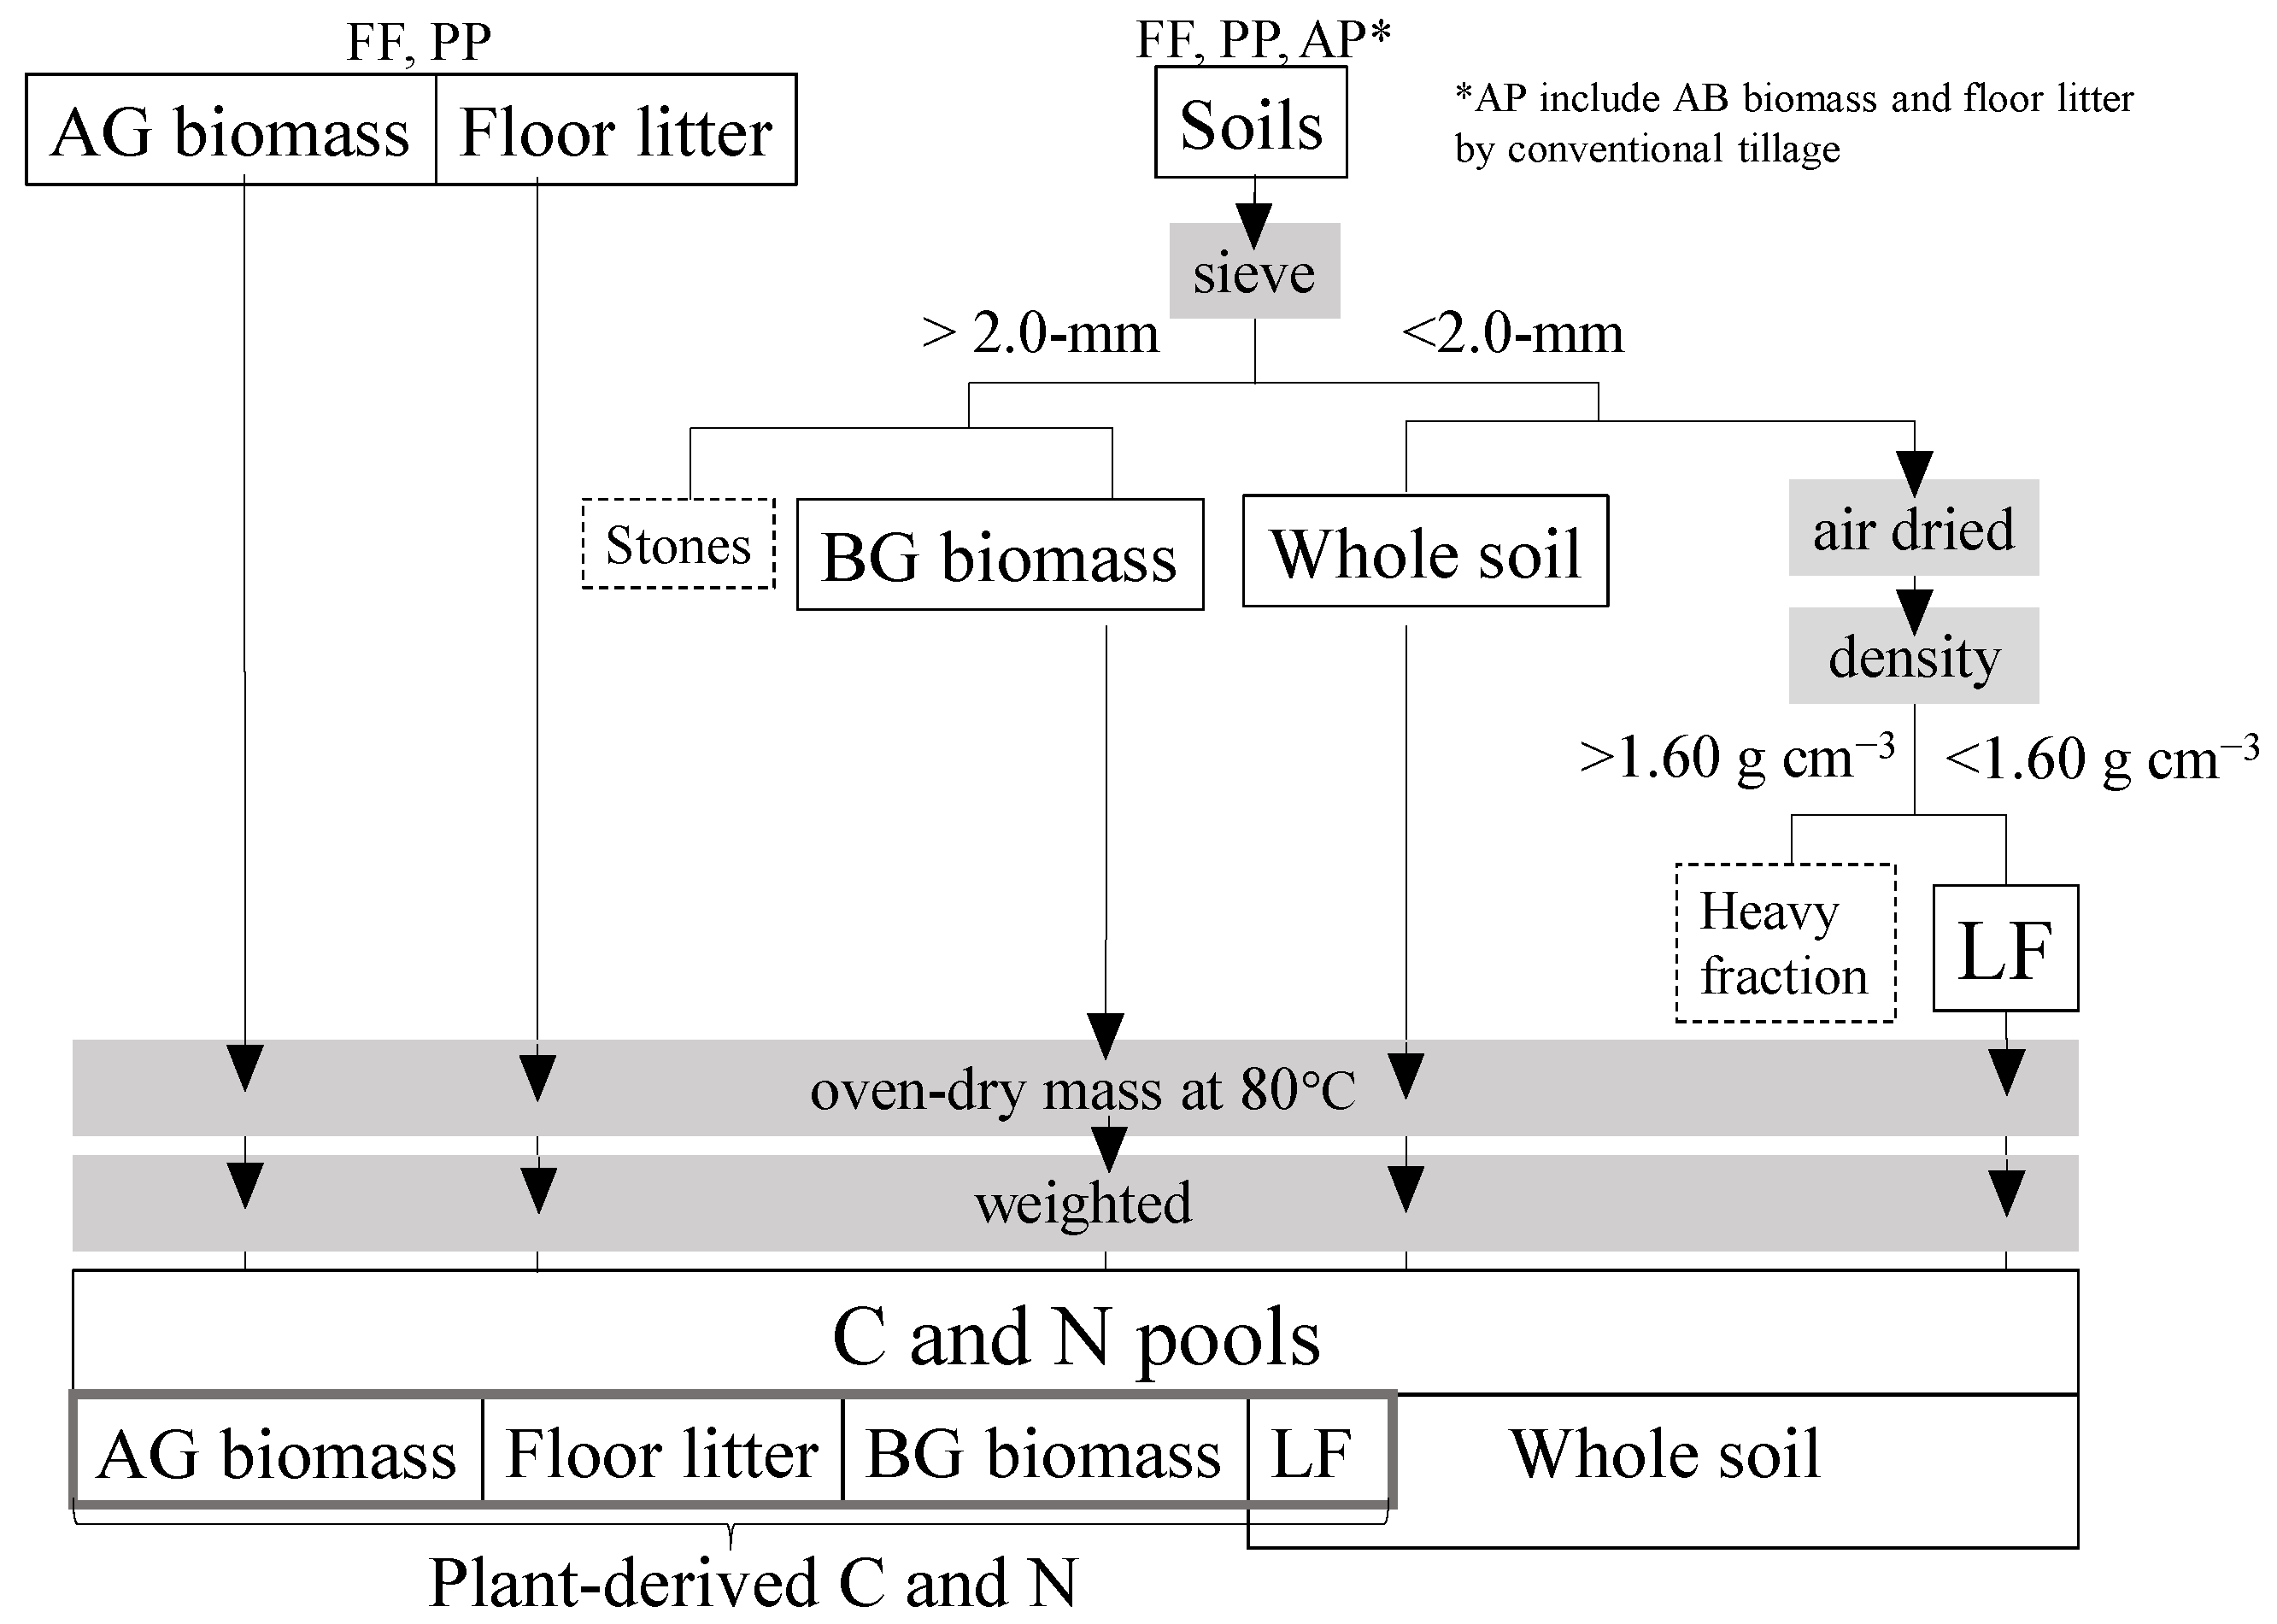
Samples were obtained from the study site in October 2014. Soil and BG biomass samples in three replicate were collected at depths of 0–5, 5–10, 10–15, 15–20, and 20–30 cm with a 40-mm-diameter linear soil auger (04.04.00.40.C and 0.1.10.11.C; Eijkelkamp Co., Giesbeek, The Netherlands). The conventional tillage depth in the region is 15 cm [5], and Japanese paddy soils have an effective plow layer for soil C of 30 cm [13]. Processes of C and N estimation is shown in a schematic diagram (Figure 2). Air-dried samples were passed through a 2.0-mm sieve to remove stones and to pick up roots and weighed to estimate the BG biomass, since fine roots of less than 2 mm diameter often cannot be distinguished empirically from soil organic matter or litter [14]. The low-density fraction (LF) of OM is normally occluded by soil mineral particles and aggregates [7]. To extract it, we placed each air-dried sample in a centrifuge tube with 25 mL of sodium polytungstate solution (1.60 g cm−3), mixed it on a shaker table at 150 rpm for 120 min, and centrifuged it at 3500 rpm for 30 min, and drew it out of the floating LF after oven-dry [15].
We harvested the aboveground (AG) biomass in three quadrats (0.5 × 0.5 m) per plot and collected litter from the soil surface in three quadrats (0.3 × 0.3 m) per plot in FF and PP in October 2014 to estimate the AG and BG biomass production from the peak value of biomass. Standing dead vegetation was removed by clipping at ground level by hand, and the dominant vegetation type of the abandoned fields was decided from the dry weight of each species [16]. We did not estimate woody part of AG and BG biomasses in FF.
The C and N contents of floor litter, AG biomass, and BG biomass were estimated from their concentrations and the mass per area (kg m−2). Samples were oven-dried at 80 °C for at least 48 h and ground into a fine powder. Samples were weighed (~100 mg of soil and ~10 mg of plant matter), and C and N concentrations were determined by the dry combustion method using an NC analyzer (Sumigraph NC-22; Sumika Chemical Analysis Services Ltd., Tokyo, Japan). The soil C concentration (g C kg−1) was multiplied by the corresponding equivalent soil mass to obtain the C pool (kg m−2) at each sampling depth, and the C pools were summed to calculate the total C pool. The use of equivalent soil mass can avoid errors associated with compaction or expansion of the soil. To account for changes in bulk density and compaction, C contents are reported on a volumetric basis. Carbon pools (kg m−2) in each soil layer were calculated by the minimum equivalent soil mass approach instead of the simple bulk density method [17]. The LF dry mass was expressed as a percentage of the total soil mass. The C and N concentrations of LF were multiplied by the corresponding equivalent soil mass to obtain soil LF-C and LF-N (kg m−2). We similarly calculated BG biomass from the BG biomass density at each sampling depth.
2.3. Statistical Analysis
All statistical analyses were performed in R v. 3.2.5 software (R Foundation for Statistical Computing, Vienna, Austria). One-way analysis of variance (ANOVA) in conjunction with Dunnett’s test was performed to identify differences in plant and soil traits among land uses in R with the ‘multcomp’ package. The Shapiro–Wilks and Bartlett’s tests were used to test normality and homogeneity of variance.
3. Results
3.1. Plant Species Composition and Biomass
Dominant species in the AG biomass were Cayratia japonica, Houttuynia cordata, Miscanthus sinensis, and Sasa nipponica in FF; and Artemisia indica, Cayratia japonica, and Miscanthus sinensis in PP (Appendix A). Cayratia japonica dominated in both FF and PP, and was the only dominant species that depended on position. By AG biomass, 61% of plant matter in FF had N concentration of 2.0% to 2.5% (Figure 3a). By number of species, the N concentration was independent of land use; 45% and 41% of species had an N concentration of 1.5% to 2.0% in both FF and PP (Figure 3b).
3.2. Soil C, N, and Belowground Biomass at Each Soil Depth
Soil C did not differ significantly with land use at any depth (Figure 4a). Soil N did not differ significantly with land use at 0–20 cm, but it was significantly higher in AP than in FF and PP at 20–30 cm (Figure 4b). The vertical distributions of C and N in the LF did not parallel the changes in the whole soil in any land use (Figure 4c,d). LF soil C and N gradually decreased with soil depth in FF and PP, but gradually increased in AP. LF soil C was significantly higher in FF than in AP and PP at 0–5 cm, but LF soil C and N were significantly higher in AP than in PP at 20–30 cm. Belowground biomass C and N in FF were more than double those (P < 0.05) in AP and PP at 0–5 cm (Figure 4e,f).
3.3. Total C and N
The amount of floor litter C in FF was 3.6 × that in PP (Table 1, P < 0.05), but the amount of floor litter N was not significantly different. Although AG biomass was independent of land use, BG biomass C was significantly higher in FF than in AP and PP (P < 0.05). Since the results of whole-soil C and N varied widely, no significant differences between land uses could be detected. The LF soil C was significantly higher in FF than in PP at 0–30 cm (P < 0.05) and better reflected the difference in land use than the whole soil C. The composition of N at 0–30 cm showed no significant difference among land uses.
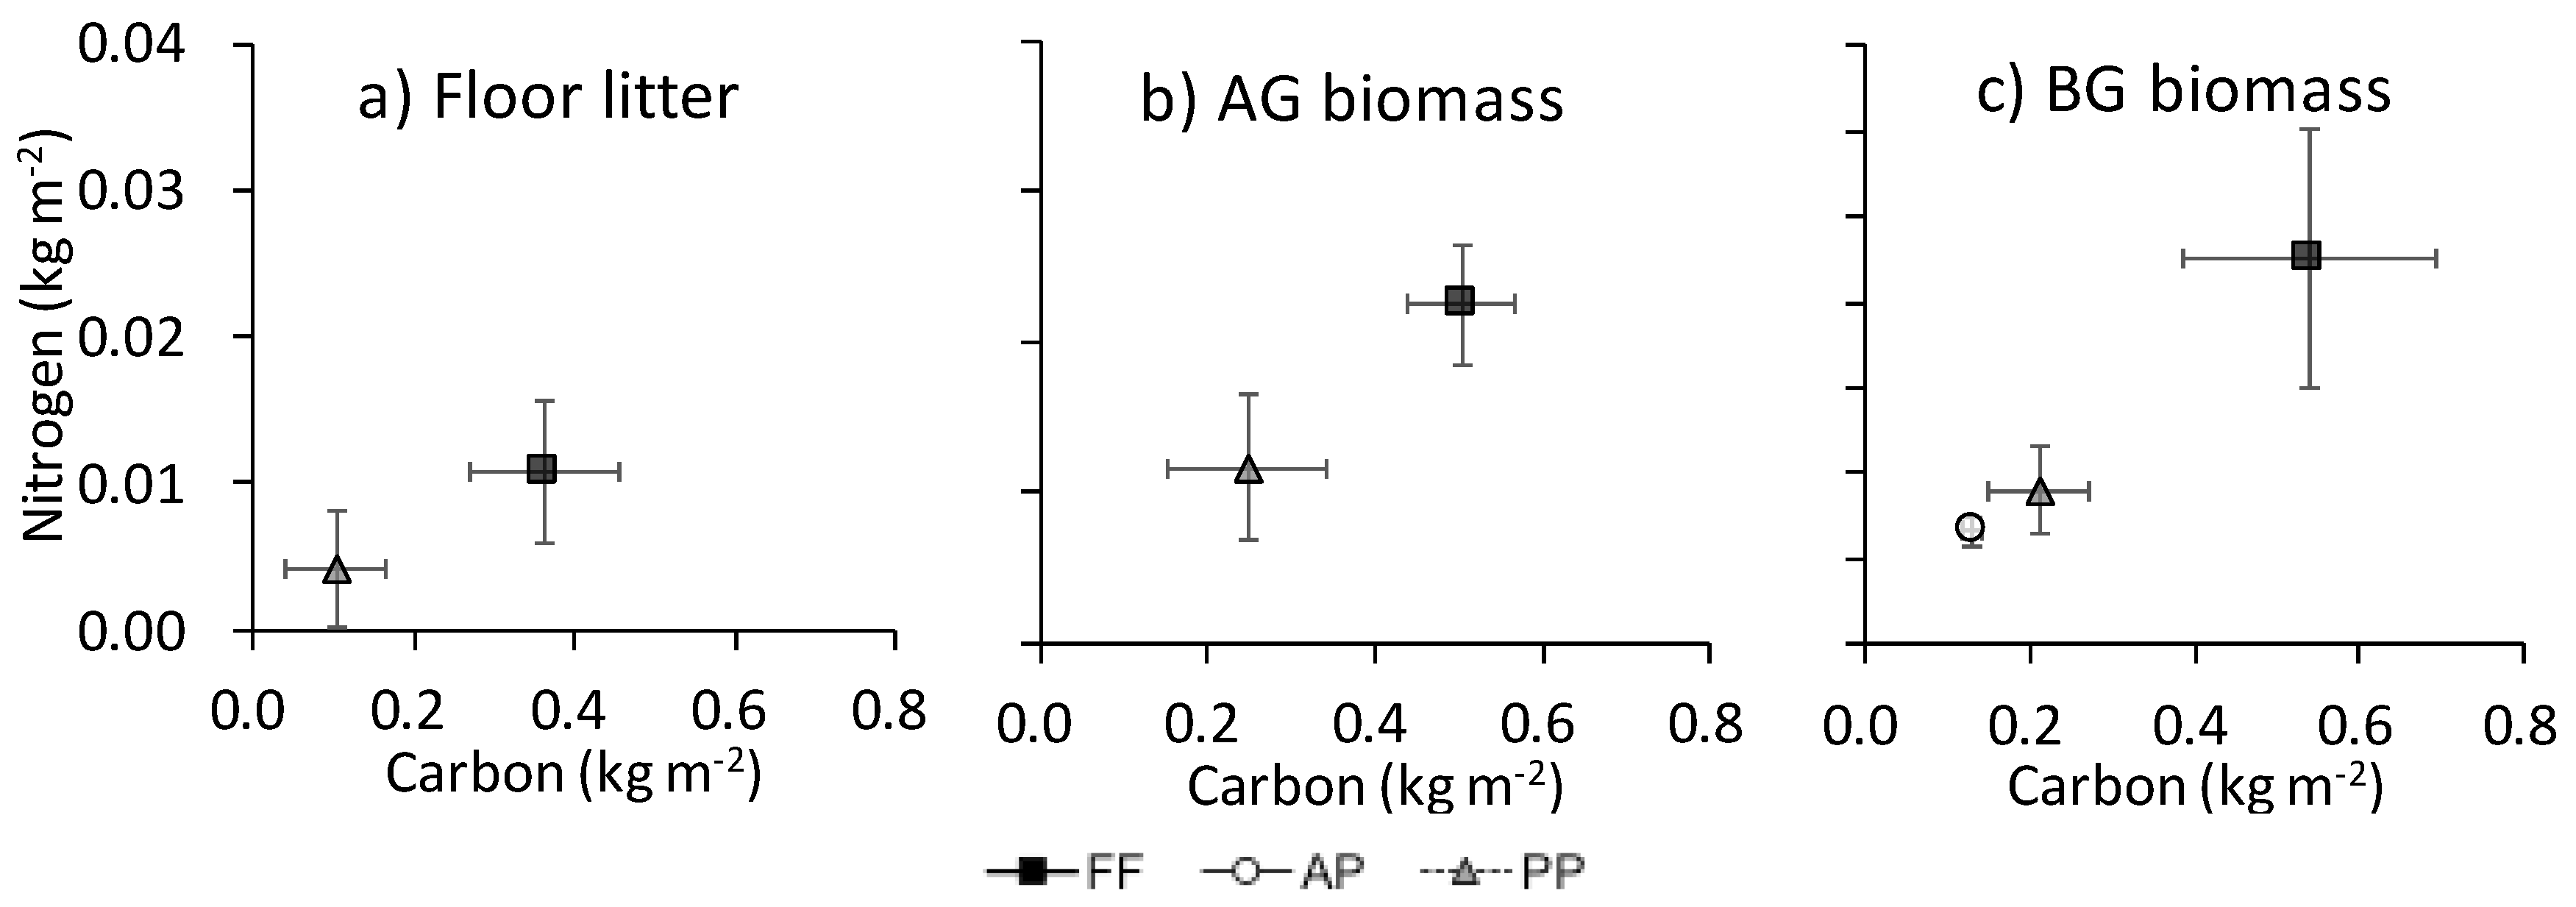
The N content was associated with C in floor litter, AG biomass, and BG biomass (Appendix B). The ratio of N to C in floor litter was marginally higher in FF (34.0% ± 4.8%) than in PP (24.9% ± 1.1%; P = 0.061) (data not shown). The association of C with N in the whole soil did not parallel that in LF among land uses (Figure 5): in the whole soil, the ratio of N to C was especially high in AP.
4. Discussion
4.1. Plant-Derived C and N in Forest Floor Litter and Abandoned Paddies
AG biomass and litterfall in forests are major sources of C transfer into the soil through decomposition. Significantly higher floor litter C in FF than in PP indicates slower decomposition and/or faster accumulation in FF (Table 1). In a mature Cryptomeria japonica forest, annual litterfall C was 0.27 kg m−2 [18]. Therefore, litter production C as the sum of this plus AG biomass C from grasses is about 0.8 kg m−2, indicating that the total litter production in PP was more than that in FF. Although previous study showed elevated N availability in PP support litter decomposition [19], Figure 3b and Table 1 both showed low N availability in PP in our study. Long-term accumulation could contribute to the significantly higher floor litter C and BG biomass C in FF than in PP (Table 1).
LF soil C better reflects the recycling of plant-derived OM than whole-soil C and N [7,15]. Whole-soil C did not differ among land uses despite the differences in the LF soil C (Table 1) because of its large variations in FF at 0–20 cm (Figure 4). A previous study suggested that LF soil C was more sensitive to land use or environmental change than the heavy-fraction soil C [20]. During long-term abandonment, OM inputs and root activity increase AG + BG biomass, enhancing the formation of soil aggregates and the accumulation of soil C [9,21]. Significantly higher LF soil C and N in some soil layers in FF in our study suggest long-term OM accumulation. AG biomass was higher in PP than in FF (Figure 3a), but the LF soil C input was less in PP than in FF at 0–5 cm (Figure 4b). The C in litter may be slow to move into the mineral soil in the early stages following abandonment [15]. A steady state following the conversion from cropland to grassland may be reached after more than 150 years [22]. Although our results show that abandonment did not increase the C and N pools (Table 1), the ecosystem will not reach a steady state quickly. Previous studies have indicated that soil C accumulation after paddy abandonment increases at poorly drained low land sites [23,24] and decreases at well-drained mountainous sites [25,26]. Abandoned upper terraced paddies are exposed to the atmosphere, while the lower slope position usually maintains high groundwater levels [27]. The gentle C increase after land use was caused by our mountainous fields at the upper part of terraced paddies, supporting the previous studies [25,26].
4.2. Crop-Derived C and N
Through the regional OM cycle, terraced rice paddies are likely to help sustain soil stability. Our results show that abandonment reduced LF soil C and N at 20–30 cm. Whole-soil N at 20–30 cm was highest in AP, in agreement with the higher LF soil N at 20–30 cm than in FF and PP (Figure 4b,d). The lower soil N in PP indicates that plant-derived N cannot compensate for the soil N reduction at 20–30 cm after abandonment. This may be a consequence of the length of time it takes for C and N to move down through the soil profile; not enough time has passed since abandonment to see a clear result in PP. In fertilized paddies, crop residues may stimulate nutrient cycling and lead to a positive feedback of C and N in the paddy ecosystems. Although annual crop residue application can move N into the soil, abandonment cannot increase soil N at 20–30 cm. Plant-derived N may not be enough to increase the soil N pool [15]. Furthermore, the decrease in the whole-soil N over time could be attributed to the exposure of easily oxidizable N in soil following abandonment [28]. Environmental changes from submerged to un-submerged conditions can lead to drastic decreases in whole-soil and LF N.
Our results indicate that the LF of soil can show some differences in plant-derived C among land uses. Further research on the availability of other nutrients is still needed, and more complex ecological questions require continued development of our understanding of C and N recycling from different sources in forests, active paddies, and abandoned paddies. It is well known that the soil C pool plays an important role in determining soil chemical properties—including pH, nutrient availability, and nutrient cycling—and buffers against sudden fluctuations. From the viewpoint of sustainable management of soil C and N, it is necessary to review the functions of terraced rice paddies during land use change.
4.3. Possible Effect of Agricultural Abandonment on Nutrient Cycling
In temperate agricultural landscapes in Japan, some perennial grasses (e.g., Phragmites australis, Miscanthus sinensis, Miscanthus sacchariflorus) come to dominate within about five years after abandonment of paddy fields [29]. In our study area, giant perennial Miscanthus sinensis dominated in PP (Appendix A). In temperate East Asia, giant perennial Miscanthus grasses can achieve high yields with low inputs of N [10,30]. An increase in leaf area has less effect in increasing the productivity of Miscanthus than of other grasses [31]. Although a low rate of N cycling is associated with low biomass productivity in abandoned agroecosystems [32], Miscanthus sinensis might be able to compensate for the N reduction. This might be one reason for the lack of significant differences in soil N between AP and PP (Table 1), especially in the surface layer. Litter C and N inputs are strongly associated with plant growth traits to maximize resource gain or to conserve nutrients [33]. Because successional stages differ depending on climatic and local environmental conditions such as soil water content, light, or adjacent land use [34], further research is needed for clarifying the potential effects of abandonment on ecosystem nutrient cycling for sustainable use of paddy fields.
5. Conclusions
This study investigated the effects of land use on plant-derived C and N pools in terraced rice paddies. To compare plant-derived C and N among land uses, we compared adjacent forest floor, agricultural paddy, and post-agricultural paddy sites in a mountain village in Japan.
Floor litter C in forest floor was 3.6× that in post-paddy. Furthermore, significantly higher LF soil C and N in some soil layers in forest floor suggested long-term organic matter accumulation. Agricultural abandonment did not increase the C and N pools, the ecosystem will not reach a steady state quickly in the last 20 years in our study. The gentle increase after the abandonment of terraced paddies is caused by the geographic character in mountainous, supporting the previous studies. Lowland paddies may show the different proceeding in increasing C after the abandonment.
LF soil C and N gradually decreased with soil depth in forest floor and post-paddy, but gradually increased in agricultural paddy. Terraced agricultural paddies are likely to help sustain soil C and N stabilities in a mountain village.
In post-paddy, plant-derived N cannot compensate for the soil N reduction associated with low biomass productivity. However, successional vegetation might be possible to compensate for the N reduction. Further research is needed to elucidate potential effects of abandonment on ecosystem nutrient cycling in consideration of various patterns of vegetation succession.
Acknowledgments
This study was supported by the Ministry of the Environment, Japan (Environment Research and Technology Development Fund 2-1601 and 1-1401). We thank the farmer at the study site who kindly gave us permission for the soil and plant surveys, Rota Wagai (NARO/NIAES) for his advice with soil density fraction analysis, and Mieko Takasugi and Maiko Omote (NARO/HARC/M) for their assistance with plant and soil analyses.
Author Contributions
Seiji Shimoda designed the study, and contributed to analysis and interpretation of data, and wrote the initial draft of the manuscript. Tomoyo F. Koyanagi contributed to interpretation of data, and critically reviewed the manuscript.
Conflicts of Interest
The authors declare no conflict of interest.
Abbreviations
| AG | aboveground |
| AP | agricultural paddy field |
| BG | belowground |
| C | carbon |
| FF | forest floor |
| LF | low-density fraction |
| N | nitrogen |
| OM | organic matter |
| PP | post-agricultural paddy field |
Appendix A

Table A1.
Plant species at forest floor (FF) and post-agricultural paddy (PP) sites.
| Area | A | B | C | D | A | B | C | D | ||
|---|---|---|---|---|---|---|---|---|---|---|
| Land Use | FF | FF | FF | FF | PP | PP | PP | PP | ||
| Life | Family | Species | ||||||||
| Annuals | Asteraceae | Bidens frondosa | 100 | 42 | ||||||
| Annuals | Balsaminaceae | Impatiens noli-tangere | 77 | |||||||
| Annuals | Commelinaceae | Commelina communis | 4 | |||||||
| Annuals | Fabaceae | Amphicarpaea bracteata subsp. edgeworthii | 42 | 12 | 5 | 7 | ||||
| Annuals | Fabaceae | Desmodium paniculatum | 10 | |||||||
| Annuals | Fabaceae | Vigna angularis var. nipponensis | 31 | 85 | ||||||
| Annuals | Poaceae | Digitaria ciliaris | 17 | 7 | ||||||
| Annuals | Poaceae | Oplismenus undulatifolius | 15 | |||||||
| Annuals | Polygonaceae | Persicaria longiseta | 3 | |||||||
| Annuals | Polygonaceae | Polygonum thunbergii | 12 | 58 | 506 | 4 | 266 | |||
| Perennials | Apiaceae | Hydrocotyle ramiflora | 2 | 3 | ||||||
| Perennials | Apiaceae | Oenanthe javanica | 1 | |||||||
| Perennials | Asteraceae | Artemisia indica | 89 | 20 | 544 | |||||
| Perennials | Asteraceae | Petasites japonicus | 86 | 2 | ||||||
| Perennials | Houttuynia | Houttuynia cordata | 97 | 110 | 2 | 17 | ||||
| Perennials | Fabaceae | Pueraria lobata | ||||||||
| Perennials | Onagraceae | Oenothera odorata | 1 | 1 | ||||||
| Perennials | Plantaginaceae | Plantago asiatica | 1 | |||||||
| Perennials | Poaceae | Eragrostis ferruginea | 11 | 5 | ||||||
| Perennials | Poaceae | Miscanthus sinensis | 8 | 35 | 268 | 34 | 325 | 713 | ||
| Perennials | Poaceae | Sasa nipponica | 734 | 4 | ||||||
| Perennials | Polygonaceae | Reynoutria japonica | 44 | 6 | ||||||
| Perennials | Equisetaceae | Equisetum arvense | 18 | |||||||
| Perennials | Thelypteridaceae | Thelypteris palustris | 17 | 9 | 213 | 286 | ||||
| Perennials | Vitaceae | Cayratia japonica | 2 | 37 | 649 | 24 | 325 | 482 | 29 | |
| Perennials | Vitaceae | Vitis ficifolia var. lobata | 42 |
Black: dominant species in biomass; gray: species present.
Appendix B
Figure A1.
Relationship between C and N contents (kg m−2) in (a) floor litter, (b) AG biomass, and (c) BG biomass. Bars show SEM (n = 4).
Figure A1.
Relationship between C and N contents (kg m−2) in (a) floor litter, (b) AG biomass, and (c) BG biomass. Bars show SEM (n = 4).

References
- Matsumura, T.; Takeda, Y. Relationship between species richness and spatial and temporal distance from seed source in semi-natural grassland. Appl. Veg. Sci. 2010, 13, 336–645. [Google Scholar] [CrossRef]
- Koyanagi, T.F.; Yamada, S.; Yonezawa, K.I.; Kitagawa, Y.; Ichikawa, K. Plant species richness and composition under different disturbance regimes in marginal grasslands of a Japanese terraced paddy field landscape. Appl. Veg. Sci. 2014, 17, 636–644. [Google Scholar] [CrossRef]
- Normile, D. Nature from nurture. Science 2016, 351, 908–910. [Google Scholar] [CrossRef] [PubMed]
- Shimoda, M.; Inagaki, H. Abandonment process of terraced paddy fields, and restoration of their landscapes and floras in recent years—Case studies in Shizuoka Prefecture, Central Japan. Wetl. Res. 2012, 2, 15–26. [Google Scholar]
- Nakajima, M.; Cheng, W.; Hanayama, S.; Okada, M. Shallow autumn tillage does not reduce CH4 emission from an Andisol paddy field in Morioka, a cold region in Japan. J. Agric. Meteorol. 2017, 73, 92–99. [Google Scholar] [CrossRef]
- Weaver, J.E. Summary and interpretation of underground development in natural grassland communities. Ecol. Monogr. 1958, 28, 55–78. [Google Scholar] [CrossRef]
- Wagai, R.; Mayer, L.M.; Kitayama, K. Nature of the “occluded” low-density fraction in soil organic matter studies: A critical review. Soil Sci. Plant Nutr. 2009, 55, 13–25. [Google Scholar] [CrossRef]
- Kalbitz, K.; Schmerwitz, J.; Schwesig, D.; Matzner, E. Biodegradation of soil-derived dissolved organic matter as related to its properties. Geoderma 2003, 113, 273–291. [Google Scholar] [CrossRef]
- Faucon, M.P.; Houben, D.; Lambers, H. Plant functional traits: Soil and ecosystem services. Trends Plant Sci. 2017, 22, 385–394. [Google Scholar] [CrossRef] [PubMed]
- Natuhara, Y. Ecosystem services by paddy fields as substitutes of natural wetlands in Japan. Ecol. Eng. 2013, 56, 97–106. [Google Scholar] [CrossRef]
- Homma, K.; Horie, T.; Shiraiwa, T.; Supapoj, N.; Matsumoto, N.; Kabaki, N. Toposequential variation in soil fertility and rice productivity of rainfed lowland paddy fields in mini-watershed (Nong) in Northeast Thailand. Plant Prod. Sci. 2003, 6, 147–153. [Google Scholar] [CrossRef]
- Boling, A.A.; Tuong, T.P.; Suganda, H.; Konboon, Y.; Harnpichitvitaya, D.; Bouman, B.A.M.; Franco, D.T. The effect of toposequence position on soil properties, hydrology, and yield of rainfed lowland rice in Southeast Asia. Field Crops Res. 2008, 106, 22–33. [Google Scholar] [CrossRef]
- Yonemura, S.; Ono, K.; Ikawa, H.; Kim, W.; Mano, M.; Miyata, A. Comparison of fallow season CO2 efflux from paddy soil estimated using laboratory incubation with eddy covariance-based flux. J. Agric. Meteorol. 2017, 73, 140–145. [Google Scholar] [CrossRef]
- Descloux, S.; Chanudet, V.; Poilvé, H.; Grégoire, A. Co-assessment of biomass and soil organic carbon stocks in a future reservoir area located in Southeast Asia. Environ. Monit. Assess. 2011, 173, 723–741. [Google Scholar] [CrossRef] [PubMed]
- Shimoda, S. Plant-derived carbon and nitrogen addition due to mowing in the early stages of post-agricultural succession. Ecol. Eng. 2017, 98, 24–31. [Google Scholar] [CrossRef]
- Shimoda, S.; Koga, N. Rapid change in soil C storage associated with vegetation recovery after cessation of cultivation. Soil Sci. Plant Nutr. 2013, 59, 27–34. [Google Scholar] [CrossRef]
- Ellert, B.H.; Bettany, J.R. Calculation of organic matter and nutrients stored in soils under contrasting management regimes. Can. J. Soil Sci. 1995, 75, 529–538. [Google Scholar] [CrossRef]
- Yashiro, Y.; Lee, N.Y.M.; Ohtsuka, T.; Shizu, Y.; Saitoh, T.M.; Koizumi, H. Biometric-based estimation of net ecosystem production in a mature Japanese cedar (Cryptomeria japonica) plantation beneath a flux tower. J. Plant Res. 2010, 123, 463–472. [Google Scholar] [CrossRef] [PubMed]
- Dirnböck, T.; Grandin, U.; Bernhardt-Römermann, M.; Beudert, B.; Canullo, R.; Forsius, M.; Grabner, M.T.; Holmberg, M.; Kleemola, S.; Lundin, L.; et al. Forest floor vegetation response to nitrogen deposition in Europe. Glob. Chang. Biol. 2014, 20, 429–440. [Google Scholar] [CrossRef] [PubMed]
- Schrumpf, M.; Kaiser, K.; Guggenberger, G.; Persson, T.; Kögel-Knabner, I.; Schulze, E.D. Storage and stability of organic carbon in soils as related to depth, occlusion within aggregates, and attachment to minerals. Biogeosciences 2013, 10, 1675–1691. [Google Scholar] [CrossRef]
- Arai, M.; Minamiya, Y.; Tsuzura, H.; Watanabe, Y.; Yagioka, A.; Kaneko, N. Changes in water stable aggregate and soil carbon accumulation in a no-tillage with weed mulch management site after conversion from conventional management practices. Geoderma 2014, 221, 50–60. [Google Scholar] [CrossRef]
- Poeplau, C.; Don, A. Carbon sequestration in agricultural soils via cultivation of cover crops – a meta-analysis. Agric. Ecosyst. Environ. 2015, 200, 33–41. [Google Scholar] [CrossRef]
- Anzai, T.; Matsumoto, N. Emergence of weeds and changes in soil properties in fallow paddy fields. Bull. Chiba-Ken Agric. Exp. Stn. 1989, 29, 93–104. (In Japanese) [Google Scholar]
- Zhang, J.B.; Song, C.C.; Wang, S.N. Dynamics of soil organic carbon and its fractions after abandonment of cultivated wetlands in northeast China. Soil Tillage Res. 2007, 96, 350–360. [Google Scholar]
- Ohta, K.; Taniyama, I.; Kusaba, T.; Mori, A.; Araya, H. Changes in the soil properties of terrace paddy fields with the years after abandoned. Soil Phys. Cond. Plant Growth Jpn. 1996, 73, 3–10. (In Japanese) [Google Scholar]
- Shimoda, S.; Sakurai, Y. Effect of flooding management on carbon content of soil and plant after cessation of paddy rice cultivation. Appl. Ecol. Environ. Res. 2013, 11, 513–524. [Google Scholar] [CrossRef]
- Oyanagi, N.; Nakata, M. Dynamics of dissolved ions in the soil of abandoned terraced paddy fields in Sado Island, Japan. Paddy Water Environ. 2010, 8, 121–129. [Google Scholar] [CrossRef]
- Pampolino, M.F.; Laureles, E.V.; Gines, H.C.; Buresh, R.J. Soil carbon and nitrogen changes in long-term continuous lowland rice cropping. Soil Sci. Soc. Am. J. 2008, 72, 798–807. [Google Scholar] [CrossRef]
- Iwata, F.; Narioka, H. Change of soil structure and plant succession of renounced rice field in hilled rural area. J. Agric. Eng. Soc. Jpn. 2002, 70, 207–210. (In Japanese) [Google Scholar]
- Stewart, J.; Toma, Y.; Fernandez, F.G.; Nishiwaki, A.; Yamada, T.; Bollero, G. The ecology and agronomy of Miscanthus sinensis, a species important to bioenergy crop development, in its native range in Japan: A review. Glob. Chang. Biol. Bioenergy 2009, 1, 126–153. [Google Scholar] [CrossRef]
- Shimoda, S.; Lee, G.; Yokoyama, T.; Liu, J.; Saito, M.; Oikawa, T. Response of ecosystem CO2 exchange to biomass productivity in a high yield grassland. Environ. Exp. Bot. 2009, 65, 425–431. [Google Scholar] [CrossRef]
- Knops, J.M.; Tilman, D. Dynamics of soil nitrogen and carbon accumulation for 61 years after agricultural abandonment. Ecology 2000, 81, 88–98. [Google Scholar] [CrossRef]
- Orwin, K.H.; Buckland, S.M.; Johnson, D.; Turner, B.L.; Smart, S.; Oakley, S.; Bardgett, R.D. Linkages of plant traits to soil properties and the functioning of temperate grassland. J. Ecol. 2010, 98, 1074–1083. [Google Scholar] [CrossRef]
- Kusumoto, Y.; Ohkuro, T.; Ide, M. The relationships between the management history and vegetation types of fallow paddy field and abandoned paddy fields—Case study of Sakuragawa and Kokaigawa river basin in Ibaraki prefecture. J. Rural Plan. Assoc. 2005, 7, 7–12. (In Japanese) [Google Scholar] [CrossRef]
Figure 1.
Layout of the study fields. Fields with the same letter (A–D) have the same elevation. Dashed lines indicate upland crop fields. FF, forest floor; AP, agricultural paddy; PP, post-agricultural paddy.
Figure 1.
Layout of the study fields. Fields with the same letter (A–D) have the same elevation. Dashed lines indicate upland crop fields. FF, forest floor; AP, agricultural paddy; PP, post-agricultural paddy.

Figure 2.
Schematic diagram of C and N estimation.

Figure 3.
Distribution of plant N on (a) AG biomass basis and (b) species number basis at forest floor (FF) and post-agricultural paddy (PP) sites.
Figure 3.
Distribution of plant N on (a) AG biomass basis and (b) species number basis at forest floor (FF) and post-agricultural paddy (PP) sites.
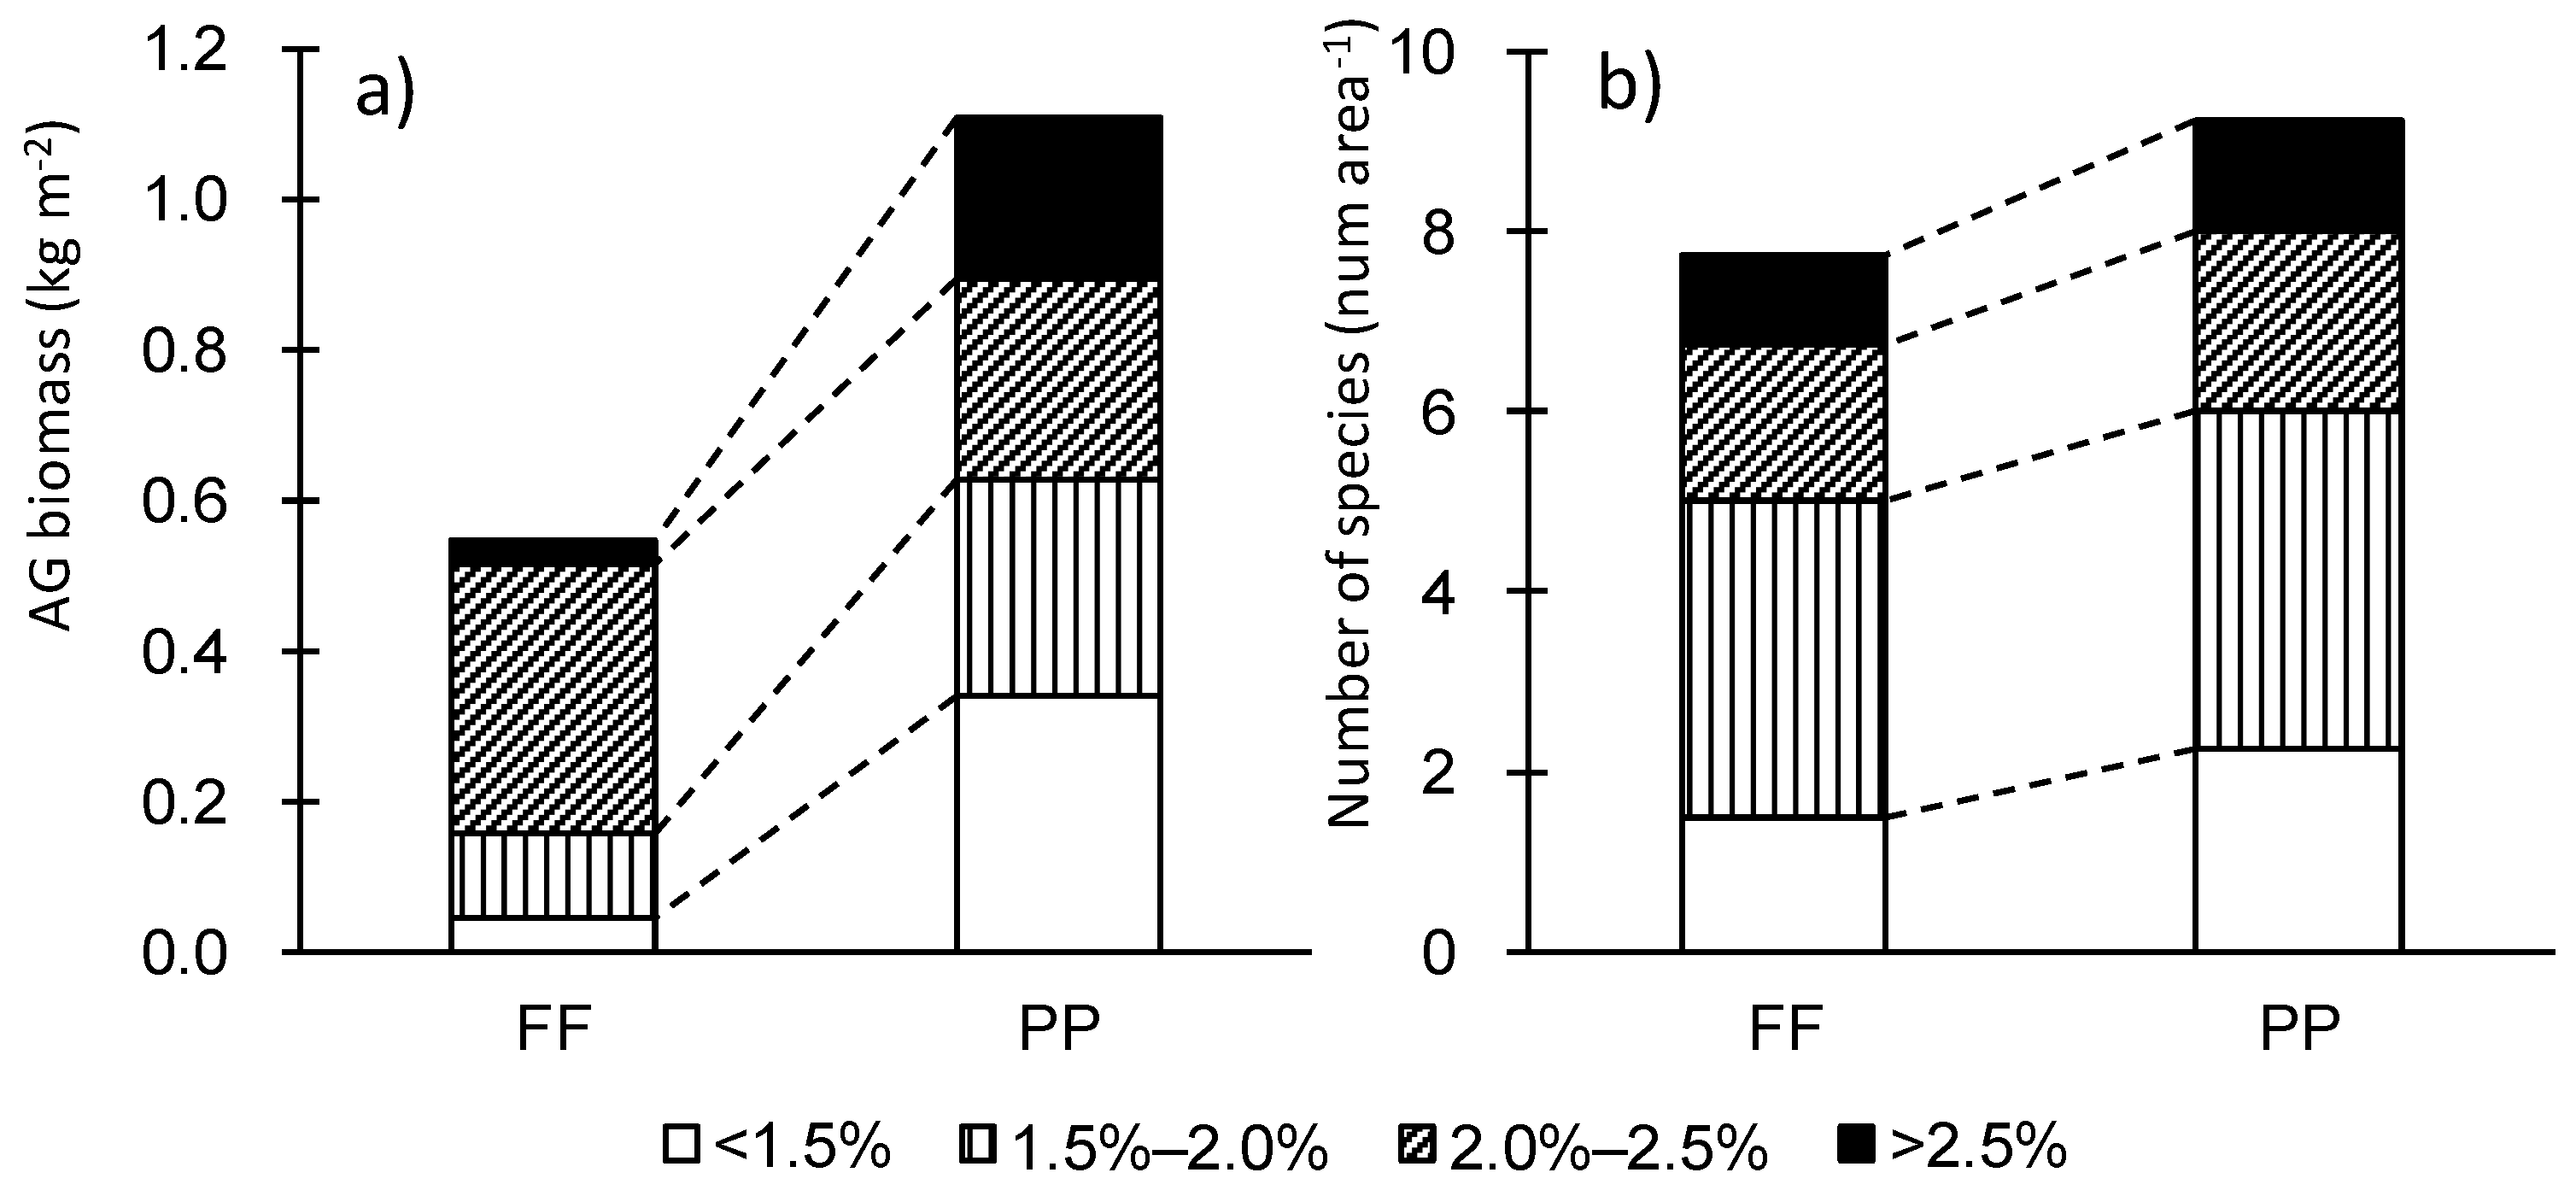
Figure 4.
Differences in (a,b) whole-soil C and N, (c,d) soil LF C and N, and (e,f) BG biomass C and N among land uses by depth. Points with the same letter at the same depth are not significantly different (P < 0.05). FF, forest floor; AP, agricultural paddy; PP, post-agricultural paddy.
Figure 4.
Differences in (a,b) whole-soil C and N, (c,d) soil LF C and N, and (e,f) BG biomass C and N among land uses by depth. Points with the same letter at the same depth are not significantly different (P < 0.05). FF, forest floor; AP, agricultural paddy; PP, post-agricultural paddy.
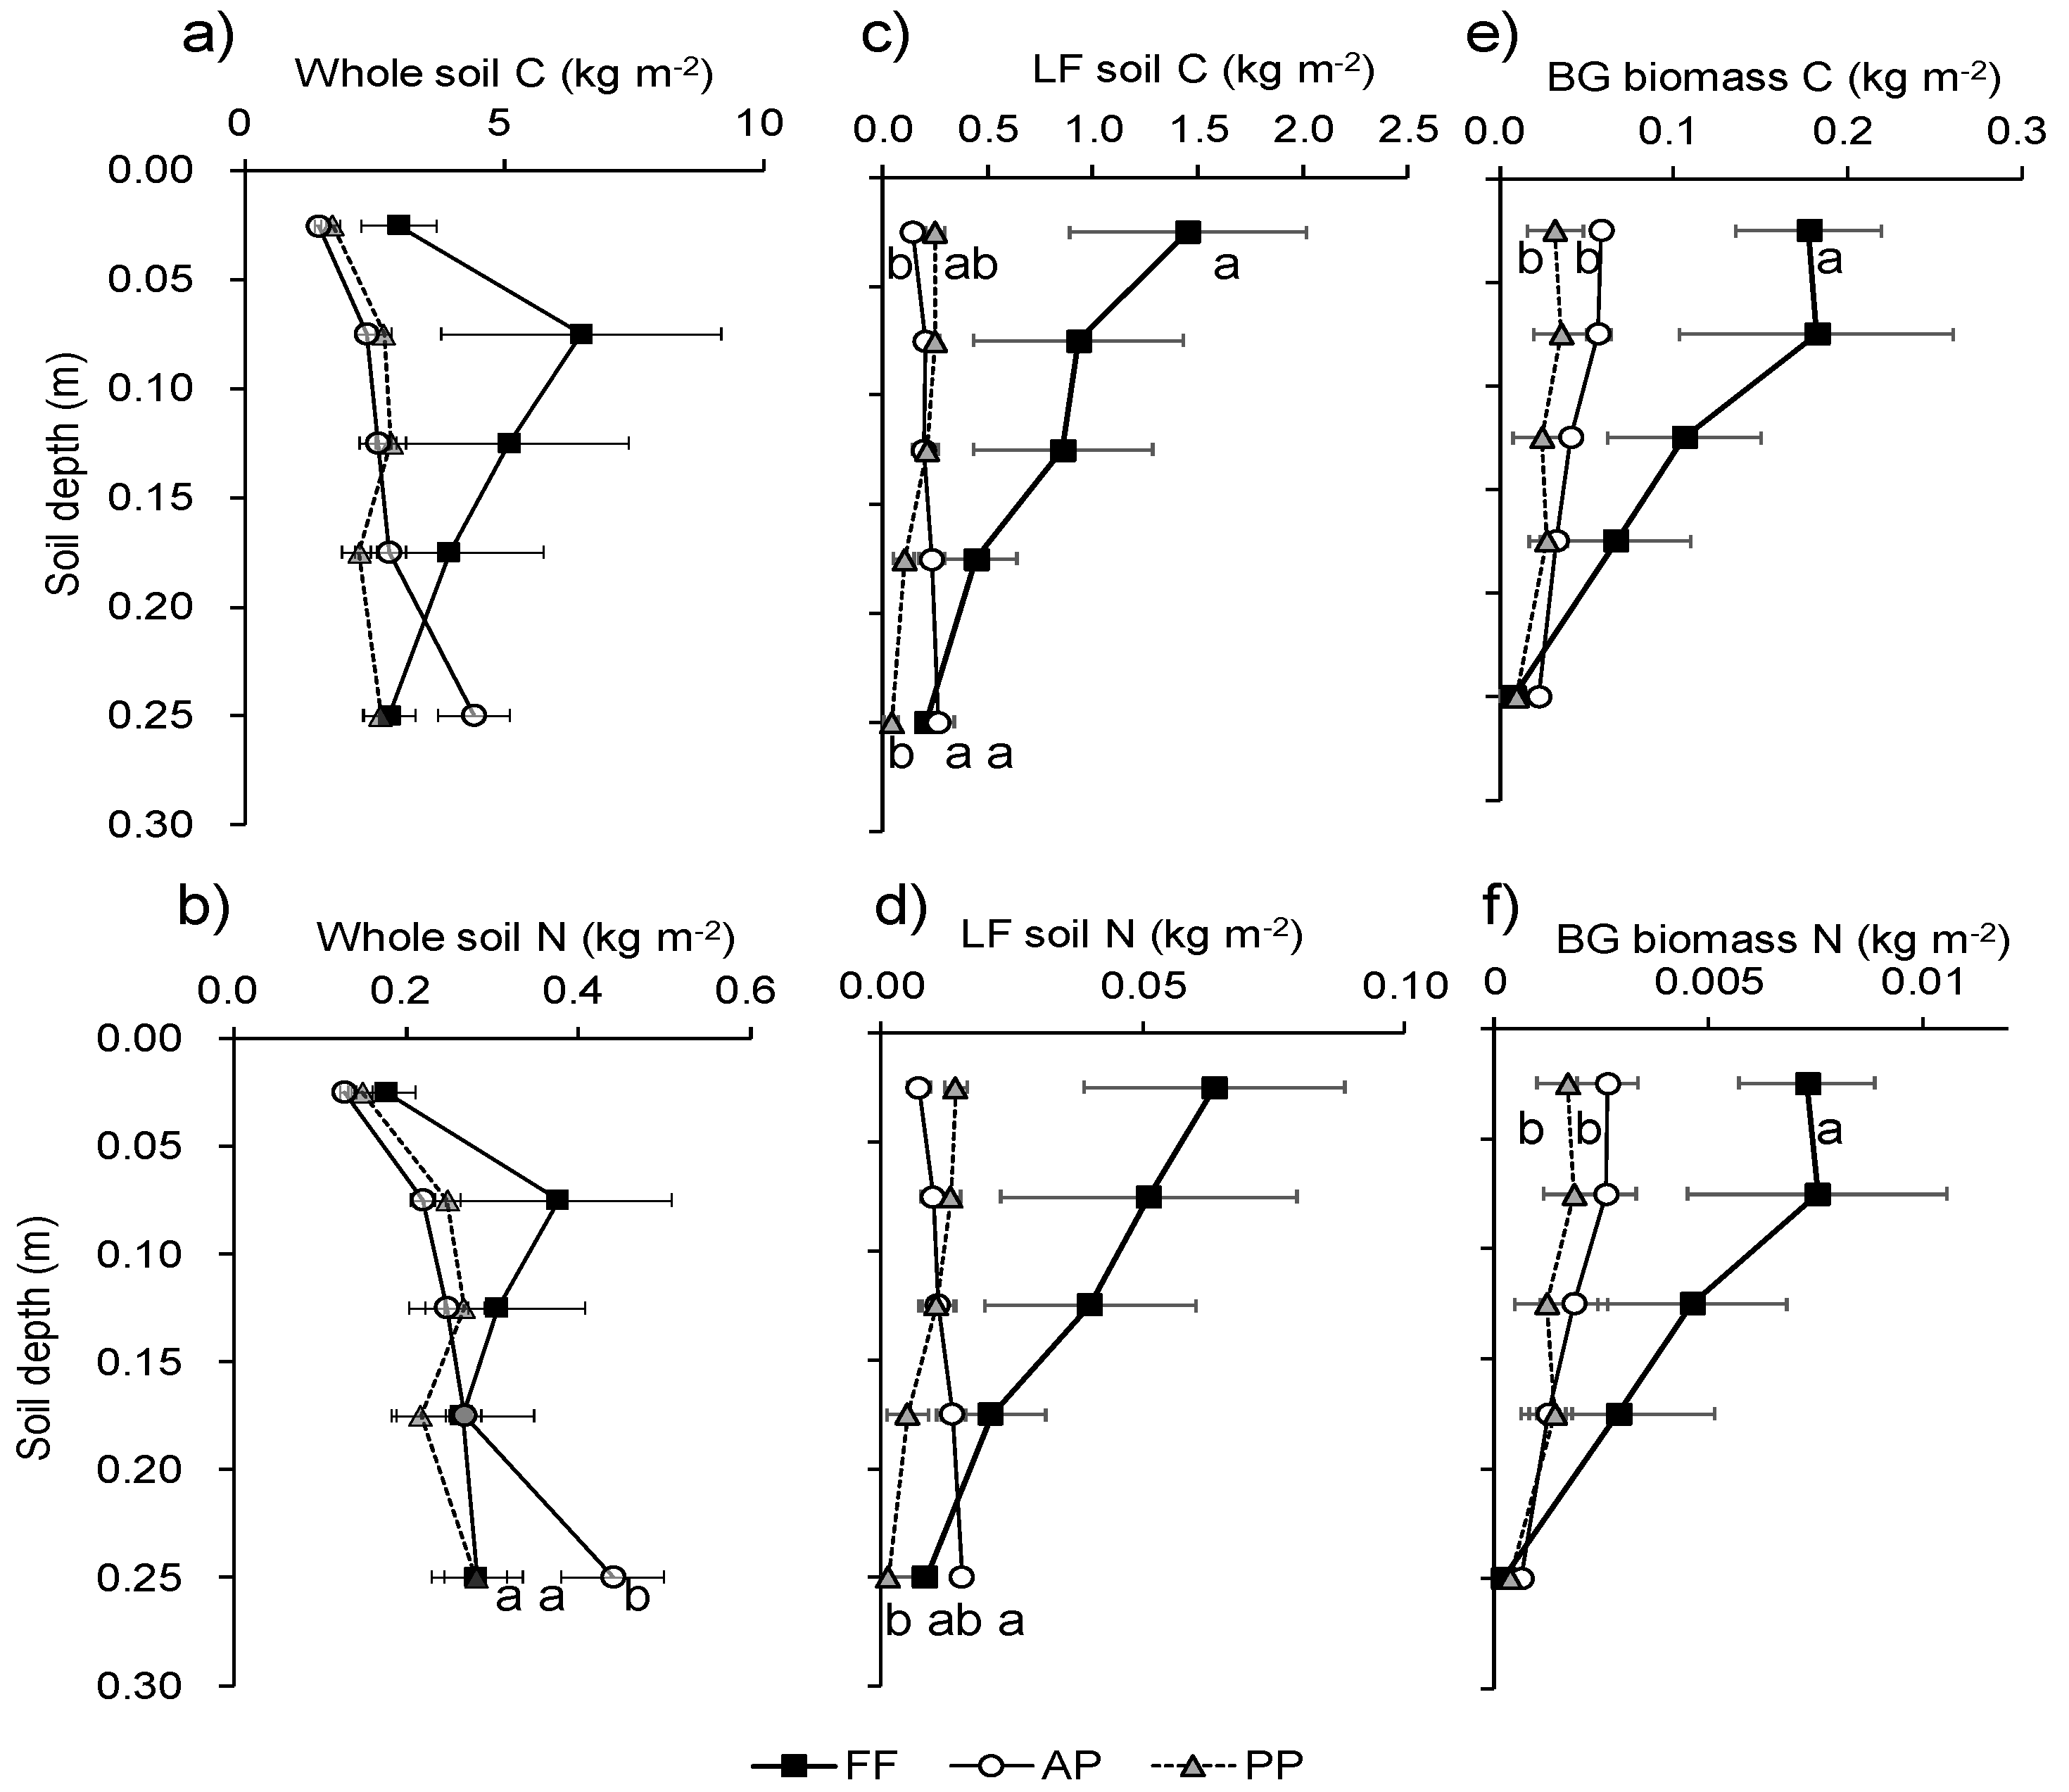
Figure 5.
Relationship between C and N contents (kg m−2) in (a) LF and (b) whole soil. Bars show standard error of the mean (n = 4).
Figure 5.
Relationship between C and N contents (kg m−2) in (a) LF and (b) whole soil. Bars show standard error of the mean (n = 4).
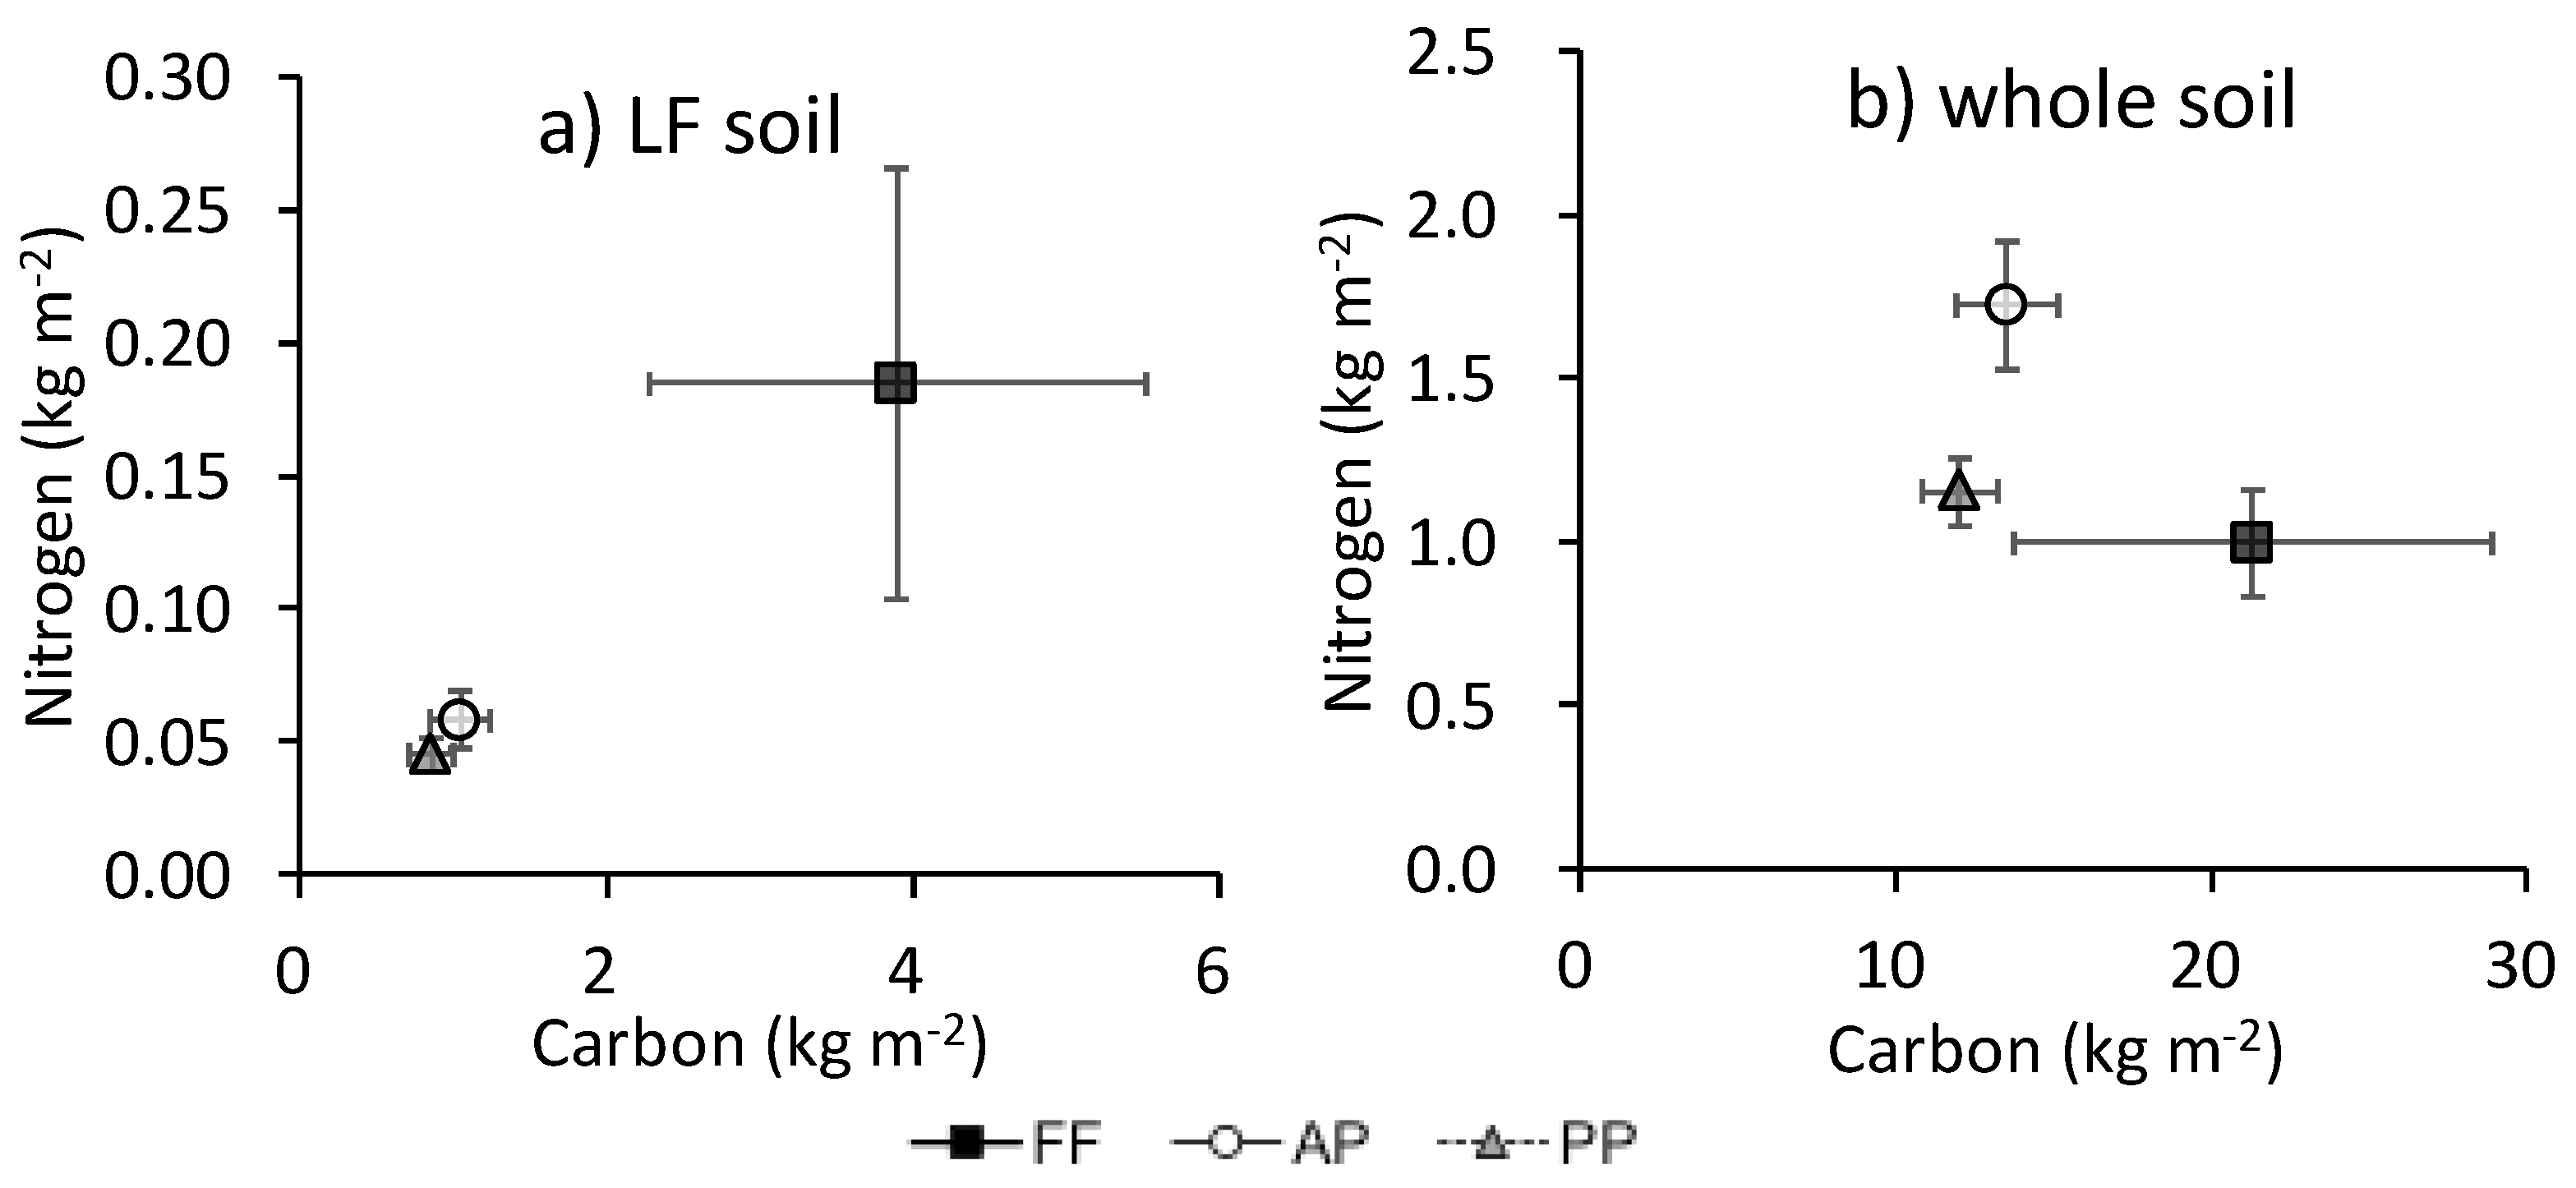
Table 1.
Carbon (C) and nitrogen (N) contents of litter, AG biomass, BG biomass, whole soil, and low-density fraction (LF) by land use (mean ± standard error of the mean, n = 4).
Table 1.
Carbon (C) and nitrogen (N) contents of litter, AG biomass, BG biomass, whole soil, and low-density fraction (LF) by land use (mean ± standard error of the mean, n = 4).
| Floor Litter | AG Biomass | BG Biomass | Whole Soil | Soil LF | |||||||||||
|---|---|---|---|---|---|---|---|---|---|---|---|---|---|---|---|
| C | |||||||||||||||
| FF | 0.36 | a | ±0.09 | 0.25 | a | ±0.09 | 0.54 | a | ±0.15 | 21.3 | a | ±7.59 | 3.90 | a | ±1.63 |
| AP | – | – | 0.13 | b | ±0.01 | 13.5 | a | ±1.59 | 1.05 | ab | ±0.19 | ||||
| PP | 0.10 | b | ±0.06 | 0.50 | a | ±0.06 | 0.21 | b | ±0.06 | 12.0 | a | ±1.20 | 0.86 | b | ±0.14 |
| N | |||||||||||||||
| FF | 0.011 | a | ±0.005 | 0.012 | a | ±0.005 | 0.023 | a | ±0.008 | 1.0 | a | ±0.16 | 0.18 | a | ±0.08 |
| AP | – | – | 0.007 | a | ±0.001 | 1.7 | a | ±0.19 | 0.06 | a | ±0.01 | ||||
| PP | 0.004 | a | ±0.004 | 0.022 | a | ±0.004 | 0.009 | a | ±0.003 | 1.2 | a | ±0.11 | 0.04 | a | ±0.01 |
Note: Values followed by the same letter within a column and element are not significantly different (P < 0.05).
© 2017 by the authors. Licensee MDPI, Basel, Switzerland. This article is an open access article distributed under the terms and conditions of the Creative Commons Attribution (CC BY) license (http://creativecommons.org/licenses/by/4.0/).
Share and Cite
MDPI and ACS Style
Shimoda, S.; Koyanagi, T.F. Land Use Alters the Plant-Derived Carbon and Nitrogen Pools in Terraced Rice Paddies in a Mountain Village. Sustainability 2017, 9, 1973. https://doi.org/10.3390/su9111973
AMA Style
Shimoda S, Koyanagi TF. Land Use Alters the Plant-Derived Carbon and Nitrogen Pools in Terraced Rice Paddies in a Mountain Village. Sustainability. 2017; 9(11):1973. https://doi.org/10.3390/su9111973
Chicago/Turabian StyleShimoda, Seiji, and Tomoyo F. Koyanagi. 2017. "Land Use Alters the Plant-Derived Carbon and Nitrogen Pools in Terraced Rice Paddies in a Mountain Village" Sustainability 9, no. 11: 1973. https://doi.org/10.3390/su9111973
Note that from the first issue of 2016, this journal uses article numbers instead of page numbers. See further details here.