Optimal Site Selection of Wind-Solar Complementary Power Generation Project for a Large-Scale Plug-In Charging Station

1
School of Economics and Management, North China Electric Power University, Beijing 102206, China
2
Northwest Electric Power Design Institute Corporation, Xi’an 710075, China
*
Author to whom correspondence should be addressed.
Sustainability 2017, 9(11), 1994; https://doi.org/10.3390/su9111994
Submission received: 28 September 2017
/
Revised: 25 October 2017
/
Accepted: 25 October 2017
/
Published: 31 October 2017
(This article belongs to the Section Energy Sustainability)
Abstract
:The wind-solar hybrid power generation project combined with electric vehicle charging stations can effectively reduce the impact on the power system caused by the random charging of electric cars, contribute to the in-situ wind-solar complementary system and reduce the harm arising from its output volatility. In this paper, the site selection index system of a landscape complementary power generation project is established by using the statistical methods and statistical analysis in the literature. Subsequently, using the Analytic Network Process to calculate the index weight, a cloud model was used in combination with preference ranking organization method for enrichment evaluations to transform and sort uncertain language information. Finally, using the results of the decision-making for the location of the Shanghai wind-solar complementary project and by carrying out contrast analysis and sensitivity analysis, the superiority and stability of the decision model constructed in this study was demonstrated.
1. Introduction
With the rapid development of economy, the number of traditional car purchases has grown rapidly, leading oil consumption rising, air pollution is becoming more and more serious. This situation leads that greater demands were being placed on the development of electric car. As a new energy transport vehicle, electric vehicles are one of the powerful means to achieve energy conservation and emission reduction and alleviate energy crisis Electric cars have been widely watched by governments, auto makers and energy companies and the increasing use of battery equipment and charging technology has promoted the promotion of electric vehicles. Currently, renewable energy and electric vehicles are considered as effective ways to address China’s energy crisis and environmental pollution.
Solar energy and wind energy have the advantages of universal distribution, cleanliness, immense resource potential and prolonged usage. Although renewable energies such as wind and solar are intermittent, coupling solar power with wind power can attain a complementary effect. During the daytime, when the sunlight is strong, the wind is usually weak. At night or during cloudy days, the sunlight is weak, but the wind is strong.
As a distributed power supply, wind-solar hybrid power generation is close to its load in order to provide electricity. Thus, it can prevent the transmission of power over large distances, reduce the risk of power grid collapse, strengthen the power supply security and ensure the stability of the power system.
Electric vehicles are new energy vehicles that have attracted the attention of governments, automobile manufacturers and energy companies. Combining an electric car with the integrated application of renewable energy is the most straightforward way to achieve zero discharge. In order to combine the wind-solar hybrid power generation project and electric vehicle charging stations as an organic whole, it is very important to synthetically consider their impact on the power system and traffic network. The research on the site selection of the wind-solar hybrid power generation project for a network of large-scale charging stations, on the one hand, can not only effectively reduce the impact on the power system caused by the random charging of electric cars, but also facilitate the local use of wind power and solar power and reduce the harm arising from the output volatility. On the other hand, it also enables charging stations to provide more reliable and convenient service to electric vehicles. It is a very urgent and significant issue, which deserves further investigation.
2. Literature Review
So far, the site selection for the wind-solar hybrid power generation project has been investigated in many studies [1,2,3,4,5], but the influence of a network of electric vehicle charge/battery-replacement stations on the site selection is rarely considered in such research. Many studies have investigated distributed generation and electric vehicle charge/battery-replacement stations, mainly including optimized dispatching [6,7], capacity configuration [8], reactive power optimization [9], probabilistic power flow [10], bidding strategy [11], charge-discharge strategy [12], operation strategy [13], etc. So far, only a few researchers have studied the comprehensive site selection of distributed generation and electric vehicle charge/battery-replacement stations. Specifically, Peng X. [14] considered the risks caused by inter-connectable electric vehicles to the distributed generation and considered the minimum total cost and transmission loss expense of distributed generation as the objective function to plan the site selection for distributed generation with a chance constraint. Liu B. [15] considered both site selection of distributed energy source interconnected with the charge/battery-replacement stations and the resulting influence on the distribution network and traffic network and considered the minimum total cost and transmission loss expense and maximum traffic satisfaction as the objectives to establish a routing model and traffic satisfaction evaluation model and solved the models using a free search algorithm.
Specifically, the applicability of a multi-attribute decision method mainly depends on the completeness of decision information in uncertain environment, rationality of index weight, applicability of ranking method, etc. In the research on the site selection decision problem, multiple methods can be adopted to convert decision information into linguistic variables, such as triangular fuzzy number [16], trapezoid fuzzy number [17], binary semantics [18], intuition fuzzy set [19], interval number fuzzy set [20], axiom fuzzy set [21] and rough set [22]. Although the above methods can describe the decision information in an uncertain environment with different modes, their only concern is the fuzziness, without any description of randomness in an uncertain environment. In fact, randomness and fuzziness are usually associated with each other and cannot be easily separated or independently exist and language, as the carrier of human thought and recognition, especially has such characteristics [23].
The methods generally used in site selection for determining index weights include AHP (Analytic Hierarchy Process) [24], order relation analysis method [2], fuzzy AHP [25,26], fuzzy theory [27] and fuzzy measurement [28,29]. Specifically, inter-index correlation is not considered in the first four methods; although inter-index correlation is considered in 2-addable fuzzy measurement and λ-fuzzy measurement, their calculation methods have some disadvantages. For the complex internal correlation problem existing among decision indexes, AHP is the most suitable method for solving index weight [30]; thus, it is widely applied in site selection optimization research.
Multi-attribute decision ranking methods currently used for site selection research are mainly divided into two types: the ranking method based on utility theory typically including AHP, VIKOR (Vlsekriterijumska Optimizacija I Kompromisno Resenje) and TOPSIS (Technique for Order Preference by Similarity to an Ideal Solution ) and the ranking methods established in a class higher than correlation mainly include ELECTRE(Elimination et Choice Translating Reality) and PROMETHEE (Preference Ranking Organization Method for Enrichment Evaluations) [31,32,33]. The PROMETHEE method, proposed by Brans, is a ranking method established in a class higher than correlation and can be used for solving the ranking problem of a quantity-limited scheme under the influence of mutually conflicted indexes. Compared with other multi-attribute decision ranking methods, the PROMETHEE method has solid mathematical basis and is a simple and easy-to-understand application. So far, many scholars have adopted the PROMETHEE method for site selection decision research. For example, PROMETHEE method has been successfully applied to the site selection of a logistics center [34], refuse landfill [35] and power plant [36].
On the basis of the above analysis, this study aims at expanding the PROMETHEE method to uncertain language environment using a cloud model considering the index correlation and solving the index weight using AHP. The cloud model was first proposed by Academician Li D. [37] of the Chinese Academy of Engineering for comprehensively analyzing the randomness and fuzziness in uncertain language and maximally reducing the effective information loss in uncertain language, such as the site selection of offshore wind power, refuse landfill and wind power plant. Here, in the PROMETHEE method is expanded to uncertain language environment using the cloud model; a model employing the AHP method for solving index weight is applicable to the site selection optimization research of wind-solar hybrid power generation project interconnected to large charge/battery-replacement stations and is favorable for decision implementation; further it can ensure the scientific validity and rationality of the decision result.
3. Site Selection Index System for Wind-Solar Hybrid Power Generation Project Interconnected to Large Battery-Replacement Stations
Site selection indexes of traditional wind power generation and solar power generation were statistically analyzed in this paper and the indexes were screened based on the principles aforementioned for the site selection of wind-solar hybrid power generation project. Subsequently, the influence of a network of large charge/battery-replacement stations on the wind-solar hybrid power generation project was also analyzed in this paper, in a network of large charge/battery-replacement stations not only influences the electric power system, but also influences the normal operation of the traffic network. The indexes screened in this paper were combined with the characteristics of the interconnected large charge/battery-replacement stations to comprehensively analyze and integrate them and further establish the site selection index system for the wind-solar hybrid power generation project interconnected to large charge/battery-replacement stations.
3.1. Location Index of Wind-Solar Power Generation
In this study, the review of existing literature (25 current authoritative studies [1,2,3,4,5,29,38,39,40,41,42,43,44,45,46,47,48,49,50,51,52,53,54,55,56]) was first carried out. From the analysis of the literature, it can be observed that the current indicators for wind and solar power generation sites can be mainly divided into seven aspects: natural resources, economic factors, technical factors, traffic conditions, geographical factors, social factors and environmental factors. In this study, the indexes are classified according to these seven aspects. The frequency of each index in the seven aspects is calculated separately, as listed in Table 1.
3.2. Site Selection Indexes for Large Network of Power Station in Wind-Solar Hybrid Power Generation Project
As an important part of a smart distribution grid in the future, the location layout selection of the wind-solar hybrid power generation project for charge/battery-replacement stations is determined based on the cost and the impact of social, environmental, geographical and other factors; moreover, it has a significant impact on the stability of the power system and ease of transmission.
Therefore, the indexes listed in the Table 1 cannot be directly applied to the wind-solar hybrid power generation project for a large network of power stations. The multifarious indexes are selected for sorting, merging and integration into the characteristics of a network of large charge/battery-replacement stations to establish a siting index system that satisfies the characteristics of the landscape complementary power generation project for such a network and is easy to understand and use. The indexes are listed in Table 2 and the specific meaning of each index and the necessary expressions are described.
4. Construction of Optimal Location Model under Uncertain Linguistic Environment
4.1. Location Decision Procedure under Uncertain Linguistic Setting
In order to make the PROMETHEE method more suitable for the optimal location decision of the wind-solar hybrid power generation project, this article combines it with the cloud model and extends it to an uncertain language environment, expecting to describe the nature of the subject more reasonably. Furthermore, owing to the universal connections in the natural world, there is an inevitable correlation between the sitting indexes. Based on the analysis of the relationship between the indicators, the AHP method is used to assign weights to the index. In order to increase the operability of the decision-making system, this study integrates management strategy based on the decision model and has divided the responsibilities of managers at all levels in the decision-making process, which renders it easy to carry out project management activities in practice. The decision framework of our study is presented as Figure 1.
(1) Determine feasible set
The project site will influence the electric system and traffic network. Therefore, the upper management of the project should first plan the overall development of the recharge station and the wind and solar power generation project and subsequently determine the feasible set A, which can be described as:
(2) Determine evaluation elements of decision-making
In order to ensure that the decision-making process is scientific and rational, the middle management of the project should constitute expert review teams, with each expert review team consisting of n authoritative experts. Using the documentary statistics and expert discussions, an indicator system suitable for the project site of wind and solar power generation project is determined. The indicator system can be described as:
(3) Determine indicator weight
The indicator system suited for the site of the wind and solar power generation project is composed of a series of single indicators linked with other indicators. In this study, we choose the AHP method to determine the indicator weight and the major steps are as follows.
We use Super Decision, a special software program of the AHP, to calculate the indicator weight.
- (1)
- Building the AHP structure introduction chart: Considering the site of the wind and solar power generation project for a network of large-scale recharge stations as the target, a hierarchical structure is established from the perspectives of economy, nature, geography, reliability of power supply, satisfaction of traffic, society and environment and the impact correlation between indicators is also established.
- (2)
- Pair comparison of indicators: Saaty 1–9 is used as the relative scale for measurement, as presented in Table 3. During this process, expert opinions are first inquired and subsequently, middle managers are responsible for organizing special seminars to discuss and negotiate these opinions when there are significant differences of opinions among experts.
- (3)
- Consistency test: We consider the deviation from the estimation of comparative matrix weight to be acceptable when Consistency Ratio , that represents the consistency. The estimation of pair comparison must be corrected till the requirement of consistency is satisfied when the value of CR exceeds the above value.
- (4)
- Calculation of indicator weights: A weighted supermatrix is generated after the consistency test is successful and an indicator weight sheet is generated by using Super Decision.
(4) Transformation of uncertain language
The primary managers of the project should organize a field trip for the expert review teams. After the full investigation of each alternative plan, the expert review teams should evaluate the programs in the form of language values and subsequently transform each language value into the corresponding cloud. The cloud modeling can be described as , where , representing the expectation of cloud, is the center value of the domain in a qualitative language concept; , representing the entropy of cloud, is the measurement of uncertainty of the qualitative concept; , representing the excess entropy of cloud, is the measurement of uncertainty of entropy and indicates the dispersion degree and the thickness of cloud.
Uncertain language is usually adopted to utilize the cloud model in the golden section method, but this method is usually limited to the generation of 5 or 11 clouds; therefore, in this study, using the improved language scale of uncertain linguistic transformation, concrete steps are undertaken as follows.
- (1)
- Suppose that is a linguistic value in the language collection of , the mapping from to the parameter of is defined as follows:The value of the parameter can be obtained through an experiment. Many experiments show that, if the scale of the assessment of language is 7, . [57].
- (2)
- The effective domain of discourse and the calculation of is obtained as follows:
- (3)
- Using to indicate a drop of the cloud and follows the principle of for a normal distribution curve, and can be indicated as and thus, the following equation can be obtained:
- (4)
- As , the excess entropy follows the principle of for a normal distribution curve and thus, the calculation method of can be obtained as follows:where
Given the domain of discourse , this paper proposes the use of a language set of assessment with 7 scales: very poor (VP), poor (P), moderately poor (MP), moderate (M), moderately good (MG), good (G) and very good (VG); the conversion between the undetermined language and the cloud is indicated in Table 4.
(5) Cloud gathered account settlement
The CWAA (Cloud-Weighted Arithmetic Average) operator is used to gather the opinions of the respective experts. The assessment value of under the index of for method can be obtained.
Suppose that and are two pieces of a normal cloud, for the convenience of calculation, it is necessary to establish the following definitions for the regulations of algorithms for the normal cloud:
According to the above arithmetic, the calculation method for the CWAA operator is expressed as follows:
where indicates the weight function of the respective experts and it satisfies the conditions and
Particularly, if , the CWAA operator will be degenerated into the CAA (Cloud Arithmetic Average) operator, which is expressed as follows:
(6) Construction of preference function
This study considers the principle of V as the preference function. The preference function of V type based on the cloud model under the index is defined as follows:
indicates the value of difference under the index
in the two methods and represents the critical value strictly superior to the relationship; thus, the priority of method under the index for method is expressed as follows:
(7) Determination of priority index
For each method, when the weight of the respective attributes in the method is , the priority index based on the cloud model can be expressed as follows.
(8) Determination of outflow
The outflow of each method can be expressed as the degree of priority of this method compared to the other methods and it is calculated as follows:
(9) Determination of inflow
The inflow of each method can be expressed as the degree of inferiority of this method compared to the other methods and it is calculated as follows:
(10) Calculation of the net flow of the respective methods
(11) Comparison of size of the cloud
Considering is a drop of the cloud, given the three parameters of the cloud and the quantity of generation of the cloud drops, we can compare the size of the cloud using the generator of a normal affiliated cloud and the specific steps are described as follows:
- (1)
- Input: Three parameters of and the quantity of generation of cloud drops n into Generator of normal affiliated cloud;
- (2)
- The generation of random number ,
- (3)
- The generation of random number ;
- (4)
- ;
- (5)
- Repeat the above stated steps from (1) to (3) until the generation of n drops of cloud.The expected value s for the global score of cloud A can be obtained as follows:Given two pieces of cloud A and B, if , .
4.2. Analysis of Example
4.2.1. Example Overview
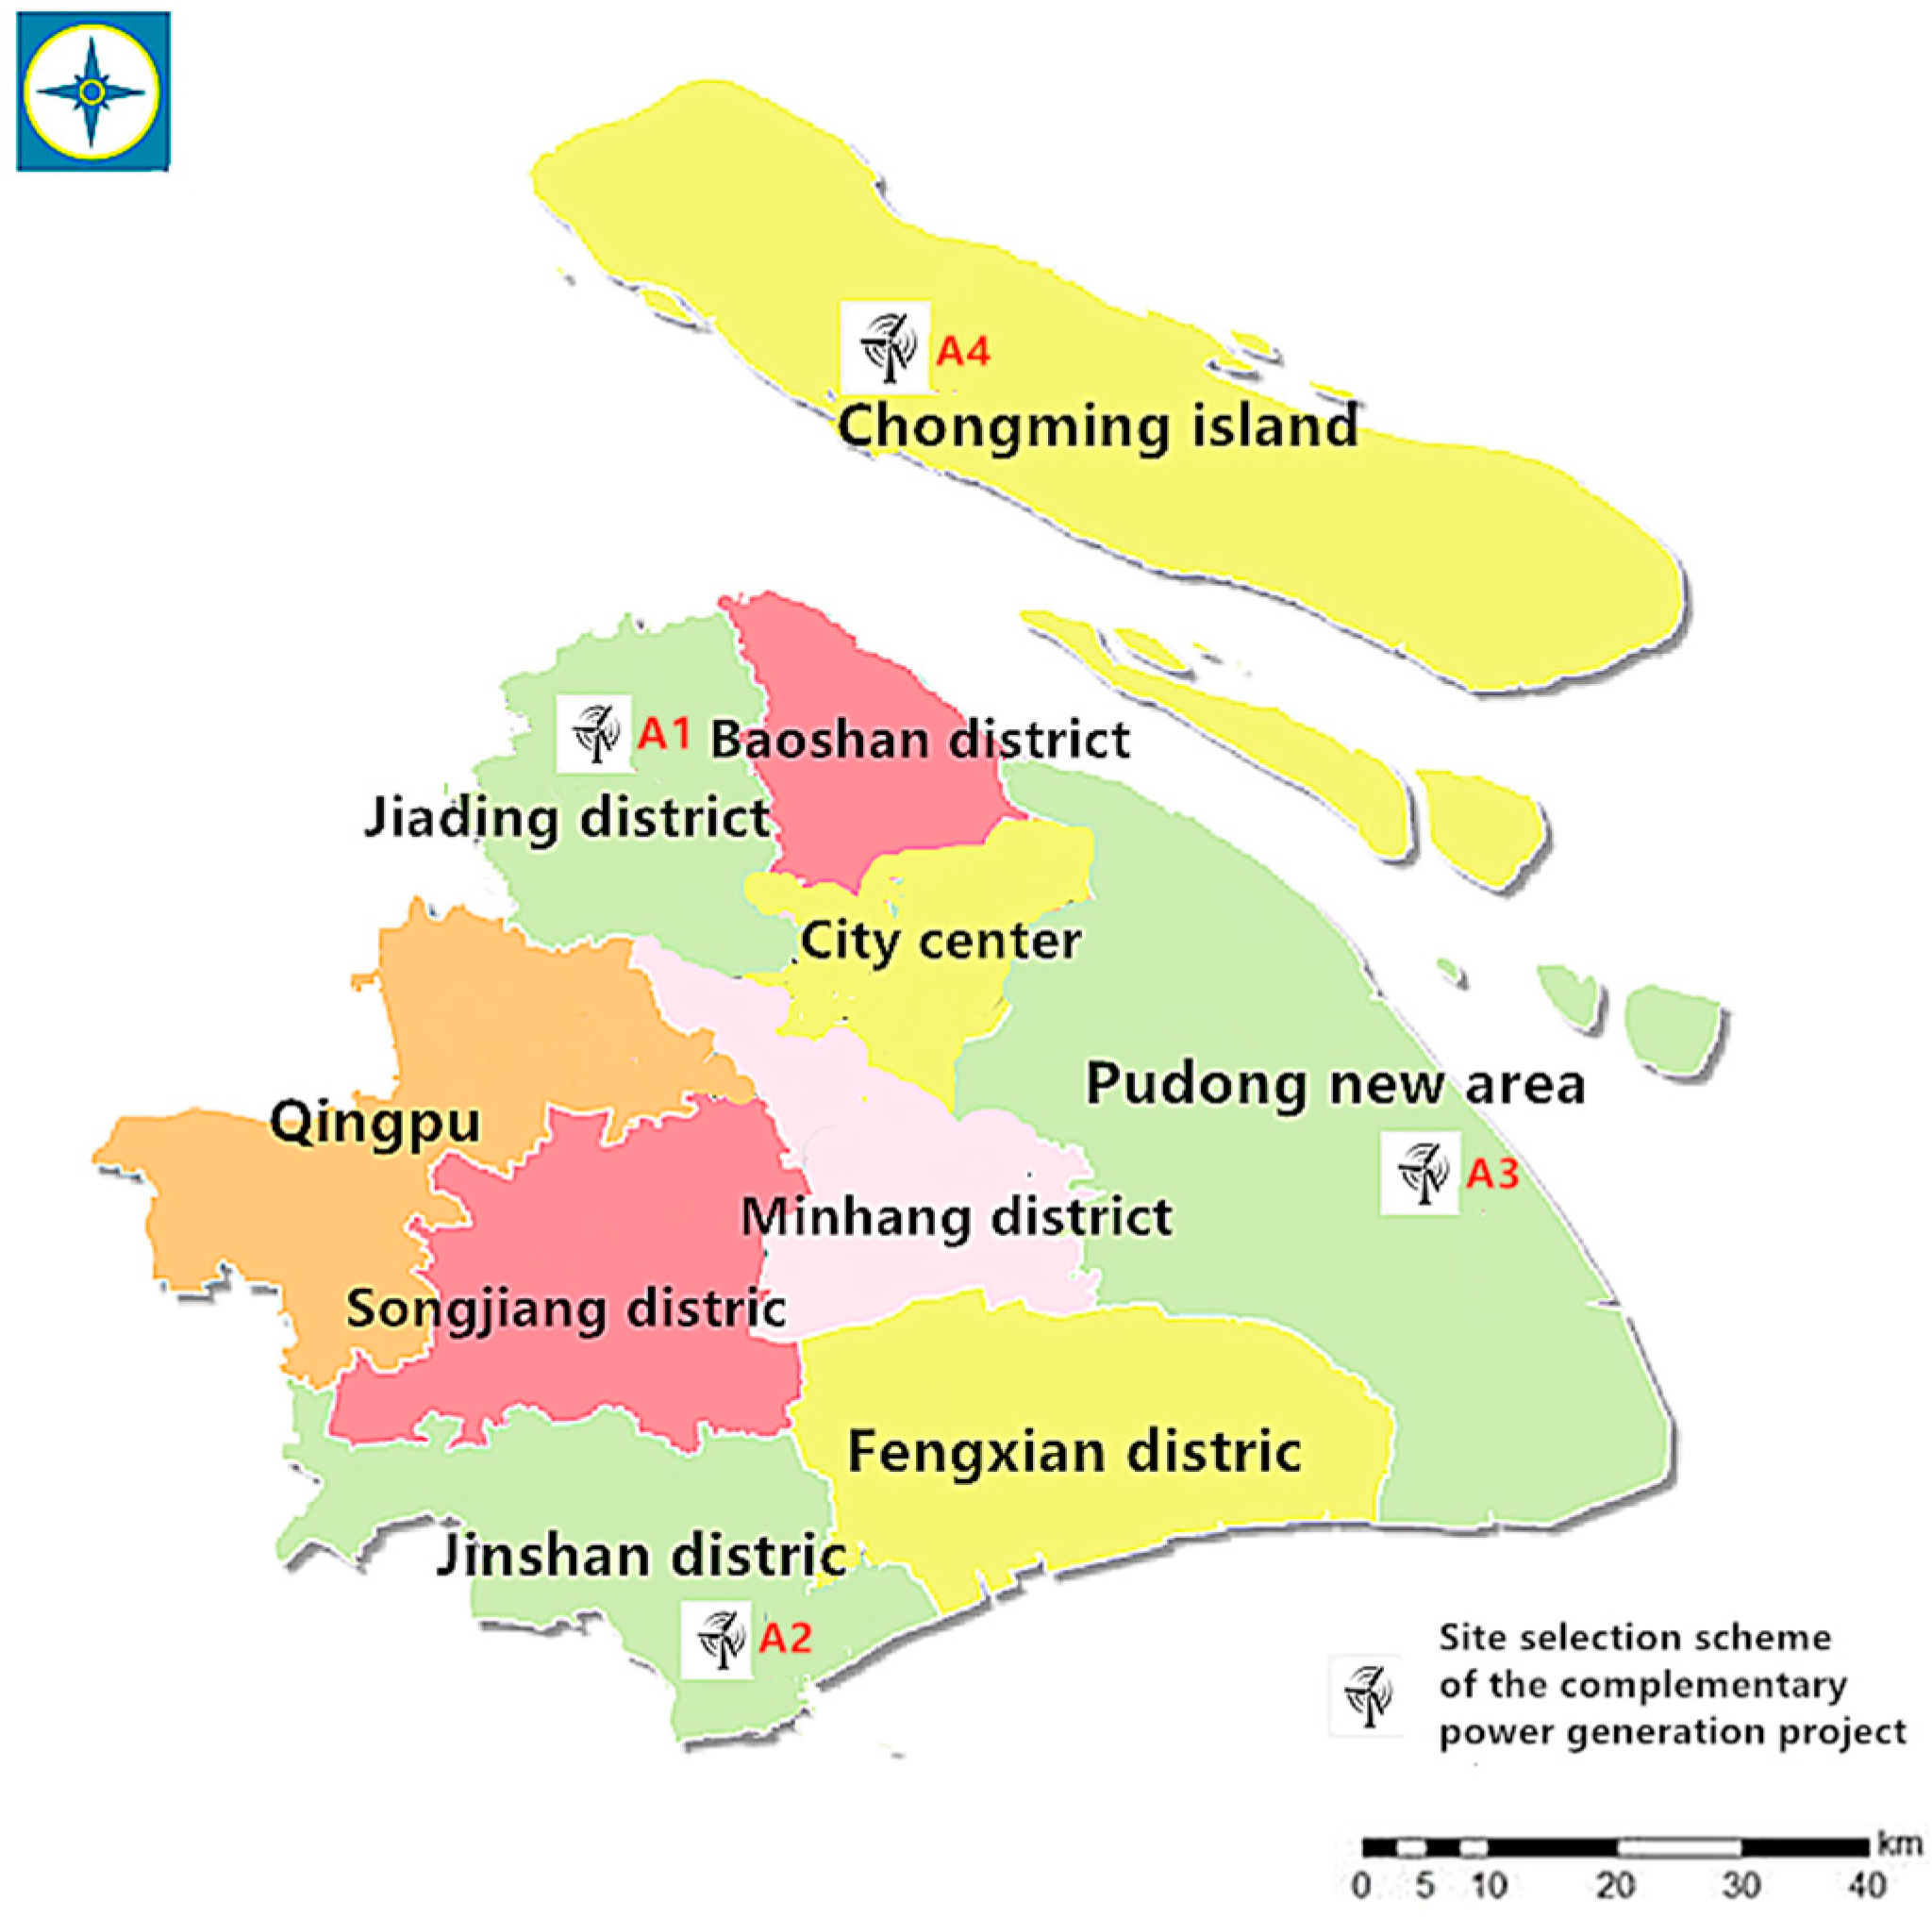
A power company intends to set up a distributed, complementary power generation project in Shanghai and build a large charging station nearby. The electricity generated by the wind power and solar power is mainly supplied to the power station. According to the development of Shanghai planning and the power grid development planning and the principle that the main facilities are jointly built whereas the secondary charging facilities are built separately, the top management of the enterprise selected four alternatives at Jiading district (A1), Jinshan district (A2), Chongming island (A3) and the new area at Pudong (A4) according to the requirements of charging infrastructure and the quantity of existing construction, as shown in Figure 2.
In order to make the decision results professional and rational, the power company’s middle management personnel are responsible for organizing the relevant professional assessment team. The assessment team consists of economic, physical and geographical, social and environmental, power systems and the transport system experts. China has a strict standard for the experts in the relevant areas of the project review expert database. The basic condition is to have the experience of major project practice, they should have been engaged in the relevant professional field for 8 years and have senior title or equivalent level, which can guarantee the professionalism, rationality and effectiveness of decision information. Each field randomly selects three experts from the assessment team, each expert has the same weight.
The main task of expert team has main two aspects. First, through the consultation to determine the evaluation indicators in their respective areas and to determine the mutual affecting relationship of the indicators, based on this, using SD to give weighs for the various indicators; Second, with uncertain language value to evaluate the index nature of each scheme.
4.2.2. Application of Optimized Siting Model for the Wind and Solar Power Generation Project
As shown in Figure 2 the siting influence factors for the wind and solar power generation project for a network of large-scale charging stations are listed. The weights of the indexes are calculated using the special calculation software Super Decision of AHP. The interaction between the indicators is listed in Table 5. Subsequently, every member of the expert group participated in brainstorming on the paired comparison of indicators to determine the relative importance of each target. The relative scale of measure adopted was the Saaty 1–9 scale, as listed in Table 3. In the process of comparing pair indicators, the opinions of each expert should be consulted separately and the opinions should be counted. Then, for the larger part with big argument, the middle managers will organize the special discussion meeting. After comparing pair indicators to generate the unweighted super-matrix of the index. At this time, consistency testing is required.
After the consistency test, the Super Decision software was used to determine the weight of each index, as listed in Table 6.
After fully understanding the conditions of various alternatives, the related parameters of each scheme are given in Table 7; expert review groups evaluate each solution in the form of linguistic value and the language evaluation results are given in Table 8.
According to Table 4, the language values at all the levels are translated into the corresponding cloud language. Therefore, this study uses the CAA operator in Equation (7) to assemble the language assessment value of each member in the expert group and the parameter k is equal to 3. The aggregation results of each alternative plan are presented in Table 9.
The PROMETHEE method usually uses six types of evaluation criteria. This study uses the criterion V as a priority function and sets the parameter value p to 16. According to Equations (8) and (9), the index dominance of every alternative can be obtained. Based on Equations (10) and (11), the priority index of each scheme can be determined as given in Table 10.
From Table 4 to Table 8, based on equations in the steps 8–10, the inflow and outflow of each alternative can be obtained and the net flow of each scheme can be determined. The calculation results are listed in Table 11.
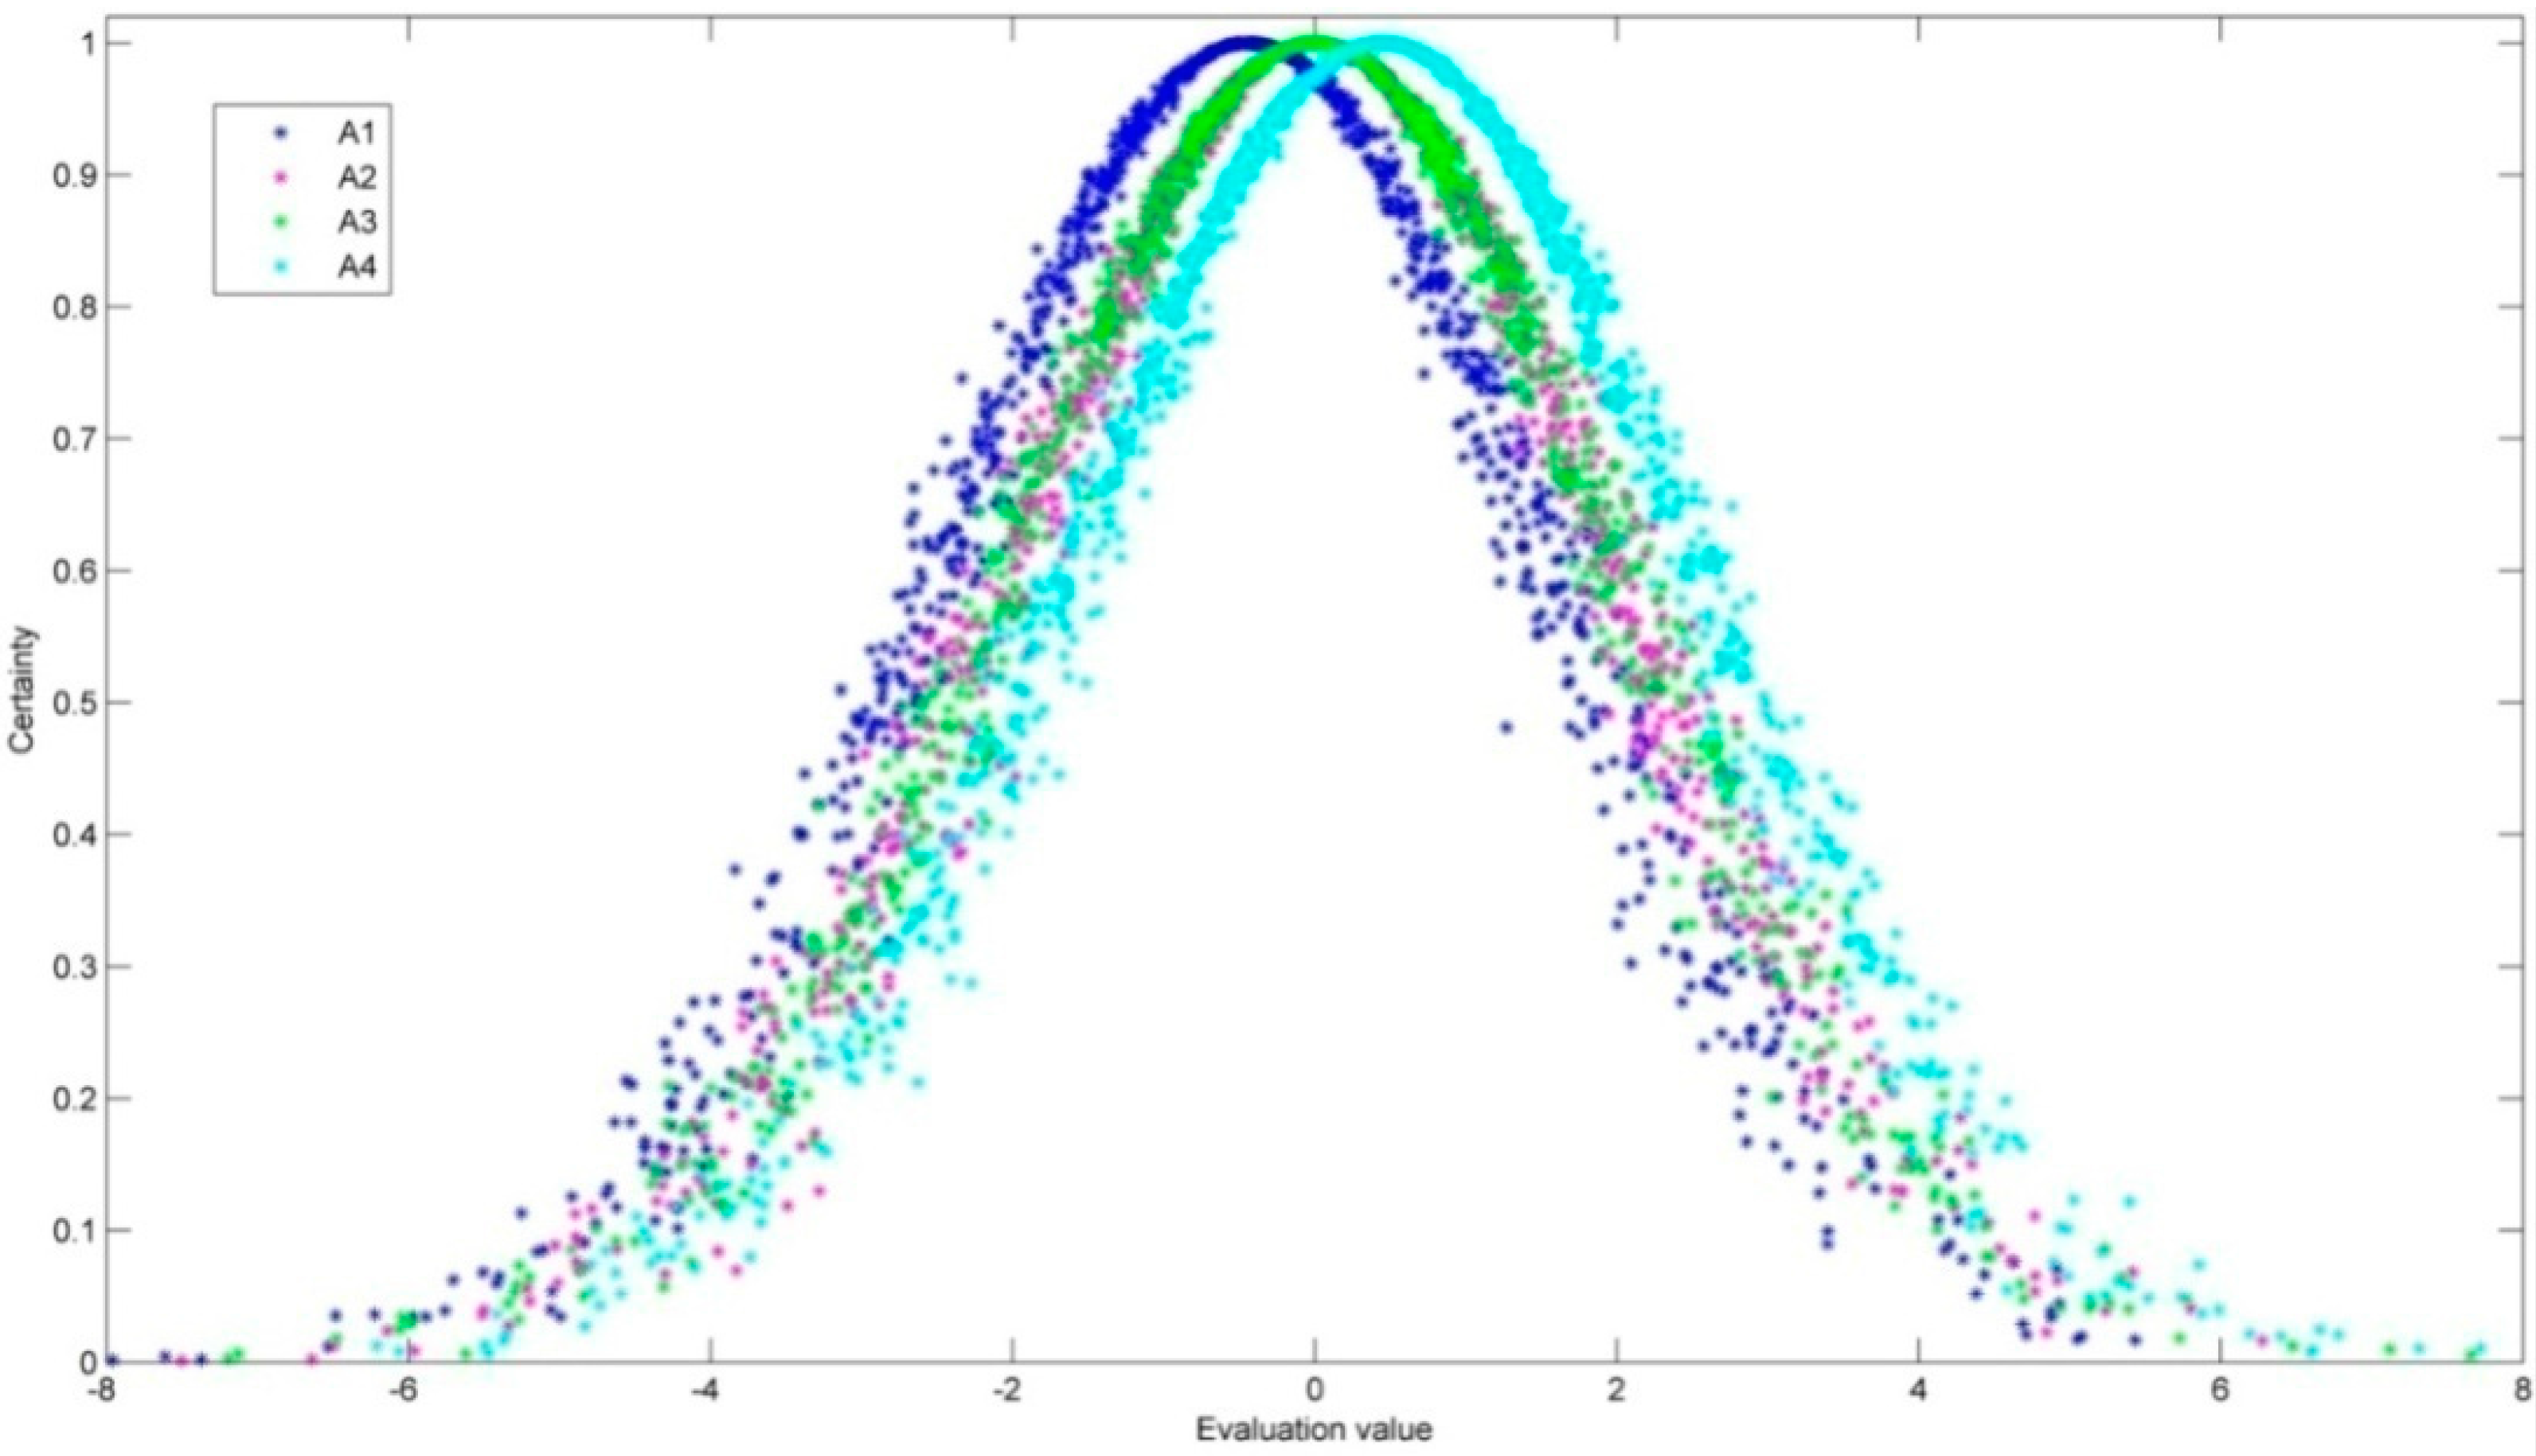
The cloud generated by the net flow of each option is shown in Figure 3.
Finally, the positive membership cloud generator is used to compare the size of the clouds and MATLAB software is used to generate 10, 000 cloud droplets each time. This process is repeated five times and the average value of the cloud is obtained. The results are listed in Table 12. Based on the average, the alternatives are ranked as follows: A4 > A2 > A3 > A1.
4.3. Evaluation Result Analysis
4.3.1. Comparison and Analysis
In order to further verify the accuracy and superiority of the model built in this study, it is necessary to compare the model constructed in this study with the traditional uncertain language environment decision model. In this study, the fuzzy PROMETHEE method is used to compare and analyze the difference between the two decision results. First, the language variables in the above example are transformed into the corresponding triangle fuzzy numbers and the transformation between the linguistic set of 7 scales and the triangular fuzzy number is presented in Table 13.
By using the fuzzy operator to obtain the evaluation information of different decision-makers, the calculation method of the aggregation operator is obtained as follows:
where K represents the number of decision-makers and .
The information about the options available to different decision-makers for assessment is given in Table 14.
Similarly, a V function is used as the priority function and a series of calculations are used to obtain the priority index of each alternative. The results are listed in Table 15. Subsequently, the inflow and outflow of each option can be obtained and the net flow of each scheme can be determined. The calculated results are given in Table 16.
Finally, we use the fuzzy operator in Equation (17) to transform the triangular fuzzy number into an exact numerical value and the result is given in Table 16. According to the fuzzy operator, the sorting of the alternative scheme can be determined as follows: A4 > A3 > A2 > A1.
The results of the PROMETHEE method based on the cloud model and triangular fuzzy numbers are given in Table 17.
From the results given in Table 16, there are two main differences between the schemes of A2 and A3 and the principal causes of these differences are analyzed as follows. First, the triangular fuzzy number for language value conversion will result in sorting based on the sole criterion for the evaluation, which leads to the one-sidedness and roughness of the model. As demonstrated by the calculation results of the above comparison analysis, the average level of program A3 is better than that of A2 and hence, the triangular fuzzy number of A3 is greater than that of A2. In contrast to the triangular fuzzy number, the cloud model not only considers the average level of the scheme, but also considers the volatility and stability of the scheme. Second, the linguistic scale of the triangular fuzzy number is evenly divided, whereas the cloud model adopts a multi-granularity segmentation method, which can reflect the psychological characteristics of the decision-maker more accurately. Third, the cloud model fully considers the ambiguity and randomness of uncertain information, which can solve the problem of information distortion in the assembly process to some extent. Based on the above analysis, the results obtained by the PROMETHEE method based on the cloud model are more reasonable and reliable than the results obtained by the fuzzy PROMETHEE method.
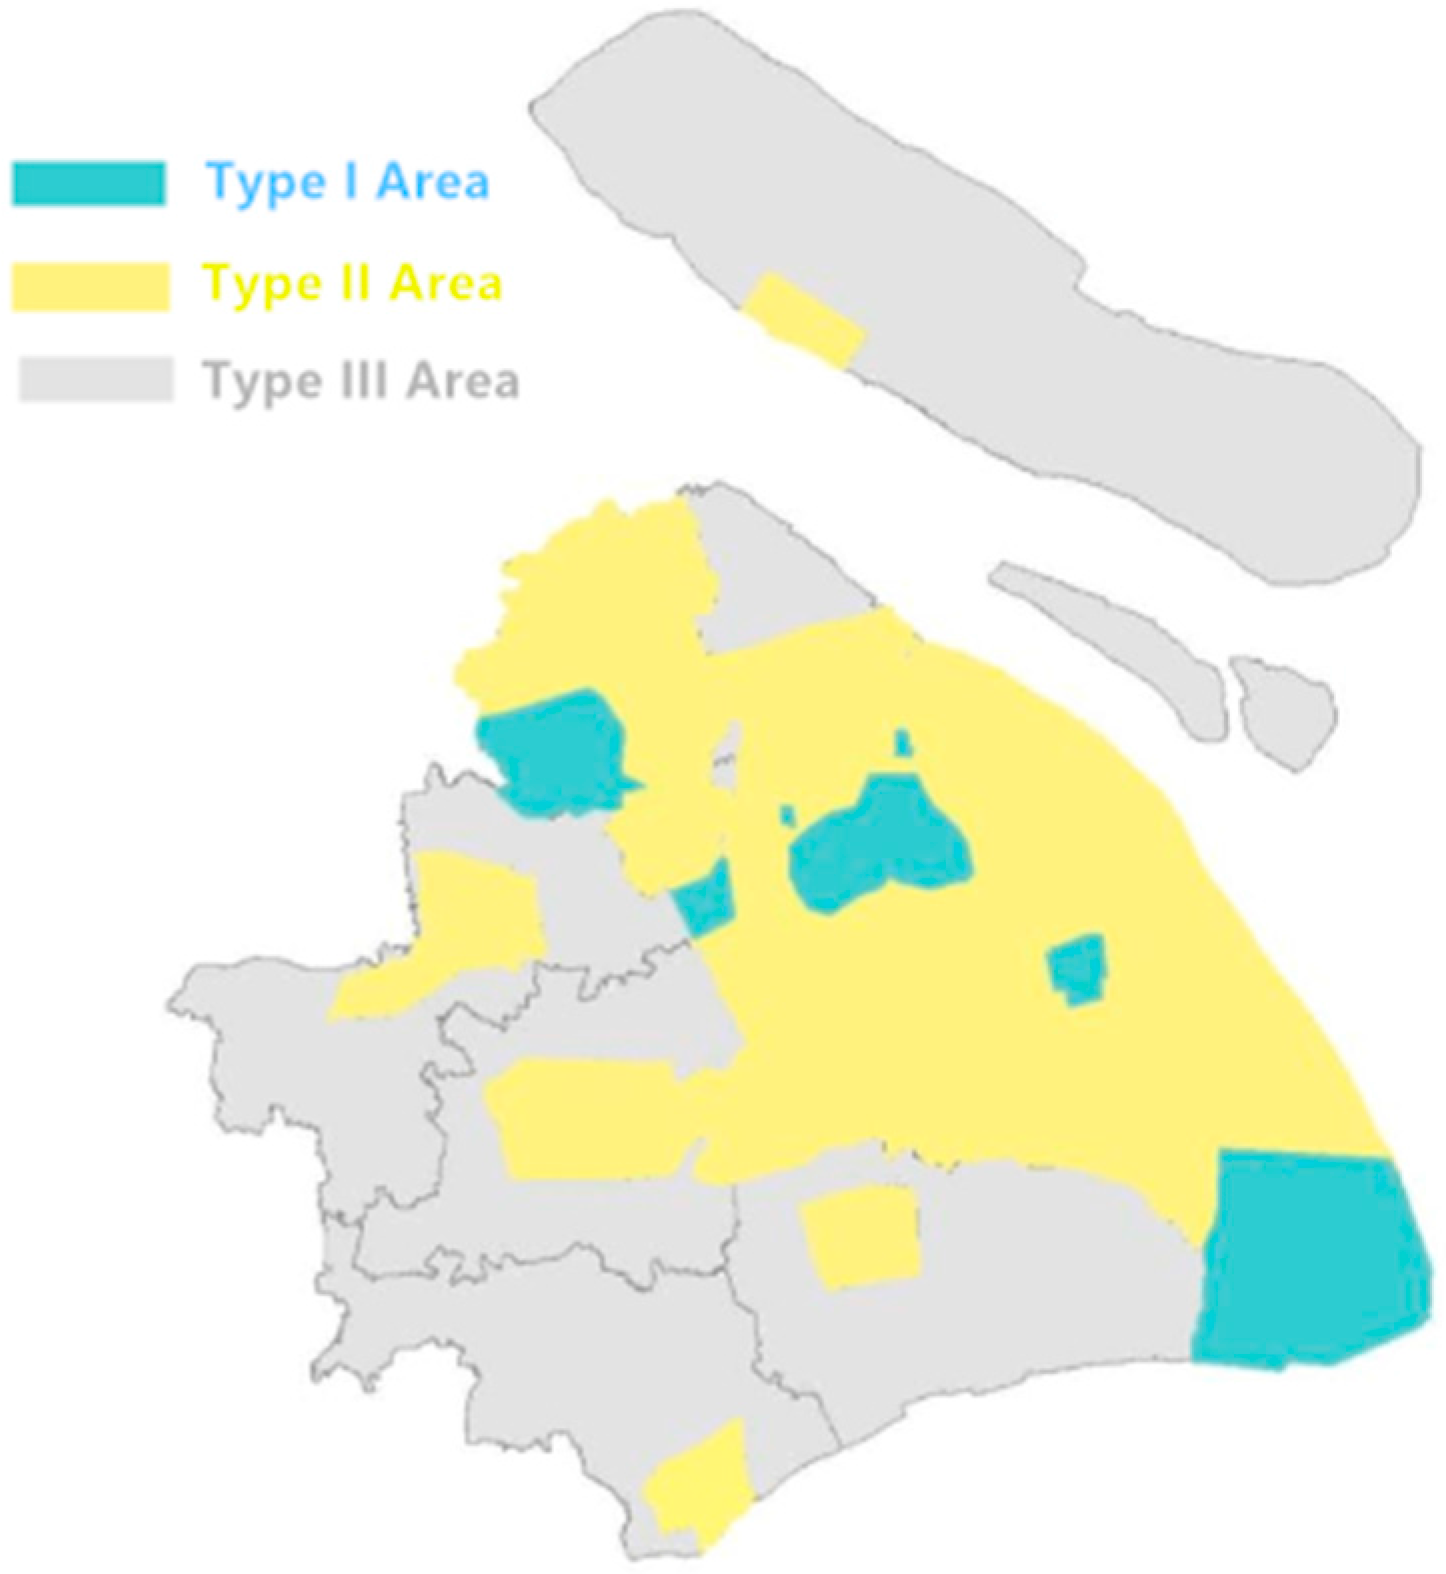
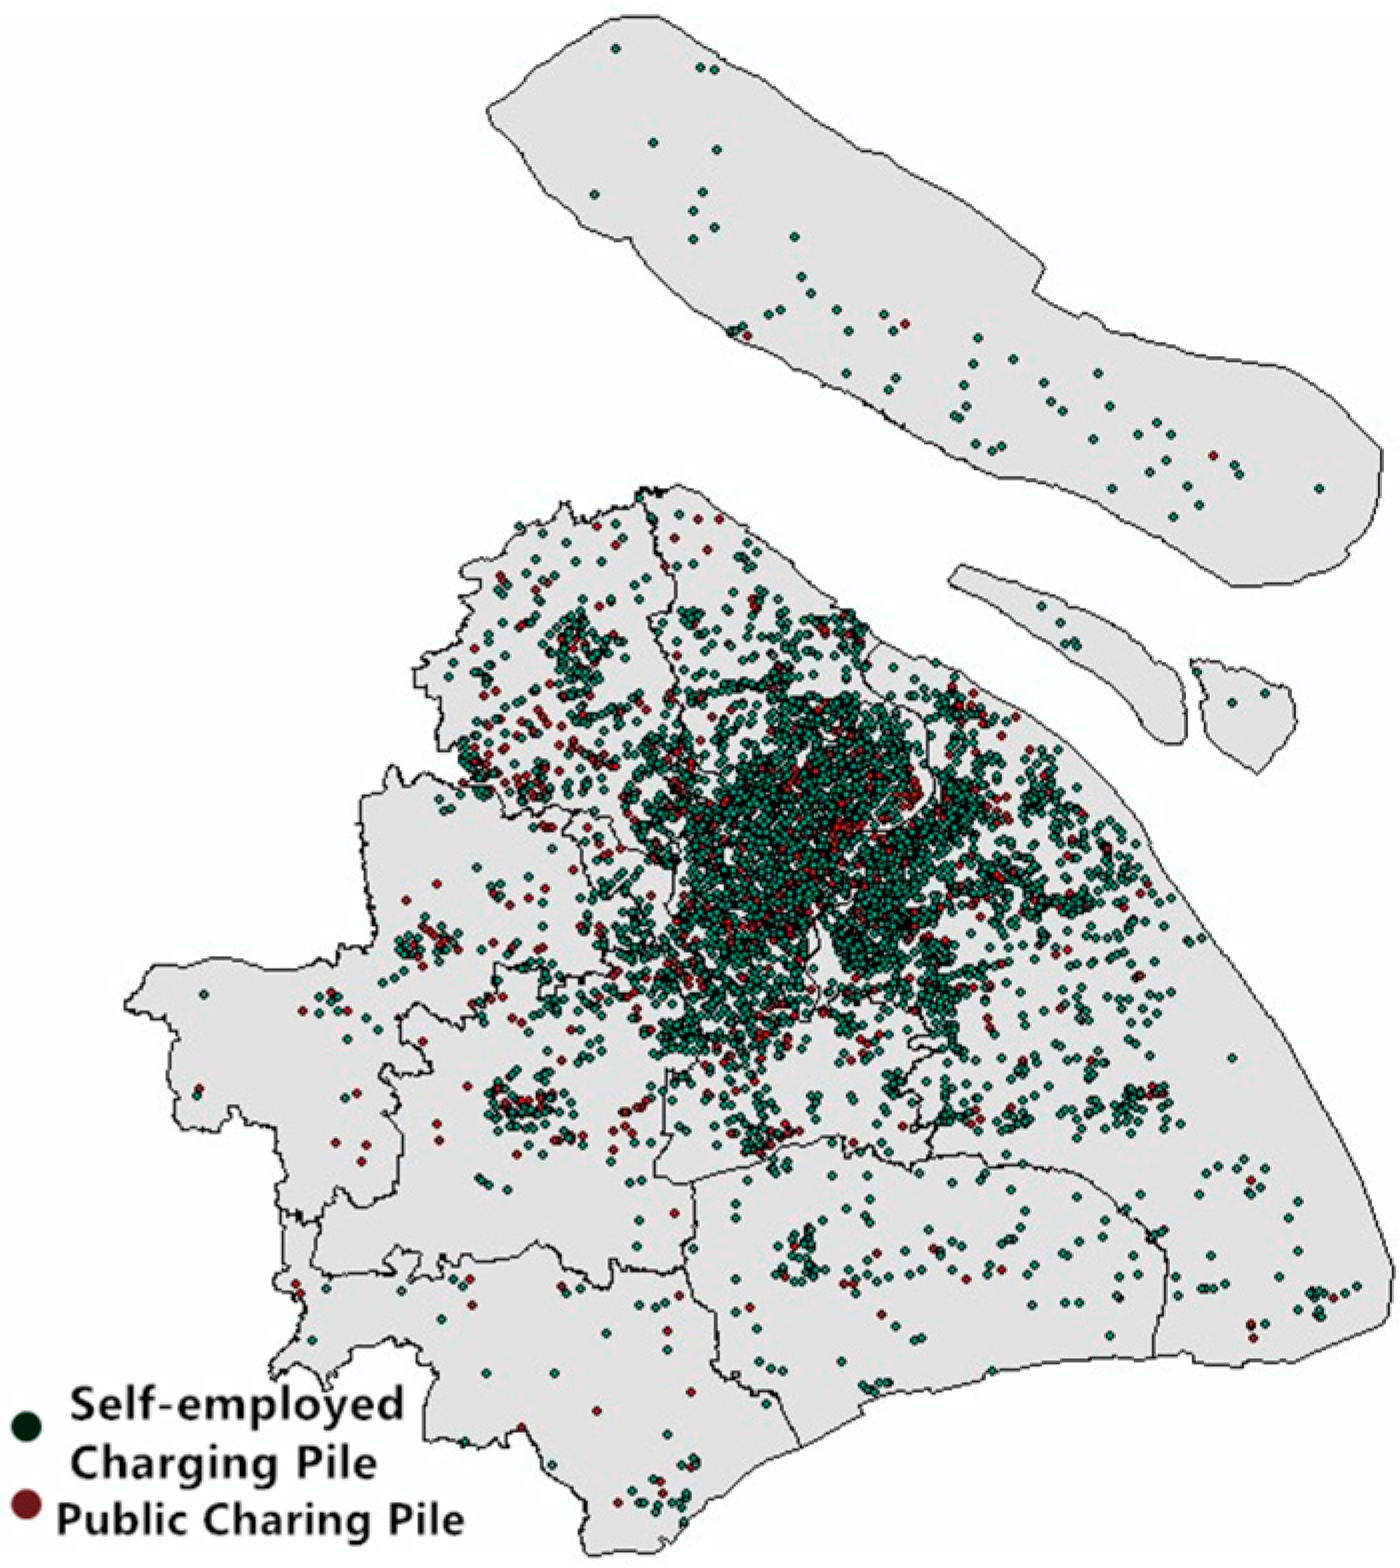
Further, the Yangtze river is on the north of Shanghai, the bay of Hangzhou is on its south and the east China sea is on its east, the coastline of Shanghai is 450 km in length and the land is flat. Under the significant influence of the east Asian monsoon, winter and summer winds undergo apparent transformation, with winter prevailing northwest to the north wind and summer prevailing southeast wind; the dominant wind direction throughout the year is northerly wind and southeast wind, so wind energy is mainly concentrated in the two directions. The coastal area of Shanghai is a region with abundant wind energy resources. The coastal zone is the most volatile area with high wind speed and the average wind speed rapidly decreases from water to the land. As evident from Table 8, A2 and A3 are adjacent to the Yangtze river and Hangzhou bay, respectively, which belong to the coastal zone with abundant wind resources and solar energy resources. According to the concept of saving land, intensive development in Shanghai, based on the principle of mainly joint construction and auxiliary as independent construction, the layout of power station for electric vehicle in Shanghai was designed, which is shown in Figure 4. The charging infrastructure status quo distribution is shown in Figure 5.
It can be observed from Figure 4 and Figure 5 that the distribution of charging piles is more intensive for an area where charging facilities are developed and it is not urgently necessary to build a large-scale charging station. For the second type of development of charging facilities, the construction of large-scale charging stations is the main task for the construction of current charging facilities. The number of electric vehicles in this kind of area is large and sustainable and the demand for charging facilities is strong. However, there are few such existing charging facilities. Therefore, this article conforms to Shanghai development planning and power grid development planning, feasibility and rationality with four selected construction wind-solar complementary projects and a large charging power plant.
Furthermore, the layout of planning of public charging facilities in the districts and counties of Shanghai in 2017 and 2020 is presented in Table 18. As evident from Table 18, A2 is higher than A3, which leads to a shorter investment recovery period. With the acceleration of the construction of the expressway in Shanghai, the “two horizontal and three vertical” expressway network is formed in the A2 plan, which leads to better transportation convenience for A2 than A3. Moreover, the A3 program is adjacent to a national forest park and is close to the national nature reserve for birds, which may have an impact on the migration of birds. Therefore, considering the above factors, the A2 scheme is obviously a better choice than the A3 solution and it also demonstrates the practicality of the model proposed in this paper.
4.3.2. Sensitivity Analysis
The stability of evaluation results is an important factor to verify the superiority of the evaluation method. When the weight of the index increases by 10%, 20%, 30% or reduces by 10%, 20%, 30%, the evaluation result will be modified by the sensitivity analysis. The sensitivity analysis of the results, as shown in Table 19, determined that in any one case , the results is always robust as A4 > A2 > A3 > A1 and also proves that the constructed model for large charging power stations in the net wind-solar hybrid power generation project with optimization of the location decision-making has good stability.
5. Conclusions
While building large charging power stations in the net wind-solar hybrid power generation project at selected locations, conflicting factors should be considered. This study built a large charging power station in the net wind-solar complementary project with the optimization of location decision-making and the results and main conclusion are as follows:
- (1)
- Using the statistical indexes of site selection of traditional wind and solar power generation in the literature, the statistical analysis and selection were carried out and subsequently, the impact of large charging power stations on the site selection of the wind-solar hybrid power generation project was analyzed to set up a site selection index system for this project.
- (2)
- The traditional PROMETHEE method was extended based on the cloud model and uncertain linguistic environment and considering the interaction between the index weights, the AHP method was used to evaluate and improve the feasibility of the wind-solar complementary project and the effectiveness of location decisions.
- (3)
- Based on the analysis of the site selection decision of the landscape complementary power generation project for the network of large-scale charging stations in Shanghai, the feasibility and effectiveness of the decision-making system proposed in this paper were demonstrated. Subsequently, the comparative analysis and sensitivity analysis were carried out, which demonstrated the superiority and stability of the decision-making model proposed in this paper.
Acknowledgments
This work is financially supported by National Natural Science Foundation of China (71673085), Beijing Municipal Social Science Foundation (16YJB027) and 2017 Special Project of Cultivation and Development of Innovation Base (Z171100002217024).
Author Contributions
Wenjun Chen and Jiahai Yuan conceived and designed the study framework; Yanlei Zhu and Meng Yang collected the data and conducted analysis; Wenjun Chen wrote the draft and Jiahai Yuan proofread the paper.
Conflicts of Interest
The authors declare no conflict of interest.
References
- Dong, J.; Feng, T.T.; Yang, Y.S.; Ma, Y. Macro-site selection of wind/solar hybrid power station based on ELECTRE-II. Renew. Sustain. Energy Rev. 2014, 35, 194–204. [Google Scholar]
- Wu, Y.N.; Yang, Y.S.; Feng, T.T.; Kong, L.N.; Liu, W.; Fu, L.J. Macro-site selection of wind/solar hybrid power station based on ideal matter-element model. Int. J. Electr. Power Energy Syst. 2013, 5, 76–84. [Google Scholar]
- Wu, Y.N.; Yang, Y.S.; Feng, T.T.; Gao, M.; Zhang, J.Y. Research on the macro location of the landscape complementary power station. Power Syst. Technol. 2013, 2, 319–326. [Google Scholar]
- Tang, J.; Zeng, S.Q.; Sun, Q.Y.; Huang, X. A decentralized wind power plant selection method based on fuzzy chromatography. Chin. Electr. Power Press 2015, 4, 151–155. [Google Scholar]
- Qin, L.; Su, M.; Li, S.; Zhu, X.; Wang, G. Based on hybrid intelligent algorithm, the multi-objective planning of scenic power supply is considered. Renew. Energy Resour. 2015, 6, 843–850. [Google Scholar]
- Yang, B.; Wang, L.F.; Liao, C.L. Coordinated control of electric vehicle and distributed power supply. Trans. Chin. Electrotech. Soc. 2015, 14, 419–426. [Google Scholar]
- Saber, A.Y.; Venayagamoorthy, G.K. Resource scheduling under uncertainty in a smart grid with renewables and plug-in vehicles. IEEE Syst. J. 2012, 1, 103–109. [Google Scholar] [CrossRef]
- Zhang, Y.D.; Liu, N.; Zhang, J.H.; Li, Y. The capacity optimization of the power station of electric vehicle charging station is optimized. Power Syst. Prot. Control. 2013, 15, 126–134. [Google Scholar]
- Wu, J.K.; Lin, Y.X.; Wu, Z.S.; Liu, X.D. Considering the uncertainty of DG and EV distribution network reactive voltage coordination optimization method. Mod. Electr. Power. 2016, 4, 23–29. [Google Scholar]
- Zhu, Z.; Lia, Q.F.; Liu, D.C.; Jia, J.; Tang, F.; Zong, H.L. Considering the new energy and electric vehicle access to the active distribution network reconstruction strategy. Autom. Electr. Power Syst. 2015, 14, 12. [Google Scholar]
- Hou, J.C.; Hu, Q.F.; Tan, Z.F. A multi-objective optimization model for the coordinated scheduling of wind power electric vehicle with demand response. Electr. Power Autom. Equip. 2016, 7, 22–27. [Google Scholar]
- Chen, G.; Dai, P.; Zhou, H.; Sun, K.; Shen, Y. Plan and refactor power distribution system of electric vehicle and distributed power supply. Power Syst. Technol. 2013, 1, 82–88. [Google Scholar]
- Hu, Z.C.; Song, Y.H. The business model and the optimization scheduling strategy of the electric vehicle and the power network are reduced. Proc. Chin. Soc. Electr. Eng. 2015, 24, 6293–6303. [Google Scholar]
- Peng, X.G.; Liu, J.X.; Liu, Y.; Lin, Z.Q. A multi-objective distributed power optimization configuration with uncertain factors for electric vehicles and renewable energy. Power Syst. Technol. 2015, 8, 2188–2194. [Google Scholar]
- Liu, B.L.; Hu, J.L.; Liu, J.; Qian, X.; Cheng, J. Research on multi-objective planning of distribution network with distributed power supply and electric vehicle charging stations. Power Syst. Technol. 2015, 39, 450–456. [Google Scholar]
- Kabir, G.; Sumi, R.S. Power substation location selection using fuzzy analytic hierarchy process and PROMETHEE: A case study from Bangladesh. Energy 2014, 72, 717–730. [Google Scholar] [CrossRef]
- Kurt, Ü. The fuzzy TOPSIS and generalized Choquet fuzzy integral algorithm for nuclear power plant site selection—A case study from Turkey. J. Nucl. Sci. Technol. 2014, 10, 1241–1255. [Google Scholar] [CrossRef]
- Liu, H.C.; You, J.X.; Fan, X.J.; Chen, Y.Z. Site selection in waste management by the VIKOR method using linguistic assessment. Appl. Soft Comput. 2014, 21, 453–461. [Google Scholar] [CrossRef]
- Devi, K.; Yadav, S.P. A multicriteria intuitionistic fuzzy group decision making for plant location selection with ELECTRE method. Int. J. Adv. Manuf. Technol. 2013, 66, 1219–1229. [Google Scholar] [CrossRef]
- Mokhtarian, M.N.; Sadi-Nezhad, S.; Makui, A. A new flexible and reliable interval valued fuzzy VIKOR method based on uncertainty risk reduction in decision making process: An application for determining a suif location for digging some pits for municipal wet waste landfill. Comput. Ind. Eng. 2014, 78, 213–233. [Google Scholar] [CrossRef]
- Li, Y.; Liu, X.; Chen, Y. Selection of logistics center location using Axiomatic Fuzzy Set and TOPSIS methodology in logistics management. Expert Syst. Appl. 2011, 6, 7901–7908. [Google Scholar] [CrossRef]
- Liu, S.; Chan, F.T.S.; Chung, S.H. A study of distribution center location based on the rough sets and interactive multi-objective fuzzy decision theory. Robot. Comput. Integr. Manuf. 2011, 2, 426–433. [Google Scholar] [CrossRef]
- Li, D.Y.; Liu, C.Y. Uncertain artificial intelligence. J. Softw. 2004, 11, 1583–1594. [Google Scholar]
- Capilla, J.A.J.; Carrión, J.A.; Alameda-Hernandez, E. Optimal site selection for upper reservoirs in pump-back systems, using geographical information systems and multicriteria analysis. Renew. Energy 2016, 86, 429–440. [Google Scholar] [CrossRef]
- Ghoseiri, K.; Lessan, J. Waste disposal site selection using an analytic hierarchal pairwise comparison and ELECTRE approaches under fuzzy environment. J. Intell. Fuzzy Syst. 2014, 2, 693–704. [Google Scholar]
- Suh, J.; Jeffrey, R.S.B. Solar Farm Suitability Using Geographic Information System Fuzzy Sets and Analytic Hierarchy Processes: Case Study of Ulleung Island, Korea. Energies 2016, 9, 648. [Google Scholar] [CrossRef]
- Guo, S.; Zhao, H. Optimal site selection of electric vehicle charging station by using fuzzy TOPSIS based on sustainability perspective. Appl. Energy 2015, 158, 390–402. [Google Scholar] [CrossRef]
- Wu, Y.; Chen, K.; Zeng, B.; Yang, M.; Geng, S. Cloud-based decision framework for waste-to-energy plant site selection—A case study from China. Waste Manag. 2016, 48, 593–603. [Google Scholar] [CrossRef] [PubMed]
- Wu, Y.; Geng, S.; Zhang, H.; Gao, M. Decision framework of solar thermal power plant site selection based on linguistic Choquet operator. Appl. Energy 2014, 136, 303–311. [Google Scholar] [CrossRef]
- Xue, L.; Qian, P. The effectiveness evaluation algorithm and its application are based on fuzzy ANP system. Math. Pract. Theory 2016, 10, 69–77. [Google Scholar]
- Betrie, G.D.; Sadiq, R.; Morin, K.A.; Tesfamariam, S. Selection of remedial alternatives for mine sites: A multicriteria decision analysis approach. J. Environ. Manag. 2013, 119, 36–46. [Google Scholar] [CrossRef] [PubMed]
- Peng, A.H.; Xiao, X.M. Material selection using PROMETHEE combined with analytic network process under hybrid environment. Mater. Des. 2013, 47, 643–652. [Google Scholar] [CrossRef]
- Liao, H.; Xu, Z. Multi-criteria decision making with intuitionistic fuzzy PROMETHEE. J. Intell. Fuzzy Syst. 2014, 4, 1703–1717. [Google Scholar]
- Elevli, B. Logistics freight center locations decision by using Fuzzy-PROMETHEE. Transport 2014, 29, 412–418. [Google Scholar] [CrossRef]
- Chen, T.Y. An interval type-2 fuzzy PROMETHEE method using a likelihood-based outranking comparison approach. Inf. Fusion 2015, 25, 105–120. [Google Scholar] [CrossRef]
- Mousavi, S.M.; Tavakkoli-Moghaddam, R.; Heydar, M.; Ebrahimnejad, S. Multi-criteria decision making for plant location selection: An integrated Delphi–AHP–PROMETHEE methodology. Arab. J. Sci. Eng. 2013, 5, 1255–1268. [Google Scholar] [CrossRef]
- Li, D.; Liu, C.; Gan, W. A new cognitive model: Cloud model. Int. J. Intell. Syst. 2009, 24, 357–375. [Google Scholar] [CrossRef]
- Latinopoulos, D.; Kechagia, K. A GIS-based multi-criteria evaluation for wind farm site selection. A regional scale application in Greece. Renew. Energy 2015, 78, 550–560. [Google Scholar] [CrossRef]
- Atici, K.B.; Simsek, A.B.; Ulucan, A.; Tosun, M.U. A GIS-based Multiple Criteria Decision Analysis approach for wind power plant site selection. Util. Policy 2015, 37, 86–96. [Google Scholar] [CrossRef]
- Gorsevski, P.V.; Cathcart, S.C.; Mirzaei, G.; Jamali, M.M.; Ye, X.; Gomezdelcampo, E. A group-based spatial decision support system for wind farm site selection in Northwest Ohio. Energy Policy 2013, 55, 374–385. [Google Scholar] [CrossRef]
- Fetanat, A.; Khorasaninejad, E. A novel hybrid MCDM approach for offshore wind farm site selection: A case study of Iran. Ocean Coast. Manag. 2015, 109, 17–28. [Google Scholar] [CrossRef]
- Sánchez-Lozano, J.M.; García-Cascale, M.S.; Lamata, M.T. GIS-based onshore wind farm site selection using Fuzzy Multi-Criteria Decision Making methods. Evaluating the case of Southeastern Spain. Appl. Energy 2016, 171, 86–102. [Google Scholar]
- Azizi, A.; Malekmohammadi, B.; Jafari, H.R.; Nasiri, H.; Parsa, V.A. Land suitability assessment for wind power plant site selection using ANP-DEMATEL in a GIS environment: Case study of Ardabil province, Iran. Environ. Monit. Assess. 2014, 10, 6695–6709. [Google Scholar] [CrossRef] [PubMed]
- Wu, Y.; Zhang, J.; Yuan, J.; Geng, S.; Zhang, H. Study of decision framework of offshore wind power station site selection based on ELECTRE-III under intuitionistic fuzzy environment: A case of China. Energy Convers. Manag. 2016, 113, 66–81. [Google Scholar] [CrossRef]
- Gamboa, G.; Munda, G. The problem of windfarm location: A social multi-criteria evaluation framework. Energy Policy 2007, 3, 1564–1583. [Google Scholar] [CrossRef]
- Cebi, S.; Kahraman, C. Using Multi Attribute Choquet Integral in Site Selection of Wind Energy Plants: The Case of Turkey. J. Mult. Valued Log. Soft Comput. 2013, 20, 423–443. [Google Scholar]
- Wang, M.Z.; Liu, Z. Wind farms affect birds. J. Northwest Norm. Univ. Nat. Sci. Bimon. 2011, 3, 87–91. [Google Scholar]
- Lu, Z.N.; Wang, J. Based on the GIS—PPE model, the development of China’s wind energy resources development site evaluation. East Chin. Econ. Manag. 2012, 12, 141–144. [Google Scholar]
- Deng, Y.C.; Yu, Z. The evaluation method of the macro location resource of wind farm based on the reference wind power unit. Acta Energiae Solaris Sin. 2010, 11, 1516–1520. [Google Scholar]
- Wang, Z.L.; Ma, P. Optimal location decision of wind farm based on fuzzy analytic hierarchy process. Renew. Energy Res. 2013, 3, 239–242. [Google Scholar]
- Ma, P.; You, X.P. The application of fuzzy multi-objective decision making method in the location of wind farm. Renew. Energy Res. 2013, 11, 20–25. [Google Scholar]
- Chen, C.R.; Huang, C.C.; Tsuei, H.J. A hybrid MCDM model for improving GIS-based solar farms site selection. Int. J. Photoenergy 2014, 1, 925370–925378. [Google Scholar] [CrossRef]
- Carrión, J.A.; Estrella, A.E.; Dols, F.A.; Toro, M.Z.; Rodríguez, M.; Ridao, A.R. Environmental decision-support systems for evaluating the carrying capacity of land areas: Optimal site selection for grid-connected photovoltaic power plants. Renew. Sustain. Energy Rev. 2008, 9, 2358–2380. [Google Scholar] [CrossRef]
- Sánchez-Lozano, J.M.; Antunes, C.H.; García-Cascales, M.S.; Dias, L.C. GIS-based photovoltaic solar farms site selection using ELECTRE-TRI: Evaluating the case for Torre Pacheco, Murcia, Southeast of Spain. Renew. Energy 2014, 6, 478–494. [Google Scholar] [CrossRef]
- Xiao, J.H.; Yao, Z.; Qu, J.; Sun, J. Research on an optimal site selection model for desert photovoltaic power plants based on analytic hierarchy process and geographic information system. J. Renew. Sustain. Energy 2013, 2, 023132–023146. [Google Scholar] [CrossRef]
- Xiao, J.H.; Yao, Z.Y.; Sun, J.H. Research and evaluation of site selection for solar photovoltaic power station. J. Desert Res. 2011, 6, 1598–1605. [Google Scholar]
- Wang, J.; Peng, L.; Zhang, H. Method of multi-criteria group decision-making based on cloud aggregation operators with linguistic information. Inf. Sci. 2014, 274, 177–191. [Google Scholar] [CrossRef]
- Shanghai Development and Reform Commission. Shanghai Electric Vehicle Charging Infrastructure Special Planning. Available online: http://auto.sina.com.cn/news/hy/2016-04-08/detail-ifxrcizs7044762.shtml (accessed on 8 April 2016).
Figure 1.
Decision-making framework for the siting of a wind-solar complementary power generation project connected with a Large-scale Plug-in Charging Station.
Figure 1.
Decision-making framework for the siting of a wind-solar complementary power generation project connected with a Large-scale Plug-in Charging Station.
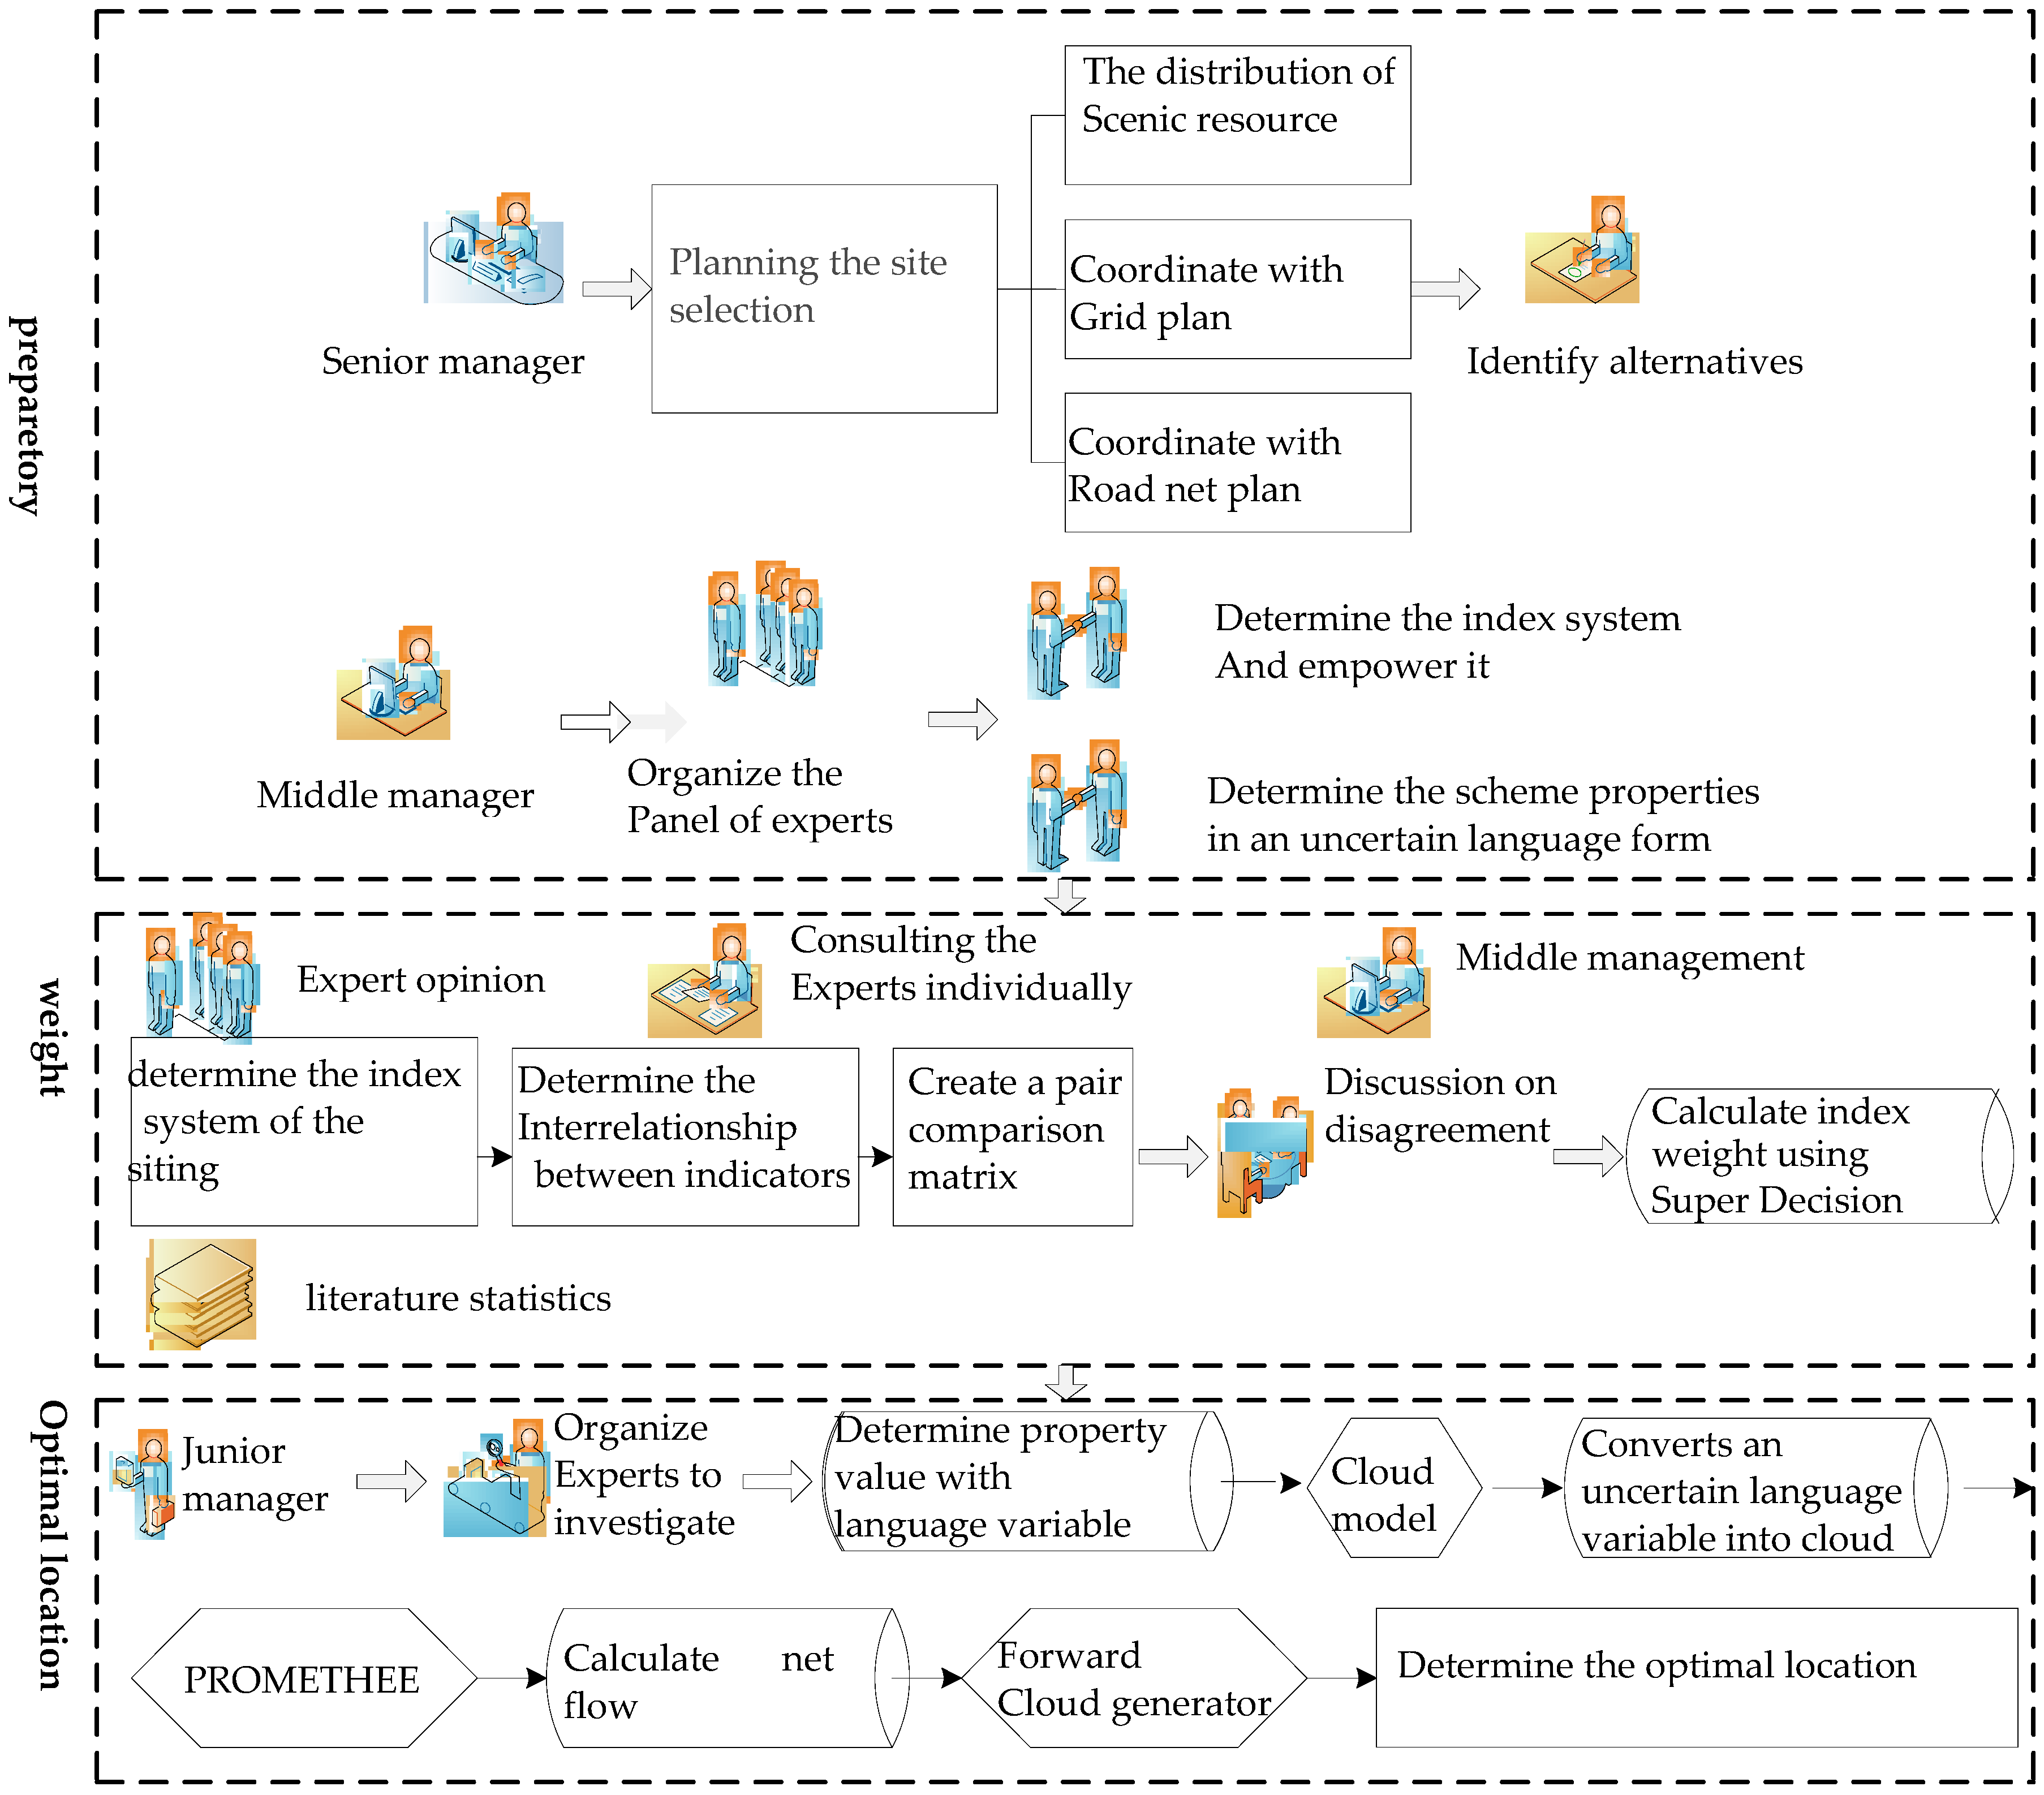
Figure 2.
Alternative plans for the complementary power generation project. Source: authors’ illustration based on Shanghai map.
Figure 2.
Alternative plans for the complementary power generation project. Source: authors’ illustration based on Shanghai map.

Figure 3.
Net flow of each alternative.

Figure 4.
Development area of charging facilities in Shanghai [58].
Figure 4.
Development area of charging facilities in Shanghai [58].

Figure 5.
Distribution schematic of current distribution of charging facilities in Shanghai [58].
Figure 5.
Distribution schematic of current distribution of charging facilities in Shanghai [58].


Table 1.
Frequency statistics of the indicators in existing literature.
| Primary Index | Secondary Index | Frequency |
|---|---|---|
| Natural resources | Annual average wind speed | 11 |
| Wind power density | 9 | |
| Total solar radiation | 8 | |
| Wind resources | 7 | |
| Available wind energy time | 5 | |
| Turbulence intensity | 5 | |
| Average temperature | 4 | |
| Extreme climate | 3 | |
| Illumination time | 3 | |
| Scattering | 2 | |
| Equivalent solar time | 2 | |
| Sunshine stability | 1 | |
| Economic factors | Construction cost | 16 |
| Operational and maintenance cost | 10 | |
| Payback period of investment | 6 | |
| Net profit rate | 2 | |
| Economic externalities | 2 | |
| Commercial feasibility | 1 | |
| Technical requirements | Distance to the transmission line | 15 |
| Power source | 6 | |
| Distance to the load center | 4 | |
| Distance to the transformer substation | 4 | |
| Capacity coefficient | 3 | |
| Network loss | 1 | |
| Traffic factors | Transportation convenience | 20 |
| Geographical factors | Geological and topographical conditions | 12 |
| Slope | 8 | |
| Regional stability | 6 | |
| Altitude | 3 | |
| Orientation | 2 | |
| Land scale | 1 | |
| Social factors | Regional economic developmental level | 12 |
| Public acceptance | 7 | |
| Distance to the city/urban area | 7 | |
| Government policy | 5 | |
| Distance to the tourist area | 2 | |
| Population density | 1 | |
| Environmental factors | Impact on the ecological environment | 15 |
| Pollutant emission reduction benefits | 7 | |
| Energy conservation benefits | 6 | |
| Current land use | 5 | |
| Noise pollution | 4 | |
| Electromagnetic radiation effects | 1 |
Table 2.
Site indexes for large network of power stations in wind power generation project.
| Economic indicators C1 | Project construction cost C11 | Construction costs include land requisition fees, demolition charges, other investment expenses such as the purchase , installation of equipment and line |
| Project operation and maintenance cost C12 | Mainly including wind-light complementary project unit, filling in the plant equipment and power network maintenance and when scenery complementary project of power can meet the load demand fill in power station, every year need spending to the superior power grid electricity purchasing cost | |
| Payback period C13 | The amount of time that the net income of the complementary power generation project offsets the total investment | |
| Natural factors C2 | Wind energy resources C21 | The annual mean wind speed, wind power density and wind power can be measured by the annual mean of the observation point |
| Solar resources C22 | Mainly through the total radiation of the sun, the proportion of the scattering in total radiation and the equivalent of the sun | |
| Battery operating temperature C23 | Through environmental temperature, daylight illumination and wind speed and other factors | |
| Geographical factors C3 | Geological and topographical conditions C31 | The height of the underground water table is evaluated mainly through the thickness of strata or soil, whether the soil is uniform and bearing capacity |
| Terrain and topography C32 | By slope size, whether there are occlusion objects to evaluate | |
| Regional stability C33 | Whether there is a fault or earthquake in the area | |
| Reliability factor C4 | Network loss in the distribution network C41 | The line distance between the landscape complementary power generation project and the charging station is evaluated |
| Voltage stability C42 | The voltage stability of the power generation project and the anti-jamming capability of the voltage | |
| Installed capacity of power generation projects C43 | The installed capacity of the complementary power generation project | |
| Traffic satisfaction factors C5 | Traffic convenience C51 | Mainly through main road condition, road condition, lane number, intersection number and other factors |
| Charge for power plant services C52 | The maximum number of electric vehicles that can be serviced by electric vehicles at the same time and daily | |
| Charge for power station service RADIUS C53 | The distance between two adjacent charging stations | |
| Social factors C6 | Supporting policy C61 | Subsidies, electricity prices, land concessions and tax incentives |
| Residents’ acceptance C62 | Survey the residents’ recognition of the complementary power generation project and the charging station | |
| Influence on the regional development C63 | The development of the project to the regional economy, the function and the size of the employment problem | |
| Environmental factors C7 | Ecological and Environmental impact C71 | It mainly refers to the influence and size of birds, soil and vegetation, etc. |
| Energy-saving benefits C72 | Energy savings compared to coal-fired and internal-combustion vehicles | |
| Pollutant emission reduction effect C73 | Compared with conventional power generation technology and internal combustion electric vehicles, the reduction of pollutants such as SO2, CO2, NOX, CO and TSP is compared |
Table 3.
Saaty comparison scale.
| Importance Degree | Definition | Explanation |
|---|---|---|
| 1 | Equally important | Both indicators make the same contribution to the target. |
| 3 | Slightly important | Experience and judgment tend to be slightly more important. |
| 5 | Important | Experience and judgment tend to be more important. |
| 7 | Very important | Experience and judgment tend to be more important and the degree of importance is very evident in practice. |
| 9 | Extremely important | Experience and judgment tend to be more important and the degree of importance is extremely evident in practice. |
| 2, 4, 6, 8 | Middle values | Between other degrees of importance |
Table 4.
Conversion between the language value and the cloud.
| Language Value | Cloud |
|---|---|
| Very Poor (VP) | (0.00, 2.959, 0.125) |
| Poor (P) | (2.25, 2.655, 0.226) |
| Moderately Poor (MP) | (3.85, 2.100, 0.411) |
| Moderate (M) | (5.00, 1.922, 0.471) |
| Moderately Good (MG) | (6.15, 2.100, 0.411) |
| Good (G) | (7.75, 2.655, 0.226) |
| Very Good (VG) | (10.00, 2.959, 0.125) |
Table 5.
Interaction between indicators.
| Factor | Affected Factor |
|---|---|
| C11 | C12, C13, C31, C32, C33, C43, C51, C52, C61, C62, C71 |
| C12 | C11, C13, C31, C41, C42, C51, C52, C53, C61, C62, C63, C71, C73 |
| C13 | C31, C32, C41, C42, C43, C51, C52, C53, C61, C63, C72, C73 |
| C21 | C12, C13, C23, C32, C41, C42, C43, C61, C72, C73 |
| C22 | C12, C13, C32, C41, C42, C43, C61, C72, C73 |
| C23 | C12, C13, C22, C31, C32, C41, C42, C43, |
| C31 | C11, C13, C33, C43, C61 |
| C32 | C12, C13, C21, C22, C23, C31, C43, C61, C72, C73 |
| C33 | C11, C12, C13, C31, C42, |
| C41 | C12, C13, C43, C52, C63, C72, C73 |
| C42 | C12, C13, C21, C22, C23, C31, C33, C43, C52, C63 |
| C43 | C11, C12, C13, C21, C22, C23, C31, C32, C41, C42, C51, C52C53, C61, C62, C63, C71, C72, C73 |
| C51 | C11, C12, C13, C31, C32, C33, C43, C52, C53, C62, C72, C73 |
| C52 | C11, C12, C13, C21, C22, C23, C33, C41, C42, C43C51, C53, C62, C63, C71, C72, C73 |
| C53 | C12, C13, C43, C51, C52, C63 |
| C61 | C11, C12, C13, C43, C51, C63, C71 |
| C62 | C12, C13, C33, C43, C52, C53, C61, C62, C63, C71 |
| C63 | C12, C13, C52, C61, C62, C71, C72, C73 |
| C71 | C11, C13, C21, C22, C23, C31, C43, C61, C62 |
| C72 | C11, C12, C13, C21, C22, C23, C31, C32, C33, C41, C42, C43, C51, C52, C53, C61, C62, C63, C73 |
| C73 | C12, C13, C21, C22, C23, C32, C33, C41, C42, C43, C52, C61, C62, C63, C72 |
Table 6.
Weight of indicators determined using the Analytic Hierarchy Process (AHP) method.
| Index | Weight | Index | Weight |
|---|---|---|---|
| C11 Construction cost | 0.011037 | C43 Installed capacity | 0.095162 |
| C12 Operating maintenance cost | 0.013562 | C51 Traffic convenience | 0.033413 |
| C13 Investment payback period | 0.054911 | C52 Service capability | 0.049730 |
| C21 Wind resource conditions | 0.081353 | C53 Radius of service | 0.009904 |
| C22 Solar resource conditions | 0.058523 | C61 Government policy | 0.02470 |
| C23 Battery operating temperature | 0.040059 | C62 Residents around identification degree | 0.017064 |
| C31 Geological and topographical conditions | 0.034506 | C63 Impact on regional development | 0.012621 |
| C32 Topography and slope | 0.043445 | C71 Ecological and environmental impact | 0.059396 |
| C33 Regional stability | 0.020278 | C72 Energy-saving benefit | 0.147163 |
| C41 Network loss | 0.028950 | C73 Pollutant emission reduction benefit | 0.091685 |
| C42 Voltage stability | 0.072538 |
Table 7.
Related parameters of each alternative.
| District | C11/Ten Thousand Yuan | C12/Ten Thousand Yuan | C13/Year | C41/Ten Thousand Yuan | C52/(Car/Day) | C53/km |
|---|---|---|---|---|---|---|
| A1 | 2880 | 240 | 5 | 6.99 | 360 | 8 |
| A2 | 2070 | 220 | 4 | 6.29 | 330 | 13 |
| A3 | 2010 | 235 | 4.5 | 6.09 | 400 | 10 |
| A4 | 1920 | 210 | 3 | 5.98 | 310 | 15 |
Data source: [58].
Table 8.
Language evaluation value of each alternative.
| A1 | A2 | A3 | A4 | |||||||||
|---|---|---|---|---|---|---|---|---|---|---|---|---|
| DM1 | DM2 | DM3 | DM1 | DM2 | DM3 | DM1 | DM2 | DM3 | DM1 | DM2 | DM3 | |
| C11 | P | MP | P | M | M | MP | M | MG | M | G | MG | MG |
| C12 | M | MG | MG | G | G | MG | MG | G | MG | VG | G | G |
| C13 | MG | G | MG | G | VG | G | G | G | MG | VG | G | VG |
| C21 | M | M | MP | MG | MG | G | M | MG | M | G | G | VG |
| C22 | MG | G | MG | MG | G | G | G | VG | G | G | VG | VG |
| C23 | MP | P | MP | MP | M | M | M | MG | M | G | MG | G |
| C31 | M | MP | MP | M | MG | M | M | M | MP | MG | MG | M |
| C32 | MG | M | M | G | MG | MG | MG | G | G | VG | G | G |
| C33 | MG | G | MG | VG | G | G | G | MG | G | VG | VG | G |
| C41 | MG | G | MG | MG | G | G | G | VG | G | G | VG | VG |
| C42 | P | P | VP | P | MP | MP | MP | M | MP | M | MG | MG |
| C43 | MP | M | M | M | M | MG | MP | M | MP | MG | G | G |
| C51 | P | P | VP | P | G | G | G | P | P | VG | G | G |
| C52 | M | M | MP | MG | MG | G | M | MG | M | G | G | VG |
| C53 | MG | M | M | MG | G | G | MG | M | MG | G | G | VG |
| C61 | VP | MP | MP | MG | MP | MG | MP | MG | MP | MG | VG | MG |
| C62 | MP | M | MP | M | M | MP | M | MG | M | M | MG | MG |
| C63 | M | M | MG | MG | MG | G | G | G | MG | VG | G | VG |
| C71 | P | MP | MP | M | M | MP | MG | M | M | MG | G | MG |
| C72 | MP | P | P | G | MG | MG | G | MG | G | G | VG | G |
| C73 | M | M | MG | MG | M | MG | MG | G | MG | MG | G | G |
DM1—Decision Maker1, DM2—Decision Maker2, DM3—Decision Maker3.
Table 9.
Aggregation result of each indicator in the alternative plan.
| A1 | A2 | A3 | A4 | |
|---|---|---|---|---|
| C11 | (2.7833, 2.4838, 0.3006) | (4.6167, 1.9831, 0.4519) | (5.3833, 1.9831, 0.4519) | (6.6833, 2.2999, 0.3601) |
| C12 | (5.7667, 2.0424, 0.4319) | (7.2167, 2.4838, 0.3006) | (6.6833, 2.2999, 0.3601) | (8.5000, 2.7601, 0.1981) |
| C13 | (6.6833, 2.2999, 0.3601) | (8.5000, 2.7601, 0.1981) | (7.2167, 2.4838, 0.3006) | (9.2500, 2.8613, 0.1657) |
| C21 | (4.6167, 1.9831, 0.4519) | (6.6833, 2.2999, 0.3601) | (5.3833, 1.9831, 0.4519) | (8.5000, 2.7601, 0.1981) |
| C22 | (6.6833, 2.2999, 0.3601) | (7.2167, 2.4838, 0.3006) | (8.5000, 2.7601, 0.1981) | (9.2500, 2.8613, 0.1657) |
| C23 | (3.3167, 2.2999, 0.3601) | (4.6167, 1.9831, 0.4519) | (5.3833, 1.9831, 0.4519) | (7.2167, 2.4838, 0.3006) |
| C31 | (4.2333, 2.0424, 0.4319) | (5.3833, 1.9831, 0.4519) | (4.6167, 1.9831, 0.4519) | (5.7667, 2.0424, 0.4319) |
| C32 | (5.3833, 1.9831, 0.4519) | (6.6833, 2.2999, 0.3601) | (7.2167, 2.4838, 0.3006) | (8.5000, 2.7601, 0.1981) |
| C33 | (6.6833, 2.2999, 0.3601) | (8.5000, 2.7601, 0.1981) | (7.2167, 2.4838, 0.3006) | (9.2500, 2.8613, 0.1657) |
| C41 | (6.6833, 2.2999, 0.3601) | (7.2167, 2.4838, 0.3006) | (8.5000, 2.7601, 0.1981) | (9.2500, 2.8613, 0.1657) |
| C42 | (1.5000, 2.7601, 0.1981) | (3.3167, 2.2999, 0.3601) | (4.2333, 2.0424, 0.4319) | (5.7667, 2.0424, 0.4319) |
| C43 | (4.6167, 1.9831, 0.4519) | (5.3833, 1.9831, 0.4519) | (4.2333, 2.0424, 0.4319) | (7.2167, 2.4838, 0.3006) |
| C51 | (1.5000, 2.7601, 0.1981) | (5.9167, 2.6550, 0.2260) | (4.0833, 2.6550, 0.2260) | (8.5000, 2.7601, 0.1981) |
| C52 | (4.6167, 1.9831, 0.4519) | (6.6833, 2.2999, 0.3601) | (5.3833, 1.9831, 0.4519) | (8.5000, 2.7601, 0.1981) |
| C53 | (5.3833, 1.9831, 0.4519) | (7.2167, 2.4838, 0.3006) | (5.7667, 2.0424, 0.4319) | (8.5000, 2.7601, 0.1981) |
| C61 | (2.5667, 2.4204, 0.3433) | (5.3833, 2.1000, 0.4110) | (4.6167, 2.1000, 0.4110) | (7.4333, 2.4204, 0.3433) |
| C62 | (4.2333, 2.0424, 0.4319) | (4.6167, 1.9831, 0.4519) | (5.3833, 1.9831, 0.4519) | (5.7667, 2.0424, 0.4319) |
| C63 | (5.3833, 1.9831, 0.4519) | (6.6833, 2.2999, 0.3601) | (7.2167, 2.4838, 0.3006) | (9.2500, 2.8613, 0.1657) |
| C71 | (3.3167, 2.2999, 0.3601) | (4.6167, 1.9831, 0.4519) | (5.3833, 1.9831, 0.4519) | (6.6833, 2.2999, 0.3601) |
| C72 | (2.7833, 2.4838, 0.3006) | (6.6833, 2.2999, 0.3601) | (7.2167, 2.4838, 0.3006) | (8.5000, 2.7601, 0.1981) |
| C73 | (5.3833, 1.9831, 0.4519) | (5.7667, 2.0424, 0.4319) | (6.6833, 2.2999, 0.3601) | (7.2167, 2.4838, 0.3006) |
Table 10.
Priority index of alternatives.
| A1 | A2 | A3 | A4 | |
|---|---|---|---|---|
| A1 | (0.0000, 0.8001, 0.1340) | (0.0023, 0.8014, 0.1339) | (0.0000, 0.8606, 0.1176) | |
| A2 | (0.1120, 0.8001, 0.1340) | (0.0315, 0.8034, 0.1328) | (0.0000, 0.8625, 0.1164) | |
| A3 | (0.1120, 0.8014, 0.1339) | (0.0293, 0.8034, 0.1328) | (0.0000, 0.8636, 0.1163) | |
| A4 | (0.2236, 0.8606, 0.1176) | (0.1116, 0.8625, 0.1164) | (0.1138, 0.8636, 0.1163) |
Table 11.
Net flow of each alternative.
| A1 | (0.0023, 1.4223, 0.2230) | (0.4476, 1.4223, 0.2230) | (−0.4453, 2.0115, 0.3153) |
| A2 | (0.1435, 1.4246, 0.2216) | (0.1409, 1.4246, 0.2216) | (0.0026, 2.0147, 0.3135) |
| A3 | (0.1413, 1.4260, 0.2216) | (0.1477, 1.4260, 0.2216) | (−0.0063, 2.0166, 0.3134) |
| A4 | (0.4490, 1.4934, 0.2022) | (0.0000, 1.4934, 0.2022) | (0.4490, 2.1120, 0.2860) |
Table 12.
Expected value of each alternative cloud.
| 1st | 2nd | 3rd | 4th | 5th | Average Value | |
|---|---|---|---|---|---|---|
| −0.3147 | −0.3091 | −0.3192 | −0.3165 | −0.3292 | −0.3177 | |
| 0.0020 | 0.0060 | 0.0033 | 0.0128 | 0.0033 | 0.0055 | |
| −0.0125 | −0.0104 | −0.0069 | −0.0057 | −0.0093 | −0.0090 | |
| 0.3325 | 0.3159 | 0.3109 | 0.3163 | 0.2933 | 0.3137 |
Table 13.
Language variables and their corresponding triangular fuzzy numbers.
| Language Value | Triangular Fuzzy Numbers |
|---|---|
| Very poor | (0.00, 0.00, 0.15) |
| Poor | (0.00, 0.15, 0.30) |
| Moderately poor | (0.15, 0.30, 0.50) |
| Moderate | (0.30, 0.50, 0.65) |
| Moderately good | (0.50, 0.65, 0.80) |
| Good | (0.65, 0.80, 1.00) |
| Very good | (0.80, 1.00, 1.00) |
Table 14.
Fuzzy PROMETHEE method index evaluation matrix.
| A1 | A2 | A3 | A4 | |
|---|---|---|---|---|
| C11 | (0.0000, 0.2000, 0.5000) | (0.1500, 0.4333, 0.6500) | (0.3000, 0.5500, 0.8000) | (0.5000, 0.7000, 1.0000) |
| C12 | (0.3000, 0.6000, 0.8000) | (0.5000, 0.7500, 1.0000) | (0.5000, 0.7000, 1.0000) | (0.6500, 0.8667, 1.0000) |
| C13 | (0.5000, 0.7000, 1.0000) | (0.6500, 0.8667, 1.0000) | (0.5000, 0.7500, 1.0000) | (0.6500, 0.9333, 1.0000) |
| C21 | (0.1500, 0.4333, 0.6500) | (0.5000, 0.7000, 1.0000) | (0.3000, 0.5500, 0.8000) | (0.6500, 0.8667, 1.0000) |
| C22 | (0.5000, 0.7000, 1.0000) | (0.5000, 0.7500, 1.0000) | (0.6500, 0.8667, 1.0000) | (0.6500, 0.9333, 1.0000) |
| C23 | (0.0000, 0.2500, 0.5000) | (0.1500, 0.4333, 0.6500) | (0.3000, 0.5500, 0.8000) | (0.5000, 0.7500, 1.0000) |
| C31 | (0.1500, 0.3667, 0.6500) | (0.3000, 0.5500, 0.8000) | (0.1500, 0.4333, 0.6500) | (0.3000, 0.6000, 0.8000) |
| C32 | (0.3000, 0.5500, 0.8000) | (0.5000, 0.7000, 1.0000) | (0.5000, 0.7500, 1.0000) | (0.6500, 0.8667, 1.0000) |
| C33 | (0.5000, 0.7000, 1.0000) | (0.6500, 0.8667, 1.0000) | (0.5000, 0.7500, 1.0000) | (0.6500, 0.9333, 1.0000) |
| C41 | (0.5000, 0.7000, 1.0000) | (0.5000, 0.7500, 1.0000) | (0.6500, 0.8667, 1.0000) | (0.6500, 0.9333, 1.0000) |
| C42 | (0.0000, 0.1000, 0.3000) | (0.0000, 0.2500, 0.5000) | (0.1500, 0.3667, 0.6500) | (0.3000, 0.6000, 0.8000) |
| C43 | (0.1500, 0.4333, 0.6500) | (0.3000, 0.5500, 0.8000) | (0.1500, 0.3667, 0.6500) | (0.5000, 0.7500, 1.0000) |
| C51 | (0.0000, 0.1000, 0.3000) | (0.0000, 0.5833, 1.0000) | (0.0000, 0.3667, 1.0000) | (0.6500, 0.8667, 1.0000) |
| C52 | (0.1500, 0.4333, 0.6500) | (0.5000, 0.7000, 1.0000) | (0.3000, 0.5500, 0.8000) | (0.6500, 0.8667, 1.0000) |
| C53 | (0.3000, 0.5500, 0.8000) | (0.5000, 0.7500, 1.0000) | (0.3000, 0.6000, 0.8000) | (0.6500, 0.8667, 1.0000) |
| C61 | (0.0000, 0.2000, 0.5000) | (0.1500, 0.5333, 0.8000) | (0.1500, 0.4167, 0.8000) | (0.5000, 0.7667, 1.0000) |
| C62 | (0.1500, 0.3667, 0.6500) | (0.1500, 0.4333, 0.6500) | (0.3000, 0.5500, 0.8000) | (0.3000, 0.6000, 0.8000) |
| C63 | (0.3000, 0.5500, 0.8000) | (0.5000, 0.7000, 1.0000) | (0.5000, 0.7500, 1.0000) | (0.6500, 0.9333, 1.0000) |
| C71 | (0.0000, 0.2500, 0.5000) | (0.1500, 0.4333, 0.6500) | (0.3000, 0.5500, 0.8000) | (0.5000, 0.7000, 1.0000) |
| C72 | (0.0000, 0.2000, 0.5000) | (0.5000, 0.7000, 1.0000) | (0.5000, 0.7500, 1.0000) | (0.6500, 0.8667, 1.0000) |
| C73 | (0.3000, 0.5500, 0.8000) | (0.3000, 0.6000, 0.8000) | (0.5000, 0.7000, 1.0000) | (0.5000, 0.7500, 1.0000) |
Table 15.
Priorities for each alternative.
| A1 | A2 | A3 | A4 | |
|---|---|---|---|---|
| A1 | (0.0000, 0.0000, 0.2924) | (0.0000, 0.0063, 0.2899) | (0.0000, 0.0000, 0.1287) | |
| A2 | (0.0000, 0.2171, 0.6955) | (0.0000, 0.0622, 0.5066) | (0.0000, 0.0000, 0.3116) | |
| A3 | (0.0000, 0.2141, 0.6962) | (0.0000, 0.0529, 0.5098) | (0.3123, 0.0000, 0.3123) | |
| A4 | (0.0338, 0.4069, 0.8008) | (0.0000, 0.1898, 0.6144) | (0.0000, 0.1991, 0.6119) |
Table 16.
Priority indexes for each alternative.
| De-fuzziness | ||||
|---|---|---|---|---|
| A1 | (0.0000, 0.0063, 0.7110) | (0.0338, 0.8381, 2.1925) | (−0.0338, −0.8317, −1.4815) | −0.7947 |
| A2 | (0.0000, 0.2793, 1.5137) | (0.0000, 0.2427, 1.4167) | (0.0000, 0.0366, 0.0970) | 0.0426 |
| A3 | (0.3123, 0.2670, 1.5184) | (0.0000, 0.2676, 1.4084) | (0.3123, −0.0006, 0.1100) | 0.1053 |
| A4 | (0.0338, 0.7958, 2.0271) | (0.3123, 0.0000, 0.7526) | (−0.2786, 0.7958, 1.2745) | 0.6469 |
Table 17.
Comparison between results of different algorithms.
| Algorithm | Sorting Result |
|---|---|
| PROMETHEE method based on fuzzy numbers | A4 > A3 > A 2> A1 |
| PROMETHEE method based on the cloud model | A4 > A2 > A3 > A1 |
Table 18.
Planning public charging facilities layout form of Shanghai 2017–2020 (unit: one).
| County | Public Charging Pile Construction Plan in 2017 | Public Charging Pile Construction Plan in 2017 | Public Charging Pile Construction Plan before 2020 |
|---|---|---|---|
| Jinshan District (A2) | 600 | 1300 | ≥6 |
| Chongming District (A3) | 200 | 450 | ≥2 |
Table 19.
Sensitivity analysis results.
| Increasing of Index | Ranking |
|---|---|
| −30% | A4 > A2 > A3 > A1 |
| −20% | A4 > A2 > A3 > A1 |
| −10% | A4 > A2 > A3 > A1 |
| 0 | A4 > A2 > A3 > A1 |
| 10% | A4 > A2 > A3 > A1 |
| 20% | A4 > A2 > A3 > A1 |
| 30% | A4 > A2 > A3 > A1 |
© 2017 by the authors. Licensee MDPI, Basel, Switzerland. This article is an open access article distributed under the terms and conditions of the Creative Commons Attribution (CC BY) license (http://creativecommons.org/licenses/by/4.0/).
Share and Cite
MDPI and ACS Style
Chen, W.; Zhu, Y.; Yang, M.; Yuan, J. Optimal Site Selection of Wind-Solar Complementary Power Generation Project for a Large-Scale Plug-In Charging Station. Sustainability 2017, 9, 1994. https://doi.org/10.3390/su9111994
AMA Style
Chen W, Zhu Y, Yang M, Yuan J. Optimal Site Selection of Wind-Solar Complementary Power Generation Project for a Large-Scale Plug-In Charging Station. Sustainability. 2017; 9(11):1994. https://doi.org/10.3390/su9111994
Chicago/Turabian StyleChen, Wenjun, Yanlei Zhu, Meng Yang, and Jiahai Yuan. 2017. "Optimal Site Selection of Wind-Solar Complementary Power Generation Project for a Large-Scale Plug-In Charging Station" Sustainability 9, no. 11: 1994. https://doi.org/10.3390/su9111994
Note that from the first issue of 2016, this journal uses article numbers instead of page numbers. See further details here.