Drivers of Labor-Related Indicators across Diverse Mediterranean Fisheries


1
Food and Agriculture Organization of the United Nations, Viale delle Terme di Caracalla, 00153 Rome, Italy
2
Department of Ichthyology and Aquatic Environment, School of Agricultural Sciences, University of Thessaly, Fytoko Street, 38445 Nea Ionia, Magnesia, Greece
3
NISEA Fisheries and Aquaculture Economic Research, via Irno 11, 84135 Salerno, Italy
*
Author to whom correspondence should be addressed.
Sustainability 2017, 9(11), 2000; https://doi.org/10.3390/su9112000
Submission received: 30 August 2017
/
Revised: 9 October 2017
/
Accepted: 29 October 2017
/
Published: 1 November 2017
Abstract
:This regional case study is focused on employment, remuneration and labor productivity, with a particular emphasis on the interplay between labor productivity and other labor-related indicators and macroeconomic conditions in Italy, Egypt, Lebanon and Greece. Its value lies in the high degree of consistency and comparability of the data, owing to a shared data collection methodology. This has allowed for the compilation of both national and regional comparisons. The data is treated in two groups—the first group consists of national data that considers all the active vessels in a country; the second group focuses on the trawl segments of Italy and Egypt. These two countries present an interesting case study because they are so different in terms of labor productivity and remuneration performance. For instance, in Italy labor shortages have caused a shift in fishing strategies towards less labor-intensive operations to maintain the socioeconomic sustainability of the fisheries, while in Egypt macroeconomic conditions have resulted in a larger labor pool and strong incentives to work in the fisheries sector. The regional study demonstrates that labor-related indicators are interconnected and there is an inversely proportional relationship between labor productivity and remuneration and employment levels. This relationship necessitates a combined analysis. The results across and between the countries were compared, with particular attention given to labor productivity and remuneration in the respective countries with a discussion centred around the potential drivers of labor productivity.
1. Introduction
Fishing typically requires substantial labor inputs and this is reflected in the relative proportion of total costs made up by the labor component. Globally, labor costs have been estimated to account for between 30 and 50% of total costs [1]. In the four countries included in this study—Italy, Greece, Lebanon and Egypt—labor made up 39% of total operating costs, with the national ranges falling between 25 to 48% [2].
In the study area, and in most fisheries worldwide [3,4,5,6,7], crew remuneration is paid by means of a crew-share system, whereby the crew receives a share of the gross returns, rather than a fixed wage. Crew-share payments may be based only on the gross returns, or they may be paid as a “top up” of a fixed minimum wage [5]. Payment for labor via a crew-share system rather than a fixed rate allows for the sharing of both risk and reward between the vessel owner and the crew and increases crew motivation [8,9]. It has been proposed that under the crew-share system remuneration can be regarded as an opportunity cost wage [3,10,11].
Although, labor-related indicators should be of paramount importance in a complete assessment of the socioeconomic sustainability of the fisheries sector, they had only been minimally investigated in the study area prior to the inception of the Food and Agriculture Organization of the United Nations (FAO) EastMed project, which began in 2009. This paper utilises the FAO EastMed project as a source of data.
Labor is the main component of total costs in the four countries [2], but it also forms the basis of another indicator, namely the efficiency of labor, measured as labor productivity. Productivity measures the ratio of outputs relative to the required inputs. Changes in this ratio demonstrate changes in efficiency and therefore changes in the economic performance of the sector. In most economic analyses, productivity is used as an indicator of economic performance and the viability of the sector, and this is also the case for fisheries [12,13].
The productivity of labor has also been used as a potential measure of the well-being or living standards of workers, with the assumption that increases in productivity are matched by wage increases [14]. Although a decoupling of productivity and remuneration has been well described in the global and national contexts [15,16,17] and in sector-specific literature, such as for agriculture [18], from which parallels to the fisheries context are readily drawn [19], this topic has been little explored in the fisheries sector, aside from a few exceptional cases [19,20].
In this paper, an examination is made of the interaction between the elements used to calculate labor productivity so as to answer the question of whether labor productivity as an indicator adequately captures the contribution made by fishing to the livelihoods of fishers. Remuneration is compared to the minimum wage and used as a proxy for the contribution to livelihoods.
The four countries were selected based on their inclusion in the FAO EastMed project and in the associated technical document [2] and the resultant availability of data for these four countries. The data was collected through the use of similar methodologies and, as a result, exhibits a high degree of consistency and comparability. The fact that the fishing fleets of the four countries all operate in the semi-enclosed Mediterranean Sea—and in some cases share the same stocks—provides an opportunity to draw meaningful comparisons between them, while their diverse socioeconomic conditions add depth and richness to the study.
The paper begins with an explanation of the data collection methodology, the rationale for the selection of indicators and the techniques applied to improve data comparability. The results across and between the countries are then compared, with particular attention paid to labor productivity and remuneration in the respective countries. The discussion is centred around an examination of the potential drivers of labor productivity performance.
2. Materials and Methods
2.1. Regional Background and Policy Context
The data for all four countries was collected using comparable methodologies [2]. This resulted in a high degree of data consistency and comparability and provided a unique opportunity for the compilation of national and regional comparisons.
In 2012, the four countries—Italy, Greece, Lebanon and Egypt (Figure 1)—had a total population of 161 million people [21], about one-third of the total population of all of the Mediterranean countries. The fishing fleets of these four countries were analyzed in this paper. All of the fleets were managed through input controls [21,22], largely based on fixed licence availability, temporal and/or spatial limitation, limits on the allowable gear types and—aside from for Bluefin tuna—without quota systems in place [6,7,23,24,25]. In the Mediterranean there is not a single policy context, but rather a mix of international, regional and national policies are applied. The European countries in the Mediterranean fall under the purview of the Common Fisheries Policy (CFP), which has been periodically updated since it was first introduced in the 1970s [26]. The social and economic sustainability of fisheries was explicitly referenced in the CFP [20] and make up two of the three main pillars of sustainability in the policy (with the third being environment). The scope of sustainability is best considered under a wider context beyond fishers and vessels to families and communities. Although not clearly defined in the policy of the CFP, the importance of fishing activity to a community is extended beyond the wealth generated by landings and catch to the importance of fishing in the history, tradition and social fabric in the community [20]. Article 3.3 of the Lisbon treaty [20] specifies that the European Union (EU) should establish a ‘social market economy, aiming at full employment and social progress’. Another aspect of the management strategy, and of relevance in the context of this paper, are the objectives around the management, modernization and reduction of fishing fleets [20].
A regional fishery management organization and a regional fishery body operate in the Mediterranean—the International Commission for the Conservation of Atlantic Tunas (ICAAT) and the General Fisheries Commission for the Mediterranean (GFCM), respectively. The four countries included in this study are all members in the GFCM, as are the majority of Mediterranean countries. The GFCM was first established in 1952 [27], where the earliest management measures were nonbinding and focused on stock status in a data-limited situation. Binding measures were adopted for GFCM starting in 2005 with a focus on input controls [27] and the management measures are constructed on four pillars including social and economic. In the non-EU countries, the national fishery policies are set to fulfil the requirements of GFCM, but all matters outside the areas covered by GFCM fall under the national policies which may have different focuses and outcomes from those of the CFP. National fisheries policies in Egypt and Lebanon (the two non-EU countries included in this paper) include temporal limitations for the fishing activities of some of the fleet segments [6,7,21,22].
The sharing of similar management schemes, as shown in Table 1, allowed for a comparison to be made between the fisheries of the four countries and the fisheries of other countries that are at the same level of maturity, in terms of fisheries management, but are characterised by very different economic conditions at a national scale.
In 2012, the fisheries collectively landed a total of 363,000 metric tons, worth $1.9 billion USD. This catch accounted for 62% of the total value of landings in the Mediterranean in that year [2]. Egypt had the second largest trawl fleet in the Mediterranean [28,29] while Lebanon was the only country that did not have a trawl fleet. Apart from in specific cases, it has generally not been advisable to increase the volume of catch [30,31]. The four countries also share similar management schemes with other countries of the Mediterranean and many stocks are shared [30]. Occasionally, the fleets of the region will exploit common fishing grounds [32,33] and the sharing of some resources effectively neutralises this factor from impacting the labor productivity score between the four countries.
The four countries selected for this study are characterised by highly diverse socioeconomic conditions and levels of income. For instance, Egypt is classified as a lower-middle income country, while Lebanon is an upper-middle income country and both Italy and Greece are high-income countries and are members of the Organisation for Economic Co-operation and Development (OECD). A pronounced north–south asymmetry is present across the macroeconomic indicators, with lower income levels concentrated in the southern countries (Table 2) and the macroeconomic conditions in the selected countries for the comparison represent the full spectrum of income levels observed in the fisheries of the semiclosed Mediterranean Sea. Table 3 shows the total landings (quantity and value) for the four study countries.
2.2. Data Sources and Comparability
Data were extracted from the technical document A sub-regional analysis of the socioeconomic situation of the Eastern Mediterranean fisheries [2]. In this document the data were presented in a more detailed form and were assessed using a coefficient of variation modified for small populations. The data from Italy and Greece were collected under the EU Data Collection Framework [34] and were thus subject to the mandated data quality parameters that were also met by Lebanon and Egypt (D. Pinello, pers. comm). The data from Lebanon and Egypt’s Mediterranean fishing fleet were derived from the socioeconomic surveys conducted under the FAO EastMed project. Definitions of micro and macro variables were applied in all the countries and they were consistent with those of the General Fisheries Commission for the Mediterranean (GFCM) Data Collection Reference Framework (DCRF) and the European Data Collection Framework (DCF) [29].
The data utilized in this paper were all collected using a similar survey methodology. Data were collected in the course of each of the respective countries’ annual fisheries data collection programme [2]. The methodology consisted of a stratified random sampling strategy, where the commercial fishing fleet was stratified into homogenous segments within each country according to technical and dimensional criteria. Such criteria were based on the GFCM fleet segmentation criteria [29] for which segmentation is based on a combination of gear type and length overall (LOA) class. Vessels were assigned a gear type when a particular gear was used more than 50% of the time at sea during a year. The sampling units consisted of randomly selected fishing vessels that were surveyed by means of direct interviews conducted by trained data collectors. The methodology applied is reported in the document, Handbook for fisheries socioeconomic sample survey—principles and practice [35]. As a result of the application of variables with the same definition, and the use of a very similar methodology for their collection, the data were directly comparable.
In order to harmonize the data and place them in comparable monetary values, the indicators “labor productivity” and “gross value added” (GVA) were adjusted to the relative cost of living and inflation rates in the different countries using the Purchasing Power Parity (PPP) conversion factors. The adjustment to the cost of living in the different countries was conducted using the World Bank official exchange rates and PPP conversion factors. Table 4 details the conversion figures utilized.
2.3. Selection of Indicators
From the selection of socioeconomic indicators which, along with their respective reference values, are important for fishery management [36,37,38], a particular subset of indicators focused on labor have been examined in this paper. The selection of the indicators was made based on partially on expert opinion, but most strongly based on data availability due to the use of these indicators in the CFP [26] and in the EastMed project [2]. These indicators, their definitions and the methodology used to calculate the key indicators for this study is described in the following section.
The indicators analyzed and used in order to make national and regional comparisons were organised into three categories: labor-related; performance and macroeconomic indicators. The indicators were all sourced from A sub-regional analysis of the socioeconomic situation of the Eastern Mediterranean fisheries, referred to above [2], with the exception of labor productivity which was sourced from the Handbook for fisheries socioeconomic sample survey—principles and practice [35,39].
Performance indicators:
(d) GVA/vessel (PPP)
The net output of fisheries after deducting intermediate inputs from all outputs, in this case reported per vessel. GVA shows the portion of revenues directed to remuneration, profit, opportunity cost and depreciation.
GVA/vessel was measured as: revenues − (energy costs + repair + maintenance costs + other operational costs + commercial costs + fixed costs).
Macroeconomic indicators:
(e) Minimum wage (PPP)
The minimum wage of the manufacturing sector, (current USD) as reported by the World Bank.
(f) GDP per capita (PPP)
Gross domestic product (GDP) at market prices is the expenditure on final goods and services minus imports: final consumption expenditures, gross capital formation and exports less imports [43]. Fishers in nations with higher GDP values typically have access to more efficient technology, resulting in increased mechanisation [44,45]. For example, the labor productivity in the new member states of the European Union (EU) is about 25% of that of the EU—25 average [46].
Table 5 provides a summary table of the indicators selected, their definitions and the relevant units and acronyms, which are described in detail in Section 2.3.
2.4. Data Used
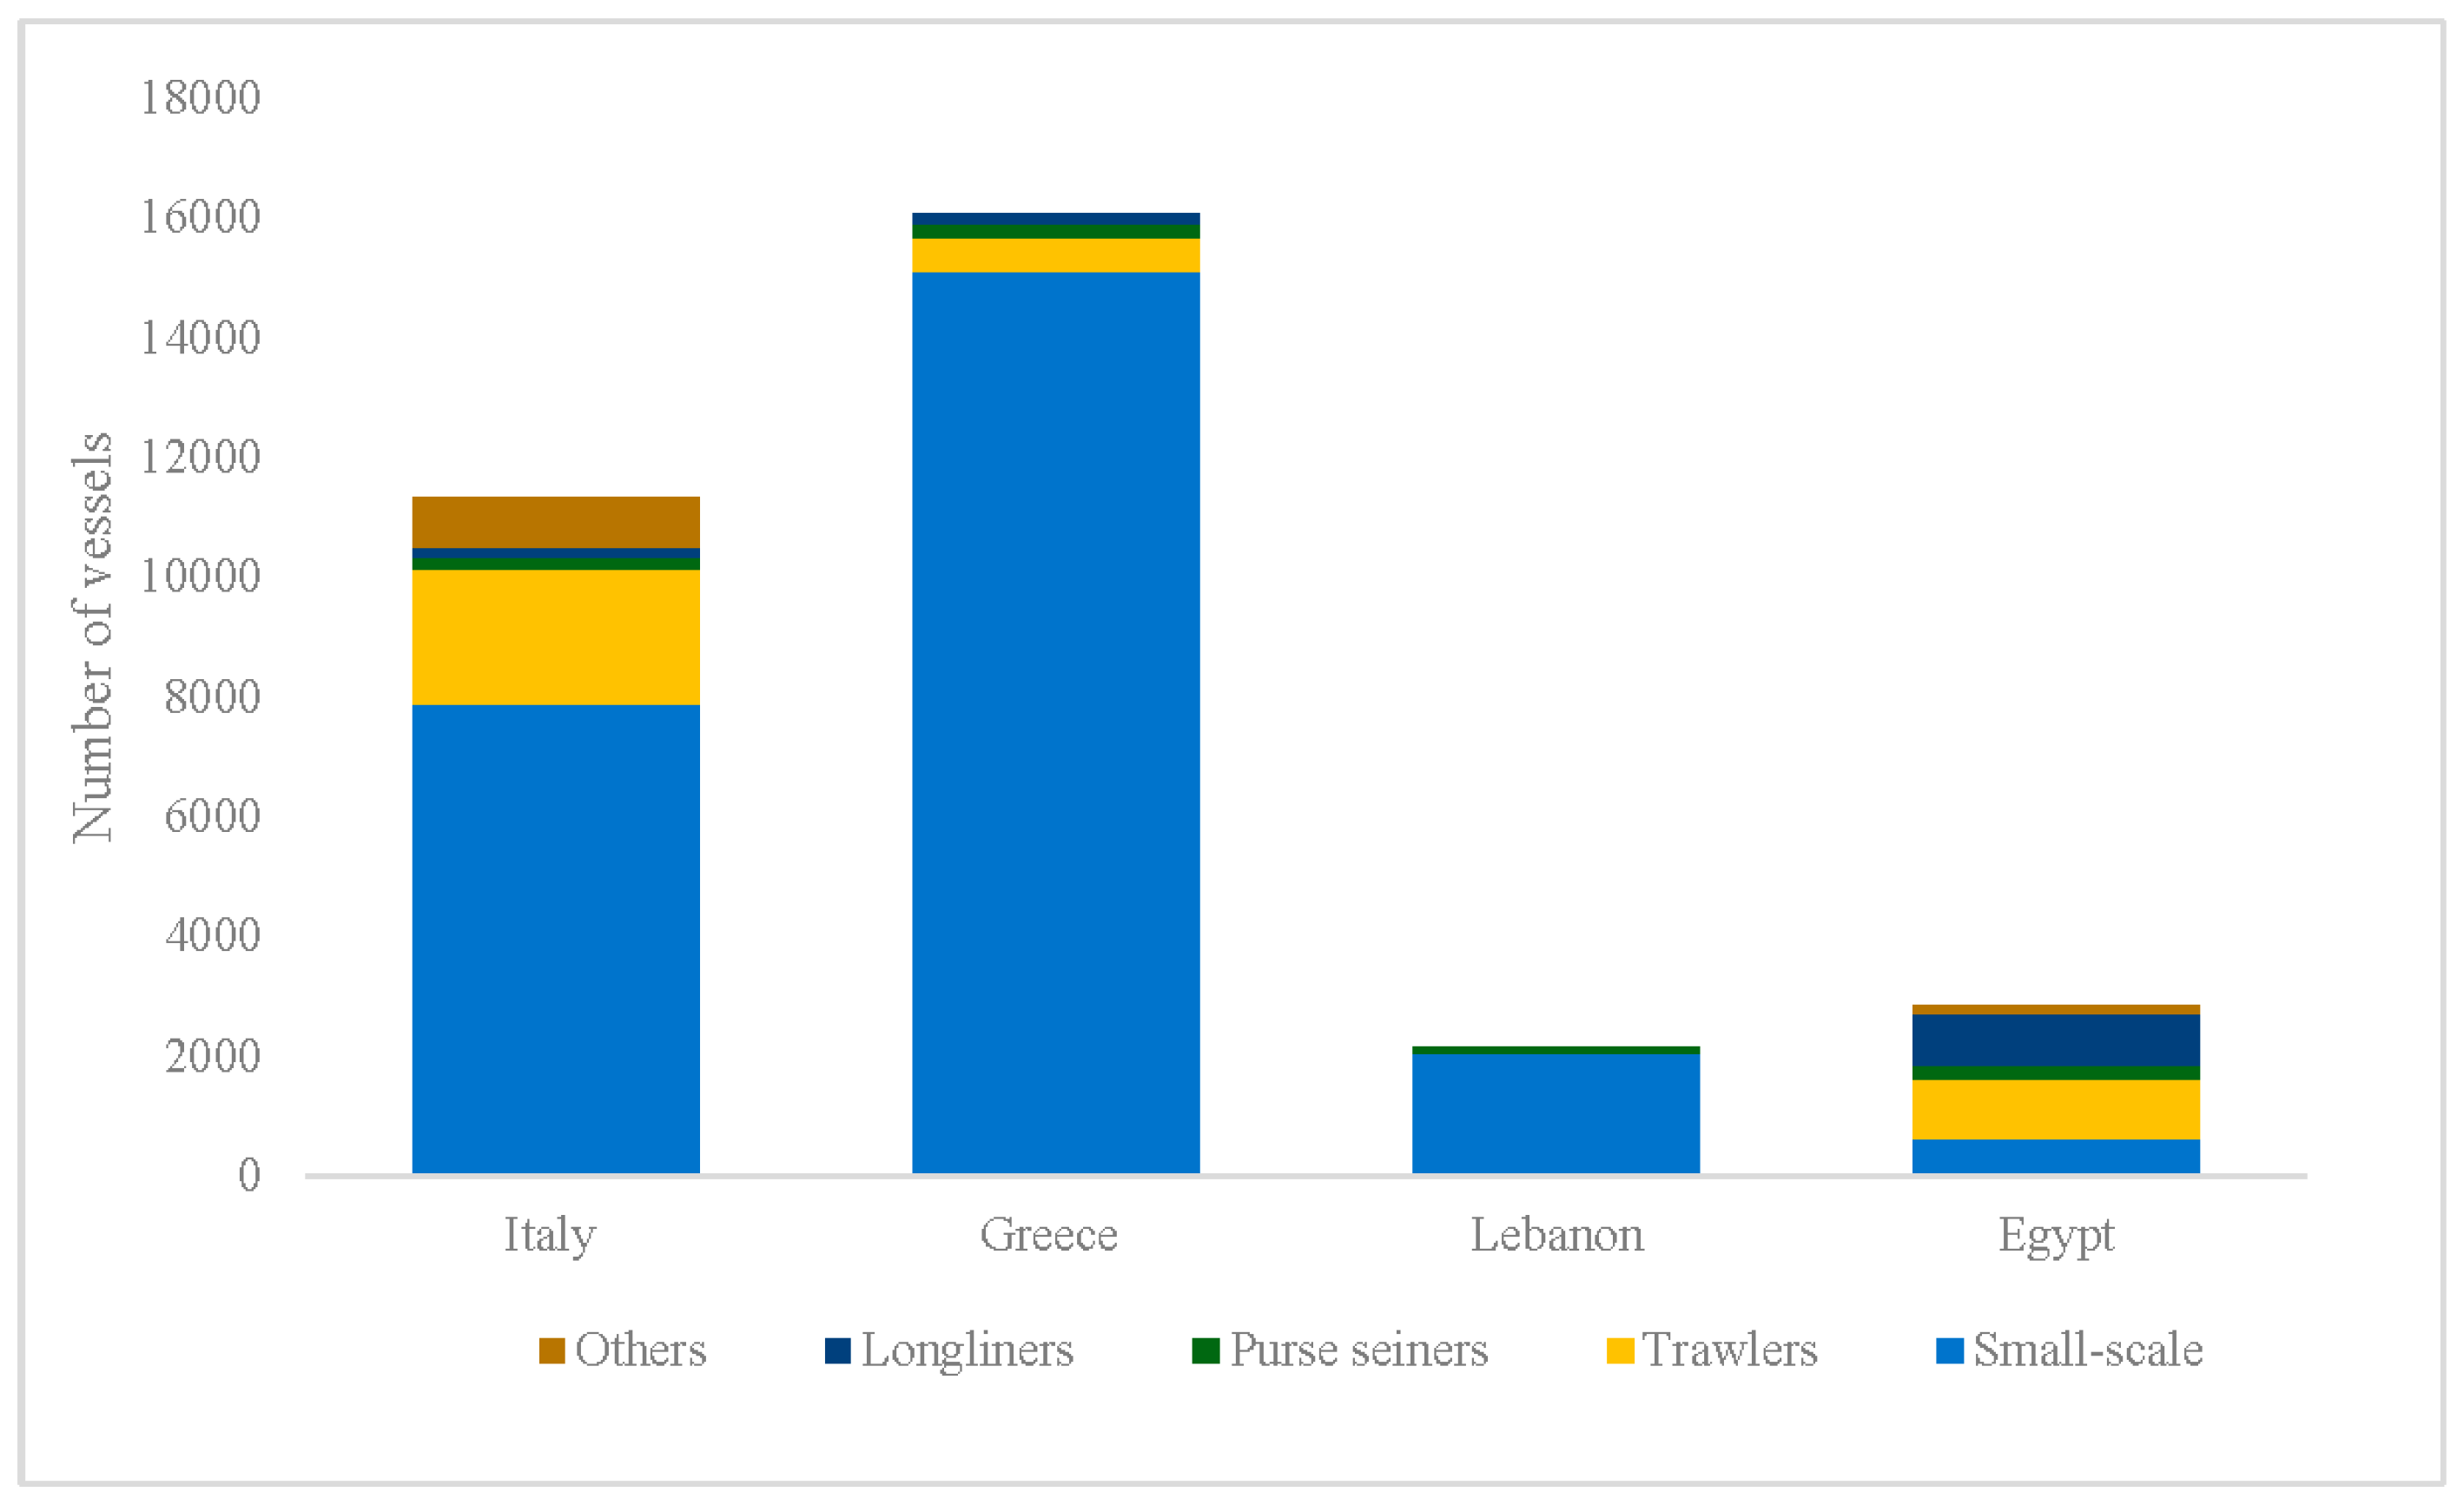
In 2012, across Italy, Greece, Lebanon and Egypt, the total number of active vessels in the fishing fleet was 32,362. According to the definitions of the GFCM and the EU [29,34] vessels that did not work in 2012 were classified as inactive and excluded from the data presented here. The fleet segments analyzed for each country were the total fleet plus the segments present in at least three out of the four countries. The analyzed segments accounted for 97% of the total number of vessels operating in the four countries. The fleet was dominated by the small-scale segment at 79% of the total and this was followed by trawlers at 12%. The relative proportion of the fleets for each country are shown in Figure 2.
In Greece and Lebanon the small-scale segment was 94 and 95%, respectively, of the total national fleet. In contrast, trawlers dominated the Egyptian fleet at 36% of the total. In Italy, trawlers were the second largest segment after the small-scale segment. Lebanon was the only country without a trawl fleet [6] A combination of factors that include: a lack of government fuel subsidies; unsuitable bathymetry for trawling; regulations preventing fishing outside twelve nautical miles; and a ban on trawling within six nautical miles of the coastline [6] have all compounded to result in the absence of a trawl fleet in Lebanon.
The data were treated in two groups. The first group considered all the active vessels in each country and the second group focused on the trawl segments of Italy and Egypt. As was noted above, Lebanon does not have a trawl fleet and Greece was excluded because of the small number of trawlers in the national fleet. The trawl segment was selected for particular focus because of the large number of trawlers operating in the region and the fact that crew sizes on trawlers are typically large and consistent over time. Vessel owners are generally not engaged on board trawlers which neutralises this complication for data analysis. Trawlers also carry the most homogeneous type of gear.
Values for the minimum wage (for the manufacturing sector) and the GDP per capita were extracted at national level (Table 6). The total fishing fleet employed approximately 80,000 people [2,6,7,31] corresponding to about 76,000 people on a FTE basis. Employment was further broken down to average FTE per vessel. In general, the European countries had lower FTE per vessel, as was seen in the example of the small-scale fleet segment. In terms of activity, the number of days at sea ranged between Italy with 137 days and Lebanon with the highest number at 193 days (Table 6).
Reported remuneration against the minimum sectoral wage of the country (REM) ranged from the worst performance in Italy—where the average remuneration was 0.66 of the minimum sectoral wage—to Egypt where remuneration was 1.34 times the minimum sectoral wage. This pattern was consistent when the trawl fleet segments where considered. The performance in Italy was 0.78 of the sectoral minimum wage while in Egypt it was 1.47 times higher.
The highest LP, adjusted to PPP, was recorded in Italy and it was nearly three times higher than the other countries included in the analysis. For the trawl segment, the LP score was highest for Italy, at nearly 35,000 and in Egypt just over 13,000 (Table 7).
3. Results
The results are presented in an index table (Table 8) in which the data for the total fleet may be easily read and compared. The average for the group of countries for each of the variables is used as the base figure.
The strongest labor productivity performance was recorded in Italy. This pertained to both the national average and the trawler fleet, the most homogeneous segment. Labor productivity scores were relatively similar for Egypt, Greece and Lebanon.
In contrast, Italy had the lowest performance for REM at the national level and for the trawler fleet. The highest REM performance was found in Egypt, followed by Greece and then Lebanon. In Greece, the minimum wage was low compared to the GDP, as a result of the financial crisis [47].
Employment per vessel was highest in Egypt at about 2.7 times the average; the remaining three countries performed similarly at under half the average, with the smallest value recorded in Greece as a result of the strong influence of the small-scale fleet. Within the trawler fleet, the performance of Italy and Egypt was markedly different, with Egypt employing nearly five times more people per vessel.
Lebanon and Greece performed similarly, with both recording the lowest values for GVA per vessel. Egypt’s performance was over seven times higher than these two countries and just over double Italy’s performance. The same pattern was evident between the trawl fleets of Egypt and Italy.
The comparison of the minimum wage for the manufacturing sector (adjusted to PPP) revealed that Italy was nearly two times the average, Greece and Lebanon were below the average and Egypt was under half of the average. The GDP per capita (adjusted to PPP) was above the average for Italy and Greece and below the average for Lebanon, and just under half of the average for Egypt.
Labor productivity was first correlated against the two elements of its formula to determine which factor was most responsible for driving performance (Table 9). The analysis showed that there was only a weak correlation between GVA and labor productivity, while there was a higher negative correlation between labor productivity and FTE. This would indicate that, in this regional example, FTE had a larger impact on the labor productivity performance.
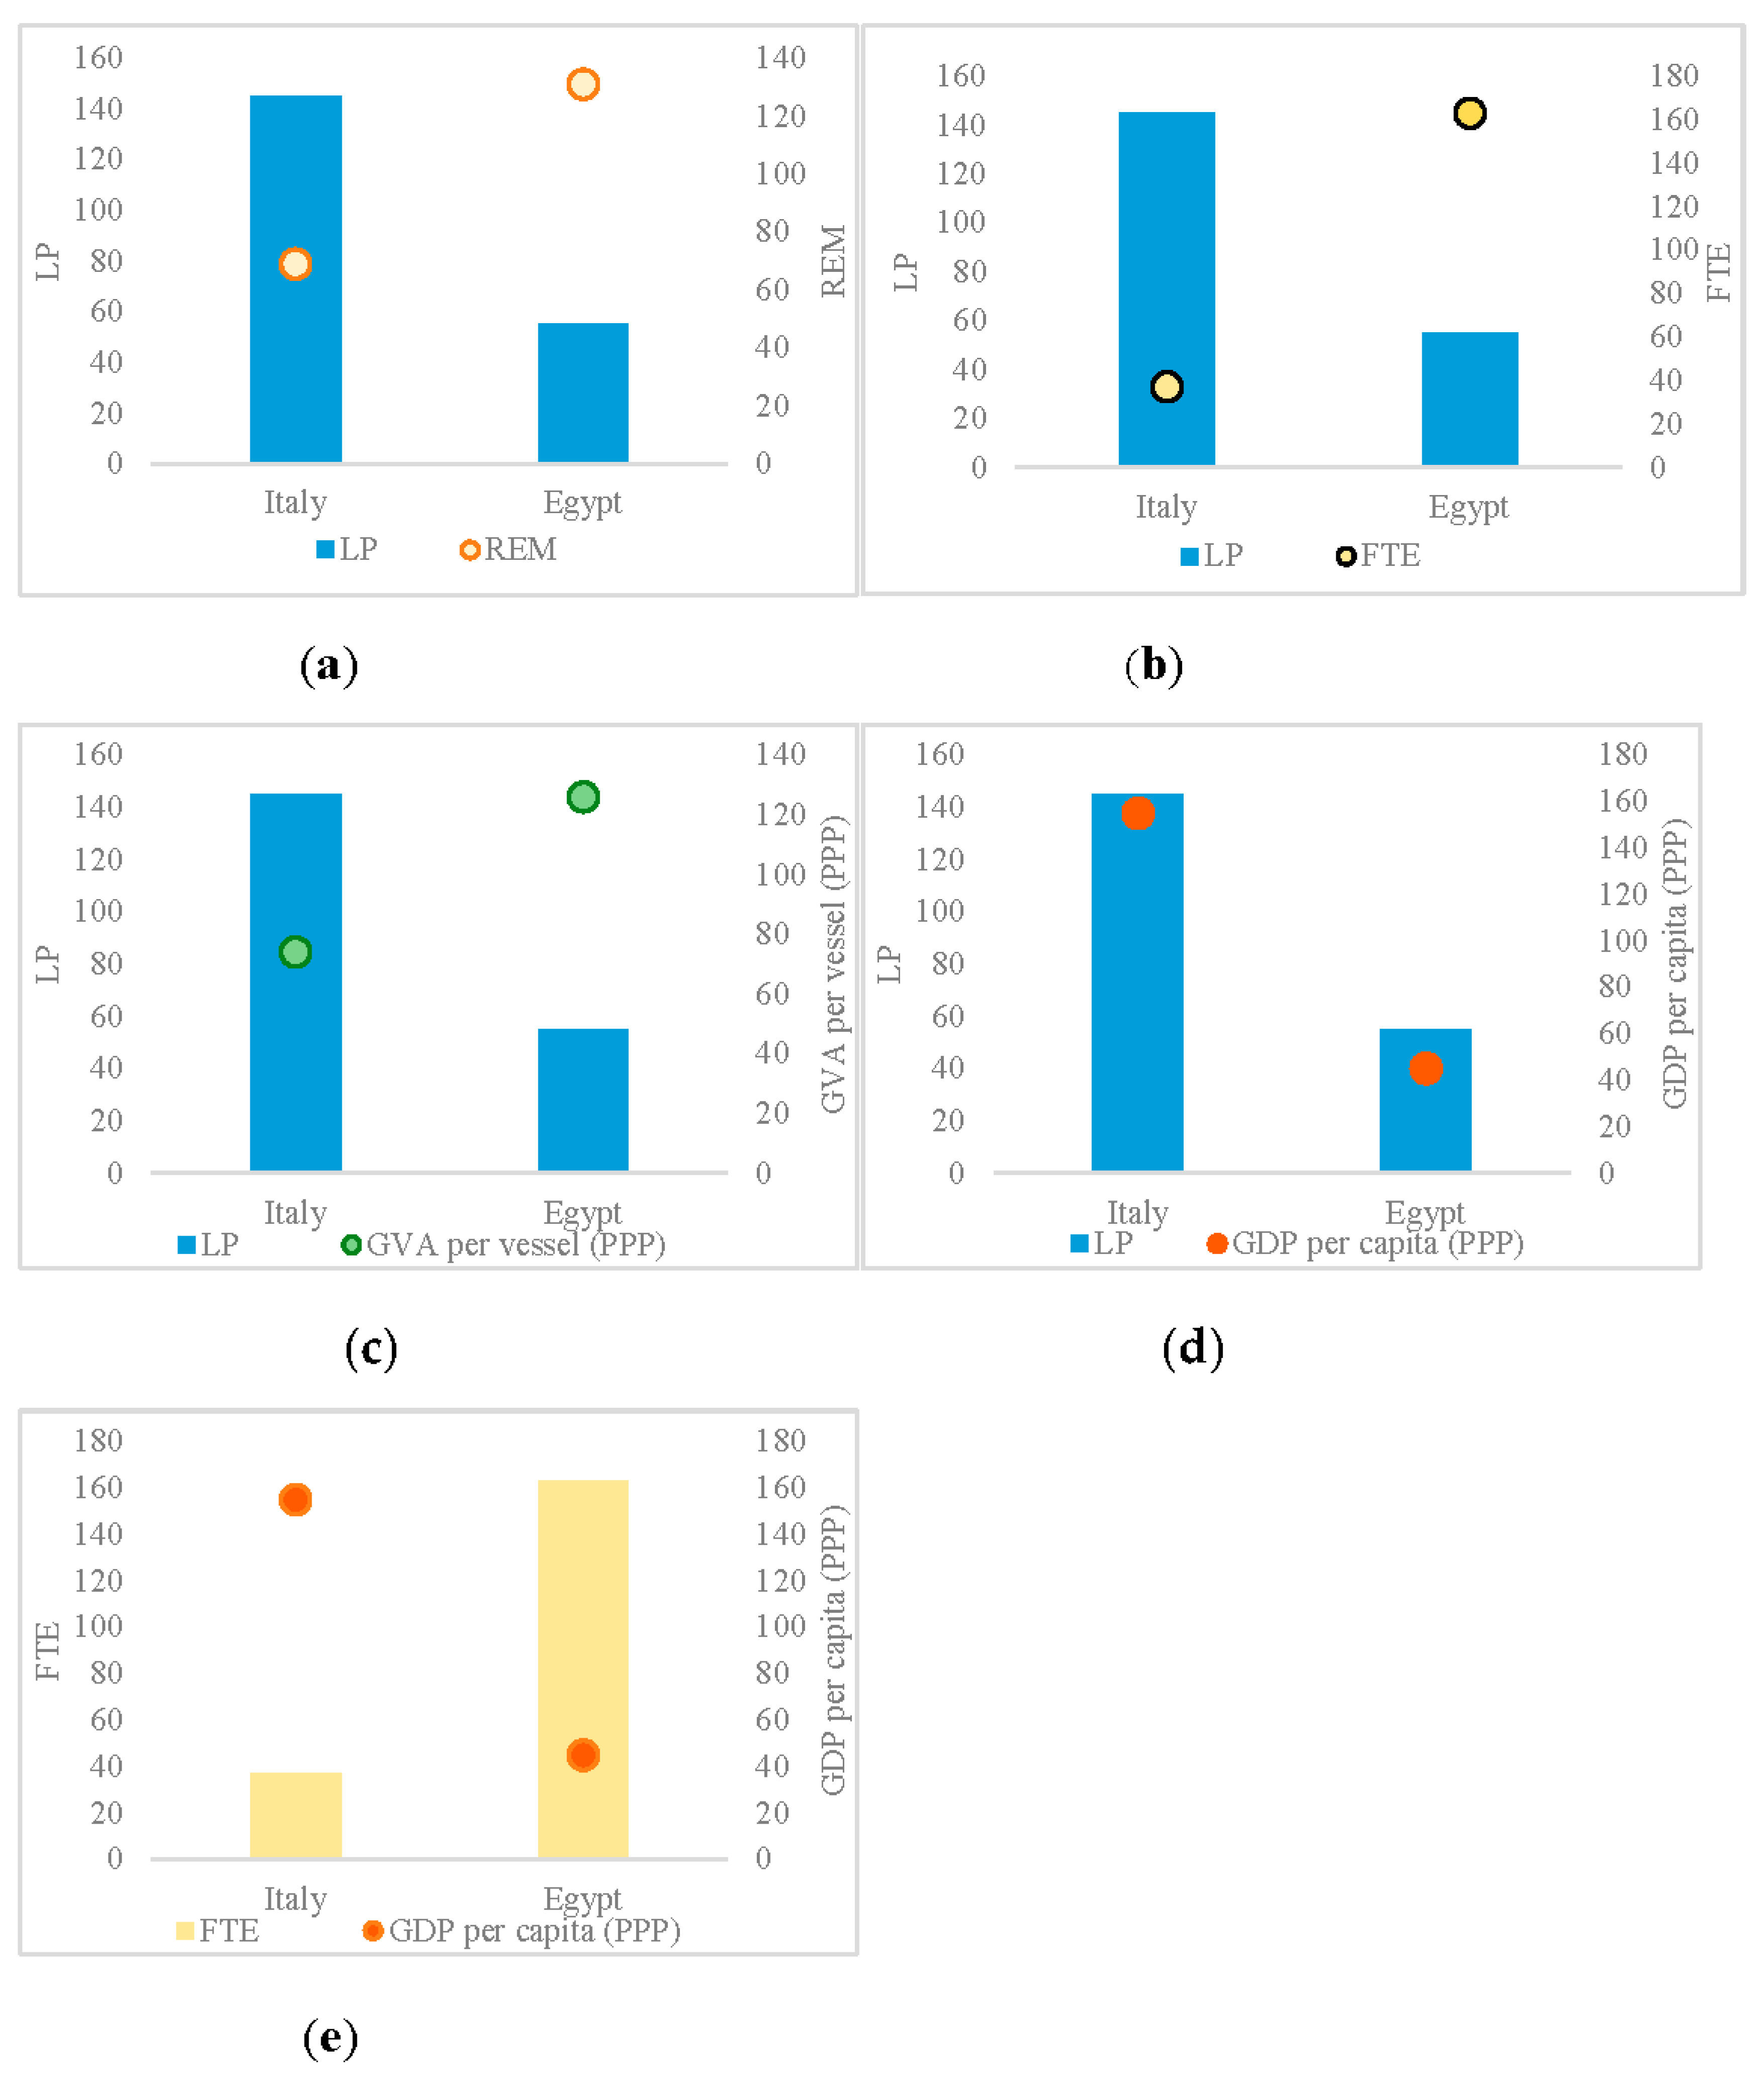
An assessment made of the trawl fleets of Italy and Egypt between FTE/GDP per capita; LP/GDP per capita, LP/GVA; LP/FTE and LP/REM provided visual confirmation of this correlation (Figure 3). When labor productivity was correlated against the other labor-related indicator, REM, it was found to be negatively correlated and this was corroborated by a visual assessment of the two indicators for the trawlers in Egypt and Italy, as shown in Figure 3.
GDP and minimum wage (PPP) are both presented in Table 8, however only GDP is included in a correlation. This decision was motivated by the fact that minimum wage is readily influenced by contingent factors, as was pointed out in the example of Greece, where the economy has been seriously affected by the financial crisis. Apart from in instances like these, minimum wage most often is a reflection of the GDP of a country. The correlation between labor productivity and GDP per capita (PPP) was positive and stronger than for the labor productivity against any of the other analyzed factors. The correlation was found to be −0.71 between FTE and GDP.
4. Discussion
Labor productivity is equal to the GVA divided by the FTE, but FTE was found to have a greater influence on the labor productivity score. The time worked is reflected in the measure of FTE employment. This measure is standardised against a fixed threshold of 2000 h per year and this standardisation also neutralizes the impact on labor productivity scoring between the countries.
Also shared between the countries is the use of the crew-share system, which is effectively an incentive scheme that provides motivation for the fishers’ productivity. The skill of the workers is difficult to enumerate quantitatively and this component was thus excluded from the analysis. When the crew-share payment system is in place, reductions in the number of crew do not result in significant reductions in the labor cost component of vessels because the proportion of revenues assigned to the crew-share is a fixed ratio, no matter the number of crew members. Under these conditions and when the owner (who is the decision-maker for the vessel) is not on board they are not particularly motivated to reduce the number of crew. In any case, there is a threshold of remuneration per fisher above which the number of crew can vary but below which the number of crew has to be reduced in order to increase the attractiveness of work in the sector. The FTE was negatively correlated with GDP—the higher the income level, the higher the minimum wage for the sector and the lower the FTE in the fishery.
While REM measured how attractive fisheries work is by comparing the average remuneration against the minimum wage, it was this matter of attractiveness that drove the value for FTE. A general global trend has been identified, whereby an exit from work in primary sector occupations such as fishing follows an increase in national GDP. This is described in Section 1. As the baseline for salaries increases, the “acceptable” income level also shifts upward.
Italy and Greece demonstrated the poorest performance for remuneration against the minimum wage and amongst the four countries examined in this study, Italy and Egypt presented the most contrasting cases. The labor productivity in Italy was relatively high, while the remuneration against the minimum wage was low, as was the average FTE per vessel. The reduced attractiveness of the sector has been broadly described in the context of the European Union [20,48] and in Italy as supported by the relatively higher number of non-Italians working in fisheries [49]. This trend is also seen in other countries where the ratio of remuneration to the minimum wage is low. In Egypt, the average employment per vessel and the remuneration against the minimum wage were high, while labor productivity was lower. In this country, the fishing sector still offers attractive employment conditions, with relatively higher remuneration levels and higher levels of employment on board vessels. When considering the macroeconomic conditions that prevail in the countries, it was not surprising to find higher fisheries employment and lower labor productivity in Egypt. There was a negative correlation between the performance of labor productivity and remuneration across the four countries.
Mechanization plays an important role in improving the efficiency of landings per unit of effort and expediting the work on board fishing vessels. In addition, increased mechanization results in part from the declining attractiveness of the fisheries sector and a resultant reduction in the work force—which then drives increased mechanisation. An example of the fluctuating attractiveness of work in the fisheries sector was provided by a study of the Lofoten fishery in Norway that spanned 130 years [50]. The study showed that participation in fisheries fell off when the national economy achieved a high growth rate. Improvements in productivity in that fishery were partially attributed to technological improvements, but were largely as a result of declining participation during good economic times (ibid). Typically the higher the income level of the country, the lower the propensity to work in less attractive primary sector activities [20,51]. Changes in work preference, increases in alternative work options and shifting demographic patterns all broadly describe the labor-supply related causes for shifts in labor-supply curves [51], but in simplistic terms, positive macroeconomic performance in a country increases the alternative work options, outside the primary sector, while increasing expectations about remuneration levels. This shifts the equilibrium point in the labor-supply curve and the number of workers in the labor pool is reduced [51].
Under the crew-share system, labor costs are not reduced by mechanization because the amount apportioned for the crew share remains relatively constant, regardless of the number of crew engaged. Reductions in FTE are not a result of increasing mechanization, but rather increasing mechanization is the result of a constricted labor pool. It is proposed that in the fisheries sector of the Mediterranean region, as in many other economic sectors, a paradigm links different factors: the higher the income level of the country, the lower the attractiveness of the fisheries sector and the employment per vessel, resulting in higher labor productivity levels. Conversely, the lower the income level of the country, the more attractive work in the fisheries sector is and so employment per unit levels are increased and labor productivity decreases. The asymmetrical policy landscape in the Mediterranean with European and non-EU countries falling under different policy and management schemes could also drive the LP performance. Particularly, under the CFP regime, which focused on reducing fleet capacities—and thereby the total number of vessels fishing—a reduced labor pool would be one result of the policies. Keeping all other factors constant, labor productivity increases can be driven by reductions in the number of people on board the vessel and this is really a result of external factors, including the macroeconomic conditions of the country.
REM was found to be negatively correlated with labor productivity, although initially it may have been expected that they would be directly linked owing to the prevalence of the crew-share system which links productivity and remuneration. However, labor productivity is also related to the average number of crew members on a vessel. The maximum number of crew members employed on a vessel is largely determined by a mechanism that defines an adequate wage for work in the fisheries sector. Under the crew-share system, the percentage of revenue that is assigned to the crew-share remains constant no matter how many crew members are included. This means that the owner of the vessel does not have an incentive to reduce the number of crew because additional crew members have little to no impact on costs. What does limit the number of crew (within the bounds of what is required/possible for the vessel) is the size of each individual’s remuneration when the total crew-share amount is divided into a greater number of shares. The upper limit for the number of crew is influenced by the requirement that remuneration does not drop below an adequate wage—here proxied with remuneration compared to the minimum wage.
From the analysis in this paper, it would appear that the decoupling of productivity and remuneration that is common at the global and national levels, and normal in other economic sectors, is also a factor for fisheries. Labor productivity rates are strongly affected by macroeconomic factors outside the fishery itself, and in countries like Italy, these have resulted in labor force shortages and a consequent shift in fishing strategies towards less labor-intensive operations. In contrast, in Egypt, the macroeconomic conditions are different—there is a large labor pool and strong incentives to work in the fishing sector. Labor productivity appears to be a reflection of the economic situation of the country in which a fishery operates, rather than an objective that fisheries management should strive for, or a measure of livelihoods for the fishers. In order to best capture the socioeconomic performance of a fishery, labor productivity should only be used to assess efficiency and should be paired with other indicators, like REM, to give a more complete assessment.
5. Conclusions
The value of this study lies in the fact that the fishing fleets of the four countries have many similarities, including that they operate in the same marine environment and in some cases share the same stocks and record similar rates of exploitation of these commons in the Mediterranean fisheries. These factors, coupled with the fact that the data utilized for the analysis was collected through the use of a comparable methodology, have resulted in high levels of data consistency, and provided an opportunity to draw meaningful comparisons between the countries, while also taking into account their distinct socioeconomic conditions.
The findings of this paper suggest that (i) labor productivity does not capture the contribution to livelihoods, using REM as a proxy; (ii) variations in performance for labor productivity appear to be the result of adaptations within fisheries to outside macroeconomic factors; (iii) the crew-share system makes labor costs a fixed share of the gross profits and the total amount of labor costs is fixed so, from the owner’s perspective the number of crew members has a limited impact on profits. This to a large extent shifts the influence in the determination of labor productivity to the employment factor; and (iv) labor productivity should not be used as a stand-alone indicator, but should rather be considered in combination with other indicators. In summary, labor productivity would appear to reflect the policy context a fishery is situated in as well as the macroeconomic context. The social sustainability of fisheries, which must be supported for effective policy regimes, is not particularly measured, nor supported, by LP. Although this paper considered four countries in the Mediterranean, the same caution should be exercised globally, and labor productivity should not be considered a stand-alone indicator of the socioeconomic performance of a fishery.
Acknowledgments
This research did not receive any specific grant from funding agencies in the public, commercial, or not-for-profit sectors. The authors wish to thank Claire Attwood for the language editing of the manuscript and to thank the anonymous reviewers for their helpful feedback and suggestions on an earlier draft of the manuscript. All errors remain the responsibility of the authors.
Author Contributions
Jennifer Gee and Dario Pinello conceived, designed the work and drafted the manuscript. Jennifer Gee, Dario Pinello and Konstantinos Polymeros were responsible for the acquisition, analysis, and interpretation of data for the work and all made critical revisions to the intellectual content of the work and all made final approval of the version to be published. All authors agree to be accountable for all aspects of the work in ensuring that questions related to the accuracy or integrity of any part of the work are appropriately investigated and resolved.
Conflicts of Interest
The authors declare no conflicts of interest.
References
- The World Bank; Food and Agriculture Organization (FAO). The sunken billions. In The Economic Justification for Fisheries Reform; The World Bank: Washington, DC, USA; FAO: Rome, Italy, 2008. [Google Scholar]
- Pinello, D.; Dimech, M. FAO EastMed. A Sub-Regional Analysis of the Socio-Economic Situation of the Eastern Mediterranean Fisheries; Final Report GCP/INT/250/EC-IT/TD-22; FAO: Rome, Italy, 2016. [Google Scholar]
- Anderson, L.G. The share system in open-access and optimally regulated fisheries. Land Econ. 1982, 58, 435–449. [Google Scholar] [CrossRef]
- McConnell, K.; Price, M. The lay system in commercial fisheries: Origin and implications. J. Environ. Econ. Manag. 2006, 51, 295–307. [Google Scholar] [CrossRef]
- Guillen, J.; Boncoeur, J.; Carvalho, N.; Frangoudes, K.; Guyader, O.; Macher, C.; Maynou, F. Remuneration systems used in the fishing sector and their consequences on crew wages and labor rent creation. Marit. Stud. 2017, 16, 3. [Google Scholar] [CrossRef]
- Pinello, D.; Dimech, M. Socio-Economic Analysis of the Lebanese Fishing Fleet; Final Report GCP/INT/041/EC-GRE-ITA/TD-16; FAO: Rome, Italy, 2013. [Google Scholar]
- FAO EastMed. Socio-Economic Analysis of Egyptian Fisheries: Options for Improvement; Final Report GCP/INT/041/EC-GRE-ITA/TD-19; FAO: Rome, Italy, 2014. [Google Scholar]
- Sutinen, J.G. Fishermen’s remuneration systems and implications for fisheries development. Scott. J. Political Econ. 1979, 26, 147–162. [Google Scholar] [CrossRef]
- Plourde, C.; Smith, J.B. Crop sharing in the fishery and industry equilibrium. Mar. Resour. Econ. 1989, 6, 179–193. [Google Scholar] [CrossRef]
- Griffin, W.L.; Lacewell, R.D.; Nichols, J.P. Optimum effort and rent distribution in the Gulf of Mexico shrimp fishery. Am. J. Agric. Econ. 1976, 58, 644–652. [Google Scholar] [CrossRef]
- Grafton, R.; Kirkley, J.; Kompas, T.; Squires, D. Economics for Fisheries Management; Ashgate Publishing: Hampshire, UK, 2006. [Google Scholar]
- Organisation for Economic Cooperation and Development (OECD). Labour Productivity Indicators: Comparison of Two OECD Databases Productivity Differentials and the Balassa-Samuelson Effect. Prepared by Rebecca Freeman. 2008. Available online: http://www.oecd.org/employment/labour-stats/41354425.pdf (accessed on 2 August 2017).
- Walden, J.; Fissel, B.; Squires, D.; Vestergaard, N. Productivity change in commercial fisheries: An introduction to the special issue. Mar. Policy 2015, 62, 289–293. [Google Scholar] [CrossRef]
- Scientific, Technical and Economic Committee for Fisheries (STECF). Annual Economic Report—Methodology; Publications Office of the European Union: Luxembourg, 2016; Available online: https://stecf.jrc.ec.europa.eu/documents/43805/1489224/2016_AER_6_METHODOLOGY.pdf (accessed on 2 August 2017).
- Fleck, S.; Glaser, J.; Sprague, S. The Compensation–Productivity Gap: A Visual Essay. 2011. Available online: https://www.bls.gov/opub/mlr/2011/01/art3full.pdf (accessed on 24 July 2017).
- Mishel, L. The Wedges between Productivity and Median Compensation Growth; Issue Brief 330; Economic Policy Institute: Washington, DC, USA, 2012. [Google Scholar]
- Schwellnus, C.; Kappeler, A.; Pionnier, P.-A. Decoupling of Wages from Productivity: Macro-Level Facts. Economics Department Working Papers No. 1373, ECO/WKP(2017)5. 2017. Available online: https://www.oecd.org/eco/Decoupling-of-wages-from-productivity-Macro-level-facts.pdf (accessed on 2 August 2017).
- McCullough, E. Labor productivity and employment gaps in sub-Saharan Africa. Food Policy 2017, 67, 133–152. [Google Scholar] [CrossRef] [PubMed]
- Urquhart, J.; Acott, T.G. Re-connecting and embedding food in place: Rural development and inshore fisheries in Cornwall, UK. J. Rural Stud. 2013, 32, 357–364. [Google Scholar] [CrossRef]
- Gallizioli, G. The Social Dimensions of the Common Fisheries Policy: A Review of Current Measures. In Social Issues in Sustainable Fisheries Management; Urquhart, J., Acott, T.G., Symes, D., Zhao, M., Eds.; Springer Science & Business Media: New York, NY, USA, 2014. [Google Scholar]
- World Bank. World Bank Open Data: Free and Open Access to Data about Development in Countries around the Globe. Available online: http://data.worldbank.org/indicator (accessed on 2 August 2017).
- Catanzano, J.; Cunningham, S.; Rey, H. Fishery management in the Mediterranean: An evaluation of French effort-based management systems. In Microbehaviour and Macroresults, Proceedings of the Tenth Biennial Conference of the International Institute of Fisheries Economics and Trade, Corvallis, OR, USA, 10–14 July 2000; International Institute of Fisheries Economics and Trade (IIFET): Corvallis, OR, USA, 2001. [Google Scholar]
- Pearce, P.H. Regulation of Fishing Effort: With Special Reference to Mediterranean Trawl Fisheries; FAO Fisheries Technical Paper No. 197; FAO: Rome, Italy, 1980. [Google Scholar]
- The State of Italian Marine Fisheries and Aquaculture; Cataudella, S.; Spagnolo, M. (Eds.) Ministero Delle Politiche Agricole, Alimentari e Forestali (MiPAAF): Rome, Italy, 2011. [Google Scholar]
- Pinello, D.; Liontakis, A.; Sintori, A.; Tzouramani, I.; Polymeros, K. Assessing the efficiency of small-scale and bottom trawler vessels in Greece. Sustainability 2016, 8, 681. [Google Scholar] [CrossRef]
- European Union (EU). Facts and Figures on the Common Fisheries Policy: Basic Statistical Data. 2016. Available online: https://ec.europa.eu/fisheries/sites/fisheries/files/docs/body/pcp_en.pdf (accessed on 8 October 2017).
- Vielmini, I.; Perry, A.; Cornax, M.J. Untying the Mediterranean Gordian Knot: A Twenty First Century Challenge for Fisheries Management. Front. Mar. Sci. 2017, 4, 195. [Google Scholar] [CrossRef]
- Sauzade, D.; Rousset, N. Greening the Mediterranean Fisheries: Tentative Assessment of the Economic Leeway; Plan Bleu: Valbonne, France, 2013. [Google Scholar]
- The World Bank; Food and Agriculture Organization (FAO). General Fisheries Commission for the Mediterranean. In Proceedings of the Eighteenth Session of the Scientific Advisory Committee on Fisheries, Nicosia, Cyprus, 21–23 March 2016. [Google Scholar]
- The World Bank; Food and Agriculture Organization (FAO). The State of Mediterranean and Black Sea Fisheries 2016; General Fisheries Commission for the Mediterranean: Rome, Italy, 2016. [Google Scholar]
- Scientific, Technical and Economic Committee for Fisheries (STECF). Reports of the Scientific, Technical and Economic Committee for Fisheries—Mediterranean Assessments Part 2 (STECF-16-08); EUR 27758 EN, JRC101548; Publications Office of the European Union: Luxembourg, 2016. [Google Scholar]
- General Fisheries Commission for the Mediterranean (GFCM). Report of the Ninth Session of the Scientific Advisory Committee: Rome, 24–27 October 2006; FAO Fisheries Report No. 814; FAO: Rome, Italy, 2006. [Google Scholar]
- General Fisheries Commission for the Mediterranean (GFCM). Recommendation GFCM/39/2015/2. Management Decision. 2015. Available online: http://gfcmsitestorage.blob.core.windows.net/documents/Decisions/GFCM-Decision--REC.CM_GFCM_39_2015_2-en.pdf (accessed on 2 August 2017).
- European Union (EU) Data Collection Framework (DCF). Commission Decision 2010/93/EU Adopting a Multiannual Community Programme for the Collection, Management and Use of Data in the Fisheries Sector for the Period 2011–2013. Available online: https://datacollection.jrc.ec.europa.eu/c/document_library/get_file?uuid=296dffd3-9c81-4759-b691-9b1654ea66b9&groupId=10213 (accessed on 2 August 2017).
- Pinello, D.; Gee, J.; Dimech, M. Handbook for Fisheries Socio-Economic Sample Survey—Principles and Practice; FAO Fisheries and Aquaculture Technical Paper No. 613; FAO: Rome, Italy, 2017. [Google Scholar]
- Bonzon, A. Development of economic and social indicators for the management of Mediterranean fisheries. Mar. Freshw. Res. 2000, 51, 493–500. [Google Scholar] [CrossRef]
- Franquesa, R.; Malouli, I.M.; Alarcon, J.A. Feasibility Assessment for a Database on Socio-Economic Indicators for Mediterranean Fisheries; Studies and Reviews No. 71; General Fisheries Commission for the Mediterranean, FAO: Rome, Italy, 2001. [Google Scholar]
- Accadia, P.; Spagnolo, M. Socio-economic indicators for the Adriatic Sea demersal fisheries. In Proceedings of the Thirteenth Biennial Conference of the International Institute of Fisheries Economics and Trade, Portsmouth, UK, 11–14 July 2006. [Google Scholar]
- Scientific, Technical and Economic Committee for Fisheries (STECF). European Maritime and Fisheries Fund—Context Socio-Economic Indicators; Final Reports, Indicator Descriptions; Publications Office of the European Union: Luxembourg, 2013; Available online: https://stecf.jrc.ec.europa.eu/dd/emff (accessed on 2 August 2017).
- IREPA; IFREMER; FOI; SEAFISH; LEI BV; FRAMIAN BV. Evaluation of the Capital Value, Investments and Capital Costs in the Fisheries Sector; Study No. FISH/2005/03; IREPA: Salerno, Italy, 2006. [Google Scholar]
- European Commission. Calculation of Labour Including FTE (Full-Time Equivalent) in Fisheries; Final Report FISH/2005/14; Directorate General for Fisheries and Maritime Affairs of the European Commission: Brussels, Belgium, 2005. [Google Scholar]
- Organisation for Economic Cooperation and Development (OECD). OECD Compendium of Productivity Indicators; OECD Publishing: Paris, France, 2016; Available online: http://dx.doi.org/10.1787/pdtvy-2016-en (accessed on 2 August 2017).
- Organisation for Economic Cooperation and Development (OECD). Gross Domestic Product (GDP) (Indicator) 2017. Available online: https://data.oecd.org/gdp/gross-domestic-product-gdp.htm (accessed on 2 August 2017).
- Panayotou, T. Management Concepts for Small-Scale Fisheries: Economic and Social Aspects; FAO Fisheries Technical Paper No. 228; FAO: Rome, Italy, 1982; Available online: http://www.fao.org/docrep/003/X6844E/X6844E00.HTM#toc (accessed on 2 August 2017).
- Fagerberg, J. A technology gap approach to why growth rates differ. Res. Policy 1987, 16, 87–99. [Google Scholar] [CrossRef]
- Salz, P.; Buisman, E.; Smit, J.; de Vos, B. Employment in the Fisheries Sector: Current Situation; Final Report; FISH/2004/4 (2006); European Commission: Brussels, Belgium, 2006. [Google Scholar]
- Frick, K. Statutory Minimum Wages in the EU 2016. EurWork. European Observatory of Working Life. Eurofound. Available online: https://www.eurofound.europa.eu/observatories/eurwork/articles/working-conditions-industrial-relations/statutory-minimum-wages-in-the-eu-2016 (accessed on 5 February 2017).
- Roussel, F.; Serazin, T.; Henichart, L.; Ropars-Collet, C.; Lesueur, M. Diversification des Activités de Pêche en Manche: Etat des Lieux et Conditions de Développement; Rapport D’étude; Programme Interreg Manche—CHARM 3; Les Publications du Pôle Halieutique AGROCAMPUS OUEST n°3: Rennes, France, 2011; 60p, Available online: http://halieutique.agrocampus-ouest.fr/pdf/520.pdf (accessed on 9 October 2017).
- European Commission. Study on the Employment of Non-Local Labour in the Fisheries Sector; Final Report EASME/EMFF/2015/1.3.2.2; Directorate General for Fisheries and Maritime Affairs of the European Commission: Brussels, Belgium, 2016. [Google Scholar]
- Holm, P. The dynamics of institutionalization: Transformation processes in Norwegian fisheries. Adm. Sci. Q. 2010, 40, 398–422. [Google Scholar] [CrossRef]
- Mankiw, N.G. Principles of Economics, 5th ed.; South-Western Cengage Learning: Mason, OH, USA, 2008. [Google Scholar]
Figure 1.
The study area included Italy, Greece, Lebanon and the Mediterranean coast of Egypt. Map courtesy of www.mapchart.net.
Figure 1.
The study area included Italy, Greece, Lebanon and the Mediterranean coast of Egypt. Map courtesy of www.mapchart.net.
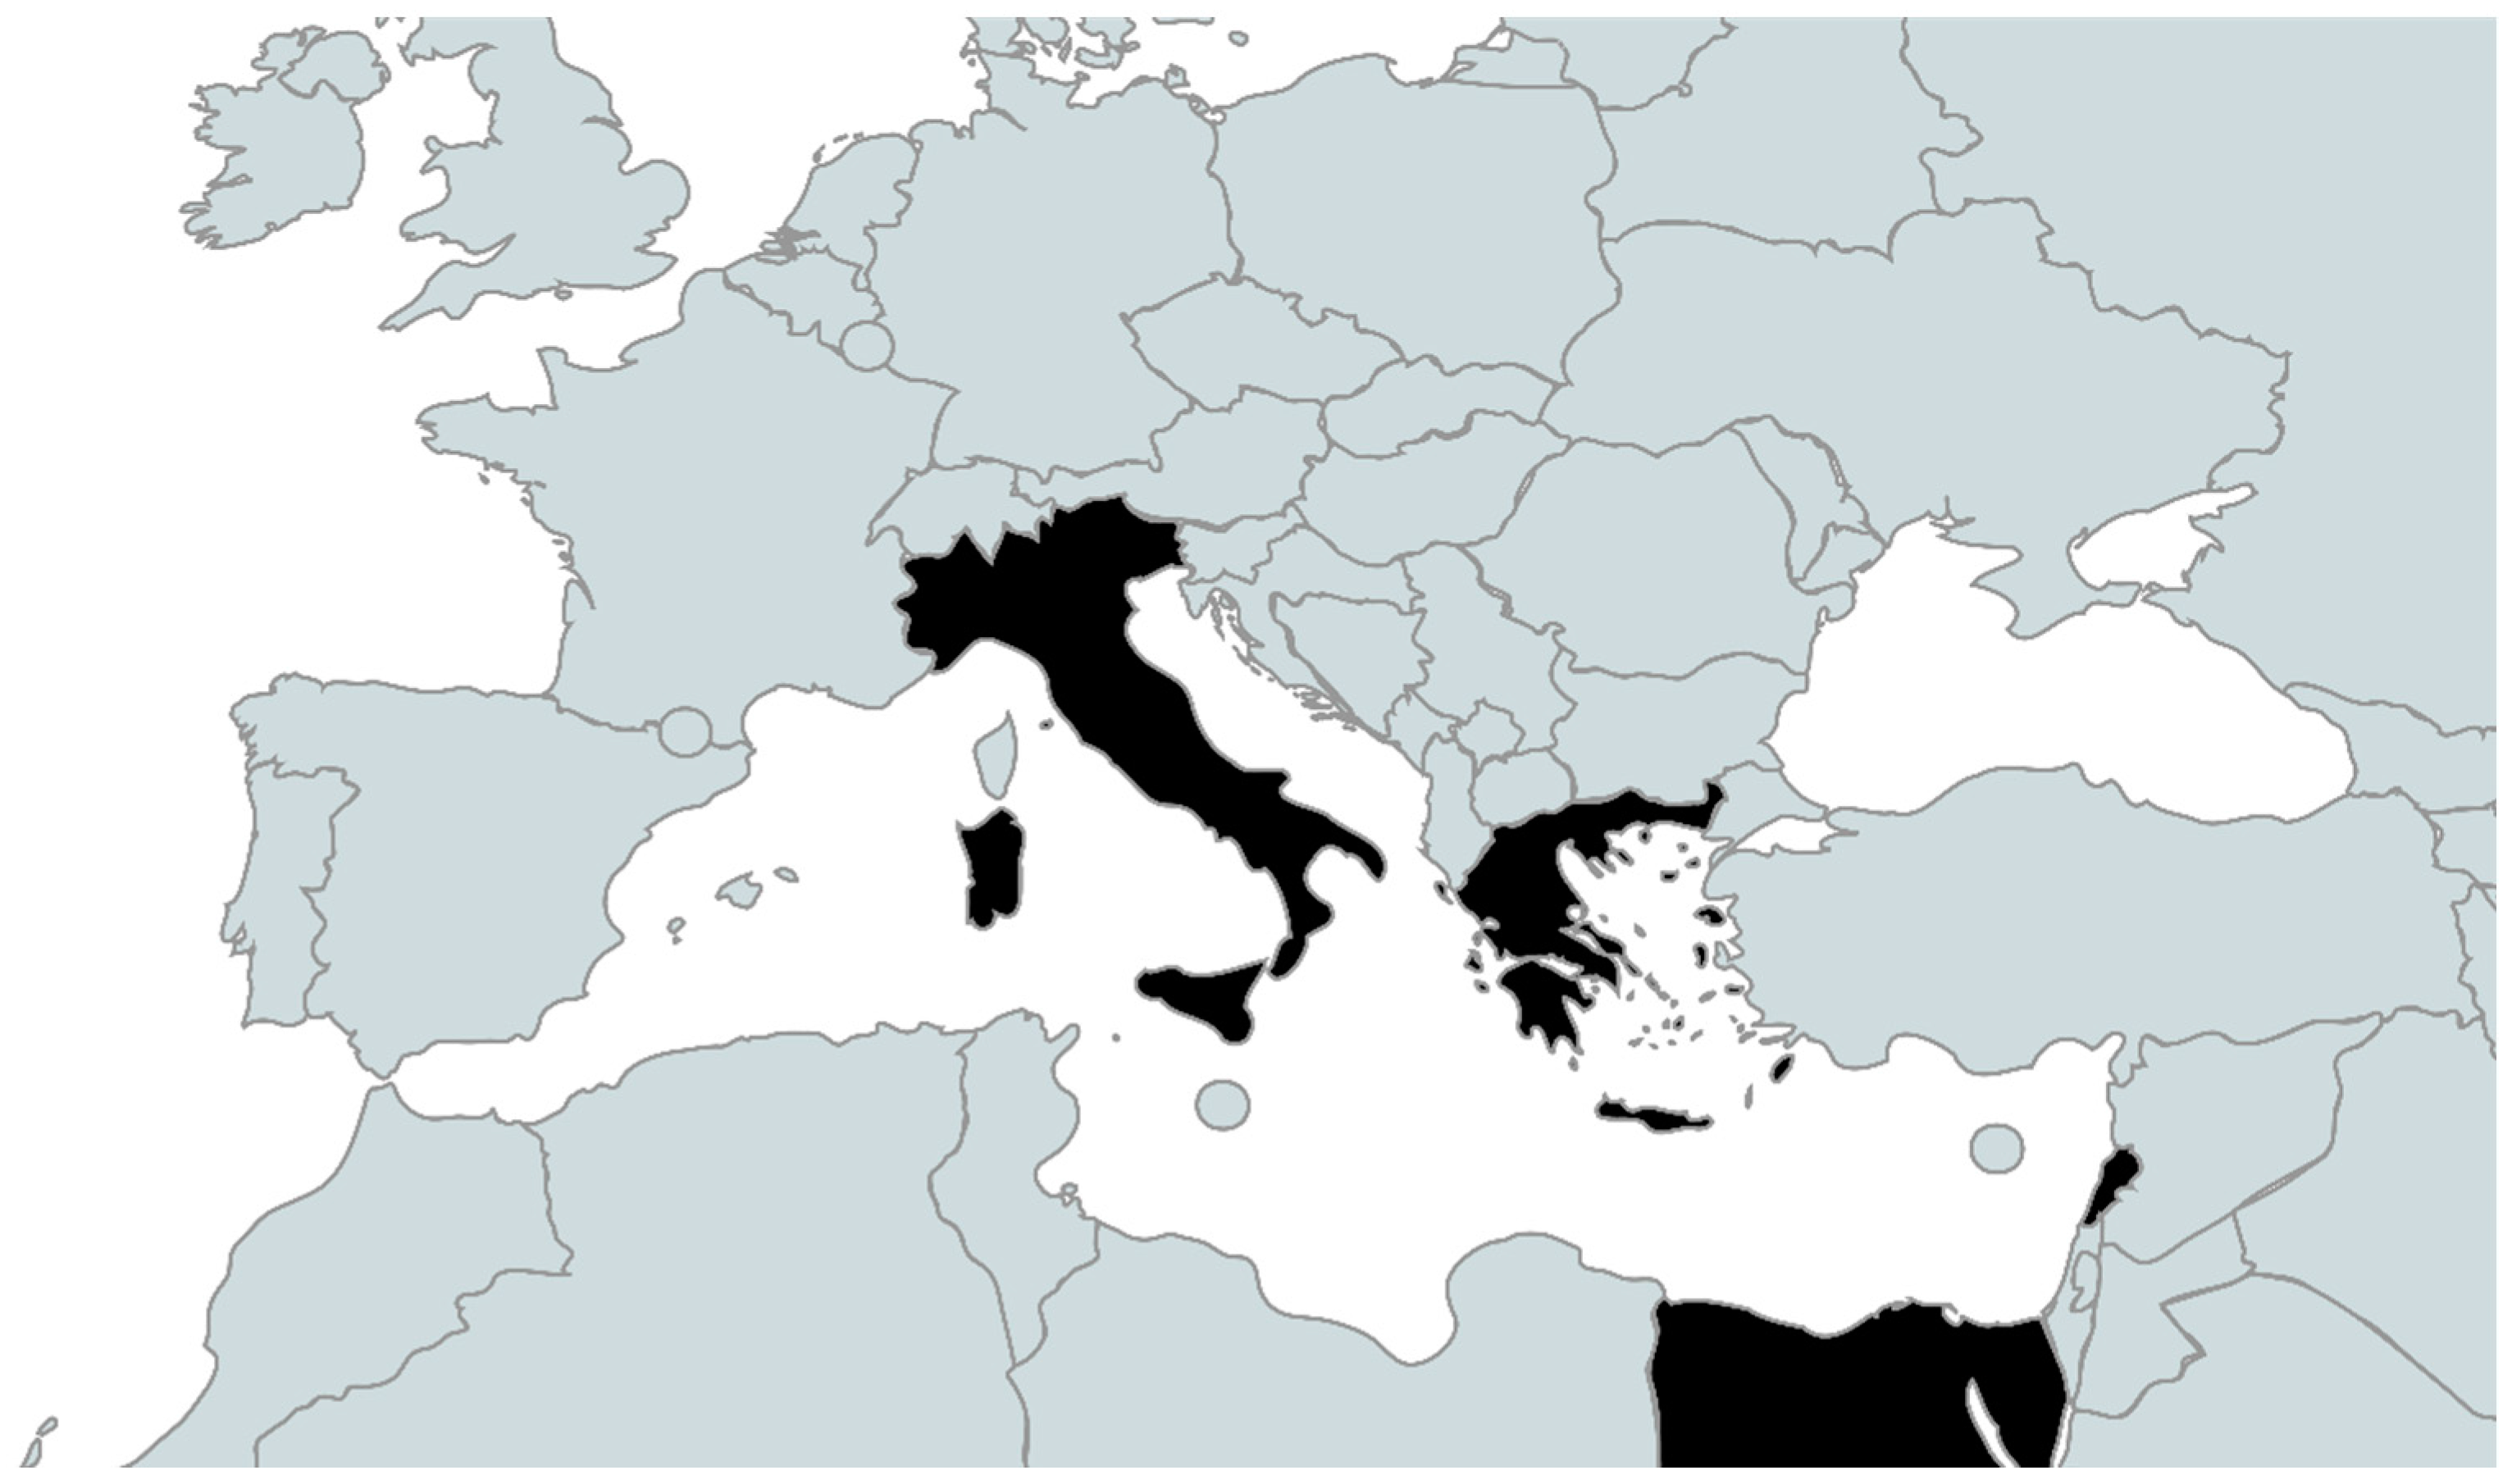
Figure 2.
Relative proportion of fleet segments for each country in 2012.

Figure 3.
Comparison made using indicators from 2012 data for the trawl fleets, presented as index numbers where the average for the group of countries was set at 100. For the trawl fleets in Egypt and Italy the following indicators were compared: (a) Labor productivity and REM; (b) Labor productivity and FTE; (c) Labor productivity and GVA per vessel (PPP); (d) Labor productivity and GDP per capita (PPP); (e) FTE and GDP per capita (PPP).


Table 1.
Fishery management/policies in and member parties in the study countries. In addition to participation in the listed management schemes or policies each country has its own national fisheries policies in place.
Table 1.
Fishery management/policies in and member parties in the study countries. In addition to participation in the listed management schemes or policies each country has its own national fisheries policies in place.
| Management/Policy | Egypt | Lebanon | Greece | Italy |
|---|---|---|---|---|
| EU-CFP | x | x | ||
| GFCM | x | x | x | x |
| ICAAT | x | x | x |
Table 2.
Macroeconomic indicators (2012).
| Macroeconomic Indicators | Egypt | Lebanon | Greece | Italy |
|---|---|---|---|---|
| Population (million) | 85.7 | 4.4 | 11.1 | 59.5 |
| GDP per capita (USD) | 3068 | 9729 | 22,147 | 34,845 |
| Minimum wage manufacturing sector, (current USD) | 1356 | 5192 | 8066 | 21,450 |
| Income level | Lower middle income | Upper middle income | High income: OECD | High income: OECD |
| Unemployment, total (% of total labor force) | 12.7 | 6.2 | 24.2 | 10.7 |
Source: The World Bank 2016 [21]. The ranges set for the 2012 definitions of income level (based on an estimate of gross national income per capita) were: lower middle income: $1036–$4085 USD; upper middle income: $4086–$12,615 USD; high income: $12,616 USD or more.
Table 3.
Fisheries landings from the study countries for 2012 [2].
Table 3.
Fisheries landings from the study countries for 2012 [2].
| Total Fleet | Egypt | Lebanon | Greece | Italy | Total |
|---|---|---|---|---|---|
| Value of landings ($1000) | 164,118 | 39,571 | 547,584 | 1,189,729 | 1,941,002 |
| Volume of landings (t) | 69,333 | 3566 | 93,500 | 196,783 | 363,182 |
Table 4.
Exchange rates and adjustments to the cost of living (2012).
| Countries | Official Exchange Rate (LCU per USD) | PPP Conversion Factor (LCU per USD) |
|---|---|---|
| Italy | 0.78 | 0.76 |
| Greece | 0.78 | 0.69 |
| Lebanon | 1507.50 | 869.35 |
| Egypt | 6.06 | 1.79 |
Table 5.
Indicator acronyms, units and definitions.
| Indicator | Abbreviation | Units | Definition |
|---|---|---|---|
| Employment | FTE | Employment in full-time equivalent (FTE) | |
| Remuneration per fisher | - | USD/FTE | Remuneration values including unpaid labor |
| Remuneration per fisher/minimum wage | REM | - | Average remuneration per fisher compared to sectoral minimum wage for the country |
| Gross Value Added | GVA | USD | The net output of fisheries after deducting intermediate inputs from all outputs. GVA shows the portion of revenues directed to remuneration, profit, opportunity cost and depreciation |
| Labor productivity | LP | - | Measure of productivity for fisheries calculated as ratio of the GVA (output) per FTE |
| Minimum wage (PPP) | - | USD | Minimum wage of national manufacturing sector |
| Gross domestic product per capita (PPP) | GDP | USD | Expenditure on final goods and services minus imports: final consumption expenditures, gross capital formation and exports less imports |
Table 6.
2012 Minimum wage for the manufacturing sector and GPD per capita.
| Countries | Minimum Wage 2012 PPP (USD) 1 | GDP per Capita, PPP (USD) 1 |
|---|---|---|
| Italy | 21,967 | 35,525 |
| Greece | 9099 | 25,462 |
| Lebanon | 9003 | 16,871 |
| Egypt | 4591 | 10,248 |
Table 7.
Data extracted from the regional report A sub-regional analysis of the socioeconomic situation of the Eastern Mediterranean Fisheries [2] showing national totals and trawl-segment totals for Italy and Egypt.
Table 7.
Data extracted from the regional report A sub-regional analysis of the socioeconomic situation of the Eastern Mediterranean Fisheries [2] showing national totals and trawl-segment totals for Italy and Egypt.
| Total Fleet | ||||||
| Countries | Days at Sea (DAS)/Vessel | Total Employment on Board (FTE) | Employment per Vessel (FTE) | REM | LP (USD PPP) | GVA/Vessel (PPP) |
| Italy | 137 | 20,716 | 1.8 | 0.66 | 29,811 | 54,493 |
| Greece | 175 | 23,944 | 1.5 | 1.09 | 11,272 | 16,803 |
| Lebanon | 193 | 3704 | 1.7 | 0.82 | 10,730 | 18,590 |
| Egypt | 179 | 29,031 | 10.3 | 1.34 | 12,387 | 127,153 |
| Trawlers | ||||||
| Days at Sea (DAS)/Vessel | Total Employment on Board (FTE) | Employment per Vessel (FTE) | REM | LP (PPP) | GVA/Vessel (PPP) | |
| Italy | 156 | 7370 | 3.3 | 0.78 | 34,934 | 114,852 |
| Egypt | 194 | 14,752 | 14.7 | 1.47 | 13,277 | 194,537 |
Table 8.
Data for the total fleet presented as index numbers where the average for the group of countries was set at 100.
Table 8.
Data for the total fleet presented as index numbers where the average for the group of countries was set at 100.
| Countries | Labor-Related Indicators | Performance Indicator | Macroeconomic Indicators | |||
|---|---|---|---|---|---|---|
| LP | REM | Employment per Vessel (FTE) | GVA per Vessel (PPP) | Minimum Wage (PPP) | GDP per Capita (PPP) | |
| Italy | 186 | 68 | 47 | 100 | 197 | 161 |
| Greece | 70 | 112 | 39 | 31 | 81 | 116 |
| Lebanon | 67 | 84 | 44 | 34 | 81 | 77 |
| Egypt | 77 | 137 | 269 | 234 | 41 | 47 |
Table 9.
Spearman correlation of labor productivity and national GDP and remuneration across all of the fleet segments of the four countries (0.05 level of significance).
Table 9.
Spearman correlation of labor productivity and national GDP and remuneration across all of the fleet segments of the four countries (0.05 level of significance).
| GVA | FTE | GDP per Capita | REM | |
|---|---|---|---|---|
| LP | 0.07 | −0.24 | 0.79 | −0.65 |
| FTE | −0.71 |
© 2017 by the authors. Licensee MDPI, Basel, Switzerland. This article is an open access article distributed under the terms and conditions of the Creative Commons Attribution (CC BY) license (http://creativecommons.org/licenses/by/4.0/).
Share and Cite
MDPI and ACS Style
Gee, J.; Pinello, D.; Polymeros, K. Drivers of Labor-Related Indicators across Diverse Mediterranean Fisheries. Sustainability 2017, 9, 2000. https://doi.org/10.3390/su9112000
AMA Style
Gee J, Pinello D, Polymeros K. Drivers of Labor-Related Indicators across Diverse Mediterranean Fisheries. Sustainability. 2017; 9(11):2000. https://doi.org/10.3390/su9112000
Chicago/Turabian StyleGee, Jennifer, Dario Pinello, and Konstantinos Polymeros. 2017. "Drivers of Labor-Related Indicators across Diverse Mediterranean Fisheries" Sustainability 9, no. 11: 2000. https://doi.org/10.3390/su9112000
Note that from the first issue of 2016, this journal uses article numbers instead of page numbers. See further details here.