Customer Purchasing Behavior Analysis as Alternatives for Supporting In-Store Green Marketing Decision-Making


1
Department of Industrial & Systems Engineering, Dongguk University, Seoul 100-715, Korea
2
u-SCM Research Center, Nano Information Technology Academy, Dongguk University, Seoul 100-715, Korea
*
Author to whom correspondence should be addressed.
Sustainability 2017, 9(11), 2008; https://doi.org/10.3390/su9112008
Submission received: 1 October 2017
/
Revised: 29 October 2017
/
Accepted: 30 October 2017
/
Published: 2 November 2017
(This article belongs to the Special Issue Advances in Multiple Criteria Decision Making for Sustainability: Modeling and Applications)
Abstract
:Due to increasing concerns about environmental protection, the environmental sustainability of businesses has been widely considered in the manufacturing and supply chain context. Further, its adoption has been implemented in the retail industry for marketing field, including green product promotion. This study aimed to propose a customer purchasing behavior analysis as an alternative for supporting decision-making in order to promote green products in retail stores. Hence, right-on-target marketing strategies can be implemented appropriately. The study was carried out using shopping path data collected by radio frequency identification (RFID) from a large retail store in Seoul, South Korea. In addition, the store layout and its traffic were also analyzed. This method is expected to help experts providing appropriate decision alternatives. In addition, it can help retailers in order to increase product sales and achieve high levels of customer satisfaction.
1. Introduction
Over the last few decades, consumer consumption of goods and services has increased dramatically across the world. This has led to diminished natural resources and severe harm to the environment, such as global warming, expanded environmental pollution and declines in flora and fauna [1]. In recent years, various actions aimed at protecting the environment have been undertaken by companies, consumers, institutions and society [2]. Governments in various countries across the world are beginning to show concern toward these threats to their business activities. This concern has led to the notion of “sustainable development”, which emphasizes the need to promote sustainability and minimize the harmful impacts on the environment and society [3]. Sustainability has been widely considered one of the most important drivers of innovation and growth for various companies [4], because a socially responsible company is concerned not only with maximizing its profit but also with the social and environmental interests of society [5]. Further, sustainable development encourages “eco innovation” and “green consumers”. Eco innovation focuses on the concern for environmental sustainability practices during every process involved in the creation of goods and services [6,7]. On the other hand, green consumers are usually associated with environmentally responsible consumption that considers the environmental impact of purchasing, using and disposing of various products [8,9]. In addition to consumers, customers are also associated with sustainability practices. The terms consumer and customer are not synonymous. A consumer is a user of a product or a service, whereas customer is a purchaser of a product or a service [10].
Since the irresponsible purchasing of goods can aggravate the damage being done to the environment, environmentally responsible purchasing has become very important. Grunert and Juhl [11] reported that 40% of environmental damage is caused by customer household purchasing. Moreover, Joshi and Rahman [3] noted that customers have the capability to prevent or decrease environmental damage by purchasing green products. Therefore, promoting green products to customers is becoming highly necessary, especially in retail stores. Promotion is a powerful marketing communication tool that enables marketers to encourage customers to purchase certain products. Making decision in promoting particular products to particular customers is a challenging task. In order to support this decision-making process, appropriate alternatives need to be provided. In addition, to help decision-makers deciding which customer will be the potential target for the promotion, an analysis of customer purchasing behavior, was performed. This analysis helps to discover customers’ implicit purchasing desires.
Promoting products in store (in-store promotion) offers greater opportunities than newspaper advertising [12]. In-store promotion is normally effective for encouraging customers to make impulsive (unplanned) purchases [13]. Tendai and Crispen [13] also noted that marketers try to use this power of impulsive buying to influence the in-store decisions of their potential customers by creating convenient environments through enjoyable and attractive in-store layouts and displays, as this strategy can increase sales and profits. Furthermore, Schultz and Block [14] and Zhou and Wong [15] stated that store displays are one of the important factors influencing promotional effects.
To understand customer purchasing habits, several approaches have been introduced in previous studies. Traditionally, the main research methodologies used to identify customers’ behavioral patterns are based on interviews and questionnaires with customers or experts. However, this process is time consuming and costly. Luckily, recent technologies have made it cheaper and easier to track and record customers’ movements. Previous applications of these technologies include installing in-store cameras [16,17,18] and utilizing radio frequency identification (RFID) technology [19]. RFID is a wireless technology that can automatically identify and track tags attached to objects. By installing RFID technology in various environments—including RFID repeaters installed on sales stands, RFID readers attached to ceilings and RFID tags attached to shopping carts—customers’ actual shopping paths can be accurately tracked. Shopping paths contain important information for retailers, as they describe how customers interact with the environment and make choices. By determining customers’ shopping paths and purchasing habits, information about their hidden purchasing behavior patterns in stores can be elucidated. Accordingly, customer behavior patterns can be utilized as possible alternatives for decision-making in product promotion.
A general conclusion based on previous studies is that knowledge about customer behavior can support decision-making in product marketing. Decision-makers are usually puzzled when choosing a suitable alternative according to specified multiple criteria. Thus, developing a method for helping them to select the most suitable alternative is a vital importance. Thus, this study proposes an approach to provide decision alternatives based on customer purchasing behavior to support decision-making in product promotion in retail stores. By adjusting promotional strategy based on customer purchasing behavior, it will potentially influence and encourage them to purchase particular products, including green products.
The remainder of the paper is structured as follows: The next section (Section 2) gives a brief review of the literature on customers’ purchasing behaviors and the way in which they can influence customers to purchases product. A description of the methodology and approach of the study follows (Section 3). Section 4 presents the results and discussion and finally, conclusions are provided in Section 5.
2. Background Studies
2.1. Literature Review
The concept of “green marketing” refers to an organization’s efforts at designing, pricing, distributing and promoting products that will not damage the environment [20]. In 1995, Peattie described green marketing as “the management process for identifying, anticipating and satisfying the requirements of customers and society in a profitable and sustainable way” [21]. In addition, Hasan and Ali [22] noted that green promotion is one of the crucial factors that must be applied as a green marketing strategy.
Various green marketing strategies have been implemented to meet the demands of environmentally friendly customers. For instance, some companies have designed green products based on market demand, or products that save resources and energy during the manufacturing process [23]. In addition, advertisements that reflect companies’ commitment to environmental protection have also been used [24]. However, some marketers also set higher prices for their green products to balance customers’ sensitivity to cost against their desire to pay more for the product [25]. Other companies have found ways to reduce pollution and save resources during the distribution of products to market [26].Furthermore, most green marketing studies have focused on theories and concepts [27,28,29], green marketing’s relationship with customers [30,31,32], the application of green marketing [33,34] and the evaluation of green marketing strategies [35,36].
In retail businesses, most eco-friendly retailers specifically choose green products designed and produced by environmentally friendly manufacturers. D’Souza, Taghian and Lamb [37] emphasized that eco-friendly retailers promote these products because they are concerned about environmental safety, recyclability/reusability and biodegradable ingredients. Eco-friendly retailers also promote green products due to the social esteem associated with waste recycling, health and fitness, sustainability-related benefits, or supporting local communities [38].
Various strategies can be utilized to encourage customers and companies (retailers) to become more socially responsible. These strategies may also provide a source of competitive advantage for retailers. If retailers engage in an activity that benefits the environment or addresses environmental concerns, customers may reward them through loyalty and increased sales, leading to increased profitability [39]. Hunt and Morgan [40] suggested that a company must be market-oriented in order to stay competitive in the marketplace and attain optimal performance. Thus, managers should implement strategies that result in advantages over competitors by offering innovative products and high service quality [41]. Hence, promoting green products through green marketing based on customers’ market orientation is one of the strategies which retailers can implement to remain competitive.
Studies on green marketing in retail businesses have also been conducted. Ko, Hwang and Kim [42] investigated the relationships between green marketing, corporate image and purchase intentions in the retail setting from a customer perspective. Kumar [43] aimed to determine the extent of green retailing taking place in India. The researcher also investigated various initiatives taken by retailers. He suggested that retailers should consider store designs that provide green products in prominent positions for convenient shopping experiences and attractive displays. By doing so, it may help to reduce environmental damage indirectly as well as increase sales and profitability to keep retailers competitive in the marketplace.
2.2. Green Purchasing
Green purchasing refers to purchasing products that provide positive environmental benefits and avoiding products that harm the environment [44,45,46,47]. Green purchasing is usually measured by green purchase intentions and behaviors. Green purchase intentions refer to customers’ desire to purchase green products. Intentions signify the factors that influence the green purchasing behaviors of customers [48]. On the other hand, green purchase behaviors are a form of decision-making behavior and they are regarded as a type of socially responsible behavior [3]. Thus, green customers consider the public consequences of their consumption and intend to use their purchasing power to create social change [9]. A green product refers to a product that meets customers’ needs without harming the environment and contributes toward attaining a more sustainable world [49].
One of the factors that lead customers to purchase green products is ecological knowledge about the effects of green products on the environment [50]. As customers have become more concerned with the natural environment, they have realized that their consumption and purchasing behaviors have a direct impact on the environment [31]. Another factor that inspires customers to purchase green products is government laws and regulations [50]. Laws and regulations can play an important role in determining peoples’ attitudes toward the usage of environmentally friendly products and customers who have been influenced by them are more likely to buy green products.
Past studies have focused on describing customers’ green purchasing behaviors by observing the underlying values of attitude and behavioral intentions toward environmentally friendly products [51]. In addition, other studies have introduced the theory of reasoned action (TRA) [52], the theory of planned behavior (TPB) [53] and other methods, as theoretical behavioral intention models. Further, a study has used the TPB to explore customers’ attitudes, intentions and actual purchasing behaviors toward green products [54]. However, most of the studies have suggested that there is a weak relationship between customers’ positive attitudes toward green products and their actual purchasing behaviors [3]. Thus, the marketing of green products is necessary.
2.3. Green Marketing
The enormous growth of green products in the market due to customer demand has made green marketing more strategic [55]. Polonsky [56] has defined green marketing as building strategies targeting customers who are concerned about the environment. The principles of green marketing transform the attitudes and values of companies to meet customers´ requirements and tend to be environmentally friendly [57]. Green marketing can even be a panacea for struggling companies [58]. According to Hasan and Ali [22], green marketing strategy, including green innovation and green promotion, is a significant factor that affects to firms’ profitability and customers’ green consumption.
Green innovation is the creation of technologies that are involved in waste recycling, green product design and energy saving [30,38,59]. Green innovation involves applying the concept of environmental protection to the design of products [22]. Green promotion refers to communication that promotes products or services that will not damage the environment [22]. Green promotion can help companies establish socially responsible corporate images [22]. In addition, successful green innovation and green promotion improves company performance. According to marketing theory, promotions with the right product pricing are one of the elements that successfully influence more than 40% of customer purchase decisions [60]. Thus, many promotion methods have been utilized in previous studies, such as promotions using discounted prices [61,62] and coupons [63], as those marketing strategies influence customers’ purchasing decisions [13]. Other marketing strategies that can be used include television commercials, billboards, booklets, banners, window advertisements, posters and leaflets [64,65]. The promotion of products has always been a significant factor in business. Ailawadi, Beauchamp, Donthu and Shankar [66] suggested that “promotions not only increase sales of the promoted products but also attract more customers into the store because, once customers are in the store, they are likely to also purchase products other than those on promotion”. They also noted that according to the Promotion Marketing Association, the USA spent $429 billion (about 3.65% of GDP) on the promotion of overall product categories in 2004 due to the importance of promotions.
In addition, green promotion is an important factor in green marketing and analyses. Chabowski, Mena and Gonzalez-Padron [67] and Nyilasy, Gangadharbatla and Paladino [68] suggested that ethical green marketing can help companies to improve business performance. Hence, this implies that the involvement of green marketing is crucial and inevitable. To promote green products in retail stores, green promotions should be well implemented within the store due to the importance of in-store marketing [69]. Displaying and positioning environmentally friendly products in front of customers within stores are called as green products marketing [70] and it plays a significant role in influencing green product purchasing.
2.4. Sustainability in Retailing
Sustainability issues in retailing have been considered by academics and practitioners since years ago. Kennedy, Kapitan and Soo [71] have analyzed how the sustainability initiatives affect a retailer's image. They investigated customer perceptions of a sustainable retail brand image to provide guidance for retail strategy. In their research, they found that sustainable attributes in a retail brand can set the standard for customers and raise sustainable consumption. Regarding products, many studies related to environmentally friendly packaging have been conducted. Steenis et al. [72] examined the implicit impact of packaging on customer perceptions of sustainability. Magnier, Schoormans and Mugge [73] have explored the influence of sustainable packaging design on customer perceptions of product quality.
Some studies dealt with sustainable food retailing. Perrini, Castaldo, Misani and Tencati [74] aimed to investigate the determinants of consumer attitudes toward organic products marketed by mainstream retailers under a private label. They surveyed a sample of Italian purchasers of organic yogurt. Jones, Comfort and Hillier [75] observed the relationship between food retailing and marketing to build retail brand awareness within stores. Recently, Chkanikova and Mont [76] aimed to fill this gap by providing a systematic overview of factors that affect the willingness and ability of food retailers to launch sustainable supply chain initiatives, with a particular focus on food supply chains in Sweden.
General and strategic sustainability issues have been also studied, such as investigation on customers’ perspectives on sustainable fashion industry [77,78] and retailer’s sustainability agenda [79]. Jones et al. [79] discussed about agendas that embrace environmental, social and economic issues, such as environmental programs typically involving energy efficiency, water consumption, carbon dioxide emissions, vehicle emissions, reductions in the volume and constituents of packaging and waste management and recycling. Other studies discussed the green roles that retailers play and should have [80] and aimed to determine whether being green also leads to better financial performance [81].
Finally, there are studies that explored the strategy of choice editing as a tool for the promotion of sustainable consumption [82]. Retailers that have a “choice provider” in a middle position as a response to the customers’ demands and passing products from manufacturers, are able to provide and promote a choice of green products. Choice editing gives nudge for customers in desired direction [83], which is related to customers’ behaviors.
2.5. Customers’ Purchasing Behaviors
Identifying customers’ behavioral patterns plays a significant role in helping businesses to achieve high levels of customer satisfaction. In recent years, customer behavior analysis has become an important point of focus among various industries, because it positively affects sales and profitability [84]. Schiffman and Kanuk [85] explained that customer behavior is “the behavior that consumers display in searching for, purchasing, using, evaluating and disposing of products and services that they expect will satisfy their needs”. It is also possible to learn what a specific customer does within a store by observation [10]. Thus, it is necessary for organizations to learn customers’ behavior, including what steers them toward green purchasing [86].
Many factors influence individuals’ decision-making processes, including shopping habits and purchasing behaviors [87]. To understand customers’ purchasing behaviors, retailers collect and analyze their customers’ shopping data in order to monitor and improve sales and operational efficiencies, as well as to evaluate the performance of promotions. In previous studies, various techniques and methodologies to track, record and analyze customer behavior patterns have been proposed for various applications. These include cross marketing in business domains [88,89], mobile environment planning [32,90] and website design and management [91,92].
In retail businesses, understanding customers’ attitudes and purchasing behaviors has been paramount. In previous studies, customers’ purchasing behavior data was mainly gathered from questionnaires and interviews. By using such data, Farley and Ring [93] developed a model for predicting area-to-area transition probabilities of customers’ motion paths in supermarkets. Alexander and Muhlebach [94] have observed customers’ actual response behaviors within a mall for promotion purposes. However, this process is time consuming and costly. Fortunately, recent technologies have made it cheaper and easier to track and record customers’ movements.
Further, a video imaging technology has been well utilized. Newman, Yu and Oulton [18] presented a methodological approach to monitor customers’ in-store behaviors using existing in-store cameras in an outlet of a major discount clothing retailer. Using this in-store camera footage, they were able to detect the number of customers anywhere in the store, at any period in time, as well as their activities. With this information, retailers can strategically rearrange their stores according to customer behaviors.
Lam, Vandenbosch, Hulland and Pearce [17] presented a video imaging technology framework for assessing promotion performance. The researchers observed the customers from when they walked through the storefront until they made a purchase. This study suggested that marketing activities in store should consider at least one of the following: traffic, customers’ purchasing decisions, or amount of sales. Recently, using the video imaging technology, Epstein, Flores, Goodstein and Milberg [16] aimed to present an approach for measuring the effectiveness of retail promotions. The approach measured the predicted effect of response of interest toward marketing activity covariates, including number of visits to a store. In addition, Chandon, Hutchinson, Bradlow and Young [95] utilized an eye-tracking tool to record the duration of each eye fixation and the coordinates of the central two degrees of vision and mapped out the coordinates to the location of each area. The researchers examined the role of in-store shelf facings using eye-tracking equipment.
Uotila and Skogster [96] obtained information on customer traffic by using a wireless local area network (WLAN) for space management, which requires objective information on customer behavior. With the help of spreadsheets, statistical software and geographic information system (GIS), the researchers showed that the WLAN had great potential for processing and modeling the accurate and objective data collection.
Moreover, with the availability of RFID and information technology, customer behavior can be studied more accurately by tracking all customers’ movements that are identified as shopping path data. In a previous study, Larson, Bradlow and Fader [19] utilized the RFID applications for shopping path analysis, through which the researchers aimed to identify the main paths via commercial software by carrying out an exploratory study within a store. The study focused on travel patterns, regardless of customer purchasing behavior. However, Parsons [97] suggested two key performances in a store: visits (customers’ behaviors) and sales (customers’ purchases). In addition, as Hjort, Lantz, Ericsson and Gattorna [98] emphasized, customer behavior is strongly related to customer purchasing behavior.
2.6. Clustering Analysis for Decision-Making
Multiple criteria decision-making (MCDM) methods have been applied to a variety of field, such as supply chain management problems [99] and risk management [100]. Generally, MCDM problems involve several alternatives with respect to different criteria. Sometimes the weights of criteria are completely given while sometimes are not [101]. Different methods have been proposed in regard to different scenarios in order to obtain the final optimal solutions for the multiple criteria decision-making problems. One of the recognized methods is clustering analysis [99].
Clustering is an unsupervised method to partition data into a certain number of clusters (groups) [102]. The problem of clustering has been widely discussed in many contexts and by researchers in many field areas. As an unsupervised machine learning technique, clustering has been commonly discussed in machine learning and data mining communities [103]. It has also been used in some important applications, such as pattern analysis, pattern classification and decision-making [102]. In addition, it is reported that clustering is useful for object recognition, image segmentation and information retrieval [104]. Basically, the idea of clustering is grouping similar objects into the same cluster, while less-similar objects should be in different cluster. Since the objective of clustering is to splita finite unlabeled dataset into a number of subsets so that it is exploratory in nature [105]. Many types of clustering techniques have been discussed by Faber et al. [104].
Clustering analysis is a collection of patterns that are grouped based on similarity. Intuitively, patterns within a cluster are more similar to each other than patterns in different cluster. In order to measure the pattern proximity, a distance or similarity measureis used. A variety of distance measures have been discussed by Anderberg [106].
In previous studies, clustering analysis has been widely used for the MCDM. Yoon et al. [107] used clustering analysis to collect the local alternatives at every cluster at the facility-level in order to identify the local alternatives for mediating large group decision-making. This method has been applied to identify the optimal maintenance, rehabilitation and replacement (MR&R) alternatives. Rezaeiand Ortt [99] have applied clustering analysis for suppliers’ segmentation based on their capabilities and willingness in a broiler company. Röthlisberge et al. [100] have proposed a spatial cluster analysis approach based on the aggregation of point data with respect to different spatial units in order to handle risk reduction problems.
In addition, clustering has been performed as a solution of the common issue of multicollinearity in the Technique for Order Preference by Similarity to Ideal Solution (TOPSIS) method of MCDM [108]. This proposed method has been able to remove multicollinearity by reducing the dimensionality of variables through grouping the pertinent variables into a smaller number of homogeneous clusters. Clustering empirically provides an easier alternative technique for addressing variable selection through an exploratory deciphering of the underlying nature structure within a used dataset.
Furthermore, Wu and Xu [105] have used clustering method to change the decision-makers’ provided preferences by using fuzzy preference relations in order to break down the larger problem into smaller pieces. They have identified the subgroups in which members have similar preferences [105]. Finally, by using clustering analysis, Delaney et al. [109] could identify influences on decision-making processes based on the age and gender differences.
3. Methodology
3.1. Criteria for Decision Alternatives
All customer individuals are potential targets in promoting products. However, if the all customers are selected as decision alternatives, the number of possible alternatives will be overlarge. Therefore, some specific important criteria to select possible alternatives are needed. It can be a very challenging task for decision-makers to determine the important criteria in order to establish appropriate decision alternatives. In this case, the clustering analysis can be used. Since group members within a cluster have similar patterns with regard to specific criteria, a cluster center can be represented as a single alternative.
According to the previous literatures, the information of purchasing behavior is prominent factor for product promotion. Thus, the alternatives are grouped based on their purchasing behavior that consists of two important criteria, they are: customers’ in-store moving patterns, including purchasing amount, favorite products and favorite locations; and customers’ shopping time. To do so, clustering analysis based on customer purchasing history is used.
To give the specific analysis, data of customer’s behavior has to be collected. In this scenario, the data was collected using RFID technology. Once the data has been gathered, the customers can be segmented using clustering algorithm [110], in which specific segmented customer will be easier to be offered with a specific choice for product promotion purpose.
3.2. RFID Systems for Collecting Customers’ Purchasing Patterns
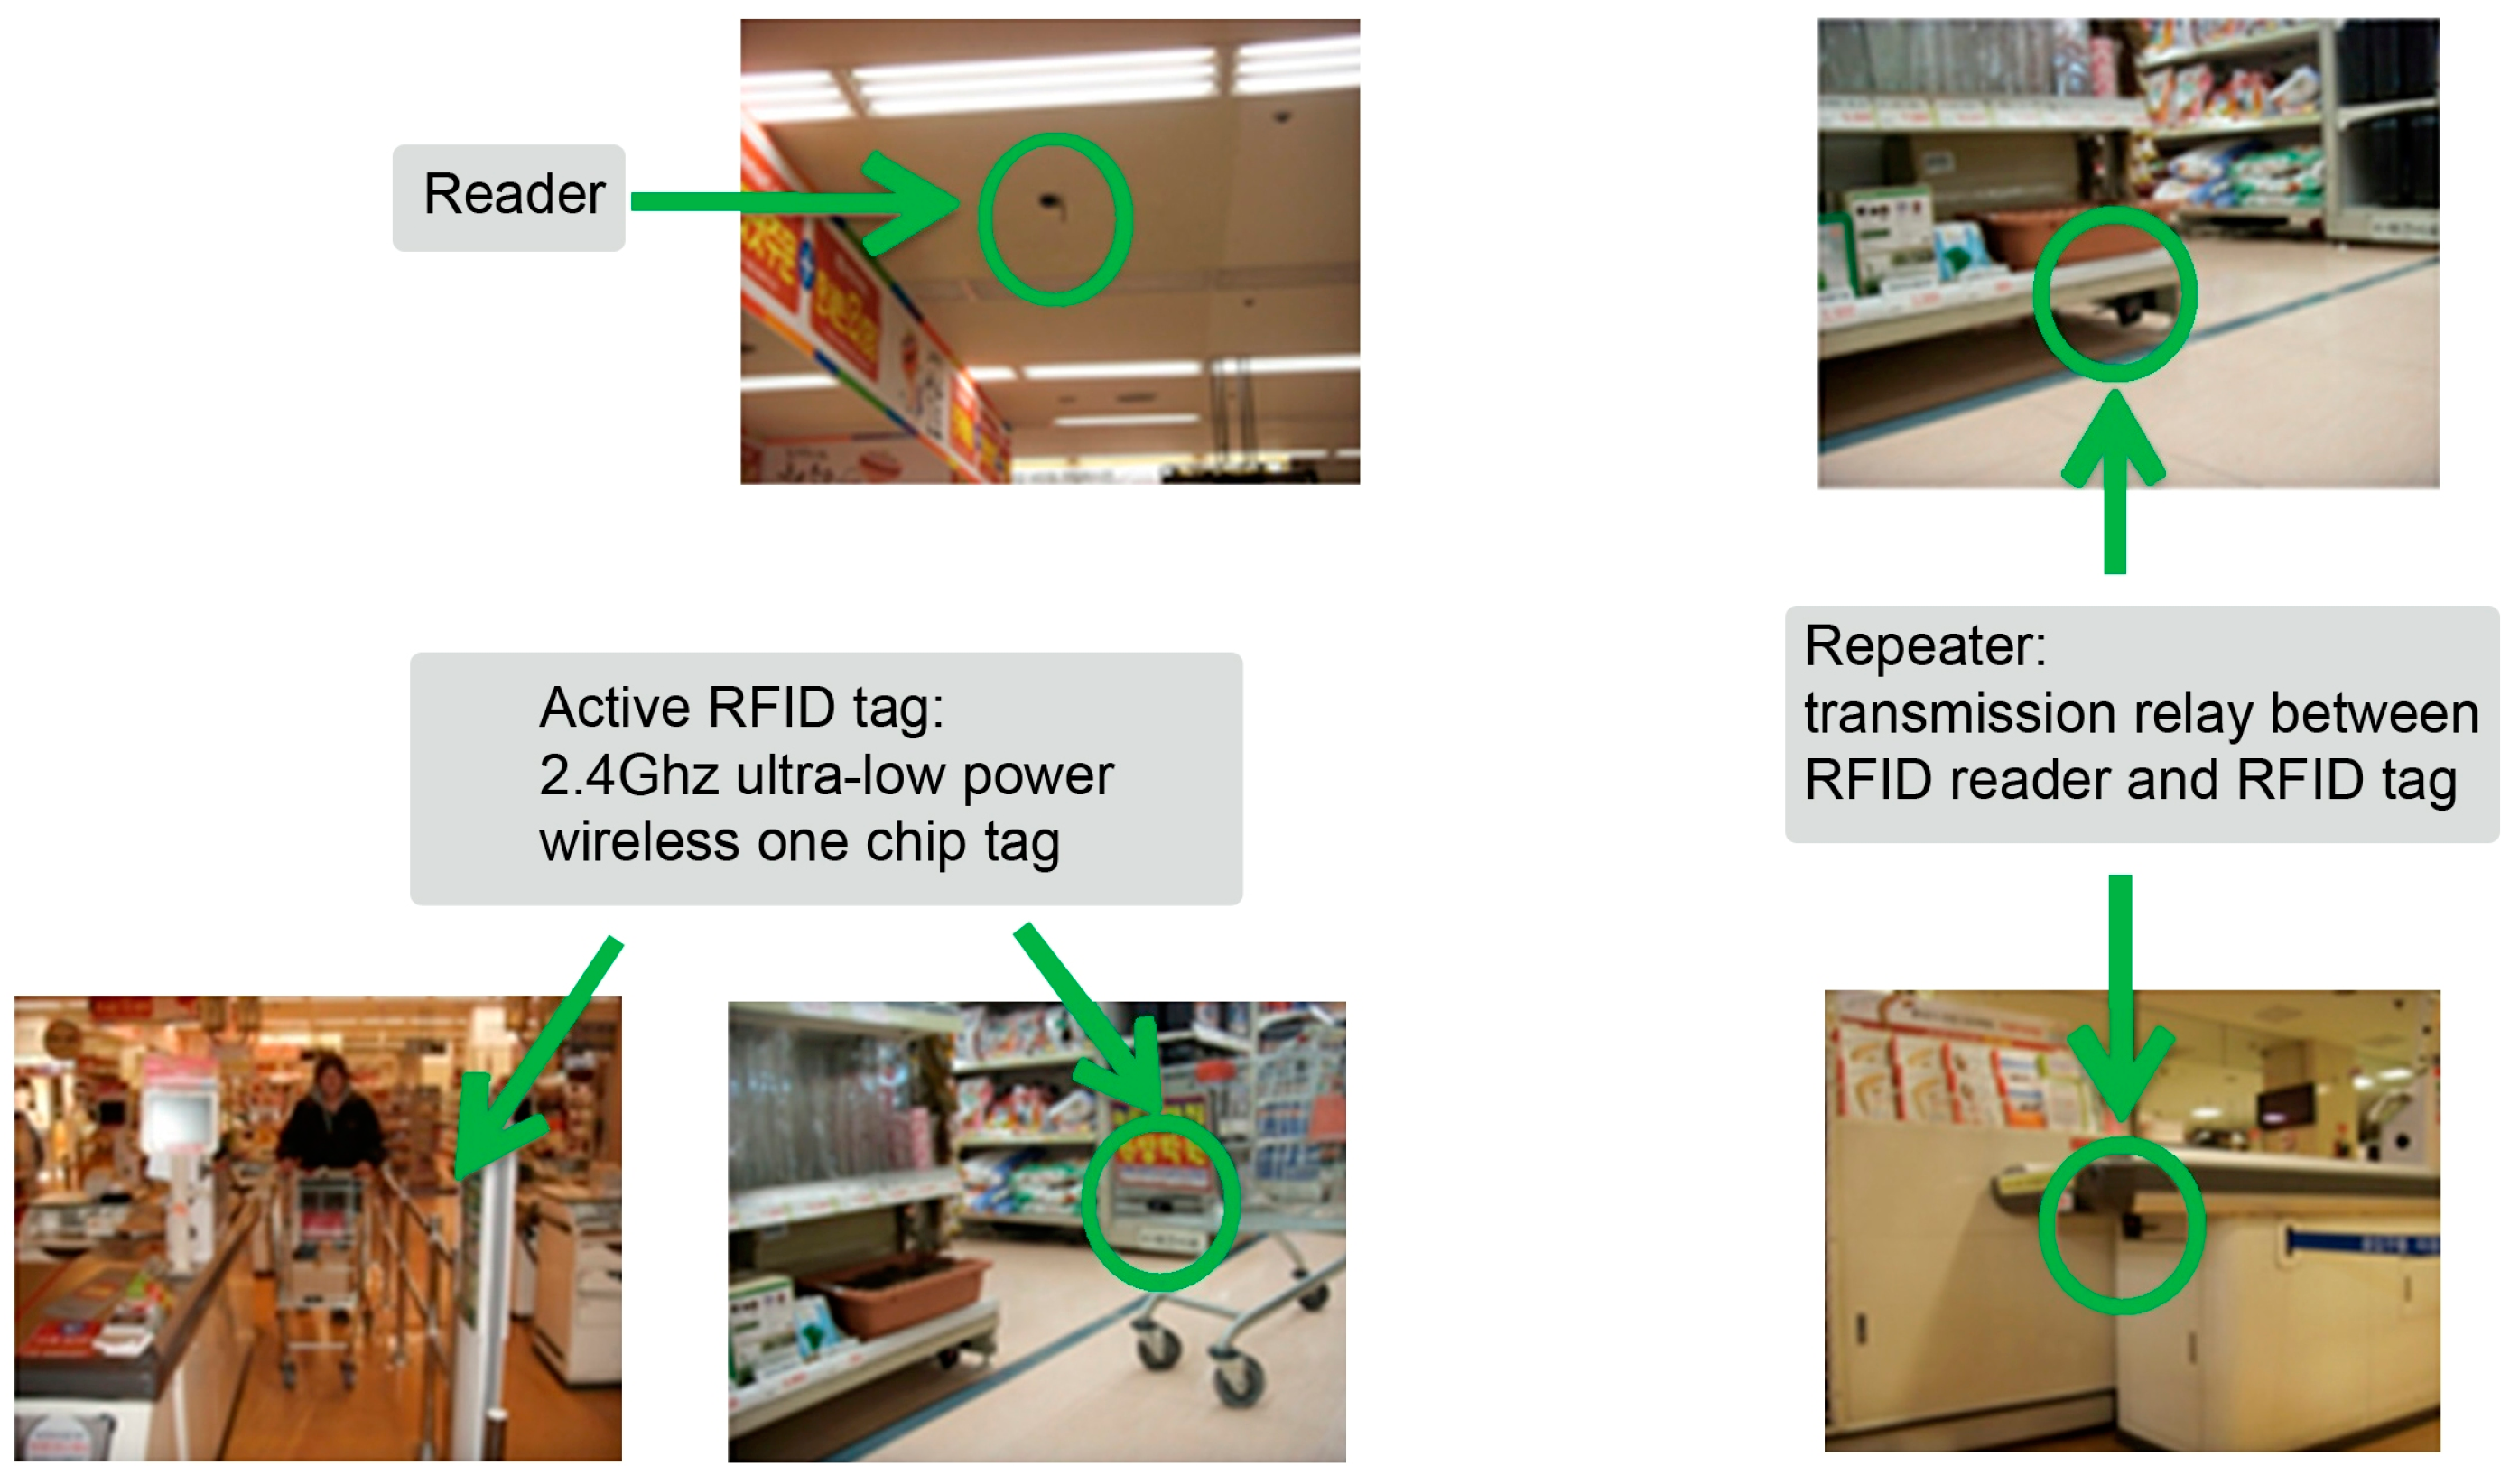
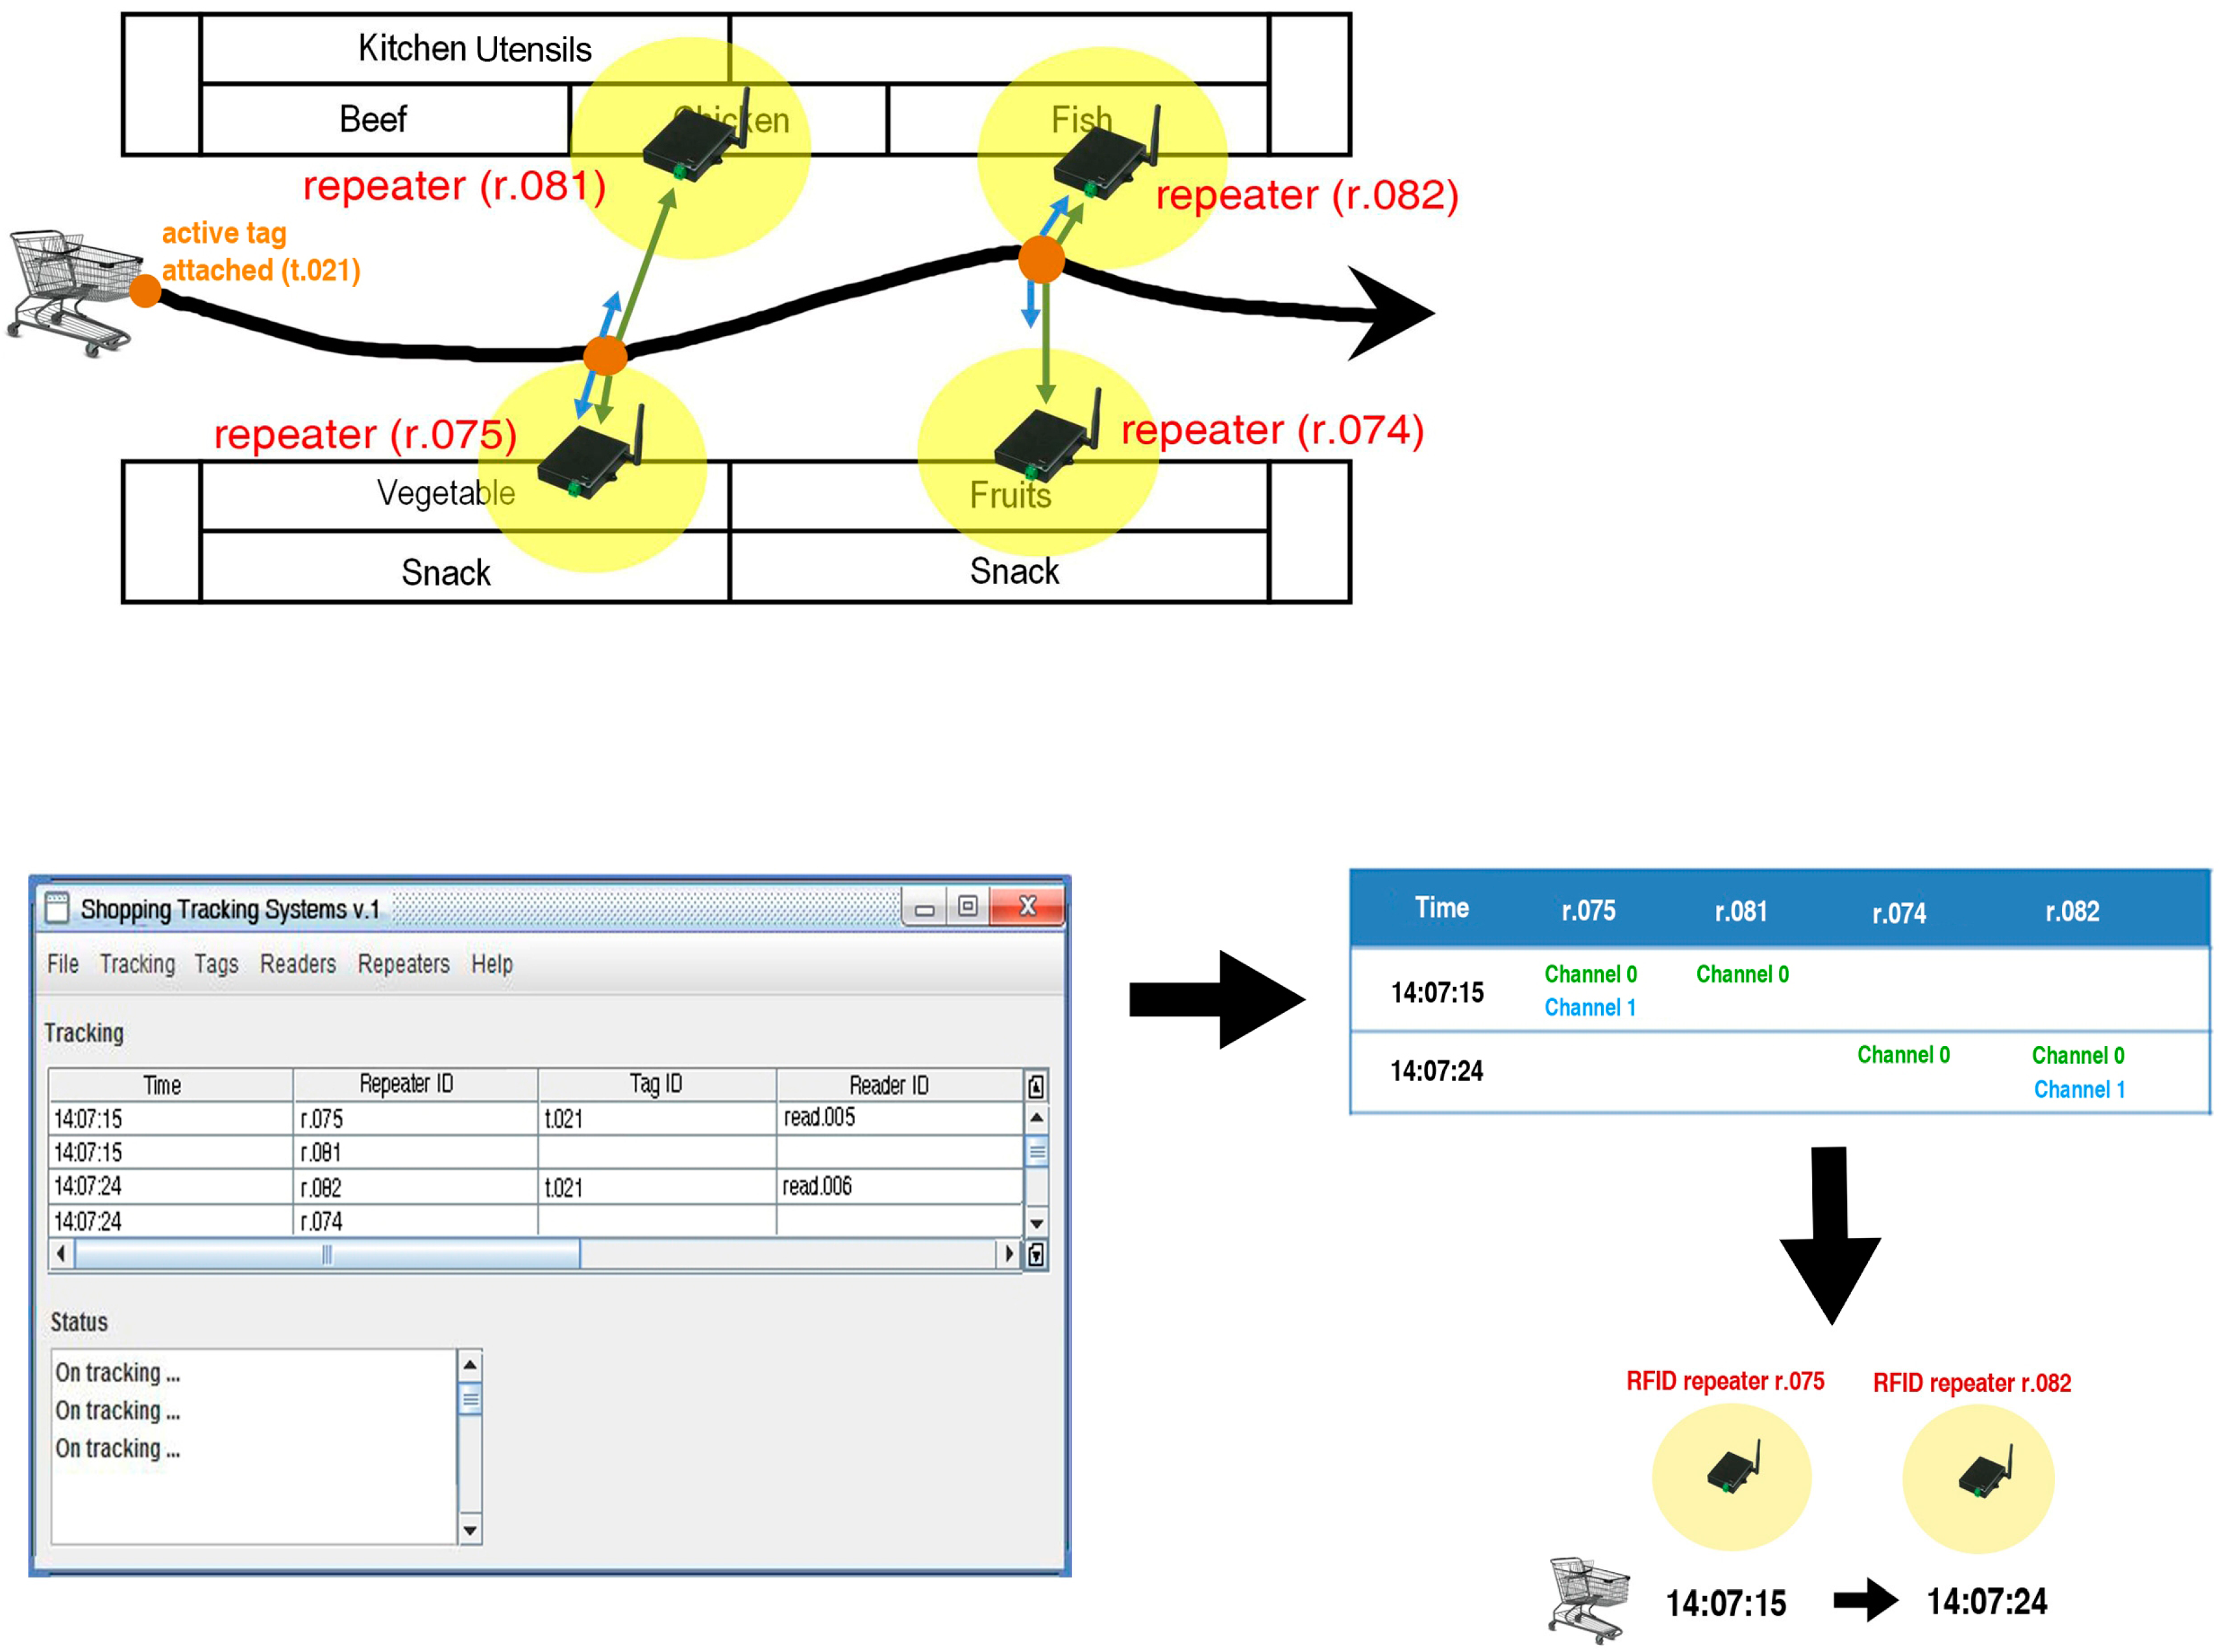
To track customers’ purchasing patterns in a store, an RFID tracking system was developed in one of the largest retail stores in Seoul, South Korea. The system included active RFID tags, RFID repeaters, RFID readers and a server in order to collect customers’ shopping path data. A 2.4-GHz ultra-low-power wireless active tag, attached to the bottom of each shopping cart, was used for tracking the customers’ paths, as illustrated in Figure 1. The tag emitted two channel signals that were received by the repeaters installed on product shelves in the store. The first signal (−18 dbm) had a short distance range, while the second (−13 dbm) had a long-distance range. An RFID repeater was designed to receive those two signals to determine which product shelf was closer to the cart, as illustrated in Figure 2.
If a customer with a cart moved along the aisles, a repeater received signals from the tag attached to the cart. When the repeater identified a signal from the shopping cart, a reader installed at the ceiling detected the location of the shopping. The system detected all sequences of the repeater ID as well as recorded the time customers spent in each location. By using this system, the customers’ purchasing history could be tracked accurately in real time.
3.3. Dataset
The RFID system was installed within the store. The area of the store was 4290 m2 and the number of stock keeping units (SKUs) was approximately 29,000, consisting of 25 product categories with 80 subcategories. Here, 300 shopping carts, 227 repeaters, roughly 30 readers and a processing server were used for one month. Moreover, 2.4-GHz ultra-low-power wireless active RFID tags were attached to the bottoms of the shopping carts in the store. RFID repeaters were installed in the aisles, while RFID readers were attached to the ceilings. From the locations and the approximate range of the repeaters, over 16,000 actual shopping paths, which included more than 721,000 pieces of raw RFID data, were collected. In addition, a three-way split of the paths by total time in the store, which we explain later, was used for this study.
3.4. Grouping Customers’ Shopping Patterns
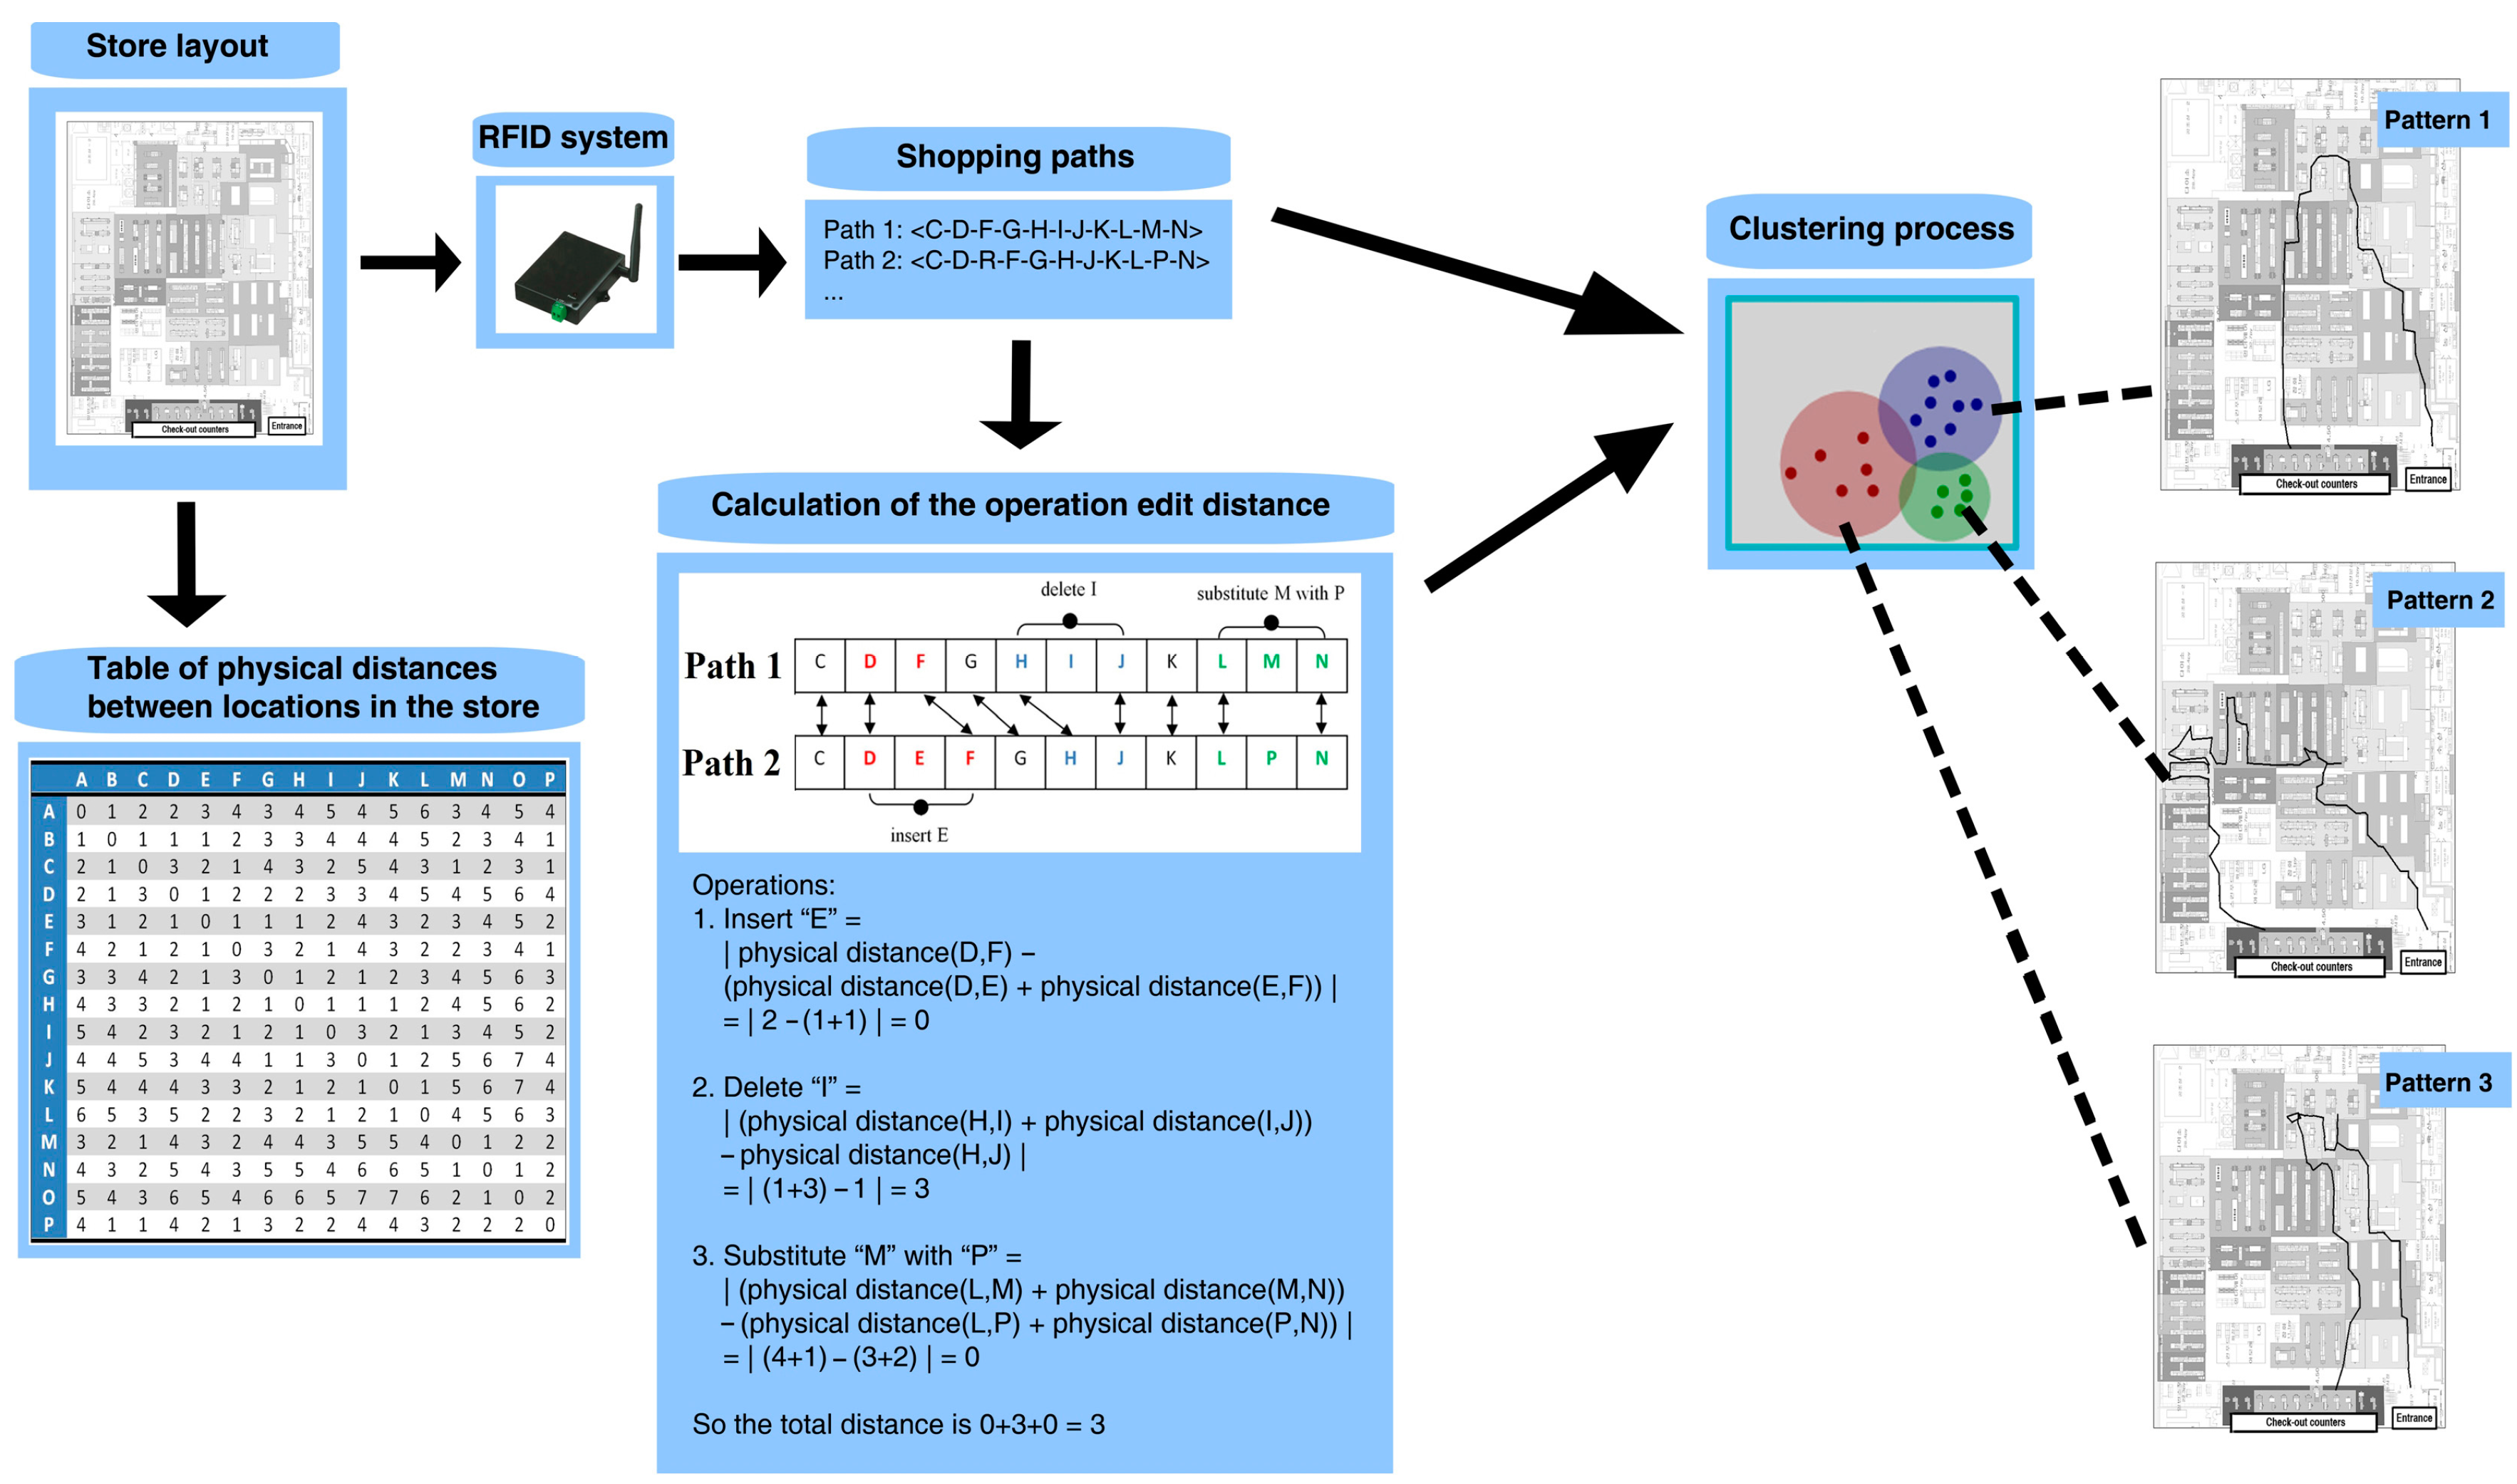
For marketing purposes, customers’ shopping patterns can be utilized for customer segmentation [111] according to their behaviors [112,113]. Customer segmentation refers to the process of grouping customers into specific categories. In this step, to group all customers’ shopping paths, clustering analysis was used. Due to some issues regarding shopping path data explained in a previous study [19], such as a significant loss of original information, a clustering method with “the operation edit distance” developed by Syaekhoni, Lee and Kwon [113] was used. This method, which considers about the real physical distance in the store, was based on string analysis and it was developed primarily to preserve the original information on customers’ in-store shopping behaviors. Using information that corresponds to authentic shopping path data, this analysis can provide more thorough information on customers’ behaviors and it is easy to implement. Moreover, the method produces distinct customer groups and fits well with the real-world environment of customers shopping in a retail store.
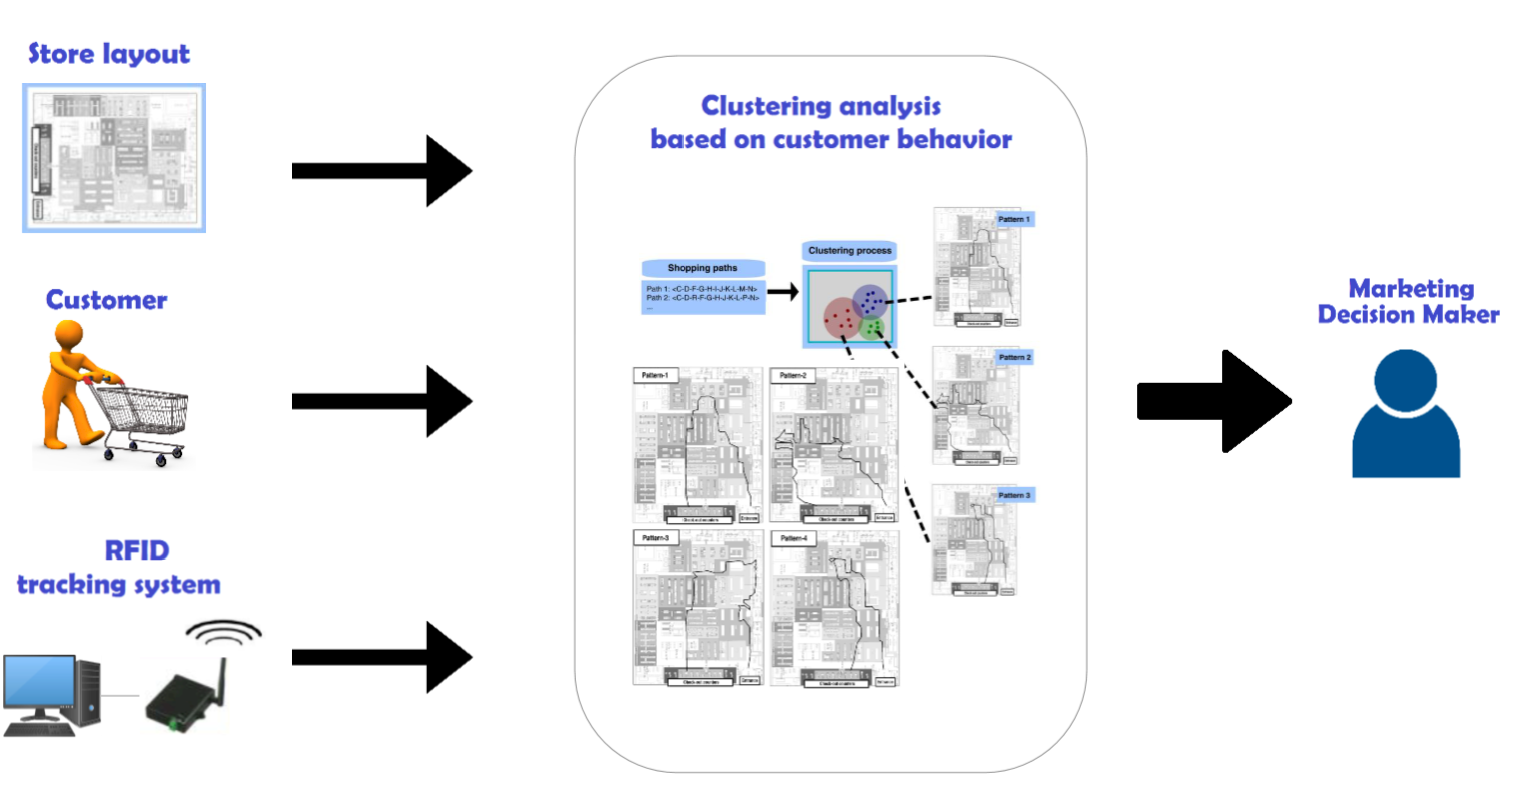
Figure 3 illustrates how the clustering works. Suppose a character represents a location visited in the store. For instance, two shopping paths were visited: “CDFGHIJKLMN” and “CDEFGHJKLPN”. Using physical distance information, which is measured in advance, the operation edit distance calculates the dissimilarity value between these shopping paths. Further, this dissimilarity value is used for clustering in order to group the paths. In the clustering process, the shopping paths that have low dissimilarity values are assigned to the same group. This process continues until all paths are assigned to groups. The objective of the clustering is to find inherent structures and patterns in the paths and organize them into meaningful groups for further analysis.
In the process of grouping, the “silhouette coefficient” [114] for each cluster solution was applied. The silhouette coefficient is a well-known method of clustering performance evaluation, which statistically measures how similar an object is to others in its own cluster compared to those in other clusters by combining “cohesion” and “separation”. Cohesion indicates the extent of an object’s similarity to other objects in the same cluster, while separation represents how different the object is from those in other clusters. Overall, the silhouette coefficient provides a measure of how appropriately the data has been clustered, with a higher silhouette coefficient value signifying more appropriate clustering. It evaluates the quality of the clusters resulted by the contribution of each object for the overall performance of the clustering. The silhouette coefficient value ranges between −1 and 1.
In addition, for ease of exposition and description of the grouping results, the dataset with 16,209 paths was split into three equally sized groups and then the clustering algorithm was run on these groups. Thus, the dataset was split into the following three smaller groups: a “short” group of 5795 paths with shopping times ranging from 1 to 20 min, a “middle” group of 7380 paths ranging from 20 to 40 min and a “long” group of 3034 paths ranging from 40 min to about 2 h. The splits by time are intuitive, in that a longer path is likely to be different from a short path in terms of shopping behavior and traffic of the store’s layout. Hence, each of the three smaller groups of the dataset was analyzed separately and they produced different interesting results, which are discussed in the next section.
4. Results and Discussion
In this section, the interesting results of grouping customers’ shopping paths into three smaller groups and the analysis of the store layout are provided. In addition, a comprehensive analysis of the impact of the proposed method on the green/sustainable product promotion dimension is also discussed.
4.1. Clustering Analysis by Shopping Time
Using real-world shopping path data, the grouping shopping pattern was conducted by applying clustering algorithm and changing the number of clusters accordingly. In addition, to find the optimal number of clusters, the silhouette coefficient was calculated. This method was performed to the low, middle and also long group.
4.1.1. Short Group
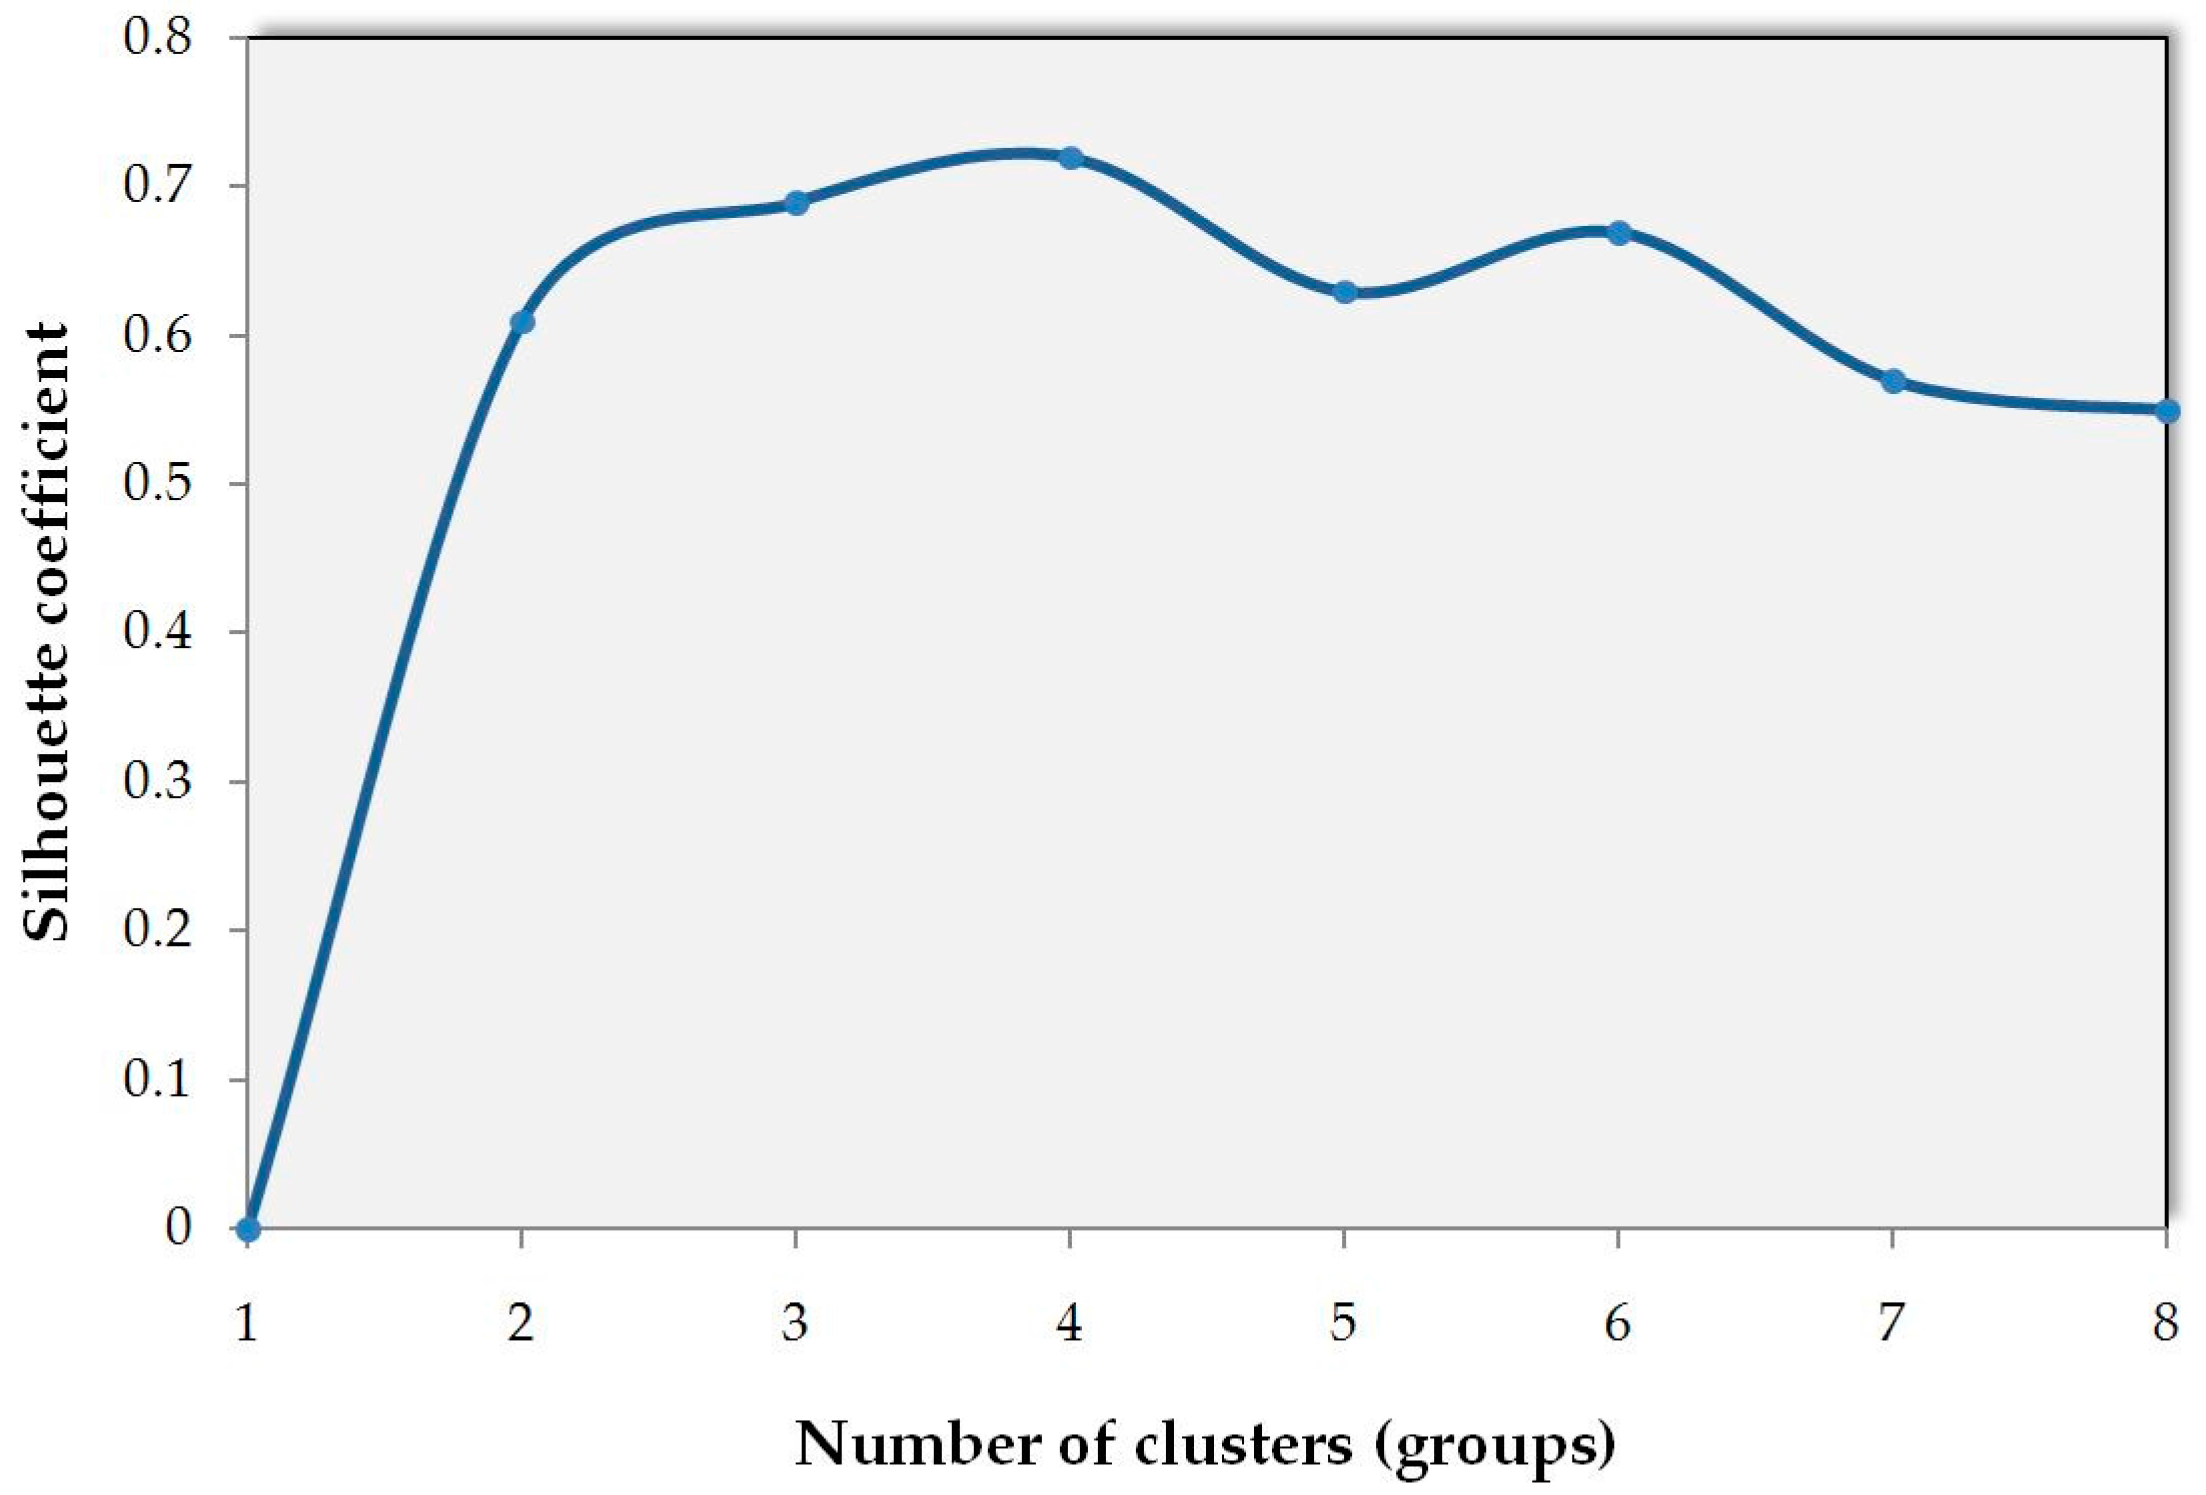
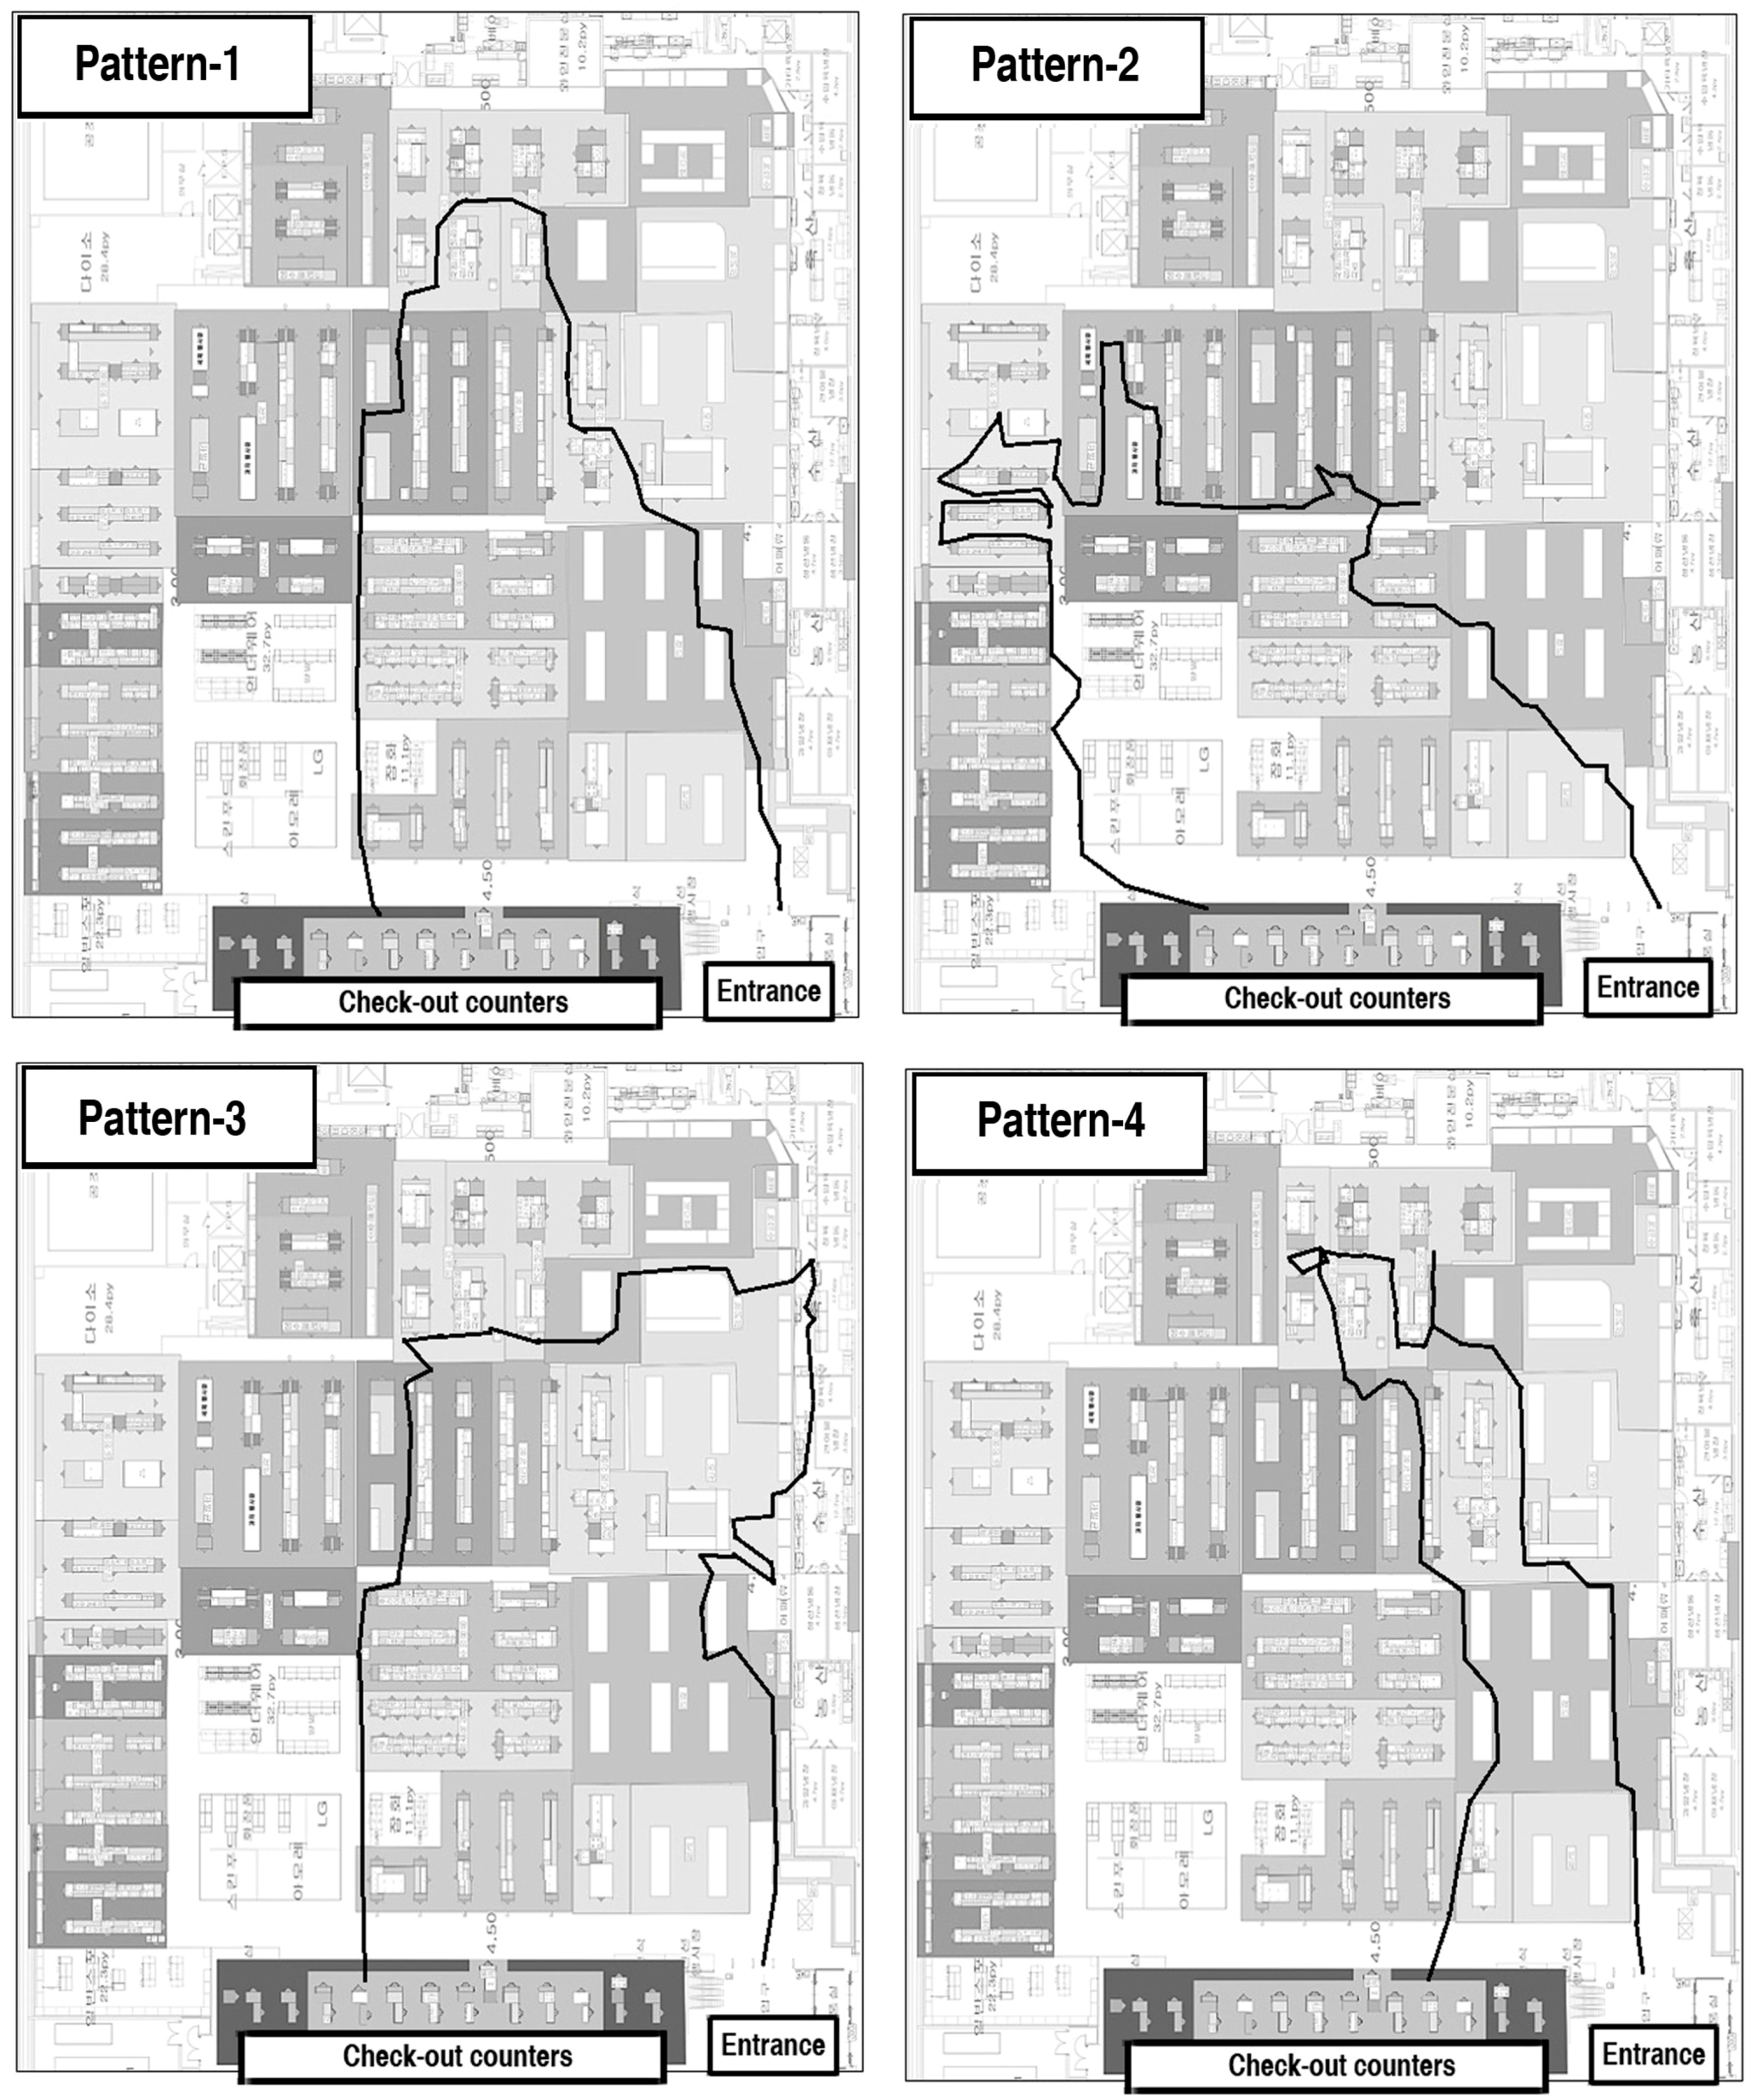
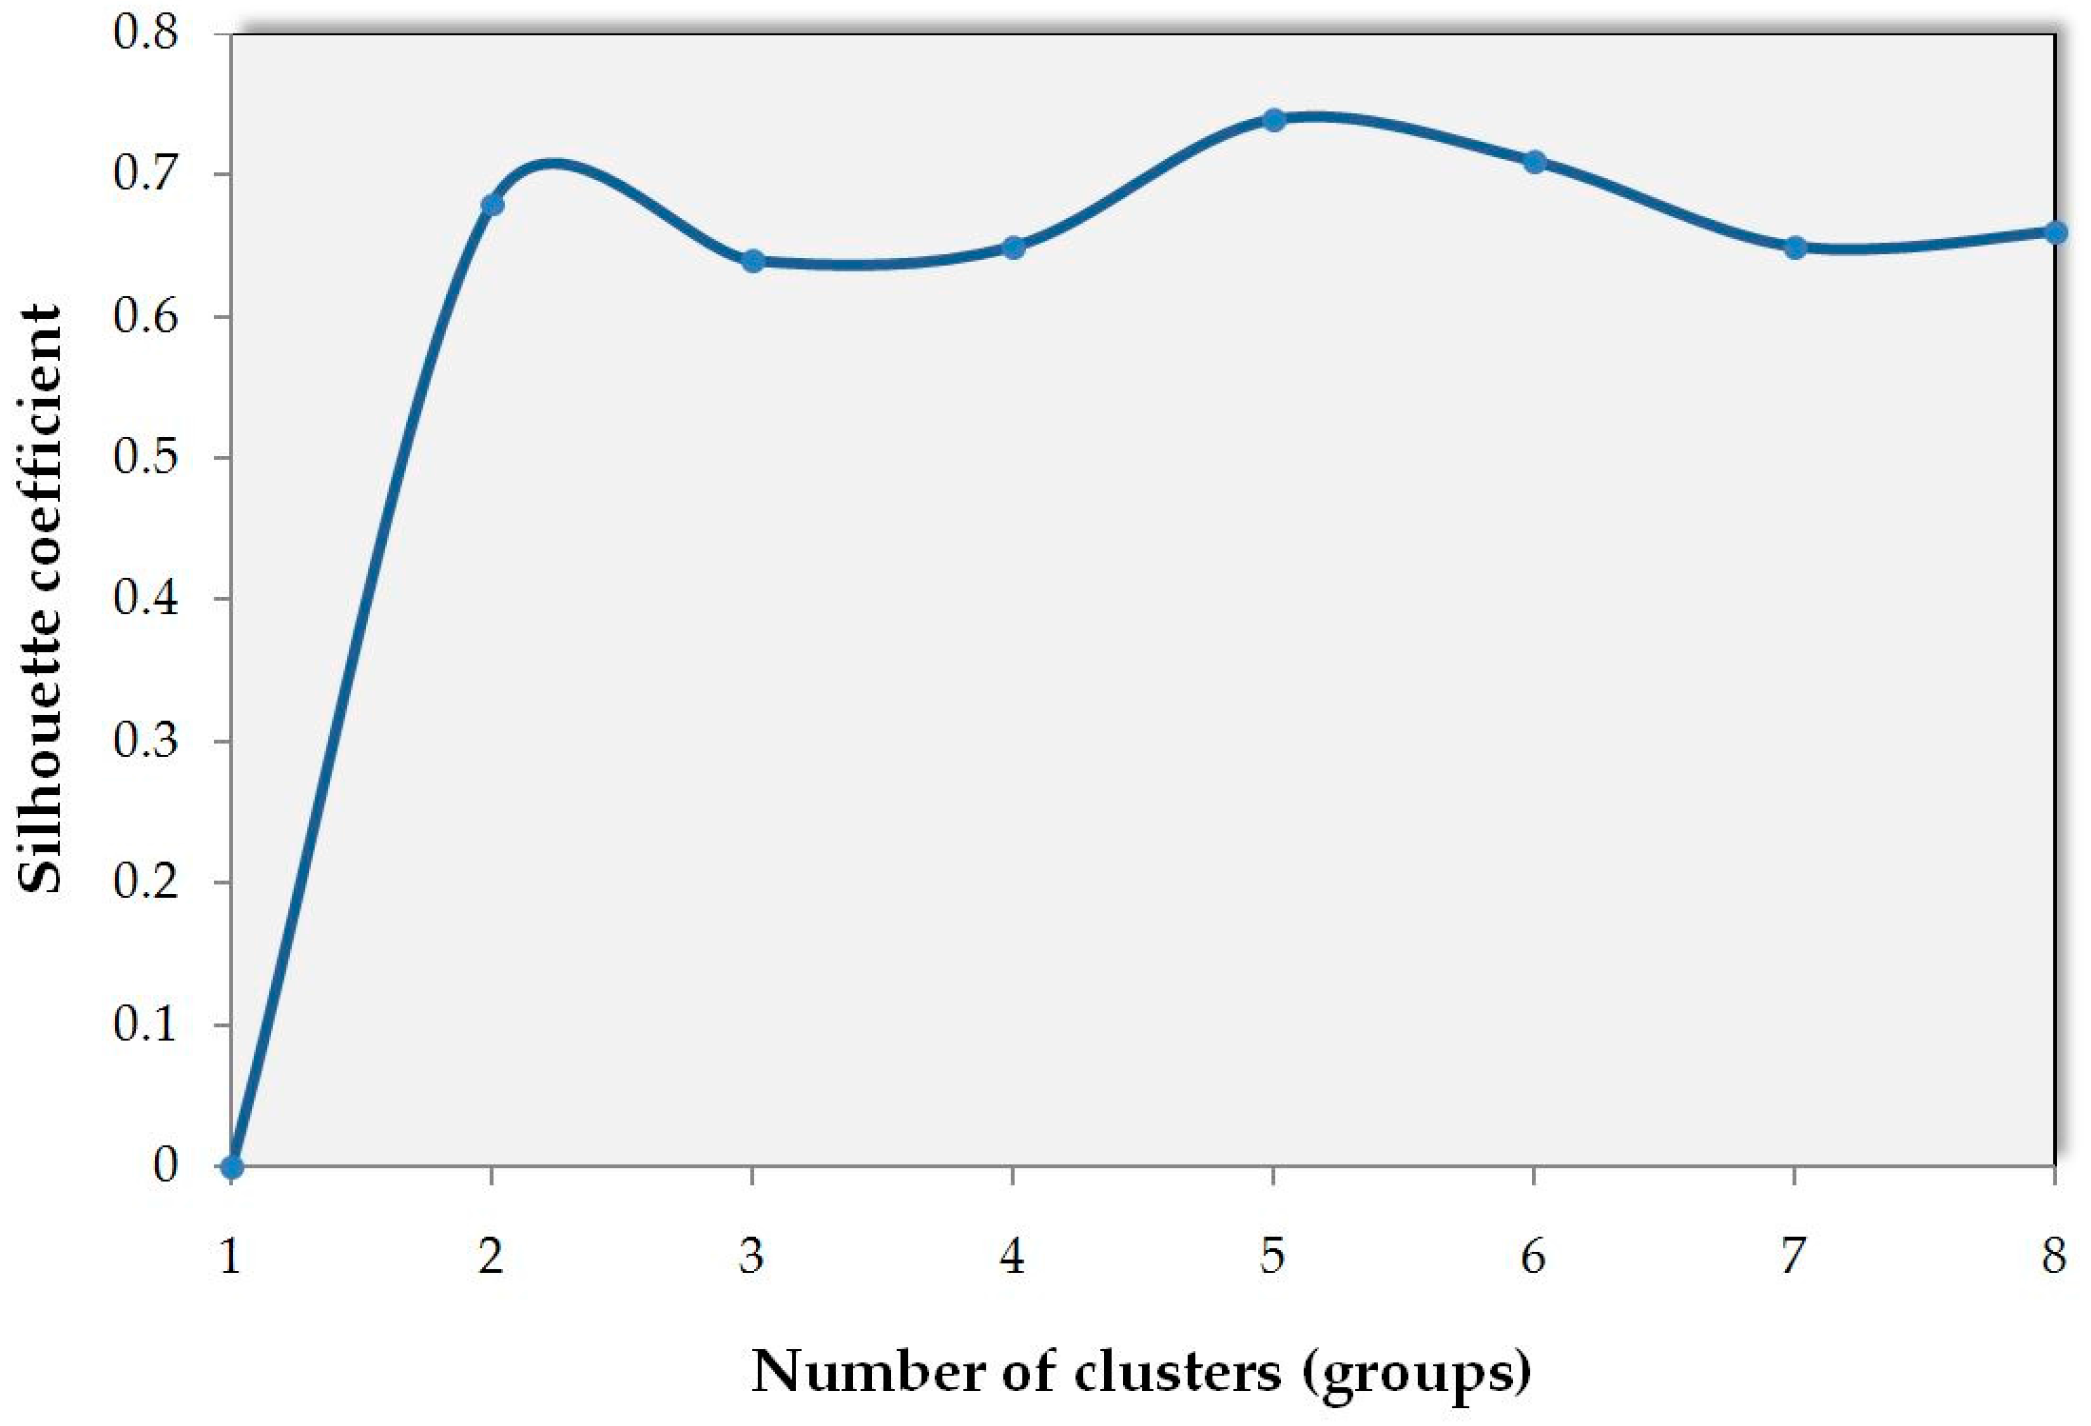
For the shopping path under 20 min, the silhouette coefficient values for each cluster were compared, as shown in Figure 4. Since the optimal number of clusters in this group was found to be four, the dataset was clustered into four groups. The shopping patterns of each group are illustrated in Figure 5.
In the four different shopping patterns, each had their own unique characteristics. However, in this short group, most customers had shorter paths and seemed to want to finish their few tasks as quickly as possible. The shopping paths of 981 customers were grouped as Pattern 1. These customers mostly visited three important areas: the right side of the store (agricultural product area), the rear side of the store (kitchen utensils area) and the center of the store (snack area). Customers with this pattern purchased quite large amounts of groceries and snacks. Pattern 2 customers (1290) tended to visit the vegetable area and then go directly to the left side of the store. There, they lingered and purchased herbal tea in relatively high amounts and some snacks from the center of the store. Pattern 3 customers (1871) visited the vegetable, fruit, meat, fish, dairy and snack sections. Lastly, Pattern 4 customers (1653) mostly visited the agricultural product, seafood and food seasoning areas. Pattern 4 customers had the fastest shopping pattern, with 826 s on average. However, compared to customers with other patterns, they spent the most on average 48 USD (56,560 KRW). In addition, to identify the characteristics of each pattern, a summary including average shopping time, average lingering time, average travel direction and most frequently purchased products is represented in Table 1.
Another insight from this analysis is that Pattern 3 and 4 customers purchased vegetables in relatively high amounts. On the other hand, Pattern 1 and 2 customers tended to be snack lovers. This information could be beneficial in the promotion of green products. For instance, eco-friendly snacks could be promoted and recommended to Pattern 1 and 2 customers. It could also help business deciding where to locate the processed products in relation to the agricultural products.
4.1.2. Medium Group
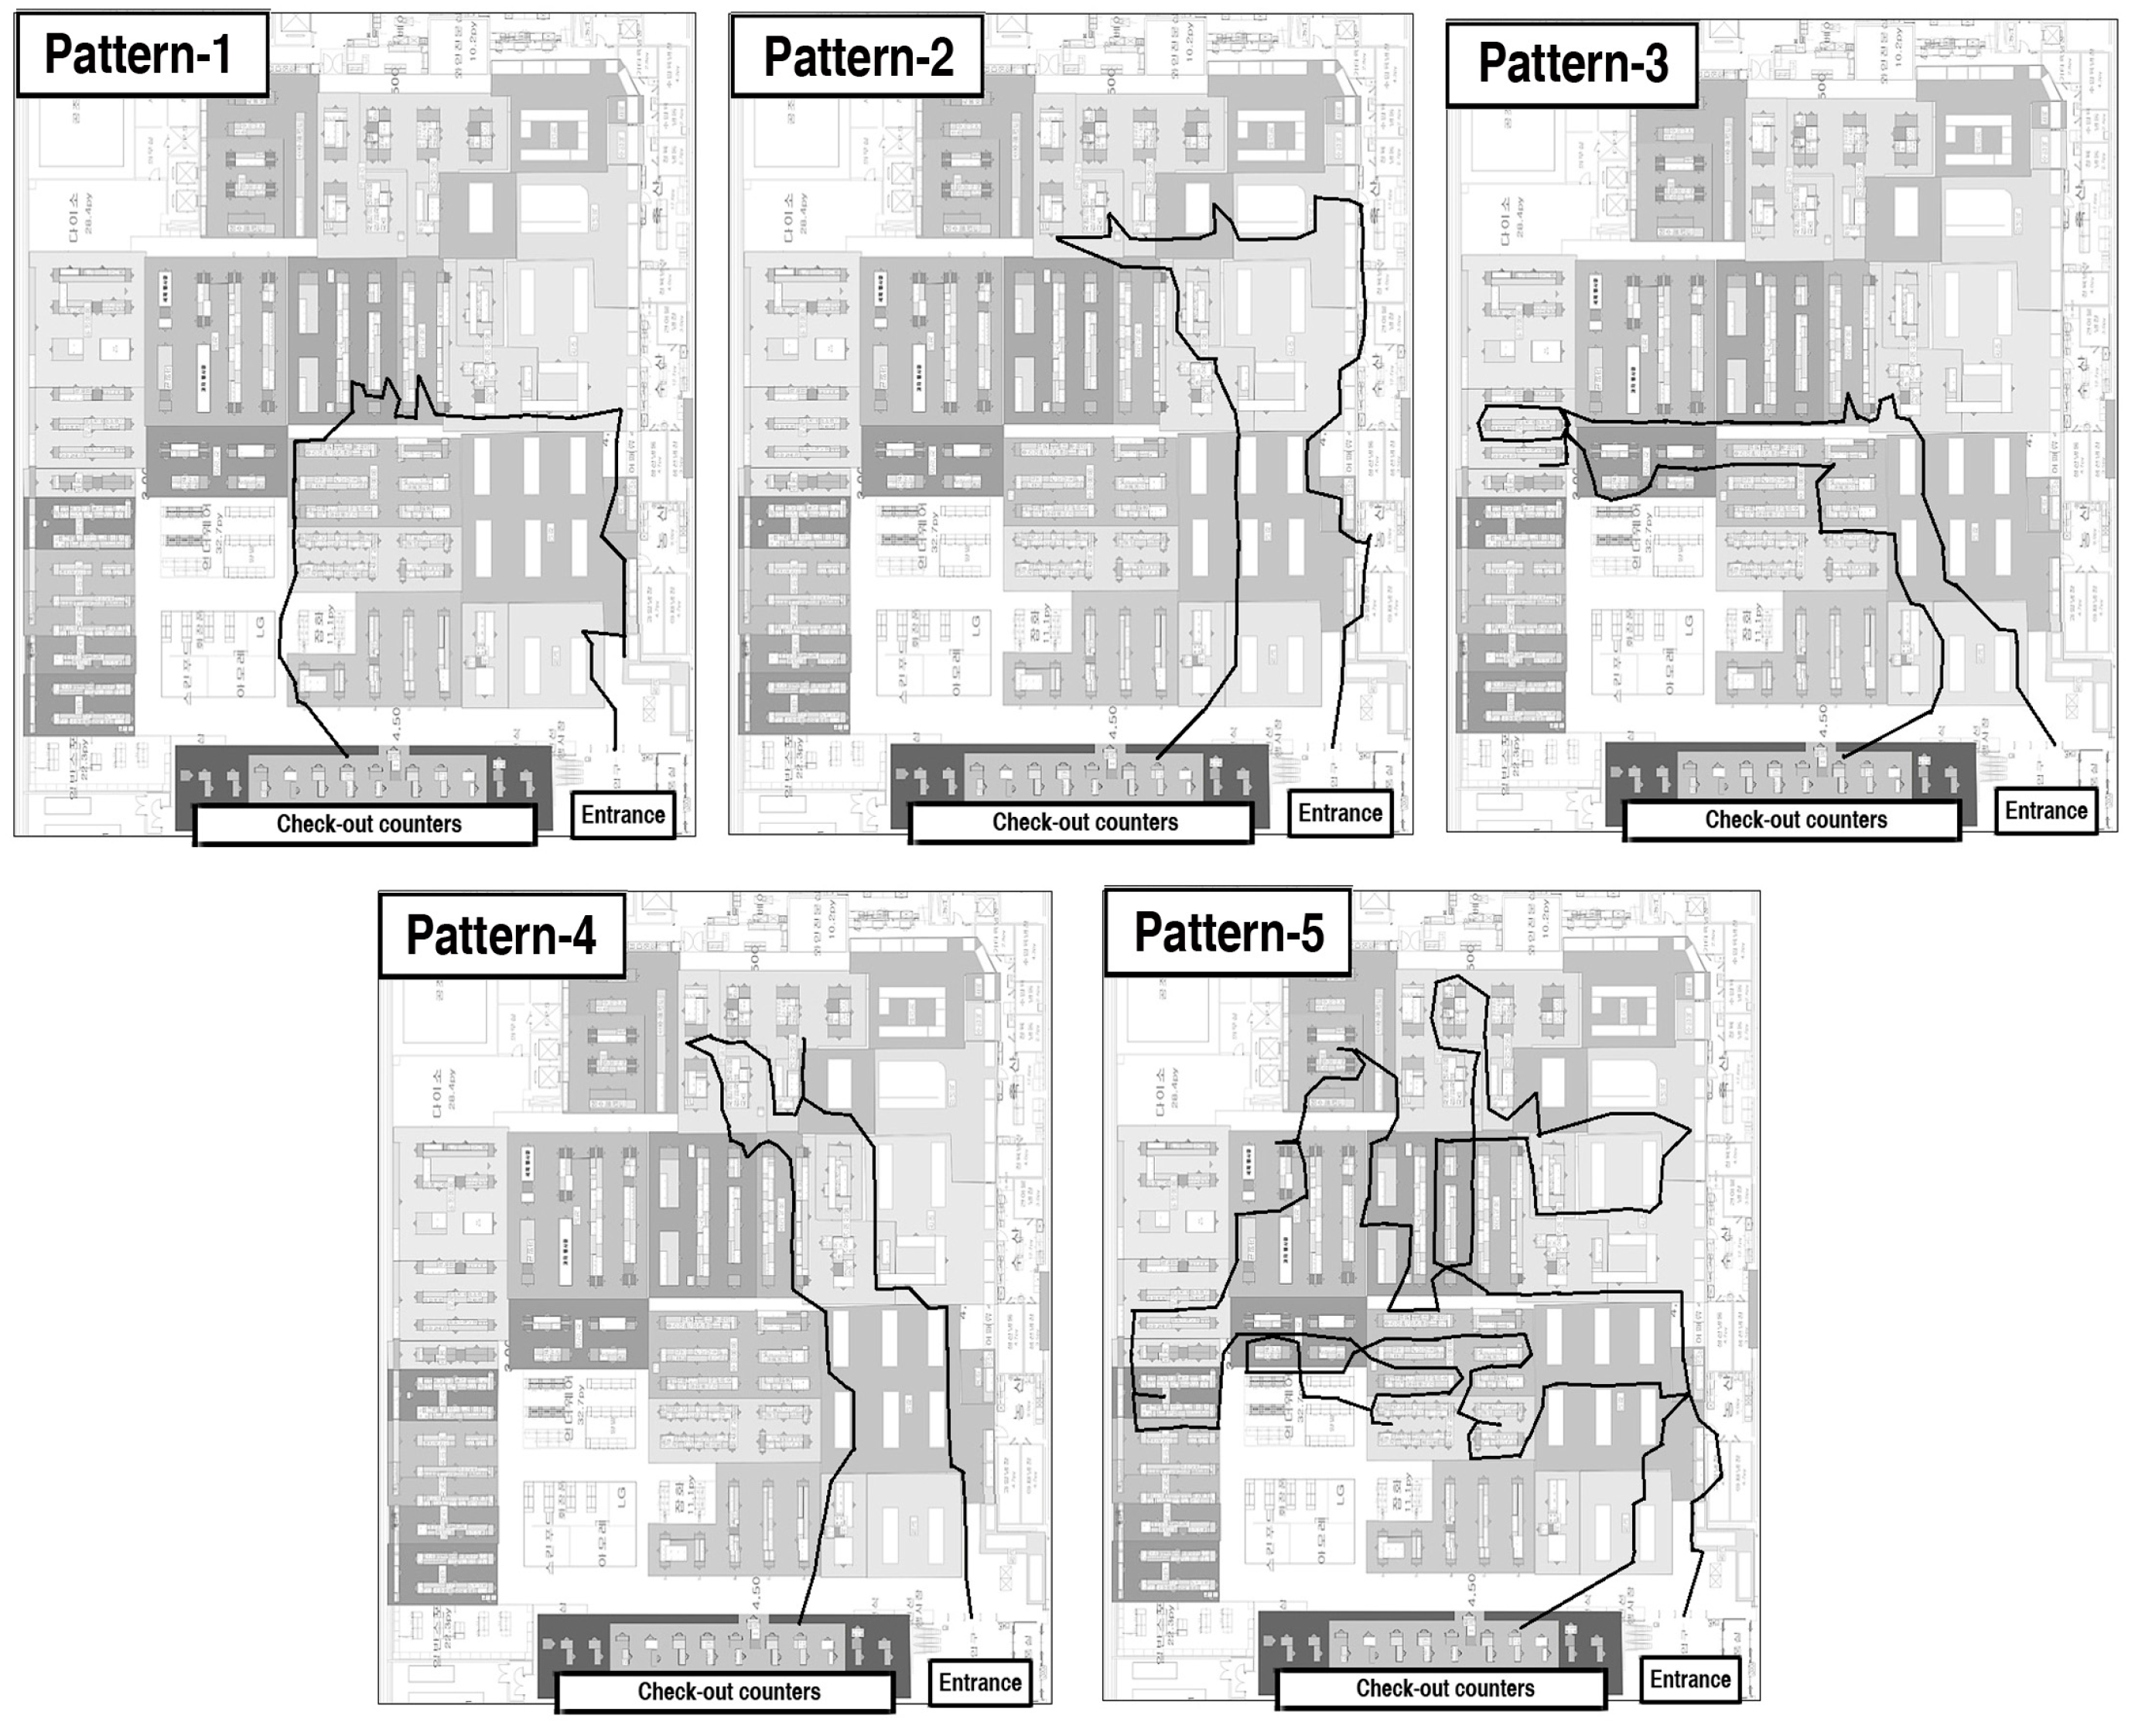
The grouping and characteristic analysis were also conducted on the medium group. Again, the clustering algorithm and the silhouette coefficient were applied. This time, the silhouette coefficient showed that five was the optimal value for the medium group, as shown in Figure 6. Thus, the dataset was clustered into five groups and several interesting patterns emerged, as shown in Figure 7.
This medium group, with a longer shopping time than the short group, was expected to have more divergence in customers’ shopping behavior patterns. Pattern 1 customers (1782) tended to visit and linger in the center of the store, which contained snacks, cooked foods and instant foods. However, they also tended to purchase vegetables. The Pattern 2 customers (1870) tended to visit the vegetable, fruit, meat, frozen food, food seasoning, dairy and seafood areas. Most customers walked around the right side of the store, with a shopping time of approximately 1707 s on average. The Pattern 3 and 4 customers (1220 and 1097) both purchased food seasonings and snacks in quite high amounts. However, unlike the Pattern 3 customers, who preferred to go directly to the left side of the store to visit the area with herbal tea, kitchenware and bathroom cleaners, the Pattern 4 customers tended to visit the edges of the store. Finally, the Pattern 5 customers (1411) were the most exploratory of the five types of customers, wandering around in a clockwise direction to observe the overall area of the store. Again, to identify the characteristics of this medium group, a summary of each pattern is shown in Table 2.
4.1.3. Long Group
As the longest group in terms of path length, various interesting patterns were also discovered here. Using the same method, by applying the clustering algorithm and the silhouette coefficient, the optimal number of cluster groups was determined to be four, as seen in Figure 8. In addition, Figure 9 illustrates the four main patterns in this long group.
The four customer types below have unique characteristics. Pattern 1 customers (636) mostly visited and lingered in the right side of the store, the agricultural product area. Pattern 2 and 3 customers (780 and 737) also purchased large amounts of agricultural products. However, interestingly, these customers tended to stay in the area for a relatively shorter amount of time compared to Pattern 1 customers. In terms of the way in which the customers explored the store, the Pattern 2 customers preferred to travel around the edges of the store, unlike the Pattern 3 customers, who tended to go directly to and linger in the center of the store. Pattern 4 customers (878) showed the most exploratory pattern in this long group.
The Pattern 1 consisted customers (636) tended to purchase meat, fish, frozen food, food seasoning and kitchen utensils in addition to agricultural products. It seemed as if these customers were getting materials for cooking. The Pattern 2 customers (780) had some beverages, snacks, detergents and interior accessories in their shopping carts but not in large amounts. The Pattern 3 customers (737) tended to explore the snack, cooked food and dairy areas. Lastly, the Pattern 4 customers (878) explored the store and nearly got something in every area of the store. However, they did not purchase large amounts. In addition, to identify the characteristics of this long group, a summary of each pattern is shown in Table 3.
4.2. Profiling Customers’ Shopping Patterns
Once the customers have been grouped, their shopping patterns can be profiled based on their behaviors. The clustering produced three groups with (four subgroups, five subgroups and four subgroups). Furthermore, multi criteria decision-making method can be used to analyze in more formal method to get more appropriate and accurate analysis. Once the appropriate alternatives have been determined, a selection process is carried out in order to obtain the final ranking result. However, these clustering results can also imply basic hidden information that can be useful for supporting store decision-makers.
4.2.1. Green Products Recommendations
In the three different groups based on shopping time, interestingly, customers who loved vegetables and snacks existed. Thus, eco-friendly snacks and processed vegetable products can be the first recommended green products in the store. These products may be preferred by all customers in the group. In the medium group, they are perfectly matched for Pattern 1, 3 and 4 customers. However, they can also be recommended for Pattern 1 and 2 customers even though they only had limited shopping time.
Cooked food products should have eco-friendly and fresh packaging [115,116]. Appropriate packaging is also one of the prominent strategies in marketing [59,65]. Since all customers in the long group liked to purchase cooked foods, cooked foods with green packaging could be recommended to customers who have relatively long shopping times. In addition, they may be preferred by Pattern 1 customers from the medium group.
On the other hand, processed fruit products can be recommended to customers who have shopping behaviors similar to those of the Pattern 1, 2 and 3 customers in the long group, the Pattern 2 and 5 customers in the medium group, as well as the Pattern 1, 2 and 4 customers in the short group.
4.2.2. Analysis of Store Traffic and Location of Green Products
Besides the products, the location of the products is a prominent factor in promoting products [15,117], especially green products. Thus, the location of green products must be analyzed. Choosing the location to display green products in a store based on customers’ behaviors is appropriate, because the most important aspect of successful in-store displays is an understanding of customers’ behaviors [118]. Moreover, strategic displays can help to increase sales, especially through customers’ unplanned purchases [13]. In addition, another important factor to be considered is store traffic [16,93].
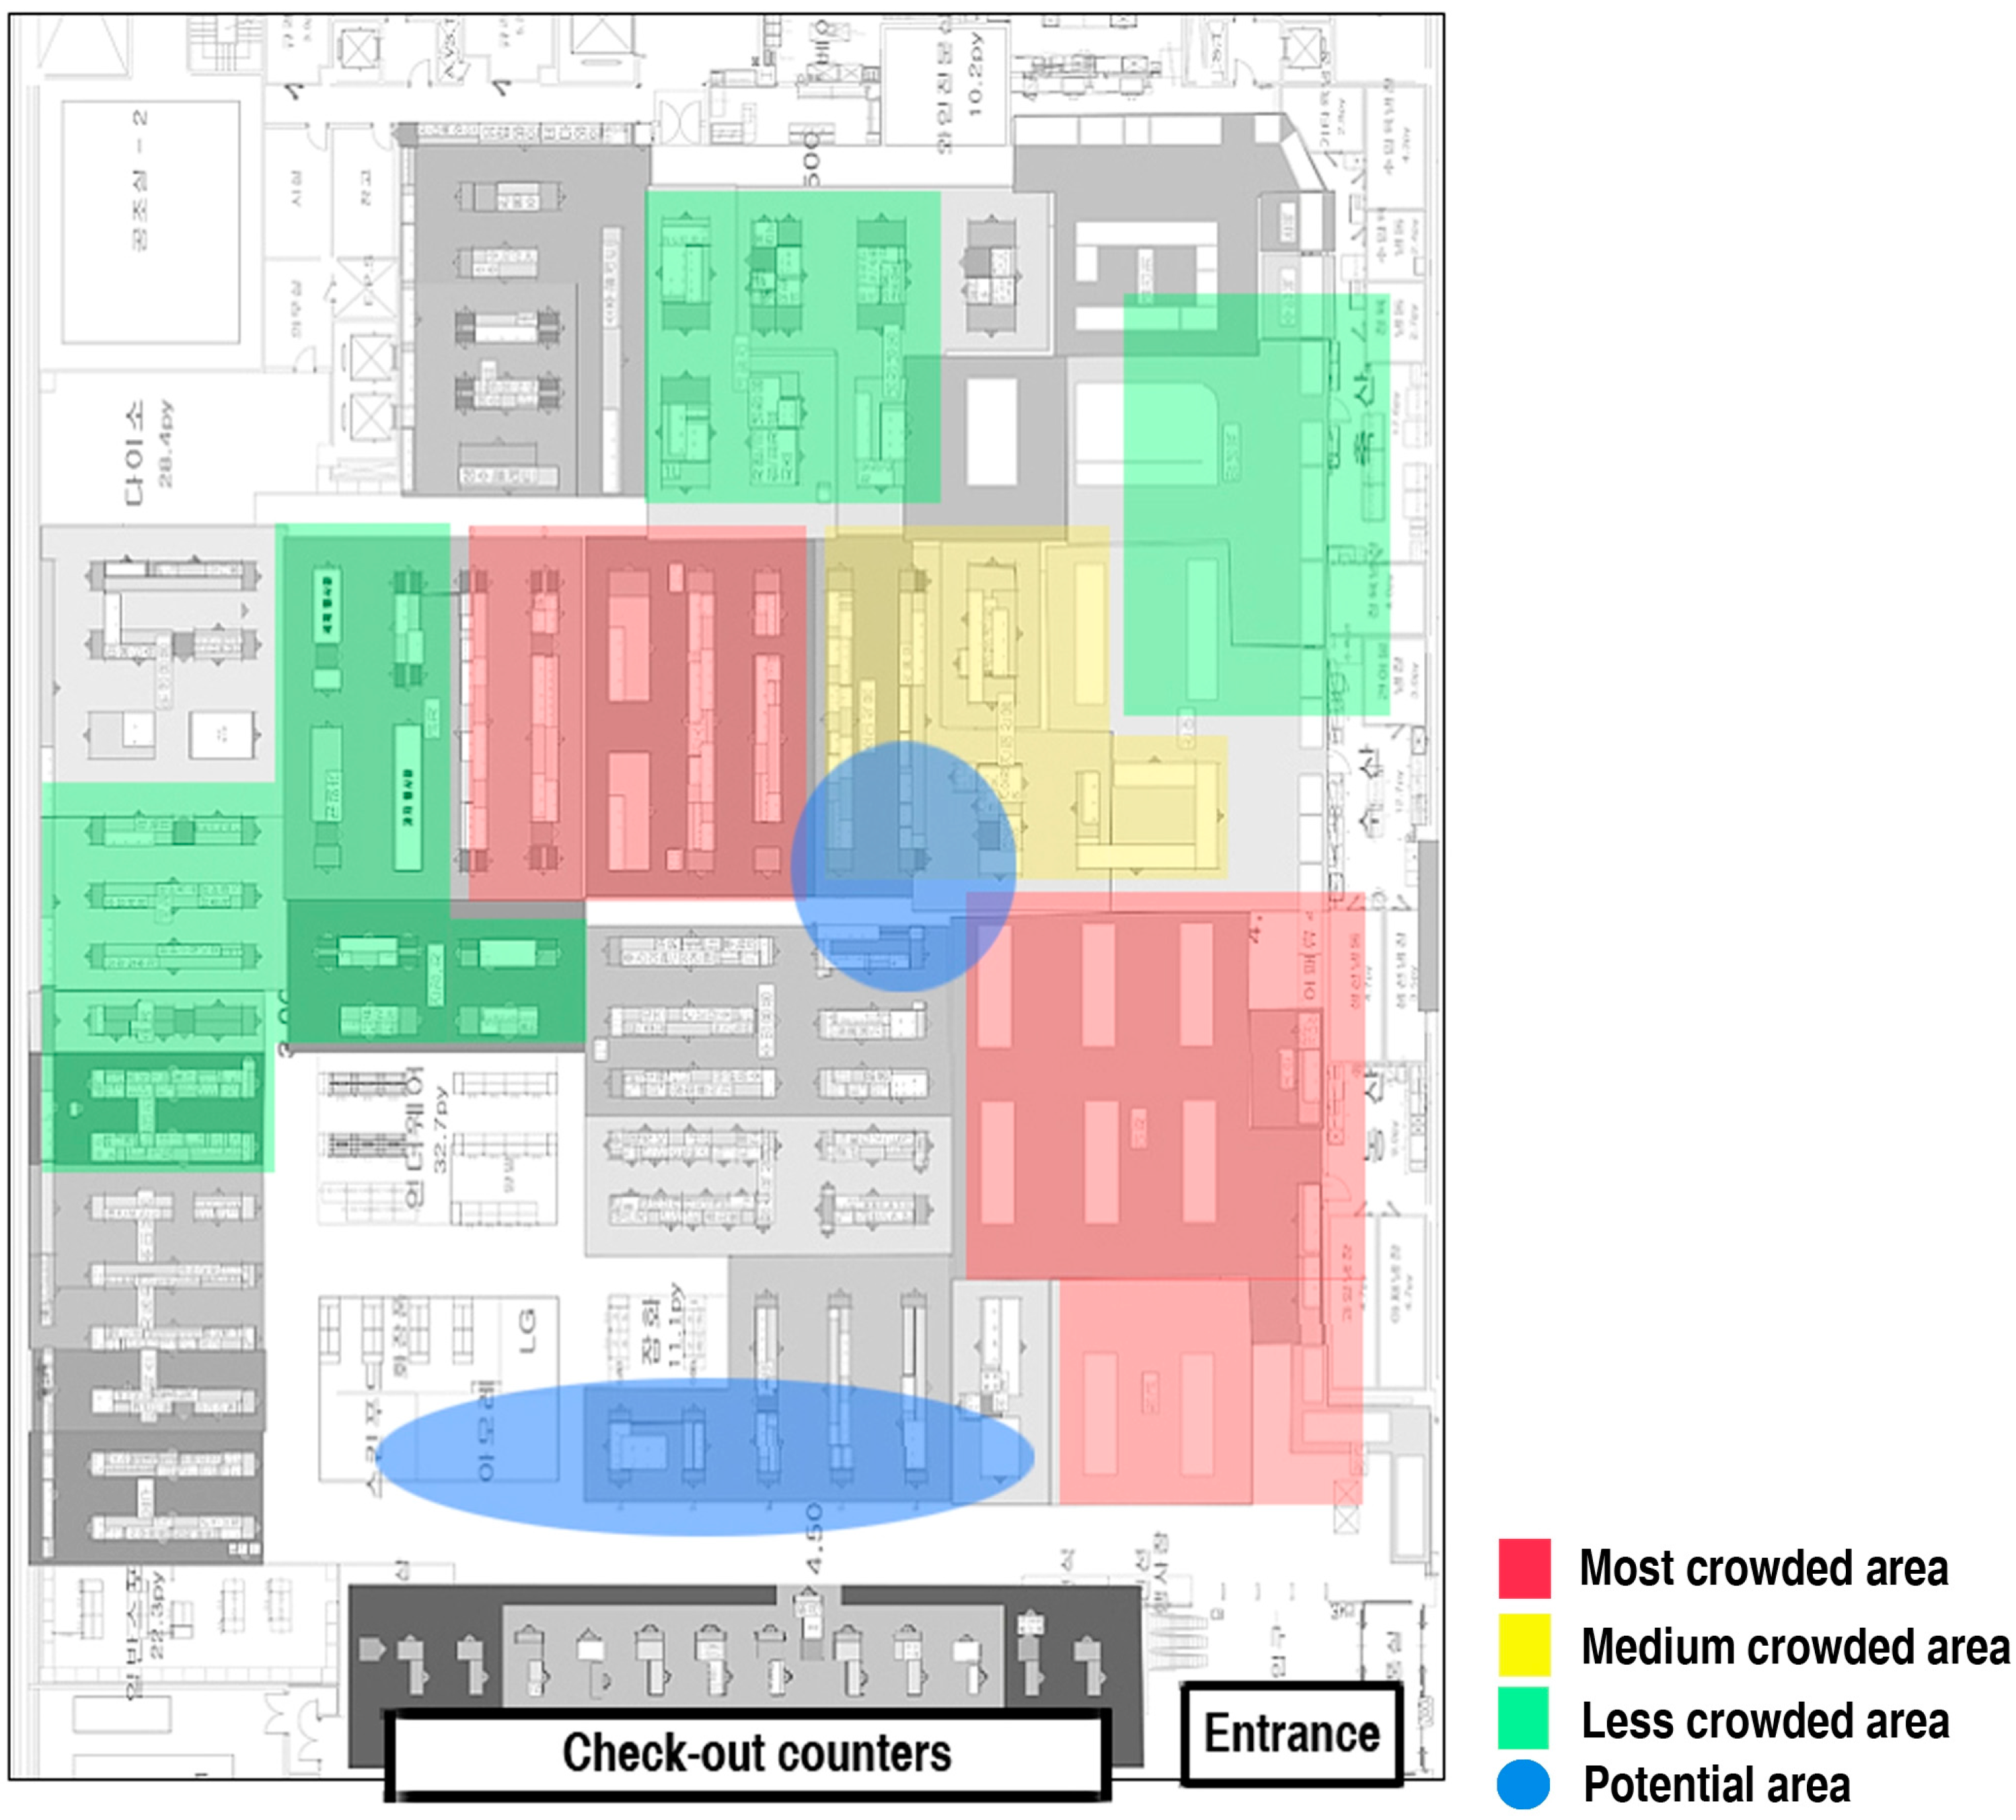
Using the shopping path data recorded, the traffic of the store was illustrated and it is shown in Figure 10. The most crowded area, which the customers in all three groups visited and lingered in the most, is marked in red, while the medium and the less crowded areas are marked in yellow and green, respectively.
The most crowded areas provide an unpleasant experience in shopping situations [119]. Thus, these areas might be inconvenient locations for promoting products. However, there was a high-traffic “bridge”, which is marked with a blue circle, where many customers moved from each of the most crowded locations. Hence, this area could be an effective location for promoting products. In addition, the other potential location is on the way to the checkout counters (marked with a blue oval).
The above analysis offers an important strategy which can help retailers to optimize their green product promotion. Furthermore, it enables the creation of convenient and interesting store environment in order to evoke a great shopping experience for achieving high customer satisfaction and profitability.
5. Conclusions
In retail businesses, environment issues must be considered. One of the first steps is to promote green products of customers’ daily necessities in general. As customers prefer to get their everyday products from retail stores, by investigating and understanding customers’ in-store shopping behaviors, appropriate promotion strategies can be applied in order to encourage customers to purchase green products that meet their daily needs.
This study analyzed customers’ in-store behaviors, including movement and purchasing behaviors. Moreover, clustering analysis was applied to group the customers and uncover the interesting characteristics of each group. In addition, the analysis of store traffic and store layout was also discussed. This method was appropriately implemented in a real-world retail store environment and it can be used for promoting products, especially green products, to the right target customers in order to increase customer satisfaction and profitability.
This strategy can also be used to support the store decision-makers to solve the issue of sustainability as well as boost profit for retail industries. However, this study is limited to one specific Korean large retail store in Seoul. In addition, the further multi criteria analysis is still missing. Future studies could involve the validation on more specific green products and more analysis, such as vertical analysis of product shelves, so that more specific convenient position of green products in shelves can be discussed. Moreover, an analysis of the social influences [120] and psychological influences [121], as prominent factors that predispose customer behavior, need to be included. These influences could make a more complex analysis to get more interesting results.
Acknowledgments
This work was supported by the Technology Innovation Program: Industrial Strategic Technology Development Program (No. 11073162) funded by the Minister of Trade, Industry & Energy (MOTIE, Korea).
Author Contributions
M.A. Syaekhoni developed the conceptual design and framework of the research, performed the experimentation and wrote the manuscript. Ganjar Alfian revised the manuscript. Young S. Kwon helped in the research design and reviewed the manuscript.
Conflicts of Interest
The authors declare no conflict of interest.
References
- Chen, T.B.; Chai, L.T. Attitude towards the environment and green products: Consumers’ perspective. Manag. Sci. Eng. 2010, 4, 27–39. [Google Scholar]
- Crane, A.; Desmond, J. Societal marketing and morality. Eur. J. Mark. 2002, 36, 548–569. [Google Scholar] [CrossRef]
- Joshi, Y.; Rahman, Z. Factors affecting green purchase behaviour and future research directions. Int. Strateg. Manag. Rev. 2015, 3, 128–143. [Google Scholar] [CrossRef]
- Lozano, R.; Huisingh, D. Inter-linking issues and dimensions in sustainability reporting. J. Clean. Prod. 2011, 12, 99–107. [Google Scholar] [CrossRef]
- Murin, I.; Marková, I.; Zelený, J.; Jaďuďová, J. Green marketing as a tool influencing consumers’ behavior: Slovak case study of regional mark preference. Proc. Econ. Financ. 2015, 34, 260–267. [Google Scholar]
- Chen, J.; Cheng, J.; Dai, S. Regional eco-innovation in China: An analysis of eco-innovation levels and influencing factors. J. Clean. Prod. 2017, 153, 1–14. [Google Scholar] [CrossRef]
- Veleva, V.; Ellenbecker, M. Indicators of sustainable production: Framework and methodology. J. Clean. Prod. 2001, 9, 519–549. [Google Scholar] [CrossRef]
- McCarthy, B.; Liu, H.B. Food waste and the ‘green’ consumer. Aust. Mark. J. 2017, 25, 126–132. [Google Scholar] [CrossRef]
- Moisander, J. Motivational complexity of green consumerism. Int. J. Consum. Stud. 2007, 31, 404–409. [Google Scholar] [CrossRef]
- Applebaum, W. Studying customer behavior in retail stores. J. Mark. 1951, 16, 172–178. [Google Scholar] [CrossRef]
- Grunert, S.C.; Juhl, H.J. Values, environmental attitudes, and buying of organic foods. J. Econ. Psychol. 1995, 16, 39–62. [Google Scholar] [CrossRef]
- Wilkinson, J.B.; Mason, J.B.; Paksoy, C.H. Assessing the impact of short-term supermarket strategy variables. J. Market. Res. 1982, 19, 72–86. [Google Scholar] [CrossRef]
- Tendai, M.; Crispen, C. In-store shopping environment and impulsive buying. Afr. J. Mark. Manag. 2009, 1, 102–108. [Google Scholar]
- Schultz, D.E.; Block, M.P. How U.S. consumers view in-store promotions. J. Bus. Res. 2011, 64, 51–54. [Google Scholar] [CrossRef]
- Zhou, L.; Wong, A. Consumer impulse buying and in-store stimuli in Chinese supermarkets. J. Int. Consum. Mark. 2004, 16, 37–53. [Google Scholar] [CrossRef]
- Epstein, L.; Flores, A.; Goodstein, R.; Milberg, J. A new approach to measuring retail promotion effectiveness: A case of store traffic. J. Bus. Res. 2016, 69, 4394–4402. [Google Scholar] [CrossRef]
- Lam, S.Y.; Vandenbosch, M.; Hulland, J.; Pearce, M. Evaluating promotions in shopping environments: Decomposing sales response into attraction, conversion, and spending effects. Mark. Sci. 2001, 20, 194–215. [Google Scholar] [CrossRef]
- Newman, A.; Yu, D.; Oulton, D. New insights into retail space and format planning from customer-tracking data. J. Retail. Cusum. Serv. 2002, 9, 254–258. [Google Scholar] [CrossRef]
- Larson, J.; Bradlow, E.; Fader, P. An exploratory look at supermarket shopping paths. Int. J. Res. Market. 2005, 22, 359–414. [Google Scholar] [CrossRef]
- Pride, W.M.; Ferrell, O.C. Marketing, 8th ed.; Houghton Mifflin: Boston, MA, USA, 1993. [Google Scholar]
- Welford, R. Hijacking Environmentalism; Earthscan: London, UK, 2000. [Google Scholar]
- Hasan, Z.; Ali, N.A. The impact of green marketing strategy on the firm’s performance in Malaysia. Proc. Soc. Behav. Sci. 2015, 172, 463–470. [Google Scholar] [CrossRef]
- Porter, M.E. America’s green strategy. Sci. Am. 1991, 264, 96. [Google Scholar]
- Kangun, N.; Carlson, L.; Grove, S.J. Environmental advertising claims: A preliminary investigation. J. Publ. Police Mark. 1991, 10, 47–58. [Google Scholar]
- Lampe, M.; Gazda, G.M. Green marketing in Europe and the United States: An evolving business and society interface. Int. Bus. Rev. 1995, 4, 295–312. [Google Scholar] [CrossRef]
- Bohlen, G.; Diamantopolous, A.; Schlegeimilch, B. Consumer perceptions of the environmental impact of any industrial service. Mark. Intell. Plan. 1993, 11, 37–48. [Google Scholar] [CrossRef]
- Peattie, K.; Crane, A. Green marketing: Legend, myth, farce or prophesy? Qual. Mark. Res. Int. J. 2005, 8, 357–370. [Google Scholar] [CrossRef]
- Polonsky, M.J. An introduction to green marketing. Electron. Green J. 1994, 1, 1–10. [Google Scholar]
- Rex, E.; Baumann, H. Beyond ecolabels: What green marketing can learn from conventional marketing. J. Clean. Prod. 2007, 15, 567–576. [Google Scholar] [CrossRef]
- Ginsberg, J.M.; Bloom, P.N. Choosing the right green marketing strategy. MIT Sloan Manag. Rev. 2004, 46, 79–84. [Google Scholar]
- Laroche, M.; Bergeron, J.; Barbaro-Forleo, G. Targeting consumers who are willing to pay more for environmentally friendly products. J. Consum. Mark. 2001, 18, 503–520. [Google Scholar] [CrossRef]
- Lee, S.; Cho, Y.; Kim, S. Collaborative filtering with ordinal scale-based implicit ratings for mobile music recommendations. Inf. Sci. 2010, 180, 2142–2155. [Google Scholar] [CrossRef]
- Johri, L.M.; Sahasakmontri, K. Green marketing of cosmetics and toiletries in Thailand. J. Consum. Mark. 1998, 15, 265–281. [Google Scholar] [CrossRef]
- Teisl, M.F.; Roe, B.; Hicks, R.L. Can eco-labels tune a market? Evidence from dolphin-safe labeling. J. Environ. Econ. Manag. 2002, 43, 339–359. [Google Scholar] [CrossRef]
- Polonsky, M.J.; Rosenberger, P. Re-evaluating green marketing: A strategic approach. Bus. Horiz. 2001, 44, 21–30. [Google Scholar] [CrossRef]
- Rivera-Camino, J. Re-evaluating green marketing strategy: A stakeholder perspective. Eur. J. Mark. 2007, 41, 1328–1358. [Google Scholar] [CrossRef] [Green Version]
- D’Souza, C.; Taghian, M.; Lamb, P. An empirical study on the influence of environmental labels on consumers. Corp. Commun. Int. J. 2006, 11, 162–173. [Google Scholar] [CrossRef]
- Jones, P.; Comfort, D.; Hillier, D. What’s in store? Retail marketing and corporate social responsibility. Mark. Intell. Plan. 2007, 25, 17–30. [Google Scholar] [CrossRef]
- Menon, A.; Menon, A. Enviropreneurial marketing strategy: The emergence of corporate environmentalism as market strategy. J. Market. 1997, 61, 51–67. [Google Scholar] [CrossRef]
- Hunt, S.D.; Morgan, R.M. The resource advantage theory of competition: Dynamics, path dependencies, and evolutionary dimensions. J. Mark. 1996, 60, 107–114. [Google Scholar] [CrossRef]
- Hunt, S.D.; Morgan, R.M. The comparative advantage theory of competition. J. Mark. 1995, 59, 1–14. [Google Scholar] [CrossRef]
- Ko, E.; Hwang, Y.K.; Kim, E.Y. Green marketing’ functions in building corporate image in the retail setting. J. Bus. Res. 2013, 66, 1709–1715. [Google Scholar] [CrossRef]
- Kumar, P. Greening retail: An Indian experience. Int. J. Retail Distrib. Manag. 2014, 42, 613–625. [Google Scholar] [CrossRef]
- Chan, R.Y. Determinants of Chinese consumers’ green purchase behavior. Psychol. Market. 2001, 18, 389–413. [Google Scholar] [CrossRef]
- Chekima, B.; Syed Khalid Wafa, S.A.W.; Igau, O.A.; Chekima, S.; Sondoh, S.L., Jr. Examining green consumerism motivational drivers: Does premium price and demographics matter to green purchasing? J. Clean. Prod. 2016, 112, 3436–3450. [Google Scholar] [CrossRef]
- Lin, P.C.; Huang, Y.H. The influence factors on choice behavior regarding green products based on the theory of consumption values. J. Clean. Prod. 2012, 22, 11–18. [Google Scholar] [CrossRef]
- Yook, K.H.; Choi, J.H.; Suresh, N.C. Linking green purchasing capabilities to environmental and economic performance: The moderating role of firm size. J. Purch. Supply Manag. 2017. [Google Scholar] [CrossRef]
- Ramayah, T.; Lee, J.W.C.; Mohamad, O. Green product purchase intention: Some insights from a developing country. Res. Conserv. Recycl. 2010, 54, 1419–1427. [Google Scholar] [CrossRef]
- Shamdasani, P.; Chon-Lin, G.; Richmond, D. Exploring green consumers in an oriental culture: Role of personal and marketing mix. Adv. Consum. Res. 1993, 20, 488–493. [Google Scholar]
- Connell, K.Y.H. Internal and external barriers to eco-conscious apparel acquisition. Int. J. Consum. Stud. 2010, 34, 279–286. [Google Scholar] [CrossRef]
- Vermeir, I.; Verbeke, W. Sustainable food consumption: Exploring the consumer “attitude–behavioral intention” gap. J. Agric. Environ. Ethics 2006, 19, 169–194. [Google Scholar] [CrossRef]
- Ajzen, I.; Fishbein, M. Understanding Attitudes and Predicting Social Behaviour; Prentice-Hall: Englewood Cliffs, NJ, USA, 1980. [Google Scholar]
- Ajzen, I. From intentions to actions: A theory of planned behavior. In Action Control from Cognition to Behavior; Springer: Berlin/Heidelberg, Germany, 1985. [Google Scholar]
- Arvola, A.; Vassallo, M.; Dean, M.; Lampila, P.; Saba, A.; Lähteenmäki, L.; Shepherd, R. Predicting intentions to purchase organic food: The role of affective and moral attitudes in the theory of planned behavior. Appetite 2008, 50, 443–454. [Google Scholar] [CrossRef] [PubMed]
- Taghian, C.D.M. Green advertising effects on attitude and choice of advertising themes. Asia Pac. J. Mark. Logist. 2005, 17, 51–66. [Google Scholar]
- Polonsky, M.J. A stake holder theory of approach to designing environmental marketing strategy. J. Bus. Ind. Mark. 1995, 10, 29–46. [Google Scholar] [CrossRef]
- Ottman, J. The New Rules of Green Marketing: Strategies, Tools and Inspiration for Sustainable Branding. Kindle e-Book; Berret-Koehler Publishers: Oakland, CA, USA, 2011; ISBN 978-1-60509-868-5. [Google Scholar]
- William, B.E.; Sinkula, J.M. Environmental strategy and firm performance: Effects on new product performance and market share. J. Acad. Mark. Sci. 2005, 33, 461–475. [Google Scholar]
- Silayoi, P.; Speece, M. Packaging and purchase decisions: An exploratory study on the impact of involvement level and time pressure. Br. Food J. 2004, 106, 607–628. [Google Scholar] [CrossRef]
- Inman, J.J.; Winer, R.S.; Ferraro, R. The interplay among category characteristics, customer characteristics, and customer activities on in-store decision making. J. Mark. 2009, 73, 19–29. [Google Scholar] [CrossRef]
- Gauri, D.K.; Ratchford, B.; Pancras, J.; Talukdar, D. An empirical analysis of the impact of promotional discounts on store performance. J. Retail. 2017, 93, 283–303. [Google Scholar] [CrossRef]
- Janakiraman, N.; Meyer, R.J.; Morales, A.C. Spillover effects: How consumers respond to unexpected changes in price and quality. J. Consum. Res. 2006, 33, 361–369. [Google Scholar] [CrossRef]
- Heilman, C.M.; Nakamoto, K.; Rao, A.G. Pleasant surprises: Consumer response to unexpected in-store coupons. J. Mark. Res. 2002, 39, 242–245. [Google Scholar] [CrossRef]
- Barnes, L.; Lea-Greenwood, G. Fast fashion in the retail store environment. Int. J. Retail. Distrib. Manag. 2010, 38, 760–772. [Google Scholar] [CrossRef]
- Nancarrow, C.; Wright, L.T.; Brace, I. Gaining competitive advantage from packaging and labeling in marketing communications. Br. Food J. 1998, 100, 110–118. [Google Scholar] [CrossRef]
- Ailawadi, K.L.; Beauchamp, J.P.; Donthu, N.; Gauri, D.K.; Shankar, V. Communication and promotion decisions in retailing: A review and directions for future research. J. Retail. 2009, 85, 42–55. [Google Scholar] [CrossRef]
- Chabowski, B.R.; Mena, J.A.; Gonzalez-Padron, T.L. The structure of sustainability research in marketing, 1958–2008: A basis for future research opportunities. J. Acad. Mark. Sci. 2011, 39, 55–70. [Google Scholar] [CrossRef]
- Nyilasy, G.; Gangadharbatla, H.; Paladino, A. Perceived greenwashing: The interactive effects of green advertising and corporate environmental performance on consumer reactions. J. Bus. Ethics 2013, 125, 693–707. [Google Scholar] [CrossRef]
- Shankar, V.; Inman, J.; Kelly, E.; Mantrala, M.; Rizley, R. Innovations in shopper marketing. J. Retail. 2011, 87, S29–S42. [Google Scholar] [CrossRef]
- McDaniel, S.W.; Rylander, D.H. Strategic green marketing. J. Consum. Mark. 1993, 10, 4–10. [Google Scholar] [CrossRef]
- Kennedy, A.M.; Kapitan, S.; Soo, M. Eco-warriors: Shifting sustainable retail strategy via authentic retail brand image. Aust. Mark. J. 2016, 24, 125–134. [Google Scholar] [CrossRef]
- Steenis, N.D.; van Herpen, E.; van der Lans, I.A.; Ligthart, T.N.; van Trijp, H.C.M. Consumer response to packaging design: The role of packaging materials and graphics in sustainability perceptions and product evaluations. J. Clean. Prod. 2017, 162, 286–298. [Google Scholar] [CrossRef]
- Magnier, L.; Schoormans, J.; Mugge, R. Judging a product by its cover: Packaging sustainability and perceptions of quality in food products. Food Qual. Preference 2016, 53, 132–142. [Google Scholar] [CrossRef]
- Perrini, F.; Castaldo, S.; Misani, N.; Tencati, A. The impact of corporate social responsibility associations on trust in organic products marketed by mainstream retailers: A study of Italian consumers. Bus. Strategy Environ. Bus. 2010, 19, 512–526. [Google Scholar] [CrossRef]
- Jones, P.; Comfort, D.; Hillier, D. Corporate social responsibility as a means of marketing to and communicating with customers within stores: A case study of UK food retailers. Manag. Res. News 2005, 28, 47–56. [Google Scholar] [CrossRef]
- Chkanikova, O.; Mont, O. Corporate supply chain responsibility: Drivers and barriers for sustainable food retailing. Corp. Soc. Responsib. Environ. Manag. 2015, 22, 65–82. [Google Scholar] [CrossRef]
- Goworek, H.; Fisher, T.; Cooper, T.; Woodward, S.; Hiller, A. The sustainable clothing market: An evaluation of potential strategies for UK retailers. Int. J. Retail. Distrib. Manag. 2012, 40, 935–955. [Google Scholar] [CrossRef]
- Yang, S.; Song, Y.; Tong, S. Sustainable retailing in the fashion industry: A systematic literature review. Sustainability 2017, 9. [Google Scholar] [CrossRef]
- Jones, P.; Hillier, D.; Comfort, D.; Eastwood, I. Sustainable retailing and consumerism. Manag. Res. News 2005, 28, 34–44. [Google Scholar] [CrossRef]
- Lai, K.; Cheng, T.C.E.; Tang, A.K.Y. Green retailing: Factors for success. Calif. Manag. Rev. 2010, 52, 6–32. [Google Scholar] [CrossRef]
- Tang, A.K.Y.; Lai, K.-H.; Chen, T.C.E. Unleashing the value of green retailing. In Proceedings of the Retailing the Second POMS-HK International Conference, Hong Kong, China, 6–7 January 2011. [Google Scholar]
- Gunn, M.; Mont, O. Choice editing as a retailers’ tool for sustainable consumption. Int. J. Retail. Distrib. Manag. 2014, 42, 464–481. [Google Scholar] [CrossRef]
- Thaler, R.H.; Sustein, C.R. Nudge Improving Decisions about Health, Wealth, and Happiness; Yale University Press: New Haven, CT, USA, 2008. [Google Scholar]
- Anderson, E.W.; Fornell, C.; Lehmann, D. Customer satisfaction, market share, and profitability: Findings from Sweden. J. Mark. 1994, 58, 53–66. [Google Scholar] [CrossRef]
- Schiffman, L.G.; Kanuk, L.L. Consumer Behavior, 9th ed.; Prentice Hall: Upper Saddle River, NJ, USA, 2007. [Google Scholar]
- Kianpour, K.; Anvari, R.; Jusoh, A.; Othman, M.F. Important motivators for buying green products. Intang. Capitol. 2014, 10, 873–896. [Google Scholar] [CrossRef]
- Rani, P. Factors influencing consumer behavior. Int. J. Curr. Acad. Rev. 2014, 2, 52–61. [Google Scholar]
- Agrawal, S.; Srikant, R. Fast algorithms for mining association rules. In Proceedings of the 20th International Conference on Very Large Data Bases (VLDB ’94), San Francisco, CA, USA, 12–15 September 1994; pp. 487–499. [Google Scholar]
- Han, J.; Pei, J.; Yin, Y. Mining frequent patterns without candidate generation. In Proceedings of the 2000 ACM SIGMOD international conference on Management of data, Dallas, TX, USA, 15–18 May 2000; pp. 1–12. [Google Scholar]
- Dubey, A.K.; Shandilya, S. A novel J2ME service for mining incremental patterns in mobile computing. Commun. Comput. Inf. Sci. 2010, 101, 157–164. [Google Scholar]
- Chen, M.S.; Park, J.; Yu, P. Efficient data mining for path traversal patterns. IEEE Trans. Knowl. Data Eng. 1998, 10, 209–221. [Google Scholar] [CrossRef]
- Yun, C.H.; Chen, M.S. Using pattern-join and purchase combination for mining web transaction patterns in an electronic commerce environment. In Proceedings of the 2000 ACM SIGMOD International Conference on Management of Data, Dallas, TX, USA, 15–18 May 2000; pp. 99–104. [Google Scholar]
- Farley, J.; Ring, L. A stochastic model of supermarket traffic flow. Oper. Res. 1996, 14, 555–567. [Google Scholar] [CrossRef]
- Alexander, A.A.; Muhlebach, R.F. Shopping Centre Management; Institute of Real Estate Management: Chicago, IL, USA, 1992. [Google Scholar]
- Chandon, P.; Hutchinson, J.W.; Bradlow, E.T.; Young, S.H. Does in-store marketing work? Effects of the number and position of shelf facings on brand attention and evaluation at the point of purchase. J. Mark. 2009, 73, 1–17. [Google Scholar] [CrossRef]
- Uotila, V.; Skogster, P. Space management in a DIY store analyzing consumer shopping paths with data-tracking devices. Facilities 2007, 25, 363–374. [Google Scholar] [CrossRef]
- Parsons, A.J. Assessing the effectiveness of shopping mall promotions: Customer analysis. Int. J. Retail Distrib. Manag. 2003, 31, 74–79. [Google Scholar] [CrossRef]
- Hjort, K.; Lantz, B.; Ericsson, D.; Gattorna, J. Customer segmentation based on buying and returning behaviour. Int. J. Phys. Distrib. Logist. Manag. 2013, 43, 852–865. [Google Scholar] [CrossRef]
- Rezaei, J.; Ortt, R. Multi-criteria supplier segmentation using a fuzzy preference relations based AHP. Eur. J. Oper. Res. 2013, 225, 75–84. [Google Scholar] [CrossRef]
- Röthlisberger, V.; Zischg, A.P.; Keilera, M. Identifying spatial clusters of flood exposure to support decision making in risk management. Sci. Total Environ. 2017, 598, 593–603. [Google Scholar] [CrossRef] [PubMed]
- Liao, H.; Zhang, X. Hesitant Fuzzy Decision Making Methodologies and Applications; Springer: Berlin, Germany, 2016. [Google Scholar]
- Jain, A.K.; Murty, M.N.; Flynn, P.J. Data Clustering: A Review. ACM Comput. Surv. 1999, 31, 264–323. [Google Scholar] [CrossRef]
- Faber, V. Clustering and the Continuous K-means s algorithm. Los Alamos Sci. 1994, 22, 138–144. [Google Scholar]
- Faber, V.; Hochberg, J.G.; Kelly, P.M.; Thomas, T.R.; White, J.M. Concept extraction—A data-mining technique. Los Alamos Sci. 1994, 22, 122–149. [Google Scholar]
- Wu, Z.; Xu, J. A consensus model for large-scale group decision making with hesitant fuzzy information and changeable clusters. Inf. Fusion 2018, 41, 217–231. [Google Scholar] [CrossRef]
- Anderberg, M.R. Cluster Analysis for Applications; Academic Press, Inc.: Cambridge, MA, USA, 1973. [Google Scholar]
- Yoon, Y.; Hastak, M.; Choc, K. Preference clustering-based mediating group decision-making (PCM-GDM) method for infrastructure asset management. Exp. Syst. Appl. 2017, 83, 206–214. [Google Scholar] [CrossRef]
- Wang, E.; Alp, N.; Shi, J.; Wang, C.; Zhang, X.; Chen, H. Multi-criteria building energy performance benchmarking through variable clustering based compromise TOPSIS with objective entropy weighting. Energy 2017, 125, 197–210. [Google Scholar] [CrossRef]
- Delaney, R.; Strough, J.; Parker, A.M.; de Bruin, W.B. Variations in decision-making profiles by age and gender: A cluster-analytic approach. Personal. Individ. Differ. 2015, 85, 19–24. [Google Scholar] [CrossRef] [PubMed]
- Dolnicar, S. Using cluster analysis for market segmentation—Typical misconceptions, established methodological weaknesses and some recommendations for improvement. Australas. J. Mark. Res. 2003, 11, 5–12. [Google Scholar]
- Gattorna, J. Dynamic Supply Chains: Delivering Value through People, 2nd ed.; Pearson Education Limited: London, UK, 2010. [Google Scholar]
- Allenby, G.M.; Rossi, P. Marketing models of consumer heterogeneity. J. Econ. 1998, 89, 57–78. [Google Scholar] [CrossRef]
- Syaekhoni, M.A.; Lee, C.; Kwon, Y.S. Analyzing customer behavior from shopping path data using operation edit distance. Appl. Intell. 2016. [Google Scholar] [CrossRef]
- Rousseeuw, P. Silhouette: A graphical aid to the interpretation and validation of cluster analysis. J. Comput. Appl. Math. 1987, 20, 53–65. [Google Scholar] [CrossRef]
- Rokka, J.; Uusitalo, L. Preference for green packaging in consumer product choices—Do consumer’s care? Int. J. Consum. Stud. 2008, 32, 516–525. [Google Scholar] [CrossRef]
- Schwepker, C.H., Jr.; Cornwell, T.B. An examination of ecologically concerned consumers and their intention to purchase ecologically packaged products. J. Public Policy Mark. 1991, 10, 77–101. [Google Scholar]
- Levy, M.; Weitz, B.A. Retailing Management; McGraw-Hill/Irwin: New York, NY, USA, 2004. [Google Scholar]
- Terrazas, M. In-Store Displays that Work. The Baker, [Online]. 2006. Available online: http://www.thebaker.co.za (accessed on 5 August 2008).
- Michon, R.; Chebat, J.C.; Turley, L.W. Mall atmospherics: The interaction effects of the mall environment on shopping behavior. J. Bus. Res. 2005, 58, 576–583. [Google Scholar] [CrossRef]
- Salazar, H.A.; Oerlemans, L.; van Stroe-Biezen, S. Social influence on sustainable consumption: Evidence from a behavioural experiment. Int. J. Consum. Stud. 2013, 37, 172–180. [Google Scholar] [CrossRef]
- Hartmann, P.; Apaolaza-Ibáñez, V. Consumer attitude and purchase intention toward green energy brands: The roles of psychological benefits and environmental concern. J. Bus. Res. 2012, 65, 1254–1263. [Google Scholar] [CrossRef]
Figure 1.
RFID tags, repeaters and readers in retail stores.

Figure 2.
Two channel RFID signals and position of cart.

Figure 3.
Customers’ shopping path clustering system.

Figure 4.
Silhouette coefficient plot by number of clusters (groups) for short group.

Figure 5.
Customers’ shopping patterns in short group.

Figure 6.
Silhouette coefficient plot by number of clusters (groups) for medium group.

Figure 7.
Customers’ shopping patterns in medium group.

Figure 8.
Silhouette coefficient plot by number of clusters (groups) for long group.

Figure 9.
Customers’ shopping patterns in long group.
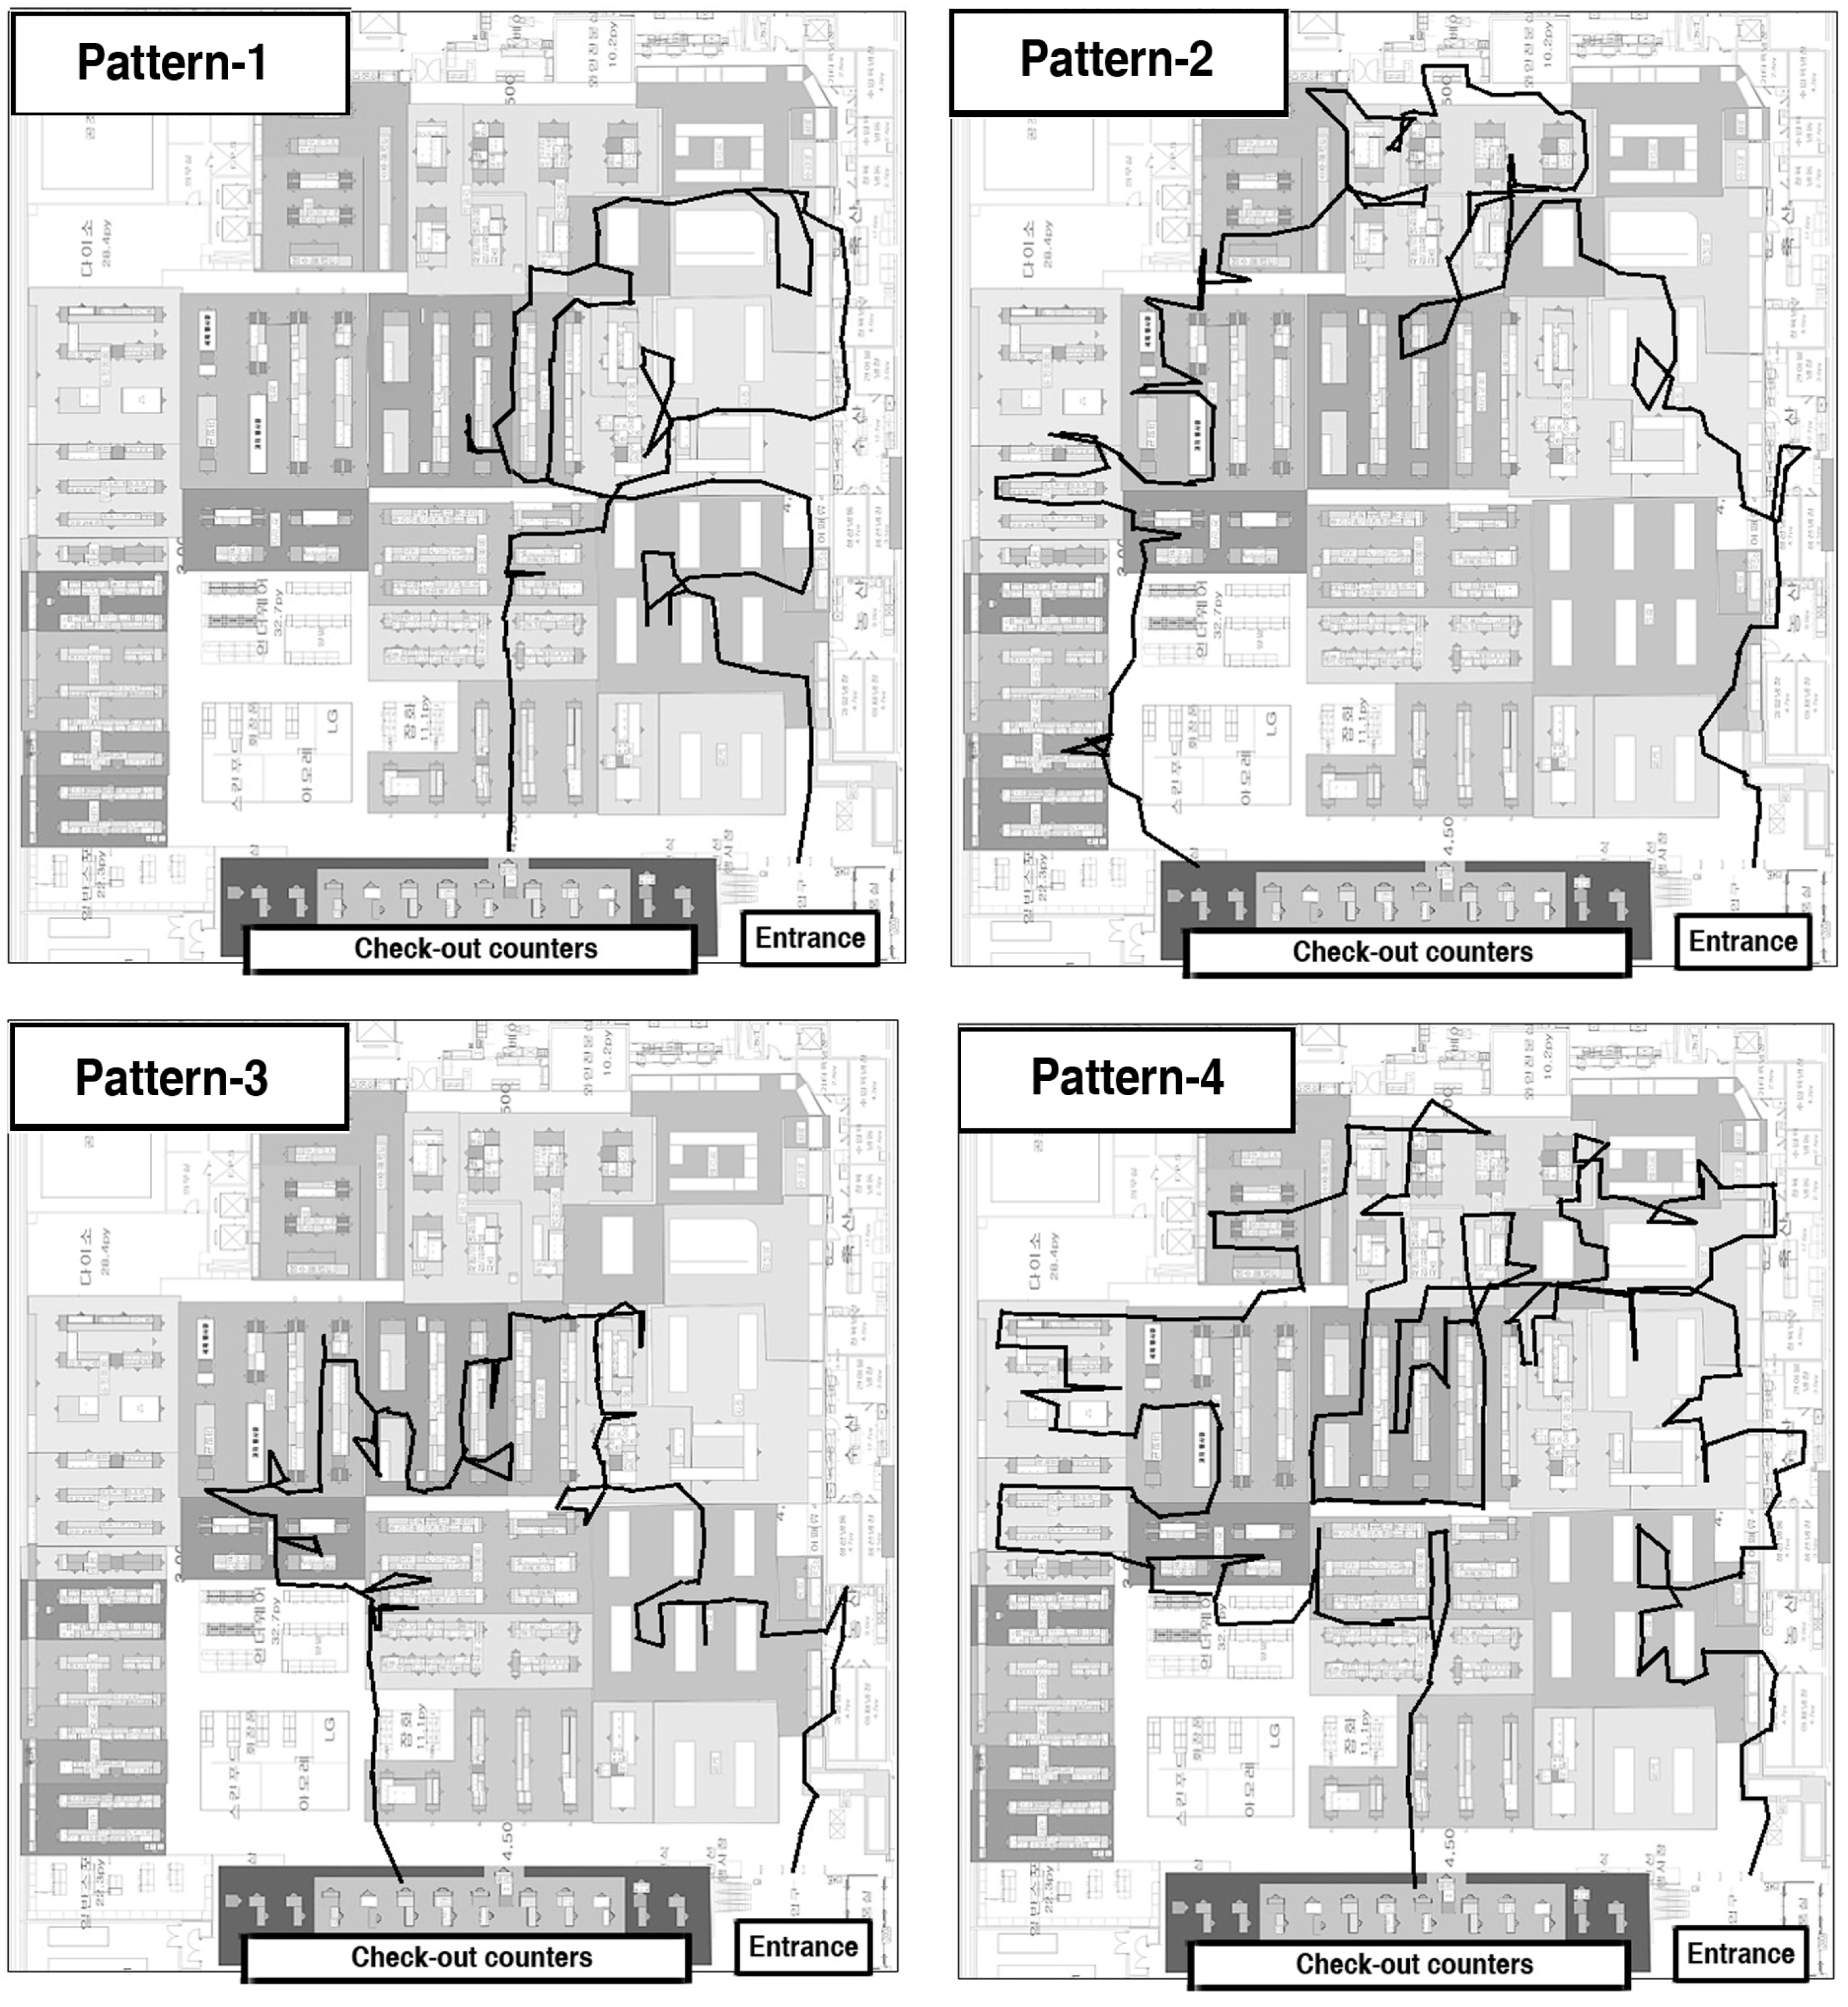
Figure 10.
Illustration of traffic in store.

Table 1.
Summary of four patterns in short group.
| Patterns | Size | Avg. Shopping Time (Min) | Avg. Lingering Time (S) | Avg. Sales (KRW) | Travel Direction | Avg. Product Purchased |
|---|---|---|---|---|---|---|
| Pattern 1 | 981 | 848 | 29.2 | 52,510 | Counter-clockwise | Groceries and snacks |
| Pattern 2 | 1290 | 843 | 25 | 51,211 | Counter-clockwise | Fruit, herbal tea and snacks |
| Pattern 3 | 1871 | 840 | 26.1 | 53,645 | Counter-clockwise | Agricultural products, dairy and fish |
| Pattern 4 | 1653 | 826 | 21.5 | 56,560 | Counter-clockwise | Vegetables, fruit, seafood and food seasoning |
Table 2.
Summary of five patterns in medium group.
| Patterns | Size | Avg. Shopping Time (Min) | Avg. Lingering Time (S) | Avg. Sales (KRW) | Travel Direction | Avg. Product Purchased |
|---|---|---|---|---|---|---|
| Pattern 1 | 1782 | 1697 | 28.3 | 58,756 | Counter-clockwise | Vegetables, snacks, cooked foods, instant foods |
| Pattern 2 | 1870 | 1707 | 34.7 | 65,277 | Counter-clockwise | Agricultural products, fish, meat |
| Pattern 3 | 1220 | 1703 | 25 | 57,305 | Counter-clockwise | Vegetables, snacks |
| Pattern 4 | 1097 | 1727 | 28.1 | 61,726 | Counter-clockwise | Vegetables, snacks |
| Pattern 5 | 1411 | 1709 | 37.8 | 62,805 | Clockwise | Vegetables, fruit, fish, dairy |
Table 3.
Summary of four patterns in long group.
| Patterns | Size | Avg. Shopping Time (Min) | Avg. Lingering Time (S) | Avg. Sales (KRW) | Travel Direction | Avg. Product Purchased |
|---|---|---|---|---|---|---|
| Pattern 1 | 636 | 3220 | 36.2 | 70,506 | Clockwise | Vegetables, fruit, fish, dairy and food seasoning |
| Pattern 2 | 780 | 3130 | 27.2 | 69,611 | Counter-clockwise | Vegetables, fruit, dairy, snacks and beverages |
| Pattern 3 | 737 | 3295 | 26.4 | 65,595 | Counter-clockwise | Vegetables, dairy, snacks and cooked foods |
| Pattern 4 | 878 | 3156 | 40.8 | 65,718 | Counter-clockwise | Vegetables, snacks, dairy, fruit, cooked foods and fish |
© 2017 by the authors. Licensee MDPI, Basel, Switzerland. This article is an open access article distributed under the terms and conditions of the Creative Commons Attribution (CC BY) license (http://creativecommons.org/licenses/by/4.0/).
Share and Cite
MDPI and ACS Style
Syaekhoni, M.A.; Alfian, G.; Kwon, Y.S. Customer Purchasing Behavior Analysis as Alternatives for Supporting In-Store Green Marketing Decision-Making. Sustainability 2017, 9, 2008. https://doi.org/10.3390/su9112008
AMA Style
Syaekhoni MA, Alfian G, Kwon YS. Customer Purchasing Behavior Analysis as Alternatives for Supporting In-Store Green Marketing Decision-Making. Sustainability. 2017; 9(11):2008. https://doi.org/10.3390/su9112008
Chicago/Turabian StyleSyaekhoni, M. Alex, Ganjar Alfian, and Young S. Kwon. 2017. "Customer Purchasing Behavior Analysis as Alternatives for Supporting In-Store Green Marketing Decision-Making" Sustainability 9, no. 11: 2008. https://doi.org/10.3390/su9112008
Note that from the first issue of 2016, this journal uses article numbers instead of page numbers. See further details here.