Article

A Hybrid RES Distributed Generation System for Autonomous Islands: A DER-CAM and Storage-Based Economic and Optimal Dispatch Analysis

by
Panagiotis Michalitsakos
1,
Lucian Mihet-Popa
2,* and
George Xydis
3
1
Heriot-Watt University, School of Engineering and Physical Sciences, Edinburgh Campus, Edinburgh EH14 4AS, UK
2
Faculty of Engineering, Østfold University College, Kobberslagerstredet 5, 1671 Kråkeroy, Norway
3
Department of Business Development and Technology, Aarhus University, Birk Centerpark 15, 7400 Herning, Denmark
*
Author to whom correspondence should be addressed.
Sustainability 2017, 9(11), 2010; https://doi.org/10.3390/su9112010
Submission received: 5 September 2017 / Accepted: 30 September 2017 / Published: 2 November 2017

Abstract

:
The possibility of replacing the existing autonomous thermal power plants by Distributed Energy Resources (DER) based on renewable energy sources (RES), along with the appropriate energy storage technologies in order to deal with the major problems that autonomous islands usually face was investigated. A case study of a small Greek island, which is confronted by various energy and water shortages, was studied for assessing the feasibility of DER deployment. The main objectives investigated were cost minimization, CO2 emissions minimization and DER reliability maximization. The DER-CAM (Distributed Energy Resources Customer Adoption Model) decision support tool was used for the multi-objective analysis conducted, which proposes a set of optimal solutions defining the appropriate Distributed Generation (DG) technologies, the capacities of storage and other technologies and the optimal dispatch of the DG system. A mutual beneficial solution, for all stakeholders, was proposed indicating the scope for developing such systems for all islands facing the same problems.

1. Introduction

The aim of this study was to deal with the major problems that autonomous islands face (specifically, non-interconnected Greek islands). The possibility of replacing the existing autonomous power plants with RES-based local units along with the appropriate energy storage technologies was investigated. The exploitation of the abundant renewable energy resources of the Aegean Archipelagos area is expected to lead to a cleaner and less expensive alternative to the existing oil-dependent electricity generators.
The DER-CAM (Distributed Energy Resources Customer Adoption Model) decision support tool is used for multi-objective planning optimization of RES-based Distributed Energy Resources (DER) [1]. In order to find optimal DER investments, three main scenarios are considered:
  • Economical optimization, so as to minimize the cost of operation and on-site generation
  • Environmental optimization, so as to minimize CO2 emissions (100% autonomous operation)
  • A weighted objective that simultaneously considers the above criteria
The above scenarios are evolved under various perspectives of the stakeholders. By running the DER-CAM optimization model, the following aspects are addressed:
  • Cost-optimal configuration of Renewable Energy Technologies (RETs)
  • Appropriate level of installed capacity
  • How installed capacity can be operated.
Tilos Island belongs to the island complex of Dodecanese, on the southeastern part of the Aegean Sea, and is interconnected with the grid of Kos and Kalymnos Islands via an underwater sea-cable. Kos and Kalymnos are non-interconnected with the mainland grid and have installed a thermal plant of 120.05 MW capacity, which covers their demand and feeds a small cluster of nine islands.
The project’s main goal is to demonstrate the potential of local/small-scale battery storage to serve a multi-purpose role within an island micro-grid that also interacts with a main electricity network. Among others, the project aims to achieve large-scale RES penetration and asset value maximization through the optimum integration of a hybrid RES (wind and PV) power station together with advanced battery storage, distributed, domestic heat storage, smart metering and DSM.
The data that were used in the study are based on either estimations or measurements that have been conducted for the project needs. Data on load demand and power outages for Tilos Island were provided to the first author of the paper under the frames of the Heriot Watt MSc in Energy program in order to conduct his MSc thesis [2]. Supplementary data such as ambient temperature or other missing data were assumed. Since data for 2013 regarding load demand were obtained, it was assumed that practically for such a small island, no significant changes are expected.

2. Literature Review

Much work has been done in the field, especially by using DER-CAM as an optimization microgrid tool. A number of hybrid RES-based DG systems are studied including storage facilities being interconnected with the local grid or not. Momber et al. [3] used the tool to examine the viability of a system composed of an Electric Vehicle (EV) and a building’s energy management system. The study showed that the implementation of such a concept could be beneficial for both the end-user and the grid. Another study following after this one, focused on EVs and the buildings’ demand working on decision support and scheduling problems [4]. Mendes et al. pointed out that DER-CAM is the appropriate tool to be used when it comes to microgrid simulations in comparison to other available tools, due to the robust and flexible three-level optimization algorithm the tool uses [5]. A detailed storage and economic analysis exploiting the natural synergy with the buildings’ demand was implemented by Beer et al. [6]. The researchers concluded that the battery usage shall be optimized by installing battery packs in the buildings’ microgrids. Optimization of thermal storage systems via the use of DER-CAM under various economic and climate conditions was also studied by DeForest et al. [7], while CHP systems [8] and reduced greenhouse emissions in shopping centers [9] were also approached by the utilization of the tool.
However, significant work has been published on the design and operation optimization of DER through the multi-objective approach, without the utilization of the DER-CAM tool. Alarcon-Rodriguez et al. [10] published a detailed state-of-the-art work, presenting novel methods that have been proposed so far, discussing the trends, challenges and all the latest developments in the area. Ren et al. [11] followed the multi-objective approach focusing more on the economic and environmental aspects similar to the case of DER-CAM. DER is linked with smart grids and multi-objective optimization, and significant work has been published to illustrate this [12,13]. Works on measurements and innovative communication systems have also been published in correlation with the multi-objective approach [14,15,16,17,18].

3. Methodology

The objective of the model was to minimize the cost of the on-site generation and the Combined Heat and Power (CHP) systems during operation, either for individual customer sites or a microgrid. In other words, the focus of this work was predominantly economic.
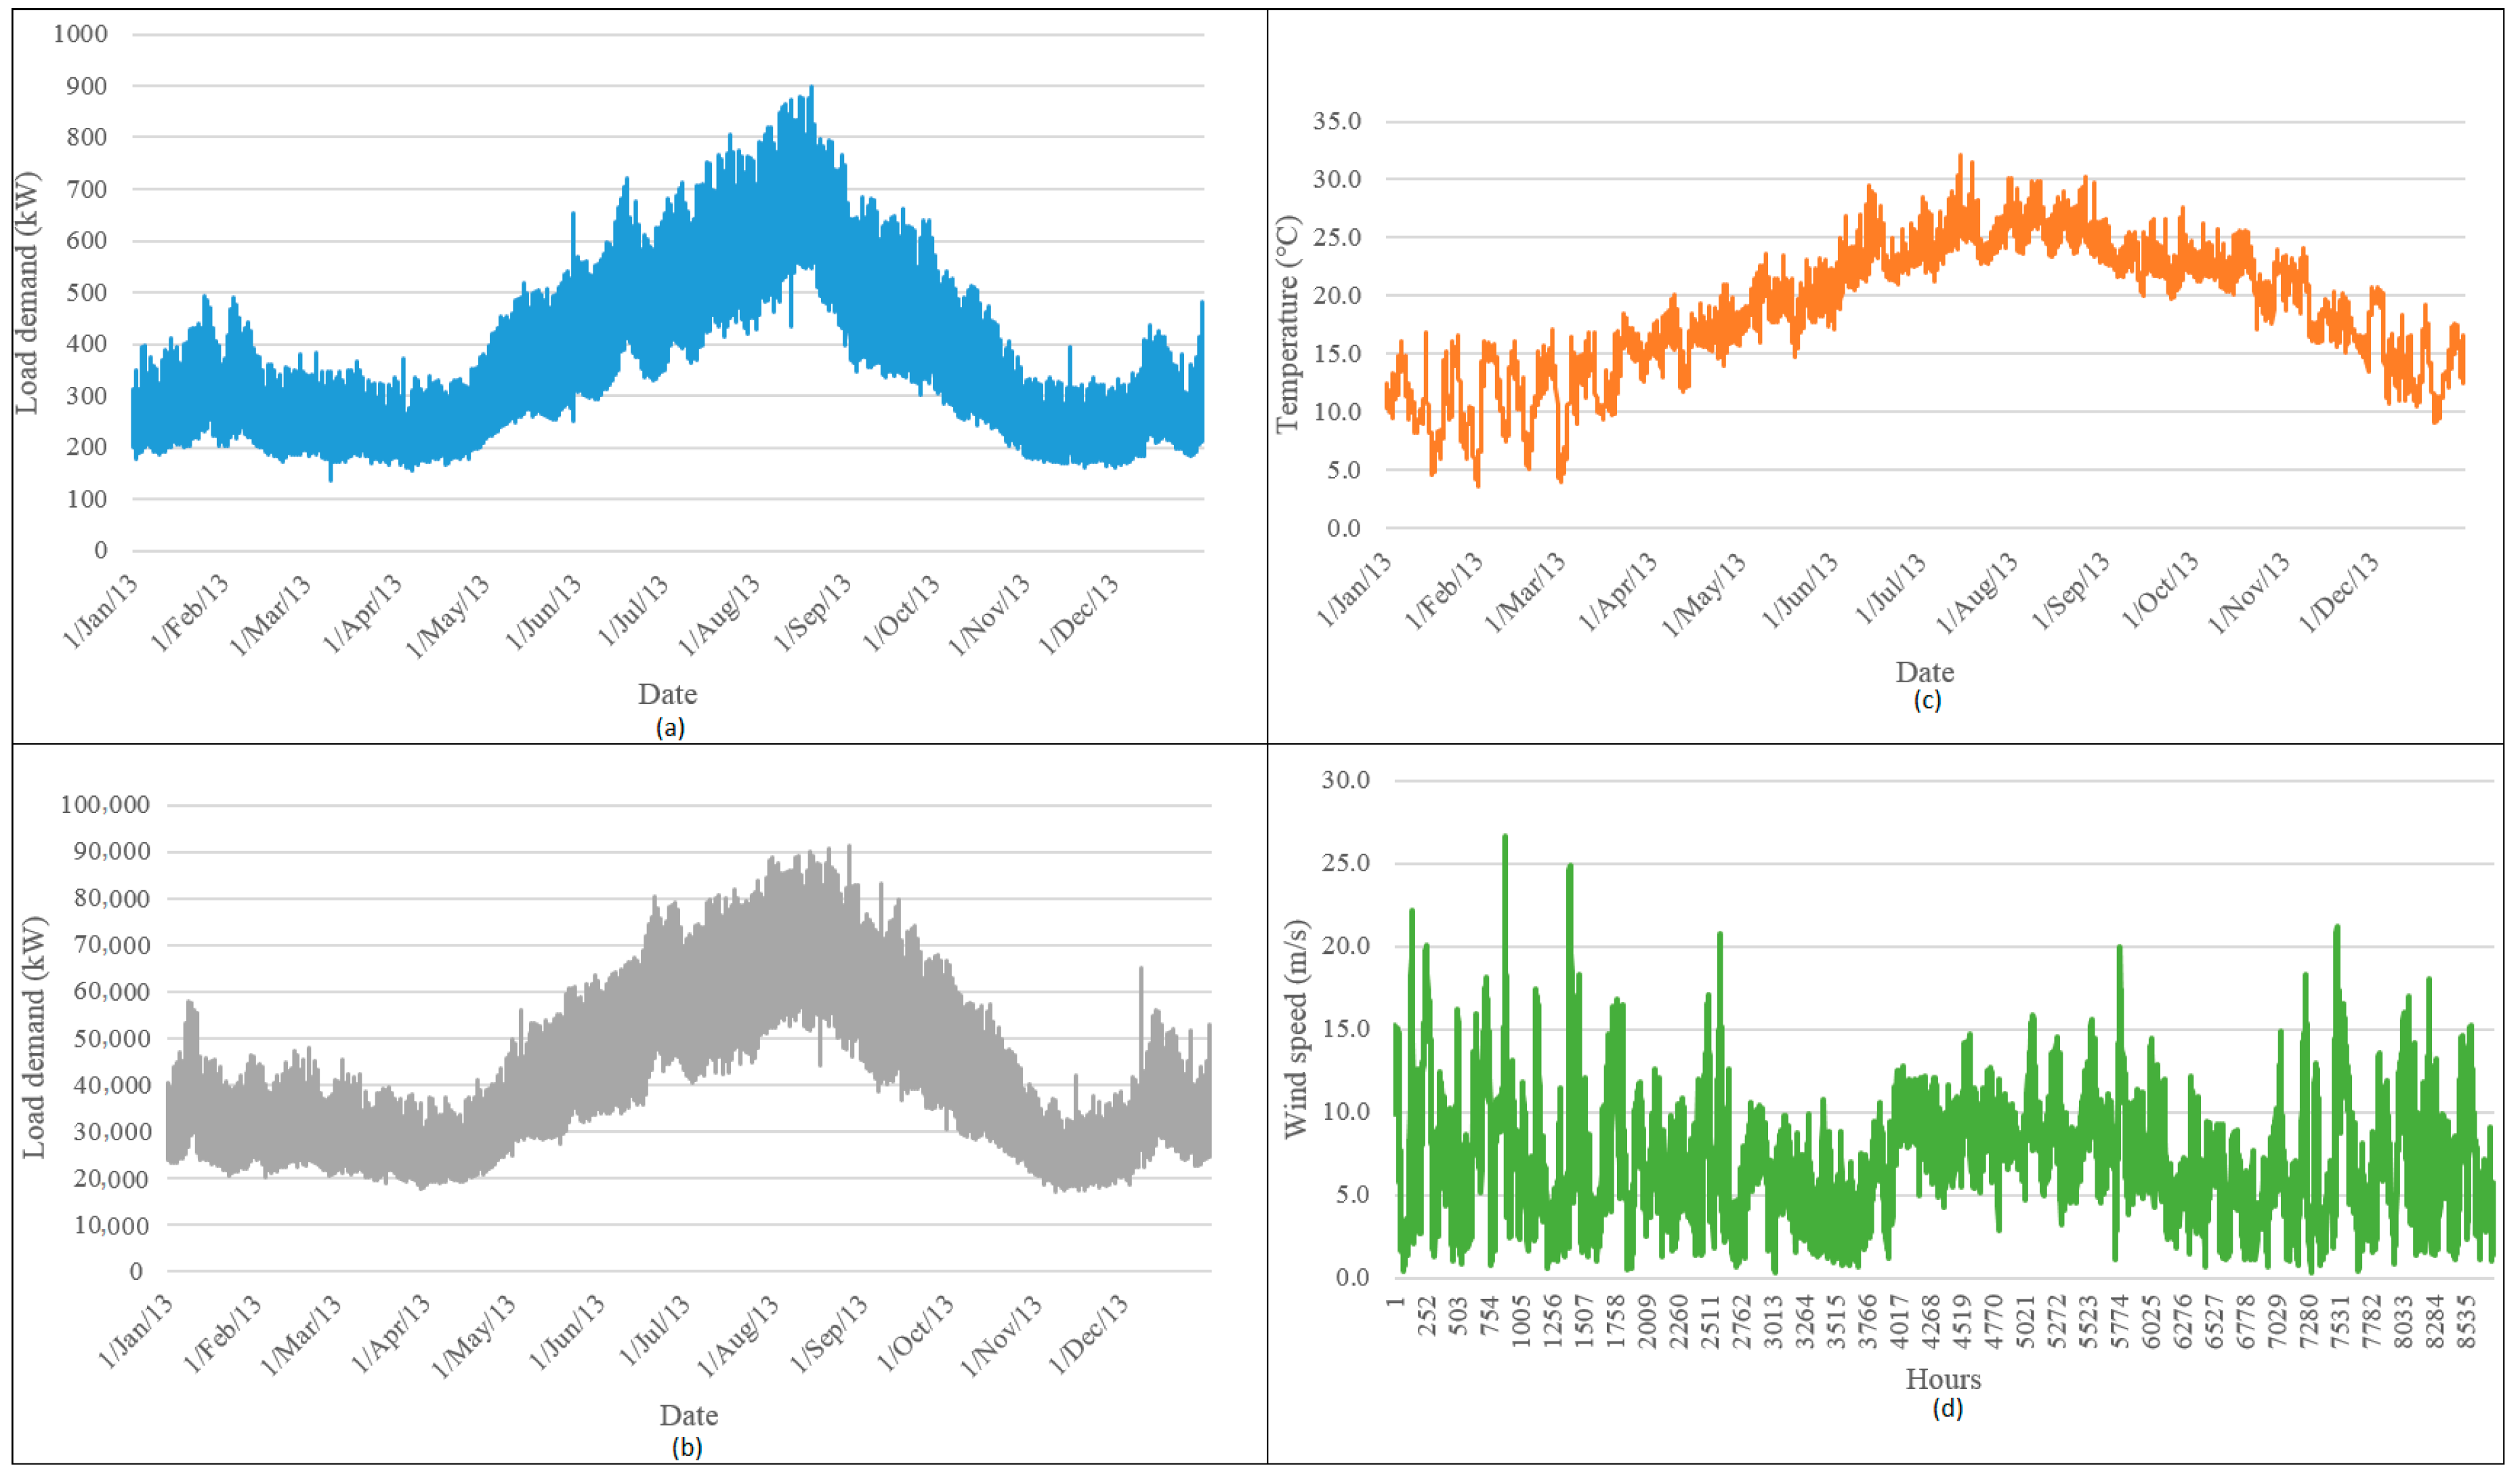
The load profile of Tilos Island was one of the key inputs of the DER-CAM optimization process. DER-CAM considers the load demand as the hourly average value per month, defined over three different day types: week days, weekend days and peak days. Figure 1 shows the load profile of Tilos Island (a), the load profile of the 9-island complex (b), the average annual ambient temperature (c) and the wind speed measurements for Tilos Island (d).
The load profile for the entire island complex helps us to acquire a comprehensive overview of the local power grid as a whole. This was used for creating time bands during a day and thus enabling the time of use rates. The time bands are defined by three time categories: peak, mid-peak and off-peak hours. The ambient temperature is correlated with the efficiency of photovoltaic and solar thermal panels and was used as the input to calculate the power generation produced by photovoltaic panels. A wind measurement mast has been installed on Tilos Island, so that the local wind potential can be measured. Although the wind speed values cannot be used directly as input to DER-CAM, they are used for computing the theoretical power output.
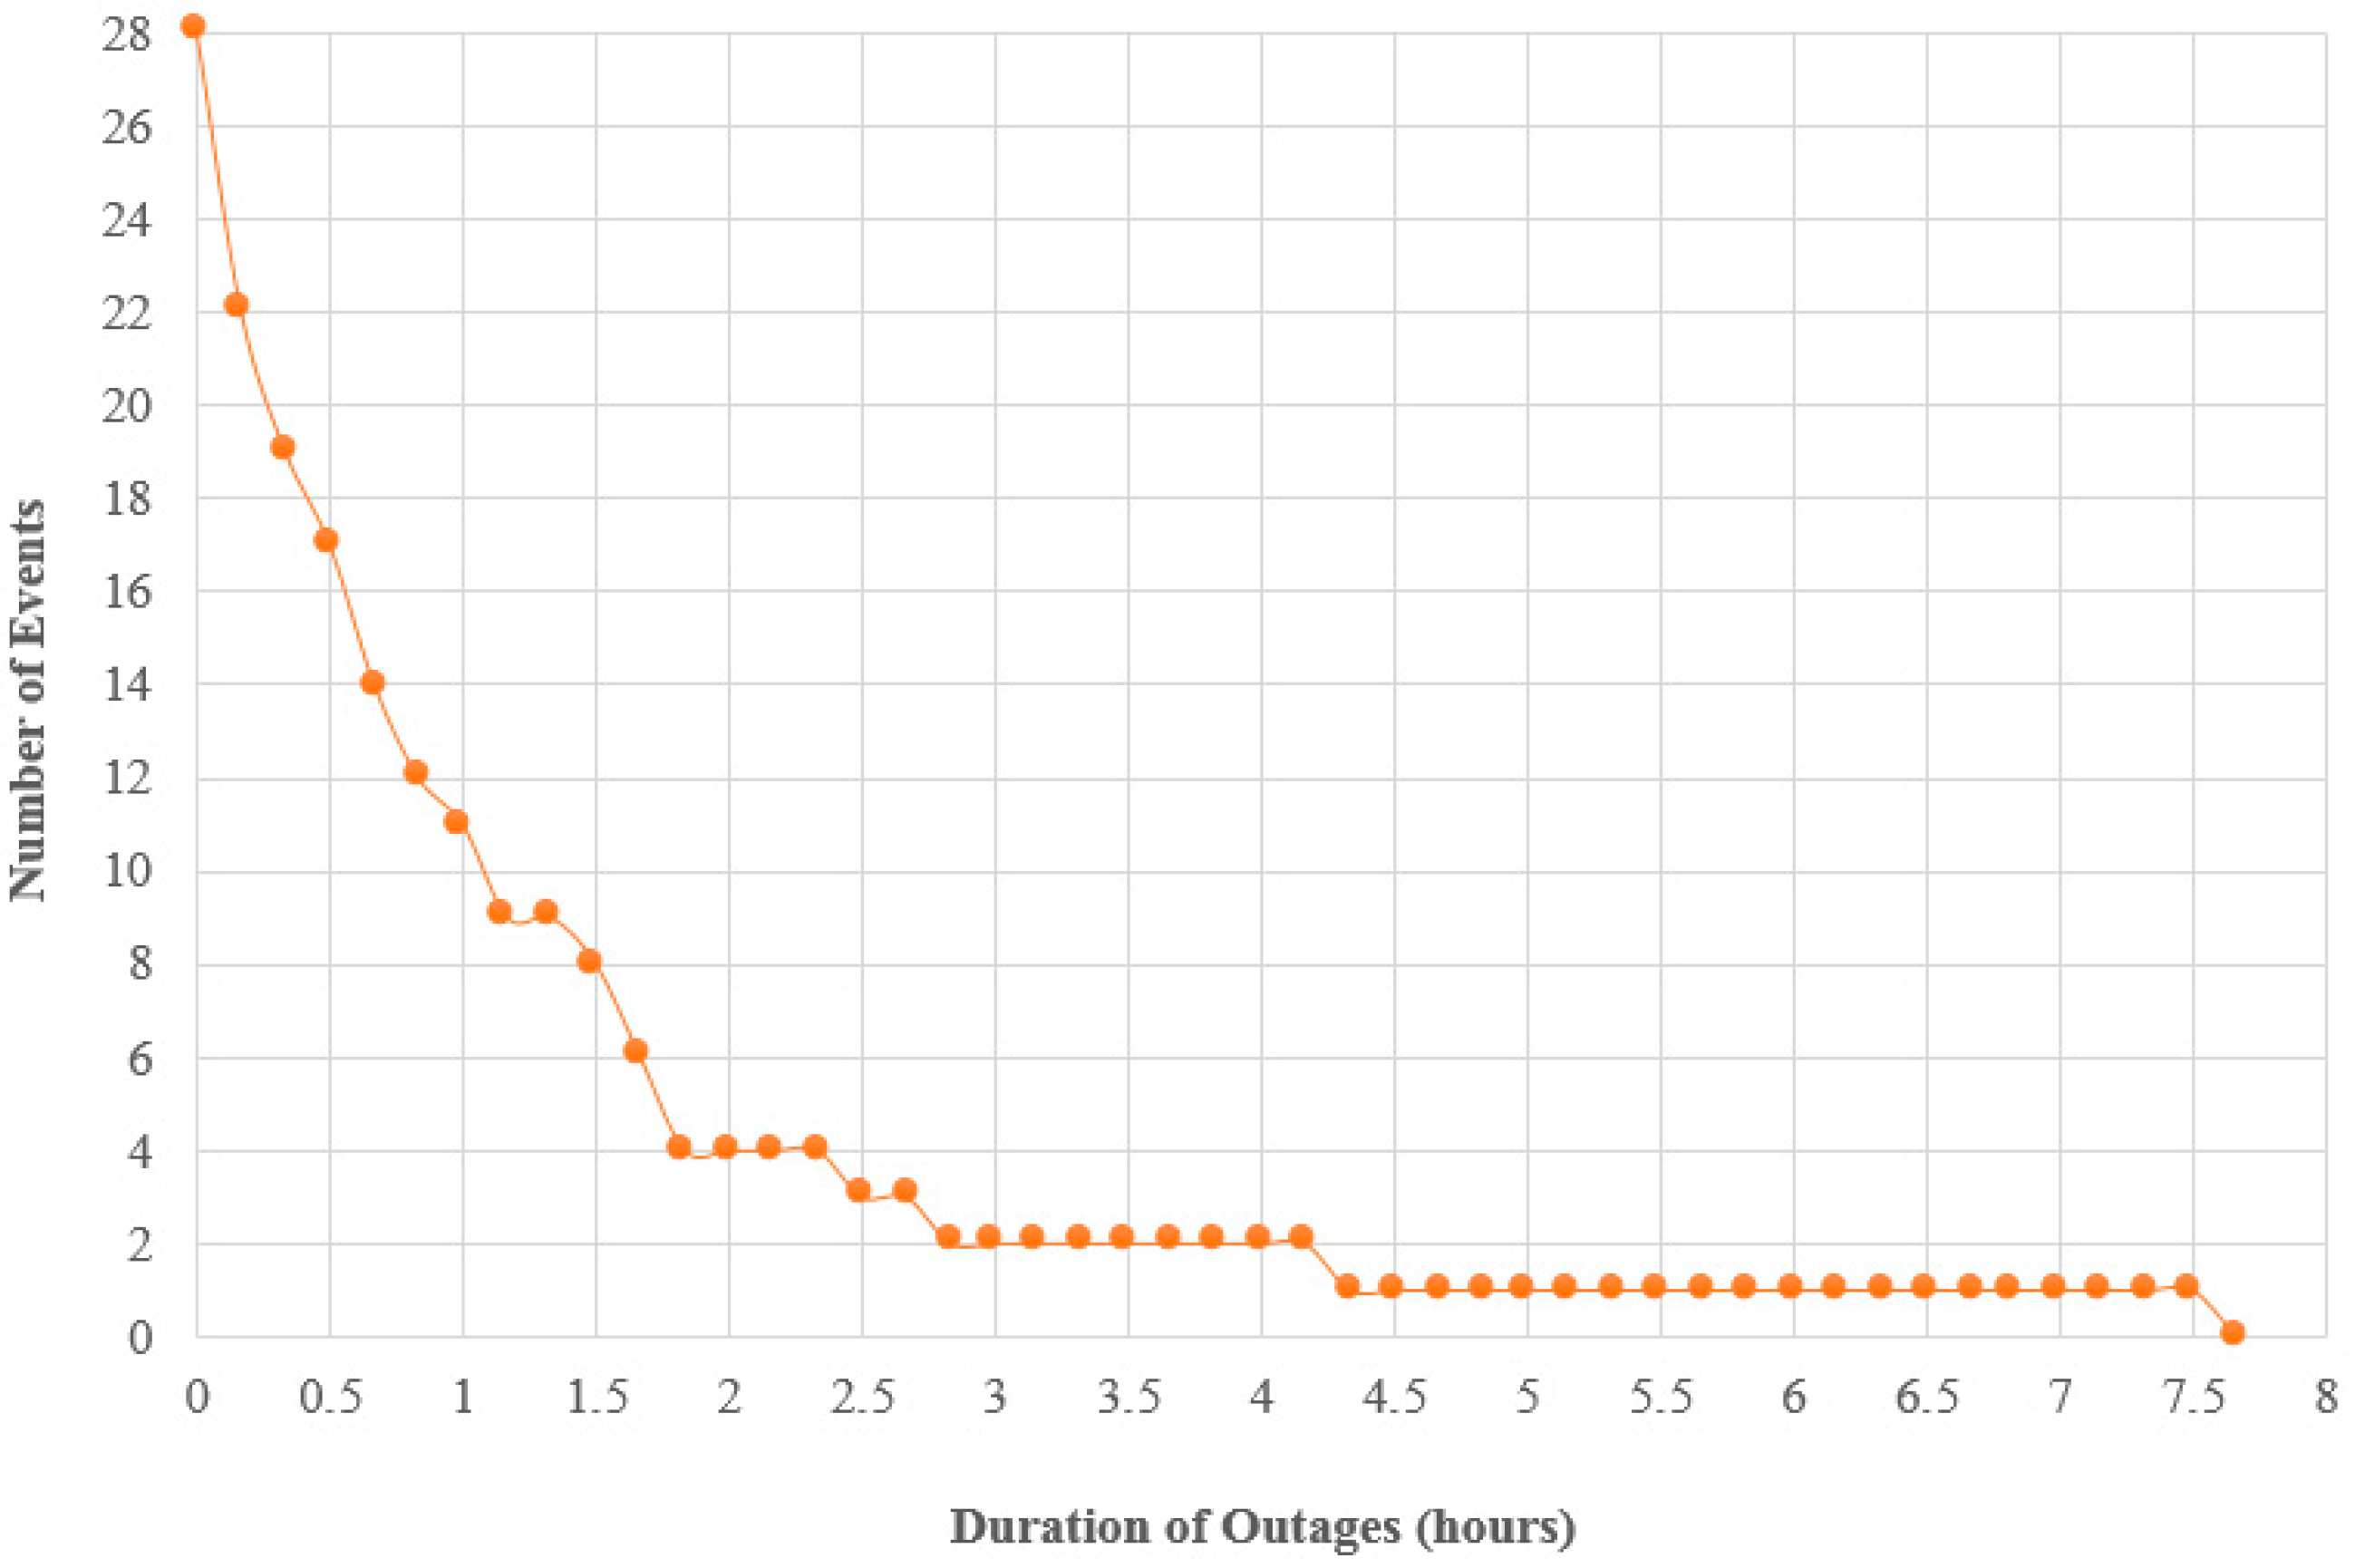
One of the most important reasons behind this study was the issues confronted by the islanders in relation to the power cuts and low quality of power offered, which have an immediate impact on the local businesses and daily life. A great number of power interruptions is commonplace for the islanders (Figure 2).
The number and the duration of grid outages can be modelled in DER-CAM using the corresponding number of days (emergency days).
For the multi-objective problem of DG optimization from the DER developer perspective, the main objective is clearly economic, aiming at maximizing the profits. On the one hand, the Distribution System Operator (DSO) is interested in reducing grid losses and postponing investments related to the network’s enhancement. On the other hand, local communities are interested in the power quality, as well as the level of autonomy that they can achieve. The final goal of this study was to find the best solution for each stakeholder individually, resulting in a compromise solution, beneficial for all stakeholders (win-win solution).
For the needs of this research, Tilos Island is considered a microgrid as a whole, with active energy management for both DERs and the distribution network available, so as to achieve optimum energy dispatch. The existing situation was defined, and the reference costs and CO2 emissions were taken into account. The load demand in the format of hourly load profiles per month, for three different day-types (week, weekend and peak), was set. The loads were defined as the following types: electricity-only, electric cooling, electric refrigeration, space heating, water heating and natural gas. Electric cooling and electric refrigeration loads were considered as electricity-only loads, since no detailed information was available. Utility electricity tariffs were also defined accordingly in the tool. Therefore, the marginal electricity generation cost of the entire 9-island complex, plus CO2 taxes, is defined as electricity rates and is inserted into the corresponding field.
In order to take advantage of the feature of DER-CAM, regarding the optimal electricity dispatch output and the marginal cost of electricity generation, CO2 taxes included, these have been converted to ToU (time of use) rates. The time categories that have been defined on a seasonal basis are: peak, mid-peak and off-peak hours, using the list of hours table. Power demand charges and utility monthly access fee were not considered. Based on the Energy Package, which aims at reducing the EU’s greenhouse gas emissions by 20% in 2020 (compared to 1990) [10] and the national decisions, the CO2 allowance price was set at 4 €/tn [11,19].
The available generation and storage technologies in the tool are divided into two categories: discrete and continuous. The optimal capacity of discrete technologies is determined as a discrete number of units, whereas the capacity of continuous technologies is determined by a continuous variable. The rated wind energy capacity chosen was 50 kW in order to give flexibility in the design process. The capital cost of a 50-kW wind turbine was set at 65,000 € including installation costs, while the fixed annual maintenance cost per generator was set at 975 € and the variable wind generator maintenance cost at 0.0022 € per kWh produced. From the continuous generation technologies, PV seems to be appropriate because of the abundant solar radiation, together with electric storage based on batteries. The variable investment cost for PV technology was set at 1100 €/kW installed, and the fixed operational and maintenance cost was set at 0.92 €/kW, while for the batteries, the relative costs were 1000 €/kWh and 0.83 €/kWh respectively [2,20,21,22,23,24,25,26,27].
Furthermore, the maximum charge/discharge rate of the batteries was defined at 33% and the minimum stage of charge 10% of the total capacity, with a discrete capacity size of 22.5 kWh/unit.
Furthermore, load curtailment energy management techniques have been considered when the utility is unavailable and the microgrid is in forced islanding mode. If the energy demand is greater than the local generation capacity and available storage, a percentage of the load will necessarily be curtailed. This is done with respect to the cost to the microgrid, which is associated with the loss of service. Demand management techniques were not taken into account; planning optimization was not seen from the end-user viewpoint. Although in Greece, the DSO is not bound to any compensation due to energy supply interruptions, in some countries, this is an important matter. In order to estimate this cost, the Interruption Cost Estimate (ICE) Calculator on-line tool (Table 1) was used [12].
The System Average Interruption Frequency Index (SAIFI), System Average Interruption Duration Index (SAIDI) and Customer Average Interruption Duration Index (CAIDI) are reliability indicators of the distribution system (Equations (1)–(3)) [13]:
S A I F I = i λ i   N i i   N i   ( times / customer × year )
S A I D I = i U i   N i i   N i   ( hours / customer × year )
C A I D I = i U i   N i i U i   N i   ( hours / event )
where λi is the failure rate of load point i, Ni is the quantity of customers and Ui is the yearly interruption hours of load point i. In this case, i is Tilos Island, λ was 30 interruptions, N was 790 inhabitants and U was approximately 45 h during 2015. According to Eurostat official data [14], the electricity consumption per capita in the residential sector in Greece, in 2013, was 1.6 MWh. Furthermore, according to the last population census conducted in 2011 by the Hellenic Statistical Authority, the population of Tilos Island was 790 residents.
Assuming that each household consists of 4 persons, the residential customers are approximately 200, and the total residential consumption is about 790 × 1.6 = 1264 MWh/year. As the annual energy consumption of Tilos Island was 2936 MWh, the rest of the energy demand from small Commercial and Industrial (C&I) customers was: 3209 − 1264 = 1945 MWh.
Taking into account the interruption parameters listed in Table 2, the following results are obtained (Table 3).
Commercial activities on the island are not significant. Most of the companies are commercial companies with low turnover, which employ less than ten employees. As already mentioned, estimating the interruption costs is a very complex task that often requires visiting the site in order to understand the impacts that a power cut can create. In order to take into consideration the costs related to outage events and to investigate the resilience of the system, assumptions regarding the maximum Curtailment Rate (CR) and the variable costs were taken into account as in Table 4.
Once all input parameters have been updated, the run optimization is launched in order to establish the reference costs and CO2 emissions. Subsequently, after adding 1% to these values, which is the default solver precision, the reference costs and CO2 emissions are determined to be the global settings, and various economic, environmental and other constraints related to investments preferences are set. At this stage, one can enable or disable investments to be discrete and continuous DG technologies, sales from conventional technologies and/or photovoltaics, to determine the interest rate and the maximum Payback Period (PBP) and, finally, to determine the preferred objective.

4. Results and Discussion

The process is launched, and the reference costs and CO2 values, as well as data about outage events are shown in Table 5 and Table 6.
The annual average electricity generation cost is 147.11 €/MWh. It can been seen that the corresponding total annual cost is 472.16 k€, while the cost regarding the power interruptions has been estimated to be almost the same, 440.57 k€ (48%) of the total annual energy costs for the year 2015. As reported, for this year, the System Average Interruption Frequency Index (SAIFI) was 30 events per customer, with an average duration (CAIDI) of 1.5 h per event. High interruption costs derive from the fact that Tilos Island is subjected to many outage events, during which all priority loads are cut off.
Given that the average load demand of Tilos Island was 370 kW, the CAIDI was 1.5 h per event, the high priority load is 20% of the total demand, the minimum state of charge is 10% of total capacity of batteries and the depth of discharge is set to 40% for normal operation so as to achieve a longer life cycle, the minimum required energy of the battery bank, in order to cover the high priority load in the case of an outage lasting 1.5 hours, is calculated from Equation (4).
E = A n n u a l   a v e r a g e   l o a d   d e m a n d × h i g h   p r i o r i t y   l o a d   ( a s   s h a r e   o f   t o t a l ) × C A I D I f u l l   S O C ( D O D   s e t   p o i n t + min S O C )
where SOC is the State Of Charge and DOD the Depth Of Discharge. In this case, the minimum capacity of the battery bank has been set at 225 kWh. After the investment analysis, the following results (Table 7) overview was obtained.
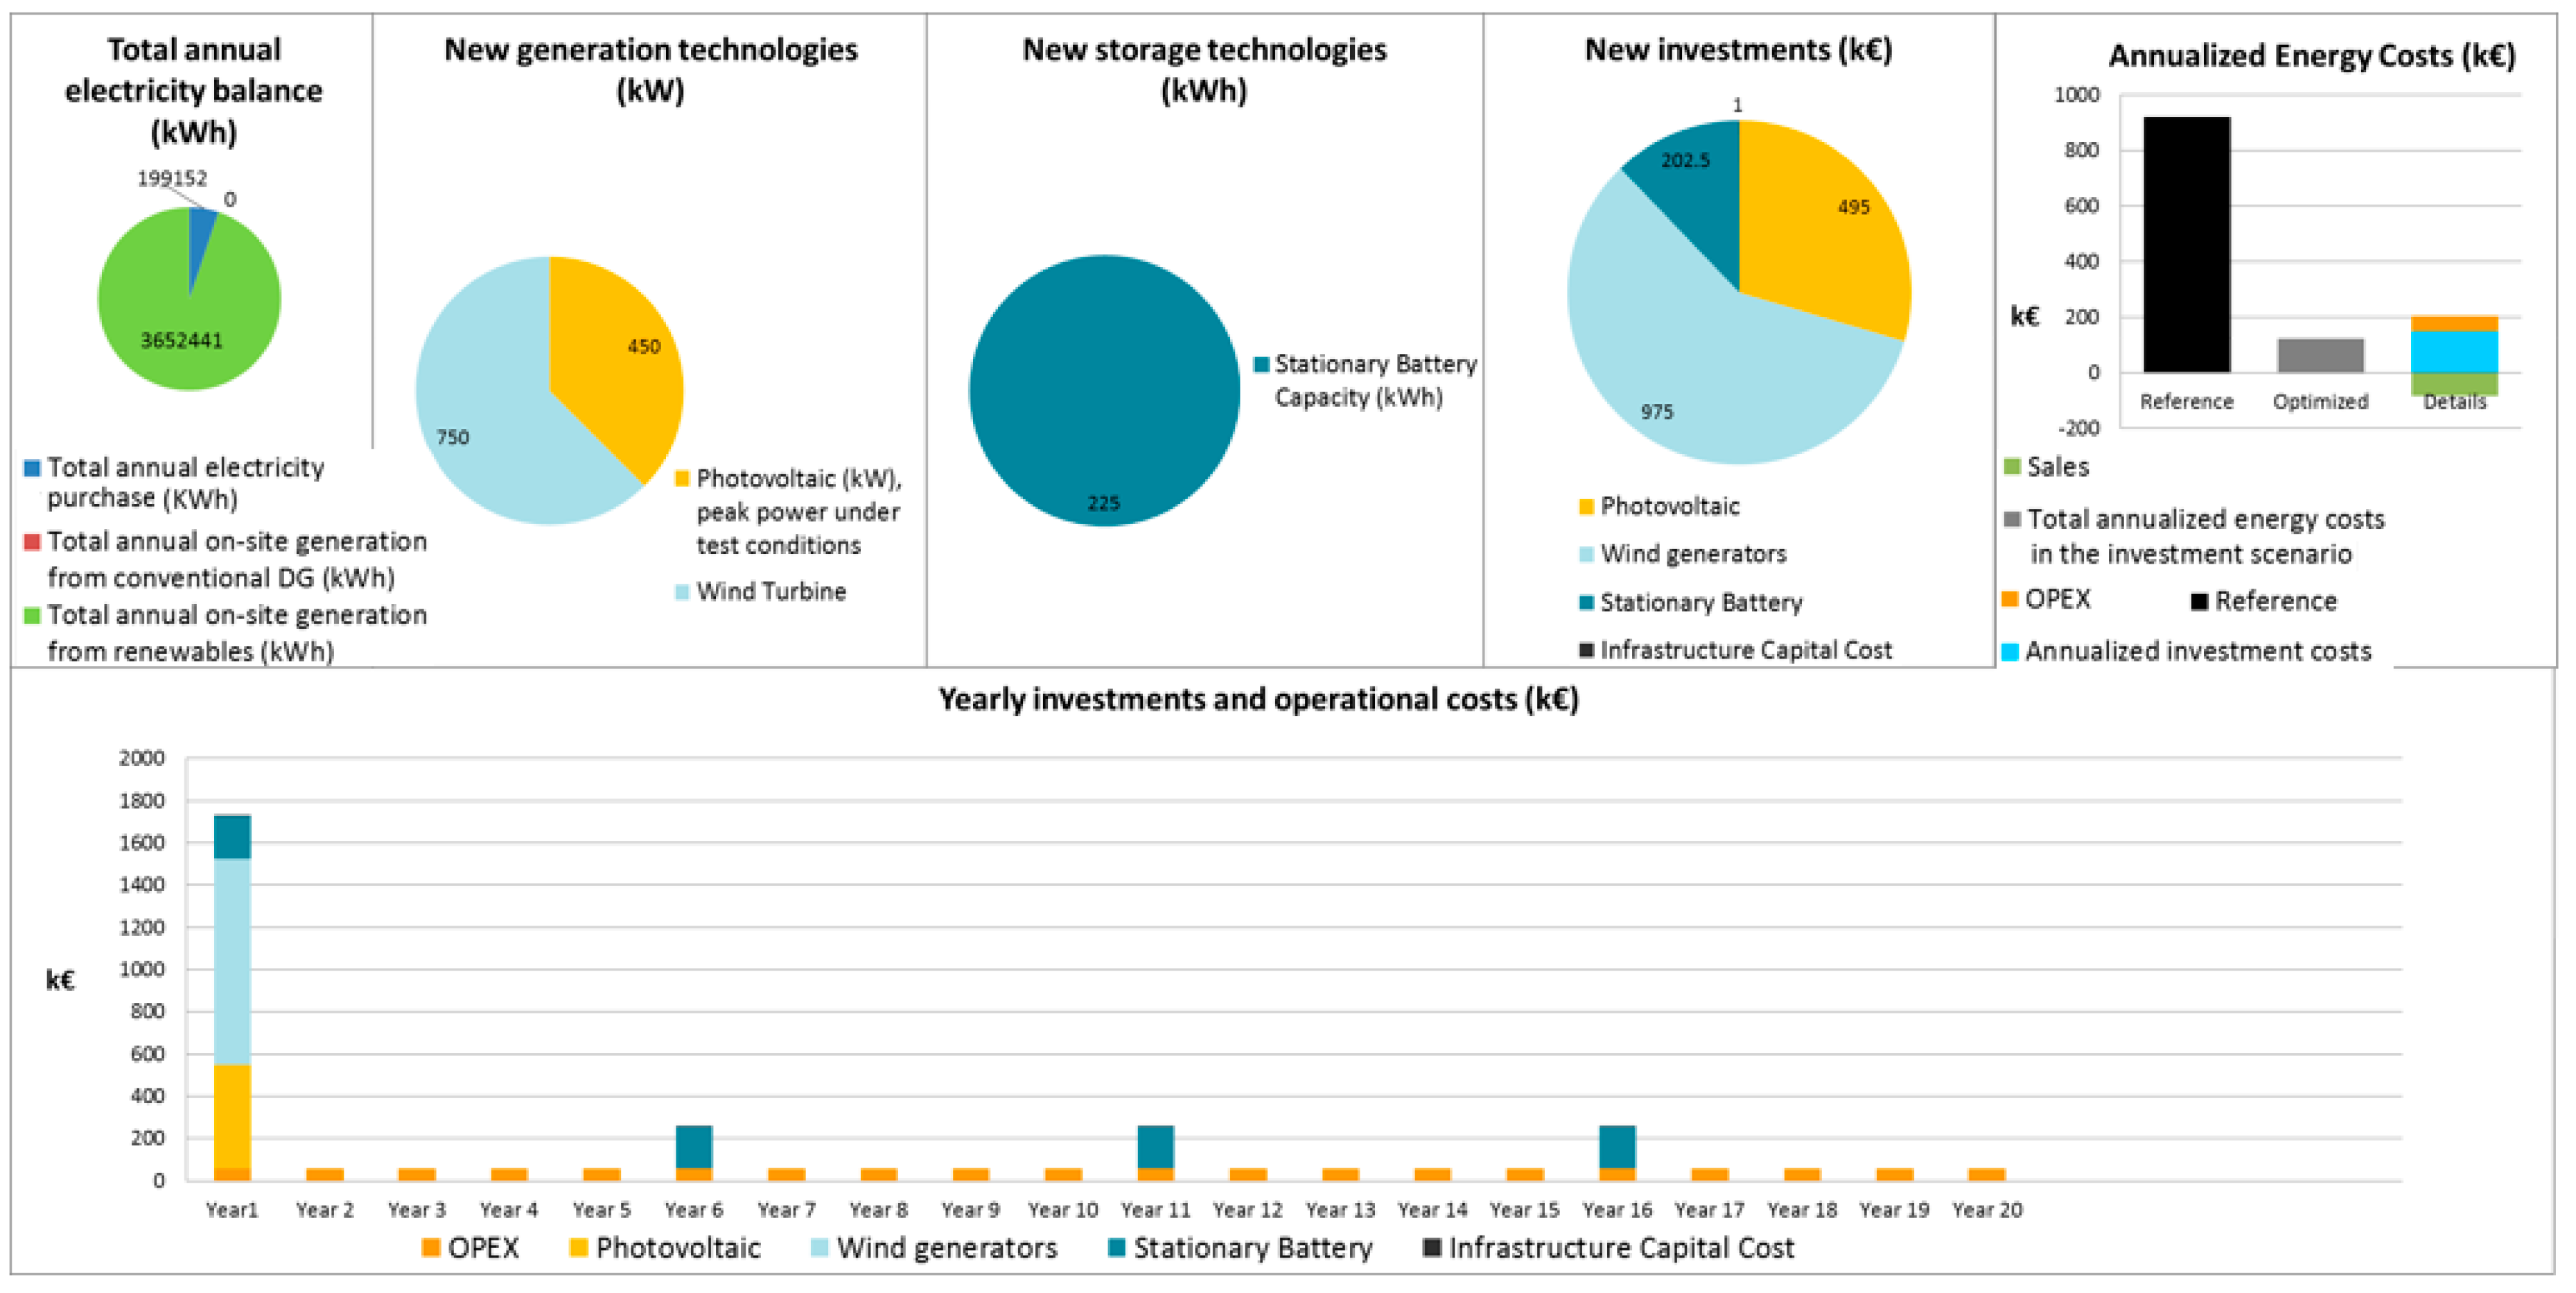
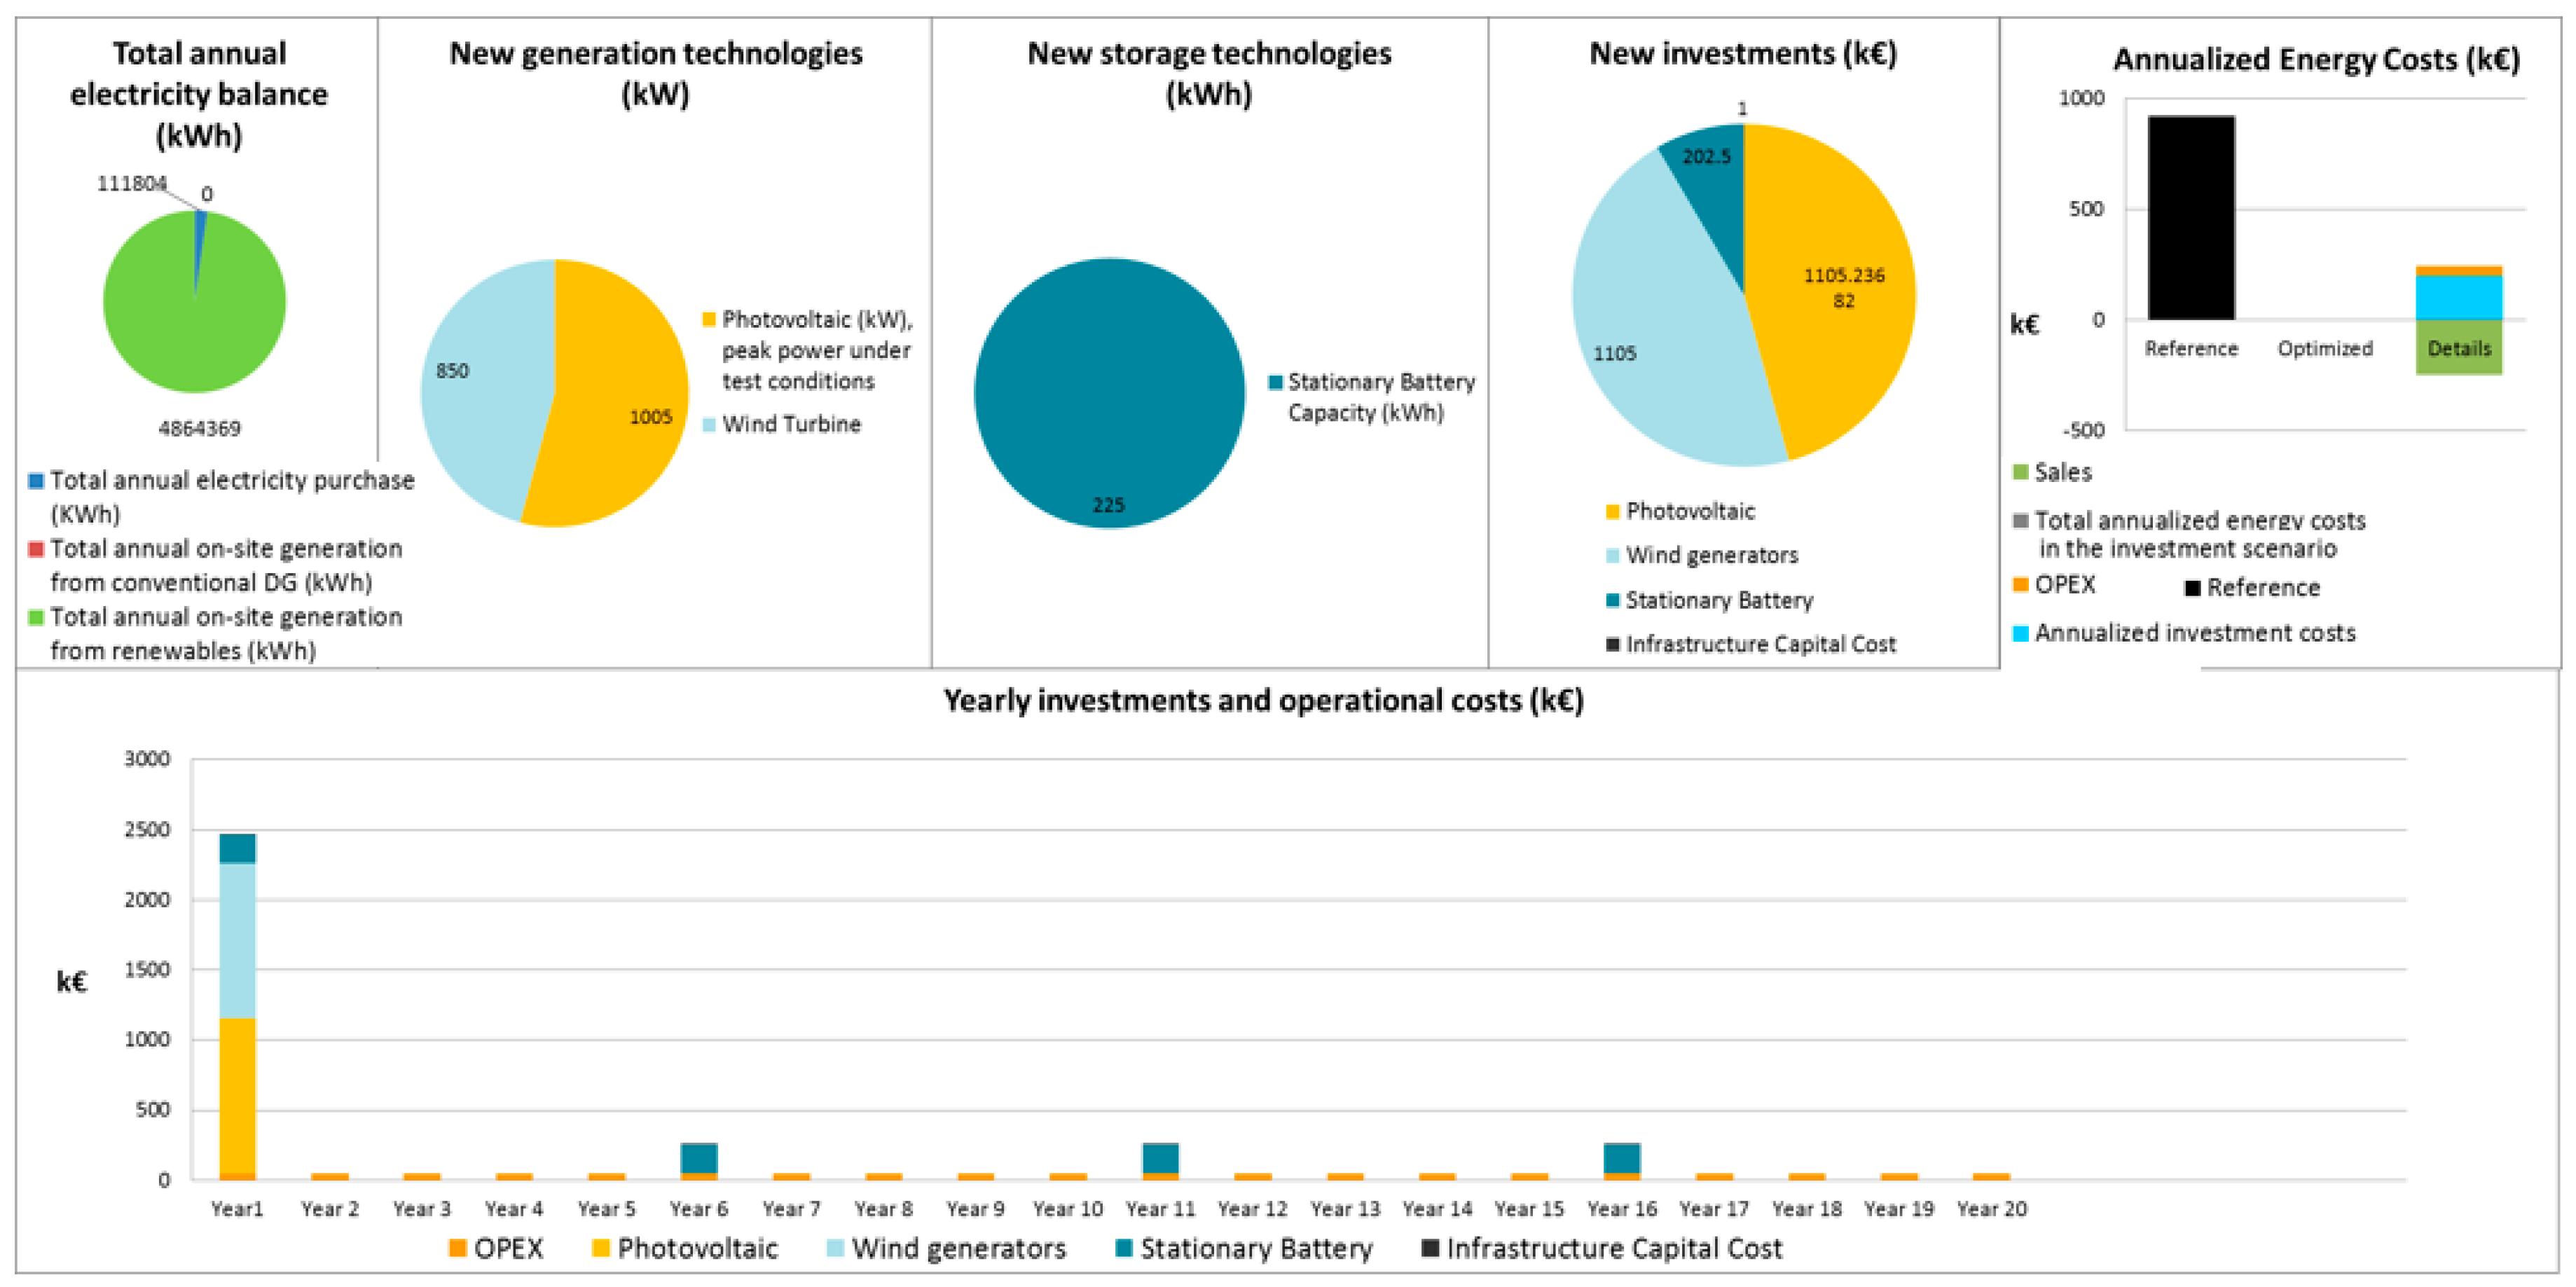
As expected, the operational expenses have been drastically decreased compared to the reference case. In addition, even if the annual capital depreciation is included, again, the cost is much lower. The cost optimal solution involves a high capacity of PV generators and wind turbines (Figure 3). The high capacity of wind turbines may bring several technical impacts to the local distribution network. Thereafter, constraints regarding land use were set (Table 8), and the cost minimization process was performed once again.
Although a slight decrease is observed, both total and OPEX savings are still very high compared to the reference case. The following table presents the load curtailments and the corresponding costs by priority level (Table 9).
The following key indicators give a more detailed picture of the cost optimal solution. It can be seen (Table 10) that RES generation exceeds the total electricity demand.
Figure 4 illustrates the investment decisions, the new generation technologies to be installed, as well as the annualized energy costs in comparison with the reference case. It is obvious that the capacity of RES has been restricted. The new proposed investment now includes 450 kW of photovoltaics and 750 kW of wind turbines. The new model includes 225 kWh of stationary batteries, as this is the minimum capacity that has been defined. Although new capital costs for new renewable energy technologies are suggested, annual operational expenditures are lower, and the savings obtained are enough to repay investments within the boundaries set by financial constraints. Besides the operational expenses, a dramatic reduction is observed in CO2 emissions. This is because the constraints that were previously set for available technologies for DER investment allow only renewable energy-based technologies to be used. Therefore, the balance of 6.2% of CO2 emissions is due to the small amount of electricity purchases that still exist in this model.
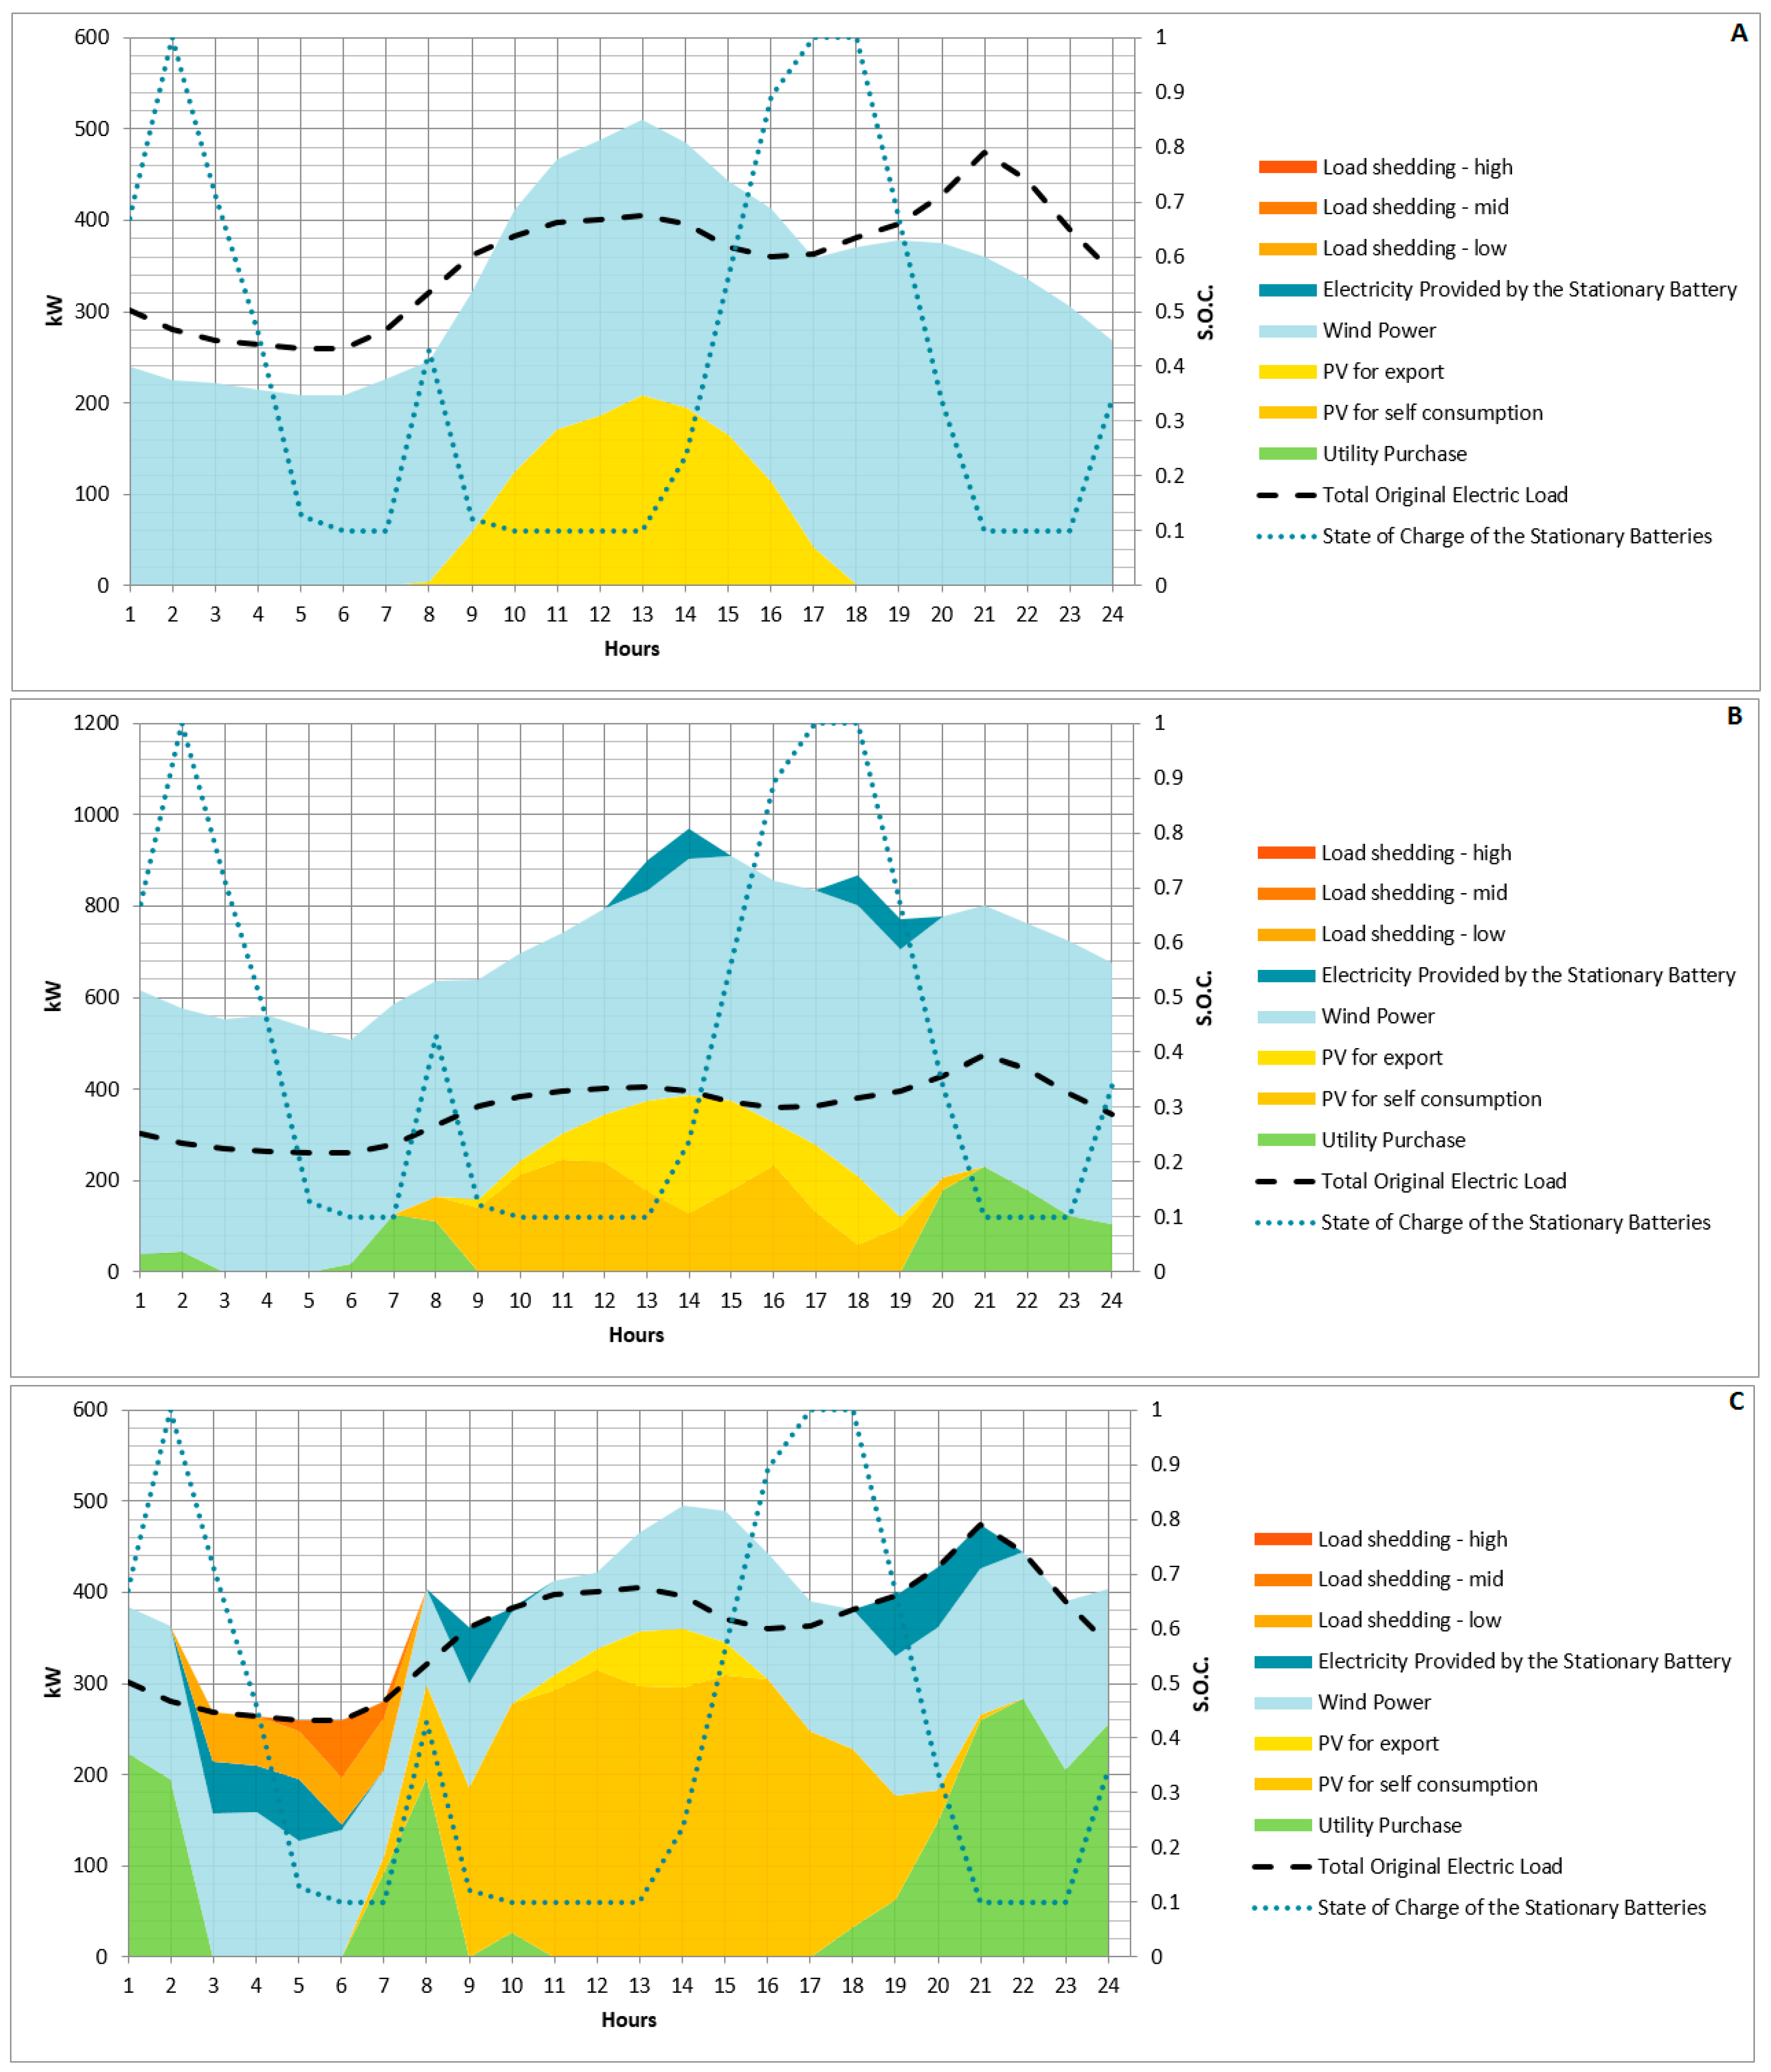
Figure 5A illustrates the optimal electricity dispatch of the optimal solution. As is shown, the bulk of the original electric load is met by DER technologies. While the electric load demand is higher than the electricity produced by DER generators, the balance is provided by stationary batteries, otherwise by the main grid. The electricity dispatch of a week-day of August is depicted in Figure 5B. The electricity demand is covered even in August when there is the highest electric demand. Some hours of the day, the microgrid imports energy from the utility in order to meet the power demand, while some others export energy from photovoltaics to the grid. The export of energy from photovoltaics coincides with the peak and mid-peak energy demand and ToU rates. The stationary batteries provide energy when necessary either to meet the energy demand or to help with the optimal dispatching. Figure 5C represents what happened when an outage event occurred and the generation storage power was not sufficient to meet the loads. Load curtailments by priority level are applied when necessary. In this day, the outage event lasted three hours during which, low and medium priority load shedding had to take effect.
The reduction of CO2 emissions has an economic dimension as the cost of allowance production of CO2 emissions in the reference case scenario was calculated to be about 8000 €, where this value is about 1.67% of the total marginal electricity production cost (interruption costs excluded). However, the CO2 emissions have mainly social impacts particularly when talking about communities living next to large thermal plants. Via the DER-CAM analysis, interesting results have shown that the investment is not feasible, as the annualized investment cost is too high, and the total annual expenditures are higher than the reference case scenario (Table 11). The CO2 savings were 97.1% instead of 100%, as expected. Although this solution includes huge storage capacity, the load curtailment costs are much greater than those of the previous cost optimization scenario. This is because the environmentally optimal solution does not give any weight to the economic dimension of the load curtailments.
A multi-objective analysis was implemented after having carried out the cost and the CO2 optimization processes. This process gave a number of solutions by changing the weighting factors of cost and CO2 objectives, taking into consideration different aspects of the problem and finding the trade-off between incompatible objectives. A compromise solution, mutually beneficial for all stakeholders, was reached. The maximum annual costs and the maximum annual CO2 emissions allowed in the multi-objective simulation were defined. These values were considered as the scaling factors of the multi-objective optimization and obtained by finding the cost of CO2 minimization run and the CO2 emissions of the cost minimization run. In this stage, several optimization runs should be performed. Table 12 lists the combinations of weight factors that have been carried out, e.g. weight factor of CO2 (WCO2).
The weight objective function used by DER-CAM is (Equation (5)):
min f = M u l t i O b j e c t i v e W c o s t × ( T o t a l   a n n u a l   c o s t M u l t i O b j e c t i v e M a x C o s t ) + M u l t i O b j e c t i v e W C O 2 × ( T o t a l   a n n u a l   C O 2 M u l t i O b j e c t i v e M a x C O 2 )
In order to present the output of the multi-objective optimization, the case with 0.7 cost and 0.3 CO
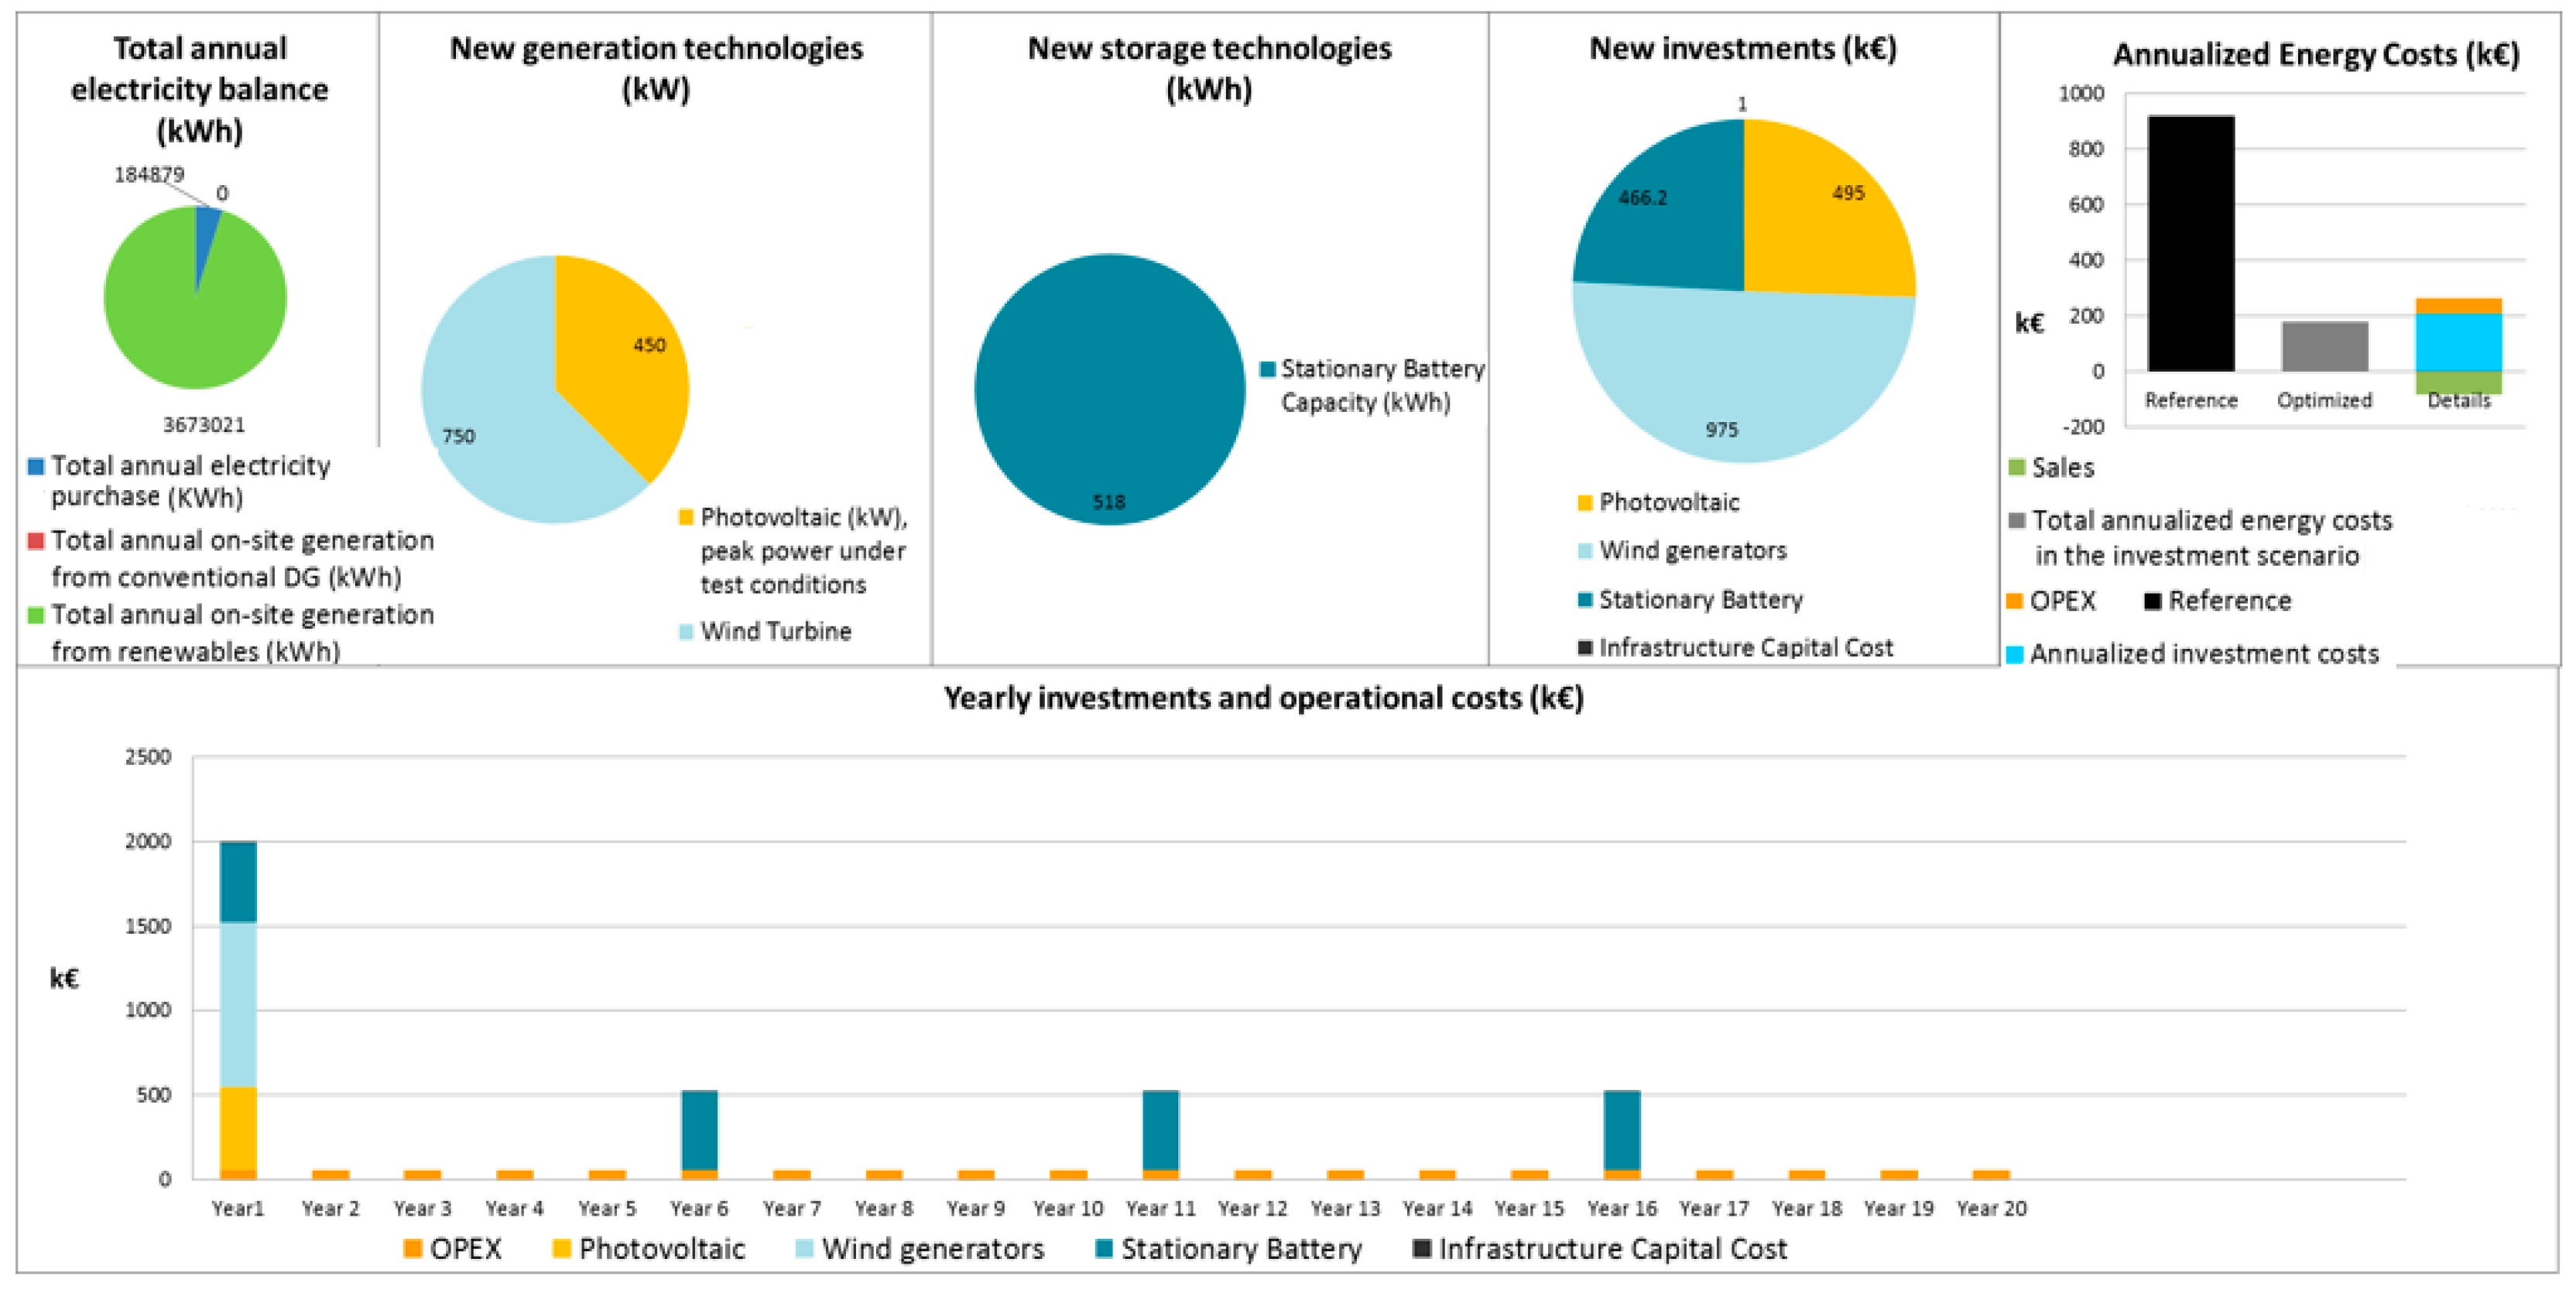
2 weight factors has been selected. The following table shows that the total annual savings are 80.6%, and the OPEX savings are 103.3%. Compared with the cost optimal solution, the annual electricity generation costs are slightly higher, while the savings of interruption costs reach 100% (Table 13 and Table 14).
Figure 6 summarizes all the results of the multi-objective (70/30) optimal solution. The main difference from the previous single-objective optimal solutions is that the electricity storage capacity from stationary batteries is higher (518 kWh). This increases the reliability of the system, reducing the power cuts and the corresponding costs. It is worth noting that the price of batteries is expected to highly decrease in the next few years, and this cost should be adjusted. The issue of how resilient the microgrid is to outage events is answered in Figure 7. When an outage event occurs and the energy demand is greater than the local generation capacity and available storage, the load curtailment technique is applied with low priority, in order to cope with this situation. Otherwise, if no local generation and energy storage are available, such as the reference case, this would be an outage event along with all the negative impacts described above. Comparing with Figure 5C, for the same day, with the same loads and for the same 3-h outage event, this solution seems more reliable, giving better electricity dispatch due to the higher capacity of the stationary batteries, for the same capacity of PV and wind turbine generators. In this case, load shedding is applied only in low priority loads.
It is remarkable that in this optimal solution, the load curtailment event that is illustrated in Figure 7 takes place only one day of a year.
After performing the same task ten more times for all combinations referred to in Table 12, the following output table was obtained (Table 15).
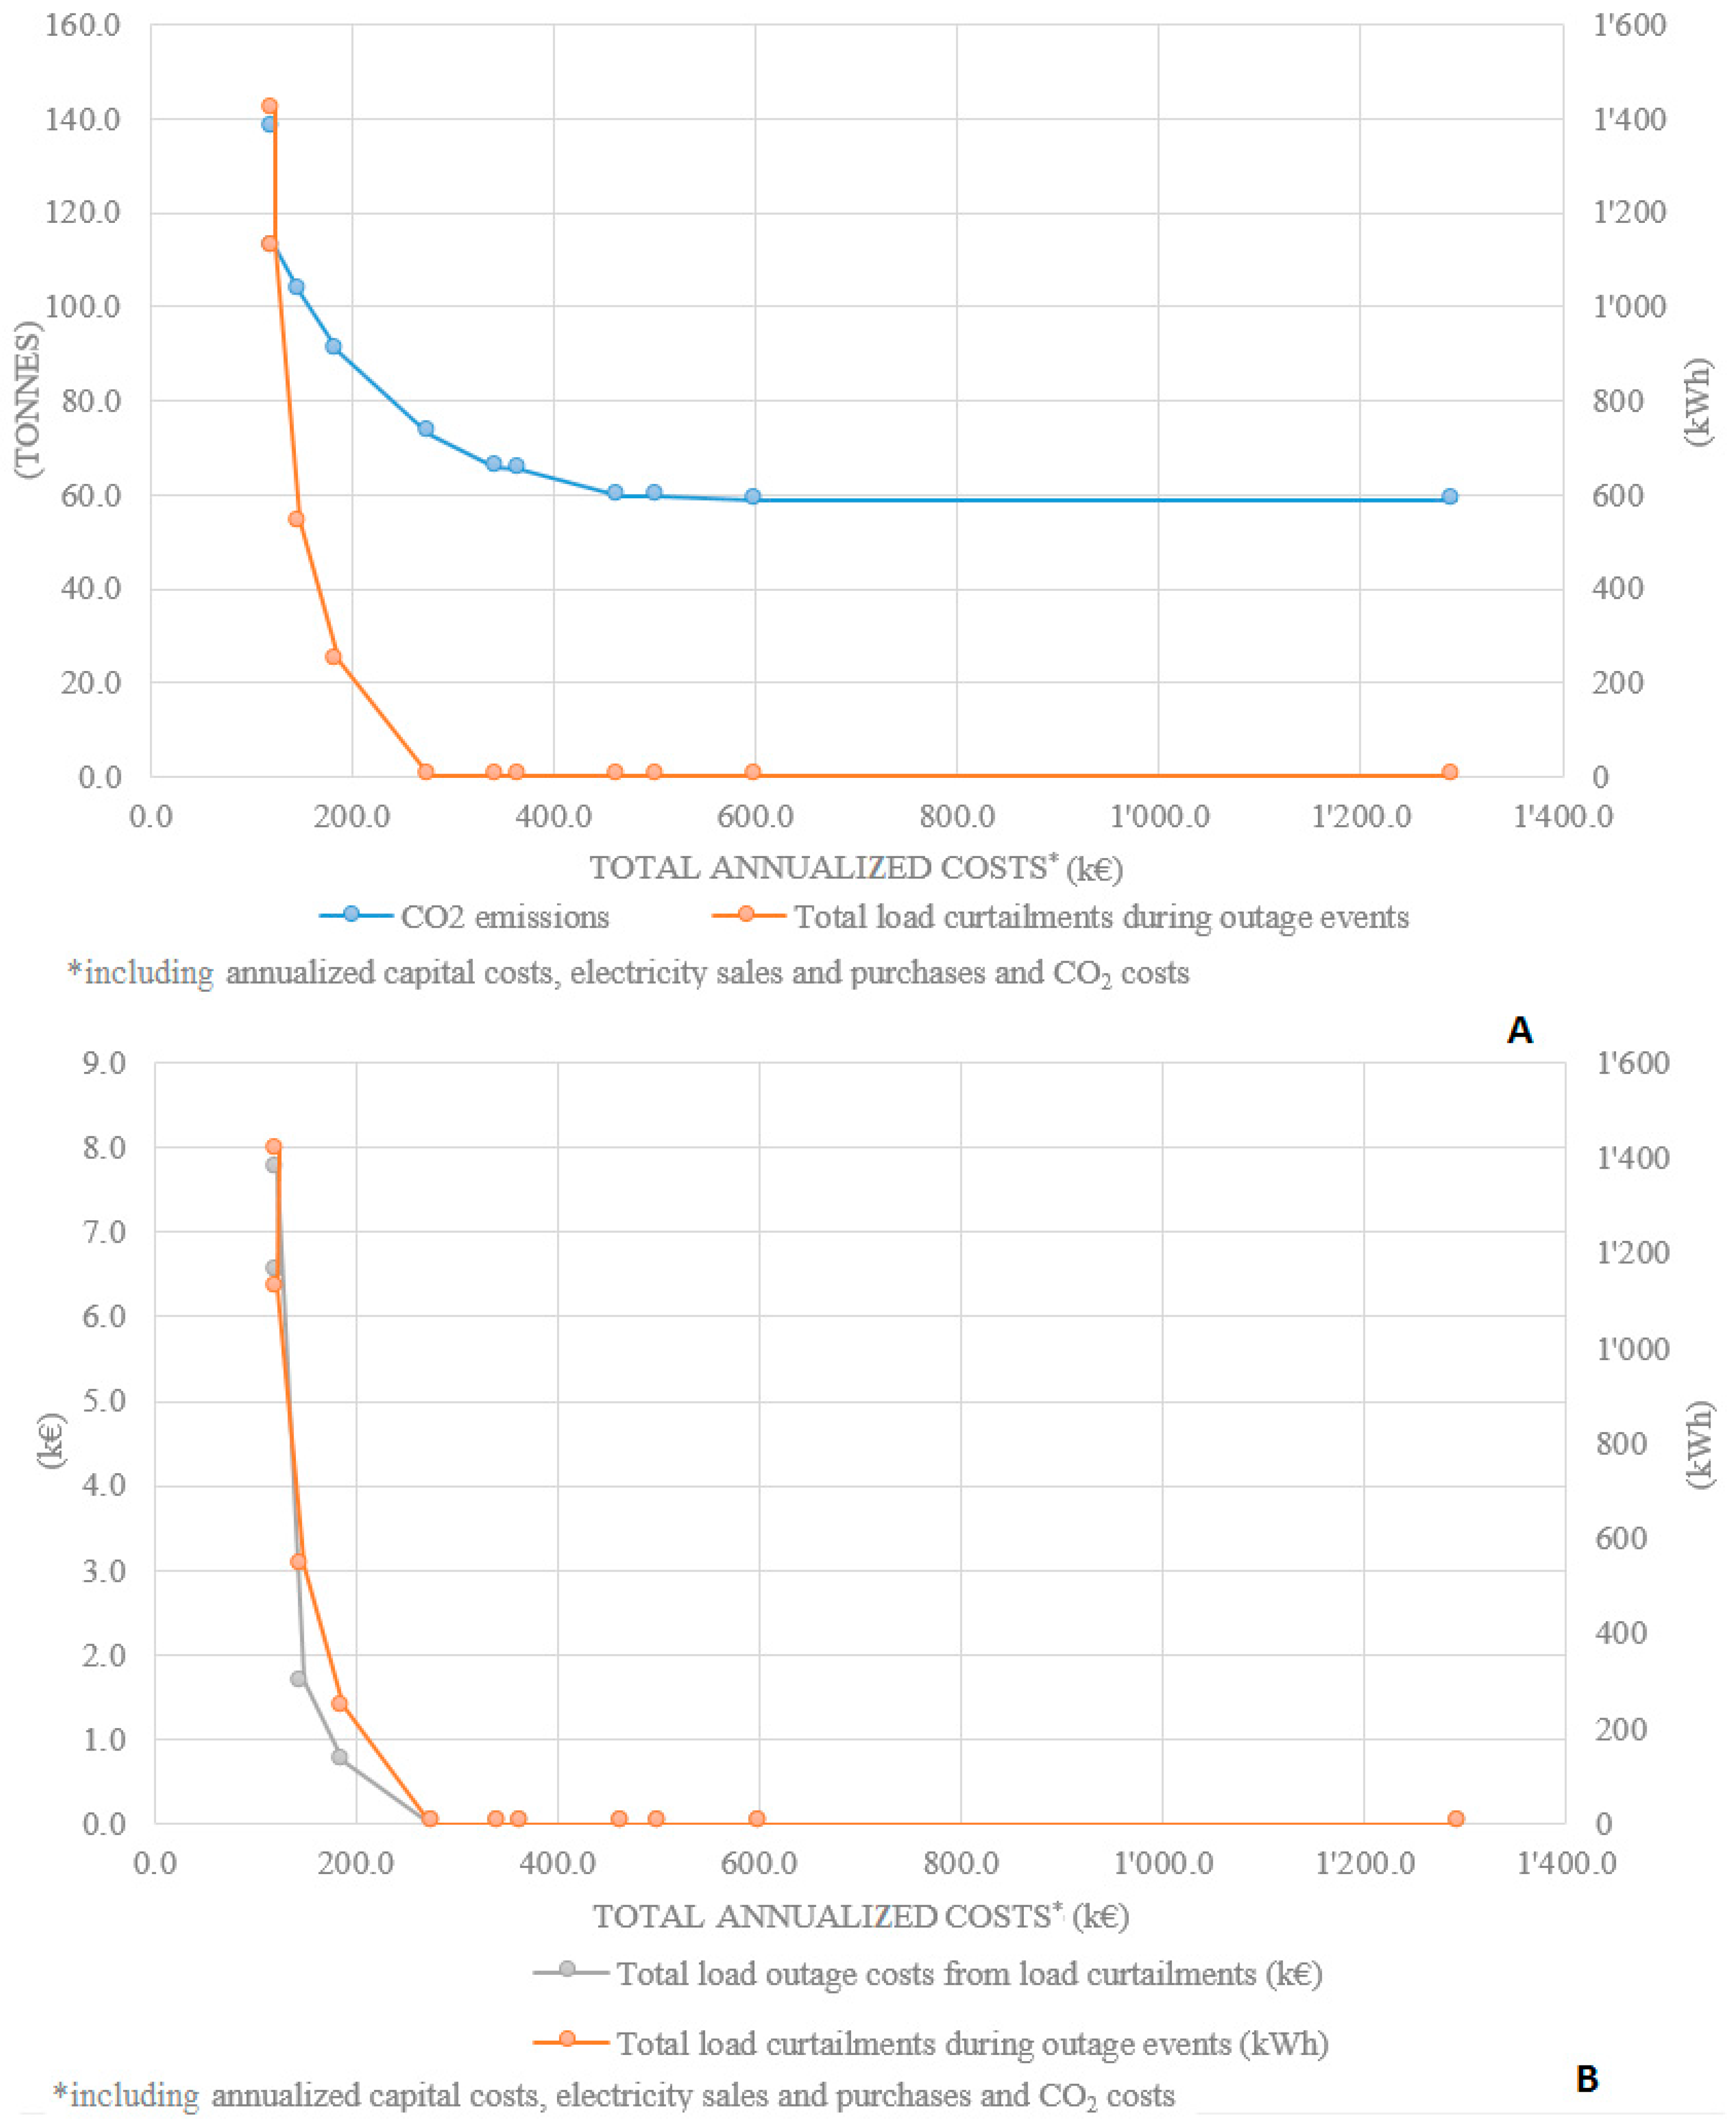
As expected, as the CO2 weighting factor tends to 1 and correspondingly the cost weighting factor tends to zero, the energy costs increase and the CO2 emissions decrease, respectively. The same happens to the load curtailments from the Wcost 0.6/WCO2 0.4 till they become zero. These findings are graphically represented in Figure 8. In the two vertical axis is what the local community and government consider as key element, while in the horizontal axis is what the DER developer considers as the main objective, whether it is an investor or the DSO.
In the left vertical axis, the CO2 emissions that represent a main object for both the policy makers aiming to get the 2020 EU energy targets and for societies as an environmental pollution index are placed. The right vertical axis presents the load curtailments during an outage event given in kWh that represent the reliability, security and power quality of the microgrid. The greater is the unserved energy, the greater is the insecurity and unreliability of the microgrid and the lower is the level of end user satisfaction. The horizontal axis illustrates the total electricity costs including the annualized capital costs, the electricity sales and purchases and CO2 emission costs. In other words, the total electricity cost represents the total annualized electricity generation and operation costs for the DER developer in order to meet the electricity demand of the local microgrid.
A win-win solution for all stakeholders could be the fifth in the series, for which the weight factors are 0.6 for cost and 0.4 for CO2, respectively, as it presents high reliability without load curtailments, quite reduced emissions of 96.3% CO2 savings against the reference case and satisfactory profits for the investor, making the investment feasible and quite attractive.
Although in this solution, CO2 emission savings (96.3%) are not the maximum they could be, there is no appreciable difference between the maximum possible savings, which is 97.1%, and the preferred solution, while comparing the two aforementioned solutions, the total annualized costs are more than doubled in the second one.

5. Conclusions

The possibility of replacing the existing autonomous power plants with RES-based ones along with appropriate energy storage technologies was investigated thoroughly in this study. A case study of a small Greek island, which is confronted often with energy shortages, was studied for evaluating the feasibility of DER deployment at this scale. DER-CAM uses a Mixed Integer Linear Program (MILP) solver that finds optimal invests. The methods used were both the weighted-sum method when running the multi-objective optimization and the ε-constrained method when running single objectives like cost or CO2 optimization. By changing either the weighting factors of the objectives or the master objective, several optimal solutions were obtained. In this approach, the decision making follows the multi-objective optimization process, by evaluating the possible solutions and concluding on the most preferable one.
In the case study, so as to restrict the visual impact of the wind turbines and to increase the capacity steps, small wind turbines of 50 kW have been selected. Given that the accuracy of the MILP solver that DER-CAM uses is 1% and after the aforementioned assumptions and constraints have been defined, the optimal non-dominated set of proposed solutions presented in the previous section are considered as real solutions to the real problem. The fact that seven of a total of eleven proposed solutions were found economically feasible suggests that DER investments based on renewable energy technologies can be deployed at a large scale and be beneficial for all stakeholders. Furthermore, DER development implies many external benefits for the local communities, while making them more energy independent. The improved power quality and reliability of the system can have economic benefits in terms of commercial activities.

Acknowledgments

Special thanks to the researchers of the Lab of Soft Energy Applications & Environmental Protection, Technological Educational Institute (TEI) of Piraeus, which provided data on load demand and power outages for Tilos Island to the first author of the paper under the frames of the Heriot Watt MSc in Energy program in order to conduct his MSc thesis research. We would also like to thank the researchers of the Lawrence Berkeley National Laboratory and more specific Mr. Michael Stadler (Lawrence Berkeley National Laboratory, 1 Cyclotron Road, MS: 90-1121, Berkeley, California 94720, USA) for giving us access to the full DER-CAM Web-Optimization Service.

Author Contributions

P.M. and G.X. conceived of and designed the software simulations. P.M. performed the simulations. P.M., G.X. and L.M.-P. analyzed the data. L.M.-P. contributed to the analysis. P.M. and G.X. wrote the paper.

Conflicts of Interest

The authors declare n conflict of interest.

References

  1. Marnay, C.; Kawaan, C.P.; Blanco, R.; Osborn, J.G.; Hamachi, K.S.; Rubio, F.J. Integrated Assessment of Dispersed Energy Resources Deployment—LBNL No. 46082. 2000. Available online: https://escholarship.org/uc/item/22f8m8t1 (accessed on 17 March 2016).
  2. MSc in Energy, Heriot-Watt University. 2017. Available online: https://www.hw.ac.uk/study/uk/postgraduate/energy.htm (accessed on 26 April 2017).
  3. Momber, I.; Gómez, T.; Venkataramanan, G.; Stadler, M.; Beer, S.; Lai, J.; Marnay, C.; Battaglia, V. Plug-in electric vehicle interactions with a small office building: An economic analysis using DER-CAM. In Proceedings of the IEEE PES General Meeting, Providence, RI, USA, 25–29 July 2010. [Google Scholar]
  4. Cardoso, G.; Stadler, M.; Bozchalui, M.C.; Sharma, R.; Marnay, C.; Barbosa-Povoa, A.; Ferrao, P. Stochastic programming of vehicle to building interactions with uncertainty in PEVs driving for a medium office building. In Proceedings of the IEEE 39th Annual Conference on Industrial Electronics Society, Vienna, Austria, 10–13 November 2013; pp. 7648–7653. [Google Scholar]
  5. Mendes, G.; Ioakimidis, C.; Ferrão, P. On the planning and analysis of Integrated Community Energy Systems: A review and survey of available tools. Renew. Sustain. Energy Rev. 2011, 15, 4836–4854. [Google Scholar] [CrossRef]
  6. Beer, S.; Gómez, T.; Dallinger, D.; Momber, I.; Marnay, C.; Stadler, M.; Lai, J. An economic analysis of used electric vehicle batteries integrated into commercial building microgrids. IEEE Trans. Smart Grid 2012, 3, 517–525. [Google Scholar] [CrossRef]
  7. DeForest, N.; Mendes, G.; Stadler, M.; Feng, W.; Lai, J.; Marnay, C. Optimal deployment of thermal energy storage under diverse economic and climate conditions. Appl. Energy 2014, 119, 488–496. [Google Scholar] [CrossRef]
  8. Milan, C.; Stadler, M.; Cardoso, G.; Mashayekh, S. Modeling of non-linear CHP efficiency curves in distributed energy systems. Appl. Energy 2015, 148, 334–347. [Google Scholar] [CrossRef]
  9. Braslavsky, J.H.; Wall, J.R.; Reedman, L.J. Optimal distributed energy resources and the cost of reduced greenhouse gas emissions in a large retail shopping centre. Appl. Energy 2015, 155, 120–130. [Google Scholar] [CrossRef]
  10. Alarcon-Rodriguez, A.; Ault, G.; Galloway, S. Multi-objective planning of distributed energy resources: A review of the state-of-the-art. Renew. Sustain. Energy Rev. 2010, 14, 1353–1366. [Google Scholar] [CrossRef]
  11. Ren, H.; Zhou, W.; Nakagami, K.; Gao, W.; Wu, Q. Multi-objective optimization for the operation of distributed energy systems considering economic and environmental aspects. Appl. Energy 2010, 87, 3642–3651. [Google Scholar] [CrossRef]
  12. Colak, I.; Sagiroglu, S.; Fulli, G.; Yesilbudak, M.; Covrig, C.F. A survey on the critical issues in smart grid technologies. Renew. Sustain. Energy Rev. 2016, 54, 396–405. [Google Scholar] [CrossRef]
  13. Colmenar-Santos, A.; Reino-Rio, C.; Borge-Diez, D.; Collado-Fernández, E. Distributed generation: A review of factors that can contribute most to achieve a scenario of DG units embedded in the new distribution networks. Renew. Sustain. Energy Rev. 2016, 59, 1130–1148. [Google Scholar] [CrossRef]
  14. Cataliotti, A.; Cosentino, V.; Di Cara, D.; Russotto, P.; Telaretti, E.; Tinè, G. An Innovative Measurement Approach for Load Flow Analysis in MV Smart Grids. IEEE Trans. Smart Grid 2016, 7, 889–896. [Google Scholar] [CrossRef]
  15. Artale, G.; Cataliotti, A.; Cosentino, V.; Guaiana, S.; Di Cara, D.; Tinè, G. Development of a coupling system for medium voltage power line communication in the CENELEC A frequency band. In Proceedings of the IEEE International Workshop on Applied Measurements for Power Systems (AMPS), Aachen, Germany, 28–30 September 2016; pp. 1–6. [Google Scholar]
  16. Cataliotti, A.; Cosentino, V.; Di Cara, D.; Guaiana, S.; Panzavecchia, N.; Tinè, G. A New Solution for Low-Voltage Distributed Generation Interface Protection System. IEEE Trans. Instrum. Meas. 2015, 64, 2086–2095. [Google Scholar] [CrossRef]
  17. Kabalci, E.; Kabalci, Y. A measurement and power line communication system design for renewable smart grids. Meas. Sci. Rev. 2013, 13, 248–252. [Google Scholar] [CrossRef]
  18. Ancillotti, E.; Bruno, R.; Conti, M. The role of communication systems in smart grids: Architectures, technical solutions and research challenges. Comput. Commun. 2013, 36, 16–97. [Google Scholar] [CrossRef]
  19. Dalianis, G.; Nanaki, E.; Xydis, G.; Zervas, E. New Aspects to Greenhouse Gas Mitigation Policies for Low Carbon Cities. Energies 2016, 9, 128. [Google Scholar] [CrossRef]
  20. Koroneos, C.; Xydis, G.; Polyzakis, A. The optimal use of renewable energy sources—The case of the new international “Makedonia” airport of Thessaloniki, Greece. Renew. Sustain. Energy Rev. 2010, 14, 1622–1628. [Google Scholar] [CrossRef]
  21. Regulatory Authority of Energy. RAE Decision No. 468/2013. 2013. Available online: http://www.rae.gr/site/el_GR/categories_new/about_rae/actions/decision/2013/2013_A0468.csp (accessed on 1 November 2017). (In Greek).
  22. Xydis, G. Wind energy to thermal and cold storage—A systems approach. Energy Build. 2013, 56, 41–47. [Google Scholar] [CrossRef] [Green Version]
  23. U.S. Department of Energy. Interruption Cost Estimate (ICE) Calculator—BETA. 2016. Available online: http://www.icecalculator.com/ (accessed on 5 March 2016).
  24. Camacho, O.M.F.; Nørgård, P.B.; Rao, N.; Mihet-Popa, L. Electrical Vehicle Batteries Testing in a Distribution Network using Sustainable Energy. IEEE Trans. Smart Grid 2014, 5, 1033–1042. [Google Scholar] [CrossRef]
  25. Mihet-Popa, L.; Koch-Ciobotaru, C.; Isleifsson, F.; Bindner, H. Development of tools for DER Components in a distribution network. In Proceedings of the 20th International Conference on Electrical Machines, Marseille, France, 2–5 September 2012; pp. 1022–1031. [Google Scholar]
  26. Ackermann, T.; Cherevatskiy, S.; Brown, T.; Eriksson, R.; Samadi, A.; Ghandhari, M.; Söder, L.; Lindenberger, D.; Jägemann, C.; Hagspiel, S.; et al. Smart Modeling of optimal Integration of high Penetration of PV–Smooth PV. Final Report, Smooth PV Project. 2013. Available online: http://www.smooth-pv.info (accessed on 1 November 2017).
  27. Eurostat. Energy Production and Imports. 2014. Available online: http://epp.eurostat.ec.europa.eu/statistics_explained/index.php/Energy_production_and_imports (accessed on 16 November 2014).
Figure 1. Load profile of Tilos Island (a); the load profile of the 9-island complex (b); the average annual ambient temperature (c); and the wind speed measurements for Tilos Island (d).
Sustainability 09 02010 g001
Figure 2. Duration curve of outages in Tilos Island (4 April–17 December 2015).
Sustainability 09 02010 g002
Figure 3. Summary results of the cost optimal solution.
Sustainability 09 02010 g003
Figure 4. Summary results of the cost optimal solution including land use constraints.
Sustainability 09 02010 g004
Figure 5. Optimal dispatch for electricity technologies (A); optimal dispatch for electricity technologies (August week-day) (B); optimal dispatch for electricity technologies (May emergency week-day) (C).
Sustainability 09 02010 g005
Figure 6. Summary of the results of the multi-objective (70/30) optimal solution.
Sustainability 09 02010 g006
Figure 7. Optimal dispatch for electricity technologies: multi-objective (70/30) optimal solution (May emergency week-day).
Sustainability 09 02010 g007
Figure 8. Non-dominated optimal solution set, of DER planning and operation, from different perspectives (A); non-dominated optimal solution set, of DER planning and operation, taking into consideration reliability and economic objectives (B).
Sustainability 09 02010 g008
Table 1. Input values for Interruption cost Estimate Calculator (ICE). SAIFI, System Average Interruption Frequency Index; SAIDI, System Average Interruption Duration Index; CAIDI, Customer Average Interruption Duration Index.
Input Values
SAIFI30No. of Non-Residential Customers50
SAIDI (in hours)44.8No. of Residential Customers200
CAIDI (in hours)1.5
Table 2. Interruption parameters. C&I, Commercial and Industrial.
Customer CategoryNo. of CustomersAverage Usage
(Annual MWh)
Medium and Large C&I (Over 50,000 Annual kWh)0459
Small C&I (Under 50,000 Annual kWh)5038.9
Residential2006.4
C&I Industry PercentagesMedium and Large C&I Small C&I
Construction2.00%9.50%
Manufacturing17.10%5.00%
All Other Industries80.90%85.50%
Total100.00%100.00%
Percent of C&I Customers with:Medium and Large C&I Small C&I
No or Unknown Backup Equipment54.40%70.40%
Backup Generation or Power Conditioning37.20%26.20%
Backup Generation and Power Conditioning8.40%3.40%
Total100.00%100.00%
Residential Customer CharacteristicsEstimate
Median Household Income20,000 €
Distribution of Outages by Time of DayEstimated Percentage
Morning (6 a.m.–12 p.m.)54.47%
Afternoon (12 p.m.–5 p.m.)29.49%
Evening (5 p.m.–10 p.m.)5.23%
Night (10 p.m.–6 a.m.)10.81%
Total100.00%
Distribution of Outages by Time of YearEstimated Percentage
Summer (June–September)34.72%
Non-Summer (October–May)65.28%
Total100.00%
Table 3. Interruption cost estimates.
SectorNo. of CustomersCost per Event (2016 €)Cost per Average kW (2016 €)Cost per Unserved kWh (2016 €)Total Cost of Sustained Interruptions (2016 €)
Medium and Large C&I052.602101.690.000.00
Small C&I50607.74159.376375.95911,627.09
Residential2003.364.60184.9420,265.39
All Customers250124.2692.193689.62931,892.59
Table 4. Curtailment parameters. CR, Curtailment Rate.
Priority LevelVariable Cost (€/kWh)Max Curtailment Load
Low CR320%
Mid CR1560%
High CR2520%
Table 5. Reference case summary.
Annual Electricity Costs (k€)Annual Outage Events Costs (k€)Total Annual Energy Costs * (k€)Total Annual CO2 Emissions (Metric Tons)
Investment scenario472.16440.57912.731977
* Including annualized capital costs, electricity sales and CO2 costs.
Table 6. Unserved energy due to outage events and related costs by priority level.
Low CRMid CRHigh CRTotal
Outages costs (k€)25.83309.94104.81440.57
Unserved energy (kWh)861020,662419233,465
Table 7. Cost minimization summary.
Annual Electricity Costs (k€)Annual Outage Events Costs (k€)Total Annual Energy Costs * (k€)Total Annual CO2 Emissions (Metric Tons)
Reference472.16440.57921.861997
Investment Scenario18.621.49−2.5069
Total Savings (%)96.1%99.7%100.3%96.5%
Operating Expenses (OPEX) Savings (%) 122%
* Including annualized capital costs, electricity sales and CO2 costs.
Table 8. Cost minimization summary, including land use constraints.
Annual Electricity Costs (k€)Annual Outage Events Costs (k€)Total Annual Energy Costs * (k€)Total Annual CO2 Emissions (Metric Tons)
Reference472.16440.57921.861977
Investment scenario18.624.89124.18123
Total Savings (%)96.1%98.9%86.5%93.8%
OPEX Savings (%) 102.6%
* Including annualized capital costs, electricity sales and CO2 costs.
Table 9. Load curtailments during outage events and related costs by priority level—cost minimization.
Low CRMid CRHigh CRTotal
Load curtailment costs (k€)2.072.820.004.89
Unserved energy (kWh)6901880878
Table 10. Key indicators of the cost optimal solution.
Key Indicators
Total electricity sales (k€)84.25
Total annual electricity purchase (kWh)33,129
Total annual on-site generation from renewables (kWh)3,652,441
RES share of total electric load113%
Estimated total annual fuel consumption * (kWh)585,742
* Including fuel used by the utility, assuming average macro efficiency.
Table 11. CO2 minimization summary.
Annual Electricity Costs (k€)Annual Outage Events Costs (k€)Total Annual Energy Costs * (k€)Total Annual CO2 Emissions (Metric Tons)
Reference472.16440.57921.861997
Investment scenario16.09789.461293.6759
Total Savings (%)96.6%−79.2%−40.3%97.1%
OPEX Savings (%) 8.7%
* Including annualized capital costs, electricity sales and CO2 costs.
Table 12. Weighting factor combinations carried out.
Wcost10.90.80.70.60.50.40.30.20.10
WCO200.10.20.30.40.50.60.70.80.91
Table 13. Multi-objective (70/30) optimization scenario summary.
Annual Electricity Costs (k€)Annual Outage Events Costs (k€)Total Annual Energy Costs * (k€)Total Annual CO2 Emissions (Metric Tons)
Reference472.16440.57921.861997
Investment scenario28.700.74178.79114
Total Savings (%)93.9%99.8%80.6%94.3%
OPEX Savings (%) 103.3%
* Including annualized capital costs, electricity sales and CO2 costs.
Table 14. Curtailment costs, multi-objective (70/30) optimization.
Low CRMid CRHigh CRTotal
Load curtailment costs (k€)0.740.000.000.74
Unserved energy (kWh)7812007812
Table 15. Output summary of multi-objective optimization analysis for different combinations of weighting factors.
WcostWCO2Energy Cost (k€)Electricity Cost (k€)CO2 Emissions (Tn)Total Load Outage Costs from Load Curtailments (k€)Total Load Curtailments during Outage Events (kWh)
10129.3122.8138.56.51421
0.90.1130.4122.6112.87.81129
0.80.2149.4147.7103.11.7543
0.70.3186.9186.190.40.7247
0.60.4275.5275.572.80.00
0.50.5342.0342.065.80.00
0.40.6365.2365.265.40.00
0.30.7466.3466.359.70.00
0.20.8503.0503.059.70.00
0.10.9600.5600.558.90.00
011293.71293.758.90.00
Cost optimization124.2119.3123.04.9878
Reference case921.9481.31996.8440.633,465

