Reducing Impact of Negative Complexity on Sustainability of Mass Customization


Faculty of Manufacturing Technologies, Technical University of Kosice, Kosice 042 00, Slovakia
*
Author to whom correspondence should be addressed.
Sustainability 2017, 9(11), 2014; https://doi.org/10.3390/su9112014
Submission received: 4 September 2017
/
Revised: 29 October 2017
/
Accepted: 30 October 2017
/
Published: 3 November 2017
(This article belongs to the Section Sustainable Engineering and Science)
Abstract
:In the mass customization environment, product platform development includes several aspects. One relates to the extent to which products are customized. Usually, a high level of product variety brings significant benefits to customers. On the other hand, a high degree of product customization may have a negative environmental impact during production, due to higher material usage. One possible way to reduce the impact is eliminating infeasible configuration options, caused by incompatibilities between optional component types, within a product platform. Such optional components are a source of negative complexity. However, a reduction of optional component types within a product platform can lead to decreasing the extent of the variety of a product to an undesirable level. An effective way of finding this optimal level of reduction is to quantify and analyze the rates between positive and negative complexities, which are related to the numbers of configuration options. The method for this purpose is presented in this paper.
1. Introduction
In the worldwide effort to practice sustainable industrial development, analyzing the key manufacturing and marketing strategies has become increasingly important. One of those strategies is mass customization (MC), introduced by Davis [1]. Since the early 1990s, this strategy has been developed into the leading ideas in the production of goods. Tseng and Jiao [2] defined MC as the technologies and systems producing goods and providing services that meet individual customers’ needs with near mass production efficiency. An important task for the further development of MC is finding the optimum extent of product variety. For this purpose, establishing working definitions of related terms “product variety” and “product platform” is required. Product variety can be expressed as the number of modified products offered to the market [3] and a product platform is here understood as a set of product components that are commonly shared across the offered products [4].
A higher level of customized product variety provides more value for customers than an offer with lesser product variety. On the other hand, producers offering a high variety of products have to be able to handle the related complexity problems. Therefore, if the customized product variety is high, then the price of the products must be adequate to cover all direct and indirect manufacturing costs. In this context, the following two mutually-related crucial axioms can be identified: (1) Increasing product variety offer cannot be beaten and is alluring. The consequence of this phenomenon is increasing complexity of products and their manufacturing processes. (2) Higher complexity caused by variety can be considered either as more disadvantageous or more advantageous than lower variety. The identification of complexity induced by variety, as either a positive or a negative, is shown through recognition and appreciation by customers.
Crippa et al. [5] claimed that, if all product variety is being recognized and appreciated by the market as an additional value of the offer, then the related complexity is preserved by both customer and producer as useful; if all product variety is not appreciated by the market, then only a fraction of all product varieties contribute to the overall profit, and complexity related to the rest of the product variety is preserved as useless or even harmful.
In this paper, we focused on an understandable model of how a product platform is structured in terms of MC, and how variable product components can affect customer perception of product value. In product platforms with a large set of design components, mutually incompatible components are frequently identified. These offered components can negatively influence a customer's perception when they are trying to select from among the product options. In such situations, customers are disappointed because their demand is not satisfied. Therefore, these components will be considered here as a source of less reward—the source of useless or negative complexity. Conversely, when product variety with available product options increases, mutually positive effects for both the customer and the producer are the result, and the associated complexity might be considered as a positive. This aligns with Götzfried [6] who indicated that, when unnecessary complexity is avoided and positive complexity is permitted, decision-making for products and product variants is improved. Under these assumptions, incompatible components might be minimized or eliminated from the product platform. However, a negative consequence of this approach is the reduction in the extent of product variety. Accordingly, a procedure to find a suitable balance between these two goals is proposed in this paper.
The rest of the paper is organized as follows. In the next section, relevant literature resources are reviewed, and are divided into three sub-domains. Subsequently, the mechanism of the potential reason for customer dissatisfaction is described. For this purpose, Koechlin’s experiment was used to describe new psychiatric evidence of dissatisfaction related to the offer. In Section 4, the proposed algorithm for the selection of an optimized product platform is described. For practical verification, the algorithm was applied to the transport motor vehicle in Section 5. Finally, relevant findings and their practical implications are summarized in Section 6.
2. Literature Review
Because the presented problem is multidisciplinary in nature, analyzing relevant literature resources by dividing them into the following three categories was important.
2.1. Studies on Determining Extent of Product Platform
The actual extent of a product platform is usually determined qualitatively. Several approaches exist to determine product platform extent. Seepersad et al. [7] proposed a quantitative method for determining the number of scalable platforms for a specific market. De Weck [8] analyzed the relevance and challenges of the multi-platform problem that all manufacturing companies face when offering many product variants. Michaelis et al. [9] developed an integrated platform model using functional modeling to capture the conceptual considerations for products and manufacturing systems, together with manufacturing processes. Another approach is based on analyzing variability models to identify which features are essential, dispensable, highly required by other features, or highly incompatible with the remaining features [10]. Usually the extent of customizable products is perceived as the larger the product variety, the better, and vice versa, as it stimulates sales and gross earnings [11]. In this context, increasing the extent of the product platform leads to a positive complexity in product variety. On the other hand, high product variety makes production planning and scheduling more complicated and has negative cost implications [12,13,14].
2.2. Studies on the Relation between Variety Induced Complexity and Customer Perception
Sonsino et al. [15] demonstrated that complexity induced by variety affects choice of customized configurations in two ways: “(1) the probability of choosing a given alternative decreases with the relative complexity of that alternative. (2) The noise in the choice process increases with the complexity and thus the chances that the inferior alternative will be elected, increases as well.” They term these effects of uncertainty on choice as negative complexity. Analogically, when a customer faces risk that they will select the mutually incompatible components in order to customize their product, then this choice with uncertainty increases the probability that an alternative product without incompatible components will be preferred. Rice [16] explained the term negative complexity in relation to lack of knowledge. According to Rice, complexity is considered as negative when knowledge is not available to cope with complexity problems. Abdelkafi [17] stated that variety involves a tradeoff from the customer’s perspective: “With more choice, customers are more likely to find products meeting their requirements. On the other hand, extensive choice makes it more probable that customers make suboptimal decision.” Huffman and Kahn [18] showed that the quality of customer’s decision depends on the presentation format of production information.
2.3. Studies on the Relationship between MC and Sustainability
Firstly, two contradictory views exist in relation to MC and environmental sustainability. According to the first view, MC considerably reduces the impact on the environment since customized products are manufactured only when the clients have ordered them, thus no stock is needed, and no unsold products are returned [19]. This statement is incomplete if it is not specified that it only works at the highest level of MC. This level is characterized as mass individualized production, which depends on high-tech IT goods for many of their processes. The other viewpoint is based on the belief that mass customized products may have a greater environmental impact during production due to higher material usage [20]. This statement relates to lower levels of MC and is based on a comparison of modular product architecture as opposed to an integral architecture.
In the case of MC, one of the important aspects of sustainability is the presence of infeasible combinations of components in customer options that are negatively perceived by customers. This is supported by prior studies [21,22,23,24], which argued that infeasible configurations might be hidden from product configuration options. Quelch and Jocz [25] underlined that a special role in the interactions between buyers and sellers will use information technology, ensuring buyers do not choose incompatible options. However, Orsvärn and Axling [26] pointed out that one type of configurator engine was developed especially for options that include infeasible component combinations. Fraizer and Wells [27] described the situation that occurs when sellers offered customer-constrained product choices in an online store, and proposed an apparatus and a method for presenting customer-constrained purchase choices that included a system for storing data representative of goods available for purchase online by consumers. Their method showed that eliminating infeasible options through product configurators is difficult. Moreover, each different MC sector requires a specific approach to solve configuration conflict problems related to product structures with restricted components. Hora et al. [28] underlined that “the achievement of sustainable MC implies a strong involvement of customers and the undertaking of the product re-design following a life cycle approach”. For this purpose, Osorio et al. [29] proposed using design guidelines for sustainable Mass-customized products, developed based on mapping the requirements and constraints of MC from a sustainability viewpoint.
3. Customer Dissatisfaction Due to Infeasible Product Combinations
Customers’ negative reactions to constrained options can be explained through behavior modeling showing that buyers are normally confident that all offered options are available and if this expected rule is unsettled, then they are frustrated. This assumption is supported by a psychological study [30] in which a selection from unconstrained options was associated with simple thinking and a selection from constrained options was merged with complex thinking. Complex thinking is processing performed in a higher brain region, which evokes the feeling of frustration and possibly triggers the “evil instinct” [31]. An empirical construct of customer behavior when faced with infeasible product options will be described.
Spinney [30] described Koechlin’s experiment that examined people obeying rules in conflict with their own preferences. During this experiment, volunteers were given a choice of tasks from a stable offer consisting of two simple tasks considering their own preferences or experiences (see Experiment #1 in Figure 1). The first task awarded X € as compensation, and the second task, Y € (where Y > X). After a period, the learned rules were changed. Instead of own preference task choices, a random color code was used, indicating which task to choose if they wanted to earn money. If they disobeyed the rule, they would get no money (see Experiment #2 in Figure 1). Through this experiment, changing the rules learned by their past experience was found to increase dissatisfaction, which even include violence, known as “Syndrome E” as described by Fried [32].
Results revealed that complex thinking is the trigger of the process when a person obeys rules that conflict with their own preferences. Initially, the trigger was expected to be affected by simple thinking. The experiment is graphically shown in Figure 1.
According to our assumptions expressed above, Koechlin’s experiment was similar, if not analogous, to the situation in which a customer faces the task of selection with restrictions due to infeasible configurations. To show similarities between Koechlin’s experiment and customers’ negative perceptions of infeasible product configurations, an empirical construct is proposed (Figure 2).
In Figure 2a, it is assumed that, if a customer can create a product by selecting their own optional product components and/or product modules, without any combinatorial restrictions, then, in parallel with Koechlin’s experiment, simple thinking is required. The result is the satisfaction of expectations. Figure 2b describes the situation where a customer faces restricted options during the decision making process. Then, during the decision making process, the customer’s complex thinking is triggered when this situation is encountered.
To summarize the arguments for an analogy between Koechlin’s experiment and our empirical construct, the following syllogism can be formulated:
Major premise:
Koechlin’s experiment and our empirical construct have at least two equal signs:
- (a)
- (b)
Minor premise:
The change in rules in Koechlin’s experiment caused dissatisfaction (frustration) for volunteers.
Conclusion:
There is a significant probability that the situation in our empirical construct, where rules were changed, will evoke dissatisfaction for customers.
As stated above, when a customer encounters restricted options, the customer's perception is negatively affected and is considered to be a source of negative complexity. To eliminate or reduce customer dissatisfaction, finding a suitable balance between the number of infeasible and feasible combinations is necessary. However, eliminating the total number of incompatible components may decrease the number of feasible combinations to an undesirable level. Available product options have to be sufficiently high so that the customized product offer still satisfies a wide range of customer requirements. To address this, the proposed procedure is described in the next section.
4. Proposed Algorithm for Selection of Optimized Product Platform
The main goal of this article was to determine an optimized product platform when infeasible product configurations occur. This objective was addressed by comparing and balancing the rates between infeasible product configurations and all possible product configurations when restrictions are omitted. In this context, both the negative and positive complexity of the product configurations were defined. Negative and positive complexity of product configurations can be expressed in different ways. For example, Krus [33] introduced the term “waste entropy” using Shannon's concept of entropy. He expressed the quality of a modular design by the rest of the design space that is outside the constrained design space with the term “waste” information entropy of design space and quantified it using the formula:
where Hw is the waste design space, Hx is the entropy of the complete design space, and Hc is the entropy of the constrained design space, also perceived as positive complexity. In line with the logic used for the entropy of a constrained design space, waste entropy was also considered as negative complexity [34]. The proposed approach is based on a simpler definition of product variety complexity. The complexity was defined through absolute numbers of product combinations, whereas Equation (1) was substituted with the formula:
where Nw is the number of infeasible product combinations representing negative complexity, Nc is the number of product combinations with restrictions omitted, and Nv is the number of viable product combinations, considered as positive complexity.
Once the concept of the negative complexity was outlined, we defined criteria for the selection of the optimized product platform, P. To find the optimized product platform, generating concurrent platforms was first necessary. Alternative product platforms were meaningfully generated through a gradual obliteration of selected components, occurring in infeasible configurations of the original product platform. For each platform P, percentage rates between positive complexity Nv and negative complexity Nw were then calculated.
To precisely compare two arbitrary product platforms against each other, e.g., P0 and P1, the following two measures were used:
Then, if ∆Nw0,1 > ∆Nv0,1, product platform P1 is preferable for MC than P0. To compare three alternative product platforms, the following criteria were used to select the preferable product platform between P0, P1, and P2:
Comparison of product platform P0 with P1:
- I.
- If ∆Nw0,1 > ∆Nv0,1, then product platform P1 is more suitable than P0.
Comparison of product platform P0 with P2:
- II.
- If ∆Nw0,2 > ∆Nv0,2, then product platform P2 is more suitable than P0.
Comparison of product platform P1 with P2:
- III.
- If ∆Nw0,1 − ∆Nv0,1 > ∆Nw0,2 − ∆Nv0,2, then product platform P1 is more suitable than P2.
- IV.
- If ∆Nw0,1 − ∆Nv0,1 < ∆Nw0,2 − ∆Nv0,2, then product platform P2 is more suitable than P1.
- V.
- If ∆Nw0,1 − ∆Nv0,1 = ∆Nw0,2 − ∆Nv0,2, then both product platforms P1, and P2 are equally preferable for buyers.
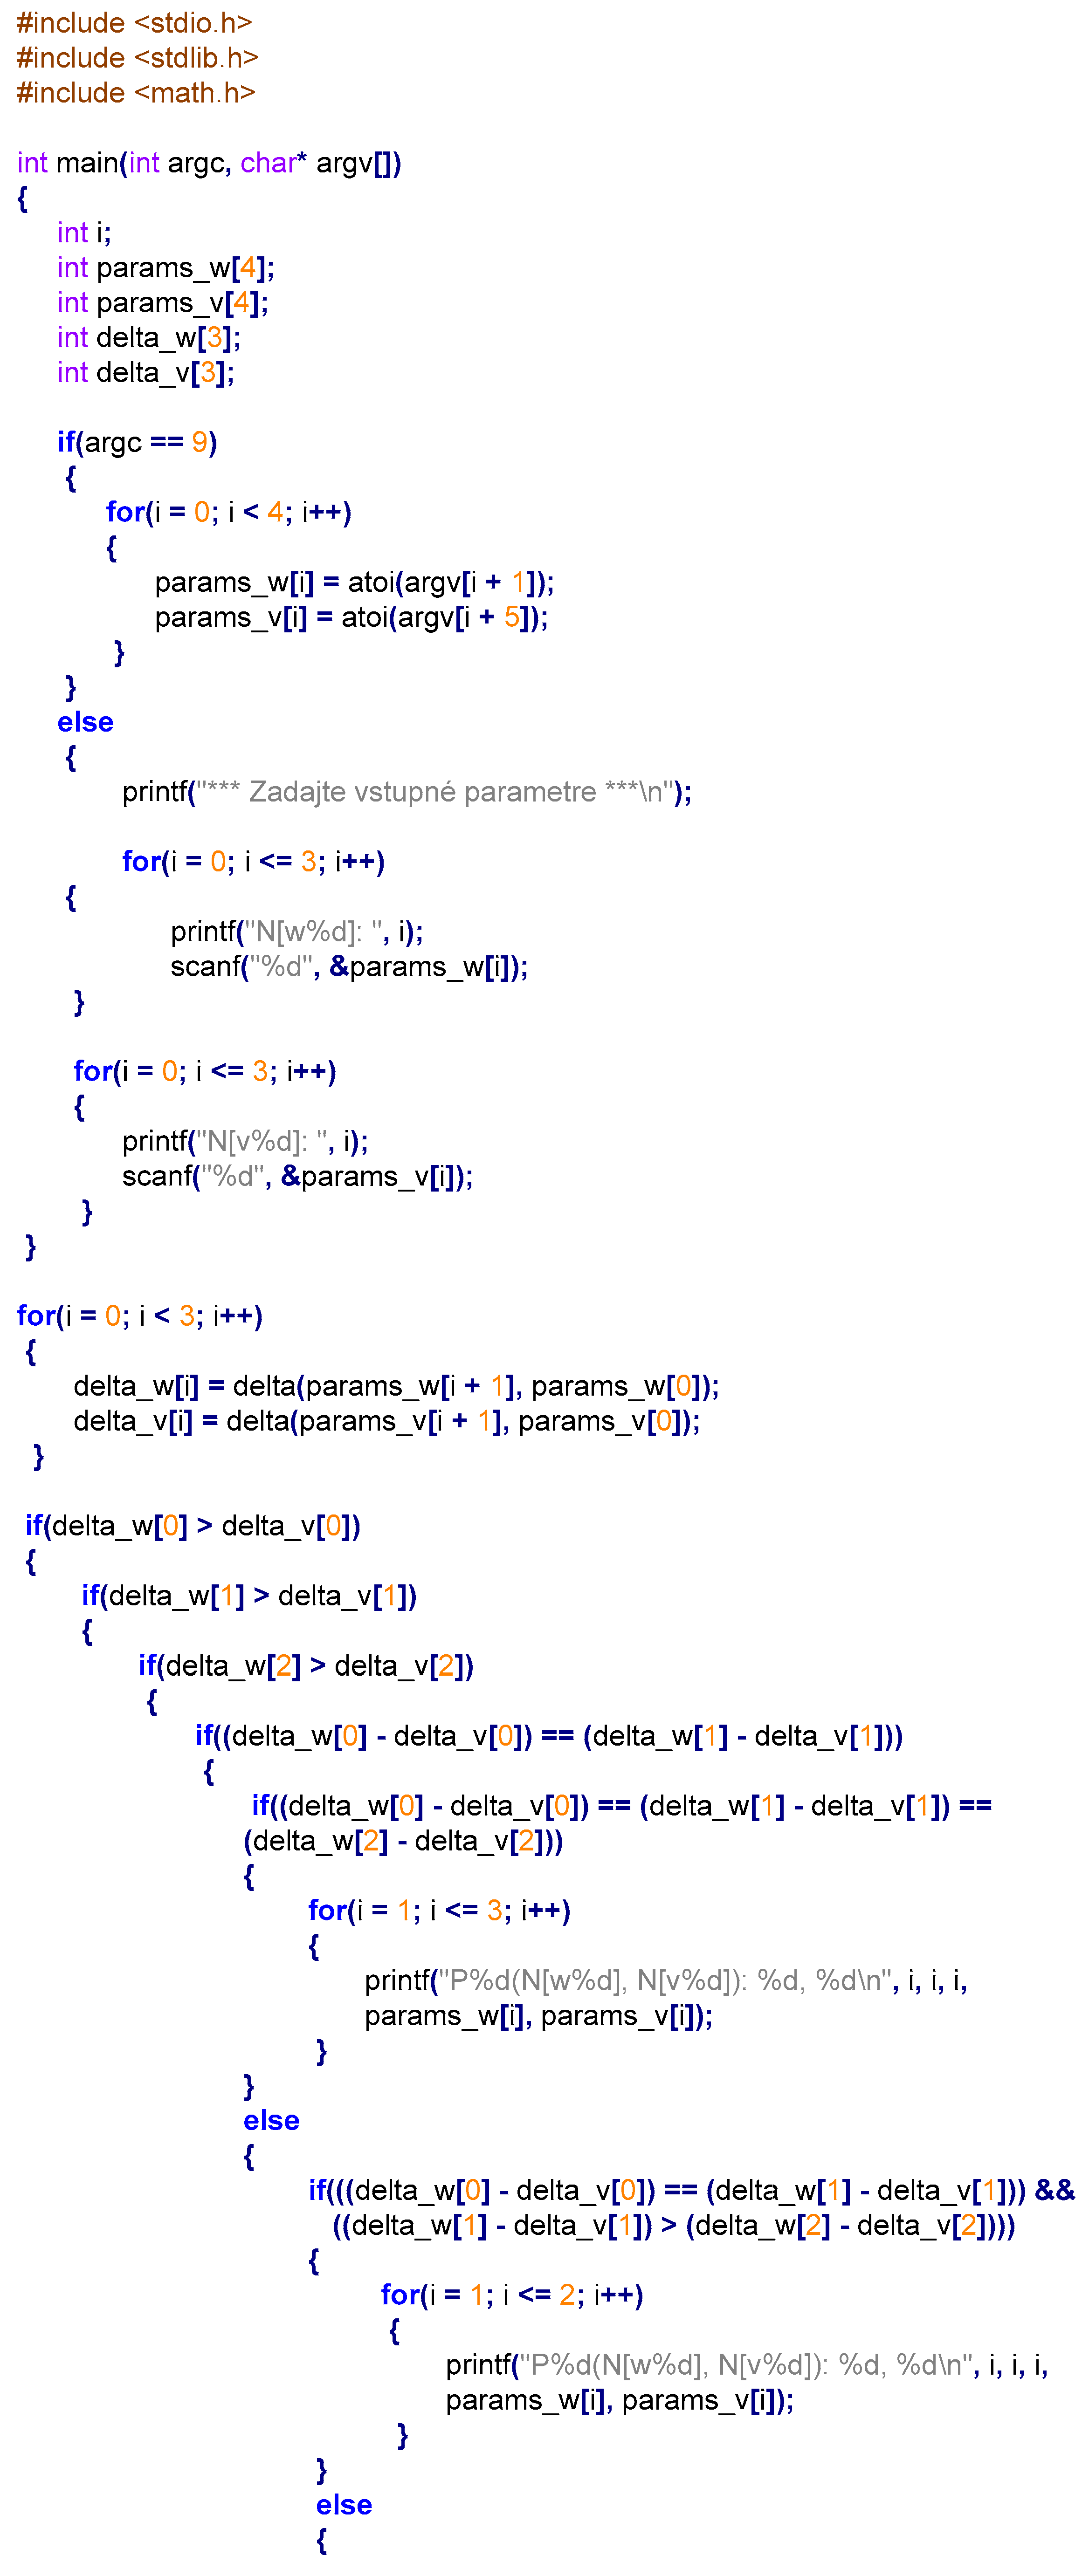
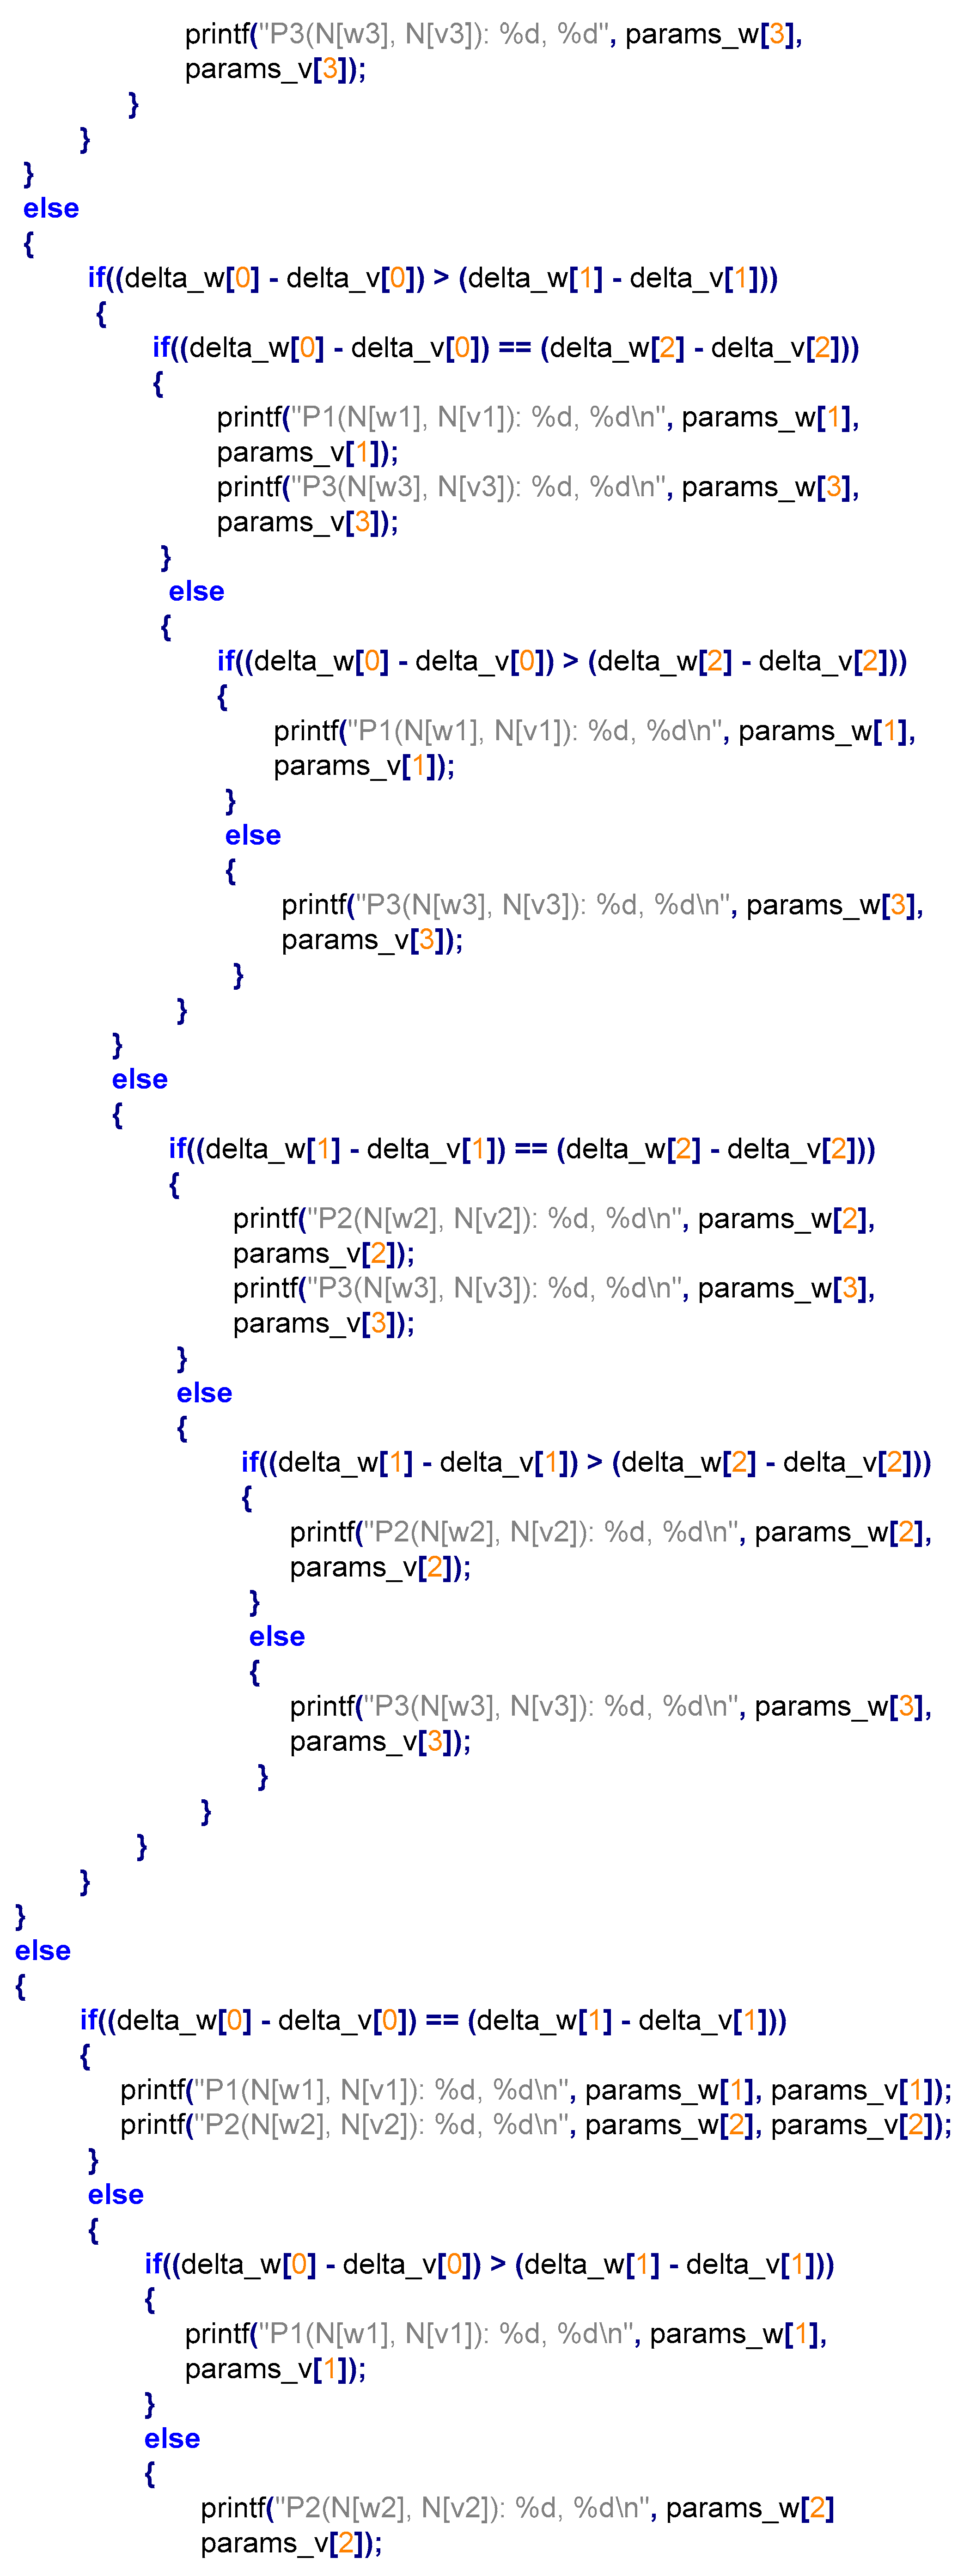
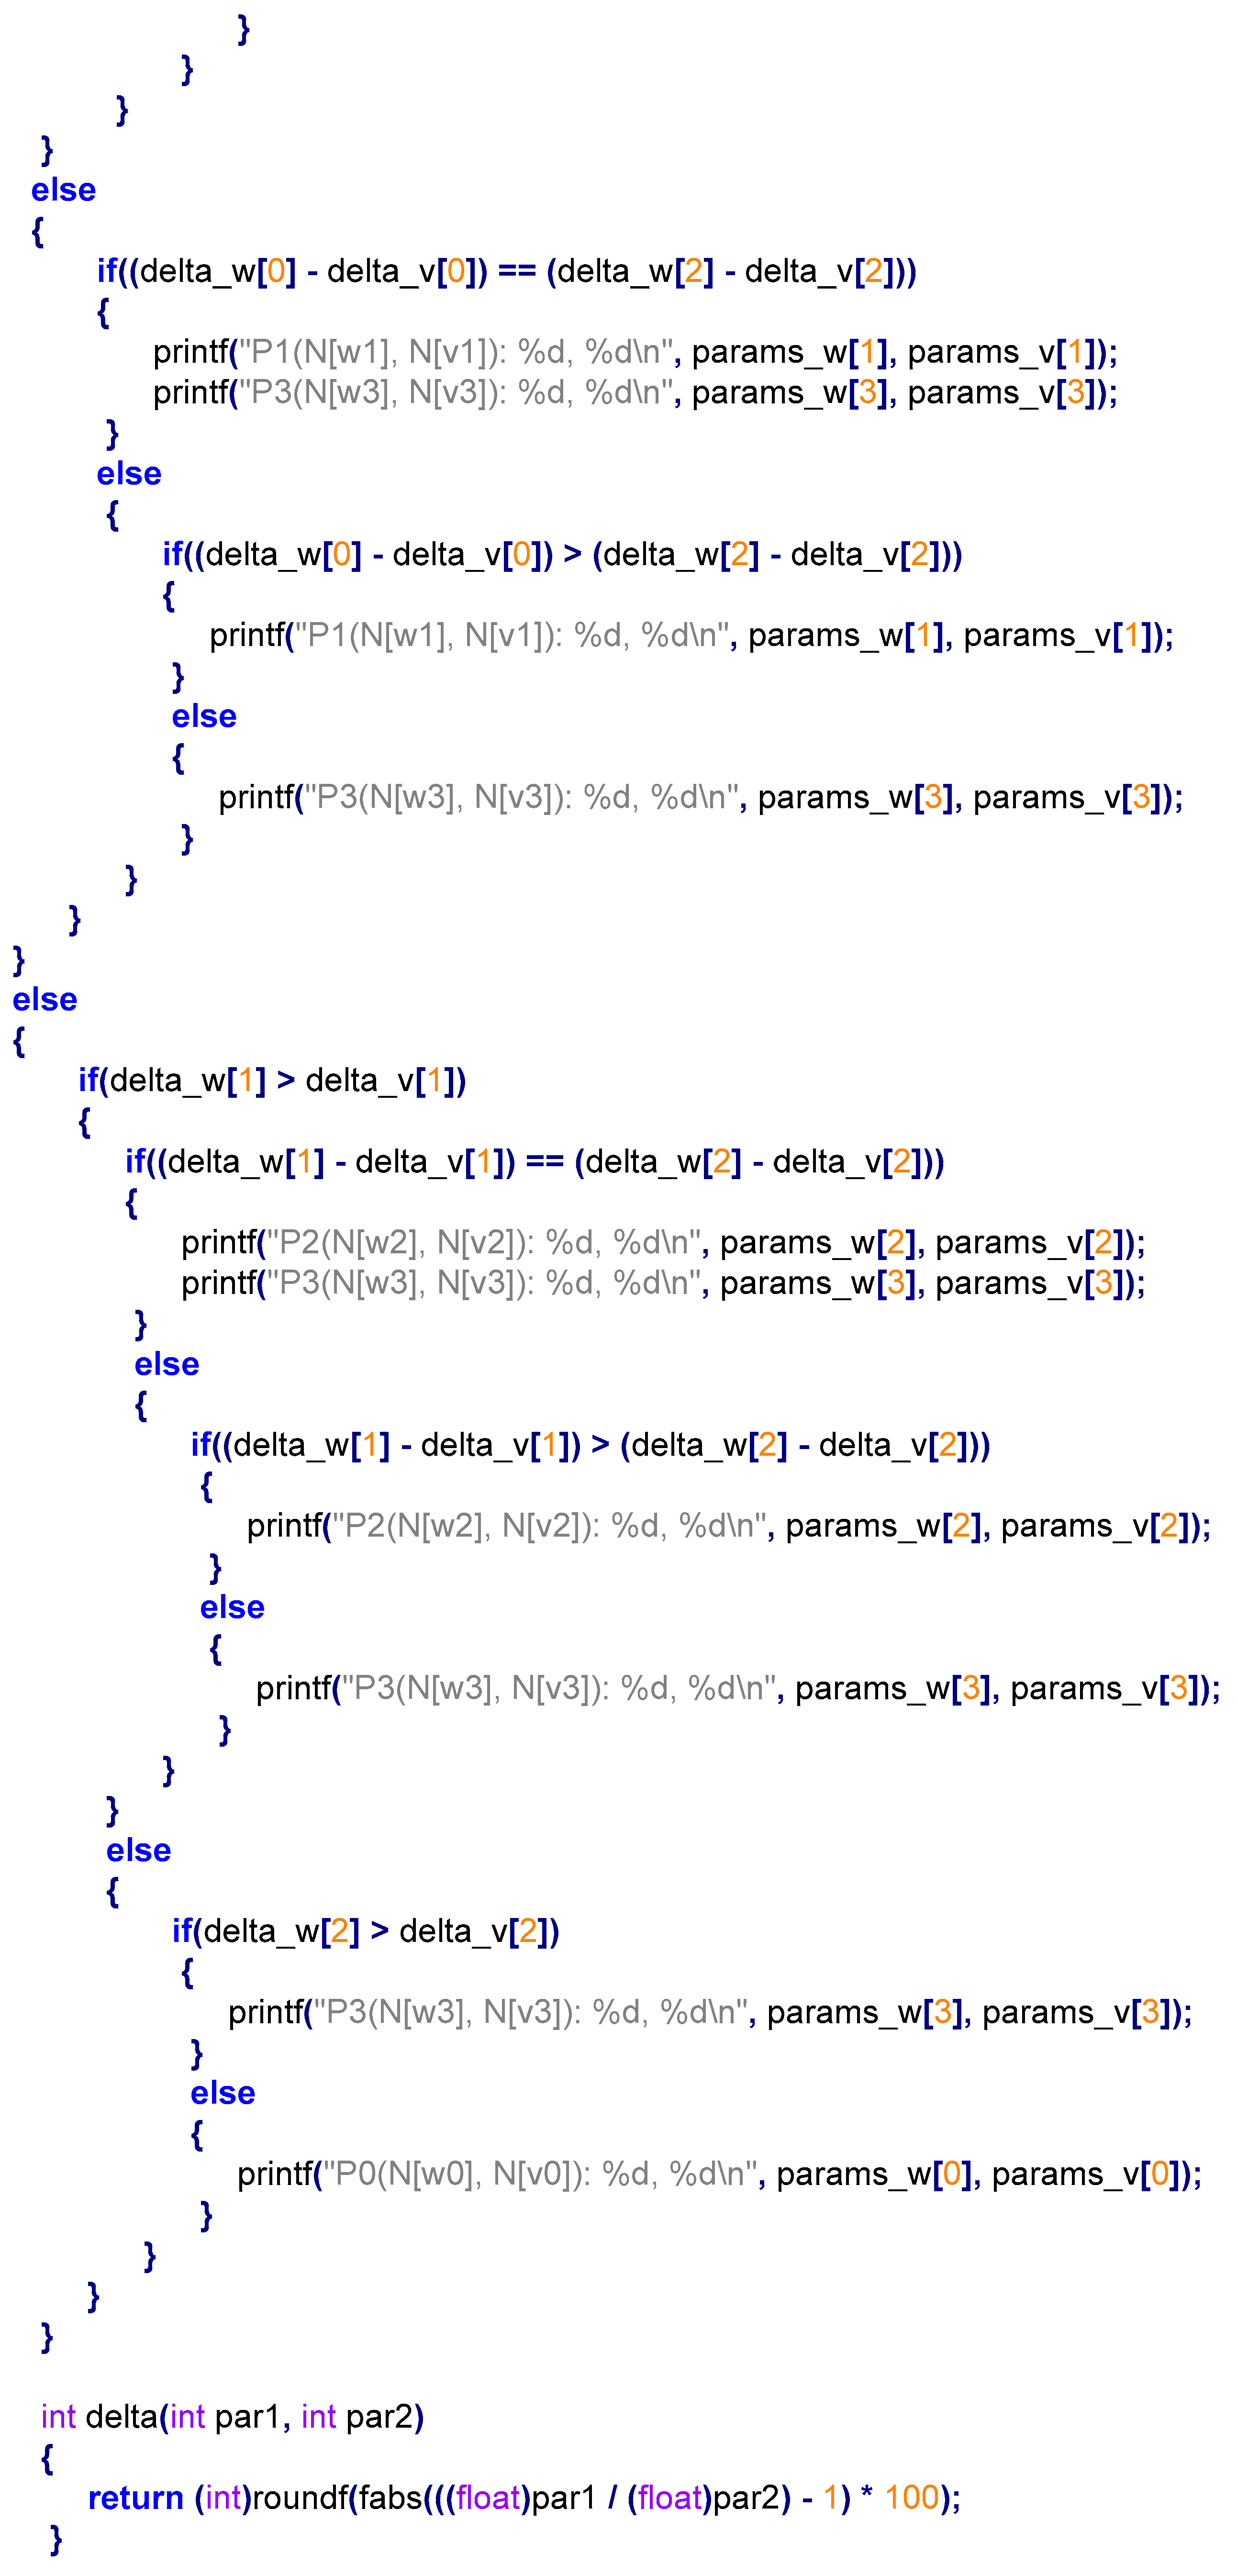
We formulated criteria for four alternative product platforms by using the flow chart algorithm depicted in Figure 3. The program code is available in Figure A1 in Appendix A. The proposed algorithm can be validated through an online calculator [35].
The presented decision-making flow chart algorithm for determining the optimal product platform was applied to a practical example described in the following section.
5. Testing of the Proposed Method
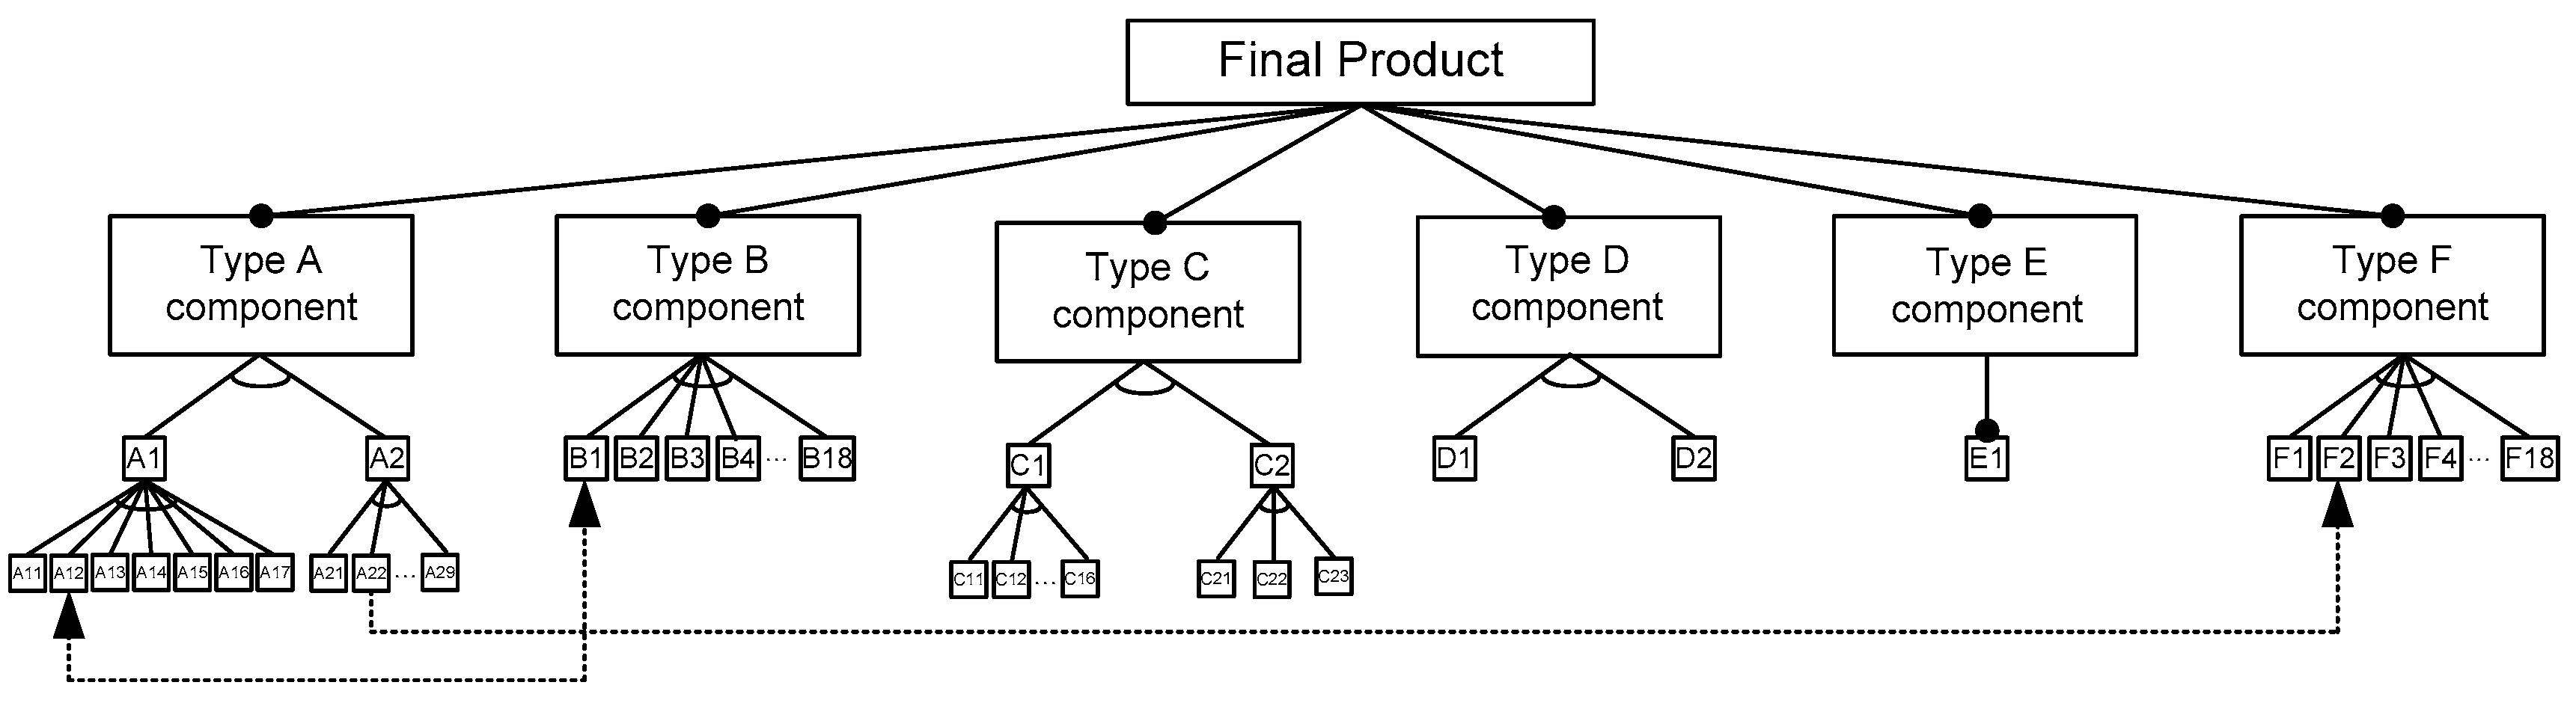
We used long-distance transport motor vehicles as an example of mass customized products. The necessary inputs for the application of the proposed method were obtained from an online truck configurator website [36]. A truck consists of six mandatory component types (types A, B, C, D, E, and F), and each component contains a specified number of optional sub-components (variants). The type A component, vehicle type/gross vehicle weight, consisted of 16 optional variants divided into two types, marked as A1 and A2, while type A1 contains seven variants and type A2 contains nine variants. The type B component, engine, had 18 optional variants, marked as B1 to B18. Cabin, the type C component, included nine optional variants, divided into C1 and C2 types of cabin, with six C1 variants from C11 to C16 and three C2 variants, marked as C21, C22, and C23. Type D component, suspension, contained two optional variants, marked as D1 and D2. The frame, the type E component, included only one mandatory option, marked as E1. The type F component, wheelbase, involved 18 optional variants, marked as F1 to F18. To describe the structure of the product, the feature diagram (Figure 4) was used as a tool, since this tool is widely used during the product line development process and is commonly used as an input to determine product architecture [37,38].
In the Figure 4 are depicted only two combination rules. The rest of combination rules (in total 59) are listed in the Table 1 and Table 2. As seen in figure, the design of the product platform of the truck includes incompatible components, such as the restricted pair of components A12 and B1. Thus, not all possible configurations are valid, where the configuration represents an arrangement of components in a particular combination. In this case, the feature model diagram includes a set of combination rules. Yang and Dong [39] described four types of combination rules: require rule, incompatible rule, port-connection rule, and resource-balancing rule. Our study case used the first two types of rules. The require rule describes the relationship between two components, meaning that one component requires another component to form a valid product. The incompatible rule indicates that one component excludes another as part of a valid product.
In the given case, 59 combination rules were used, divided into require and incompatible. As each rule is related to several components, the total number of restrictions was 172. The lists of all the rules are described in Table 1 and Table 2.
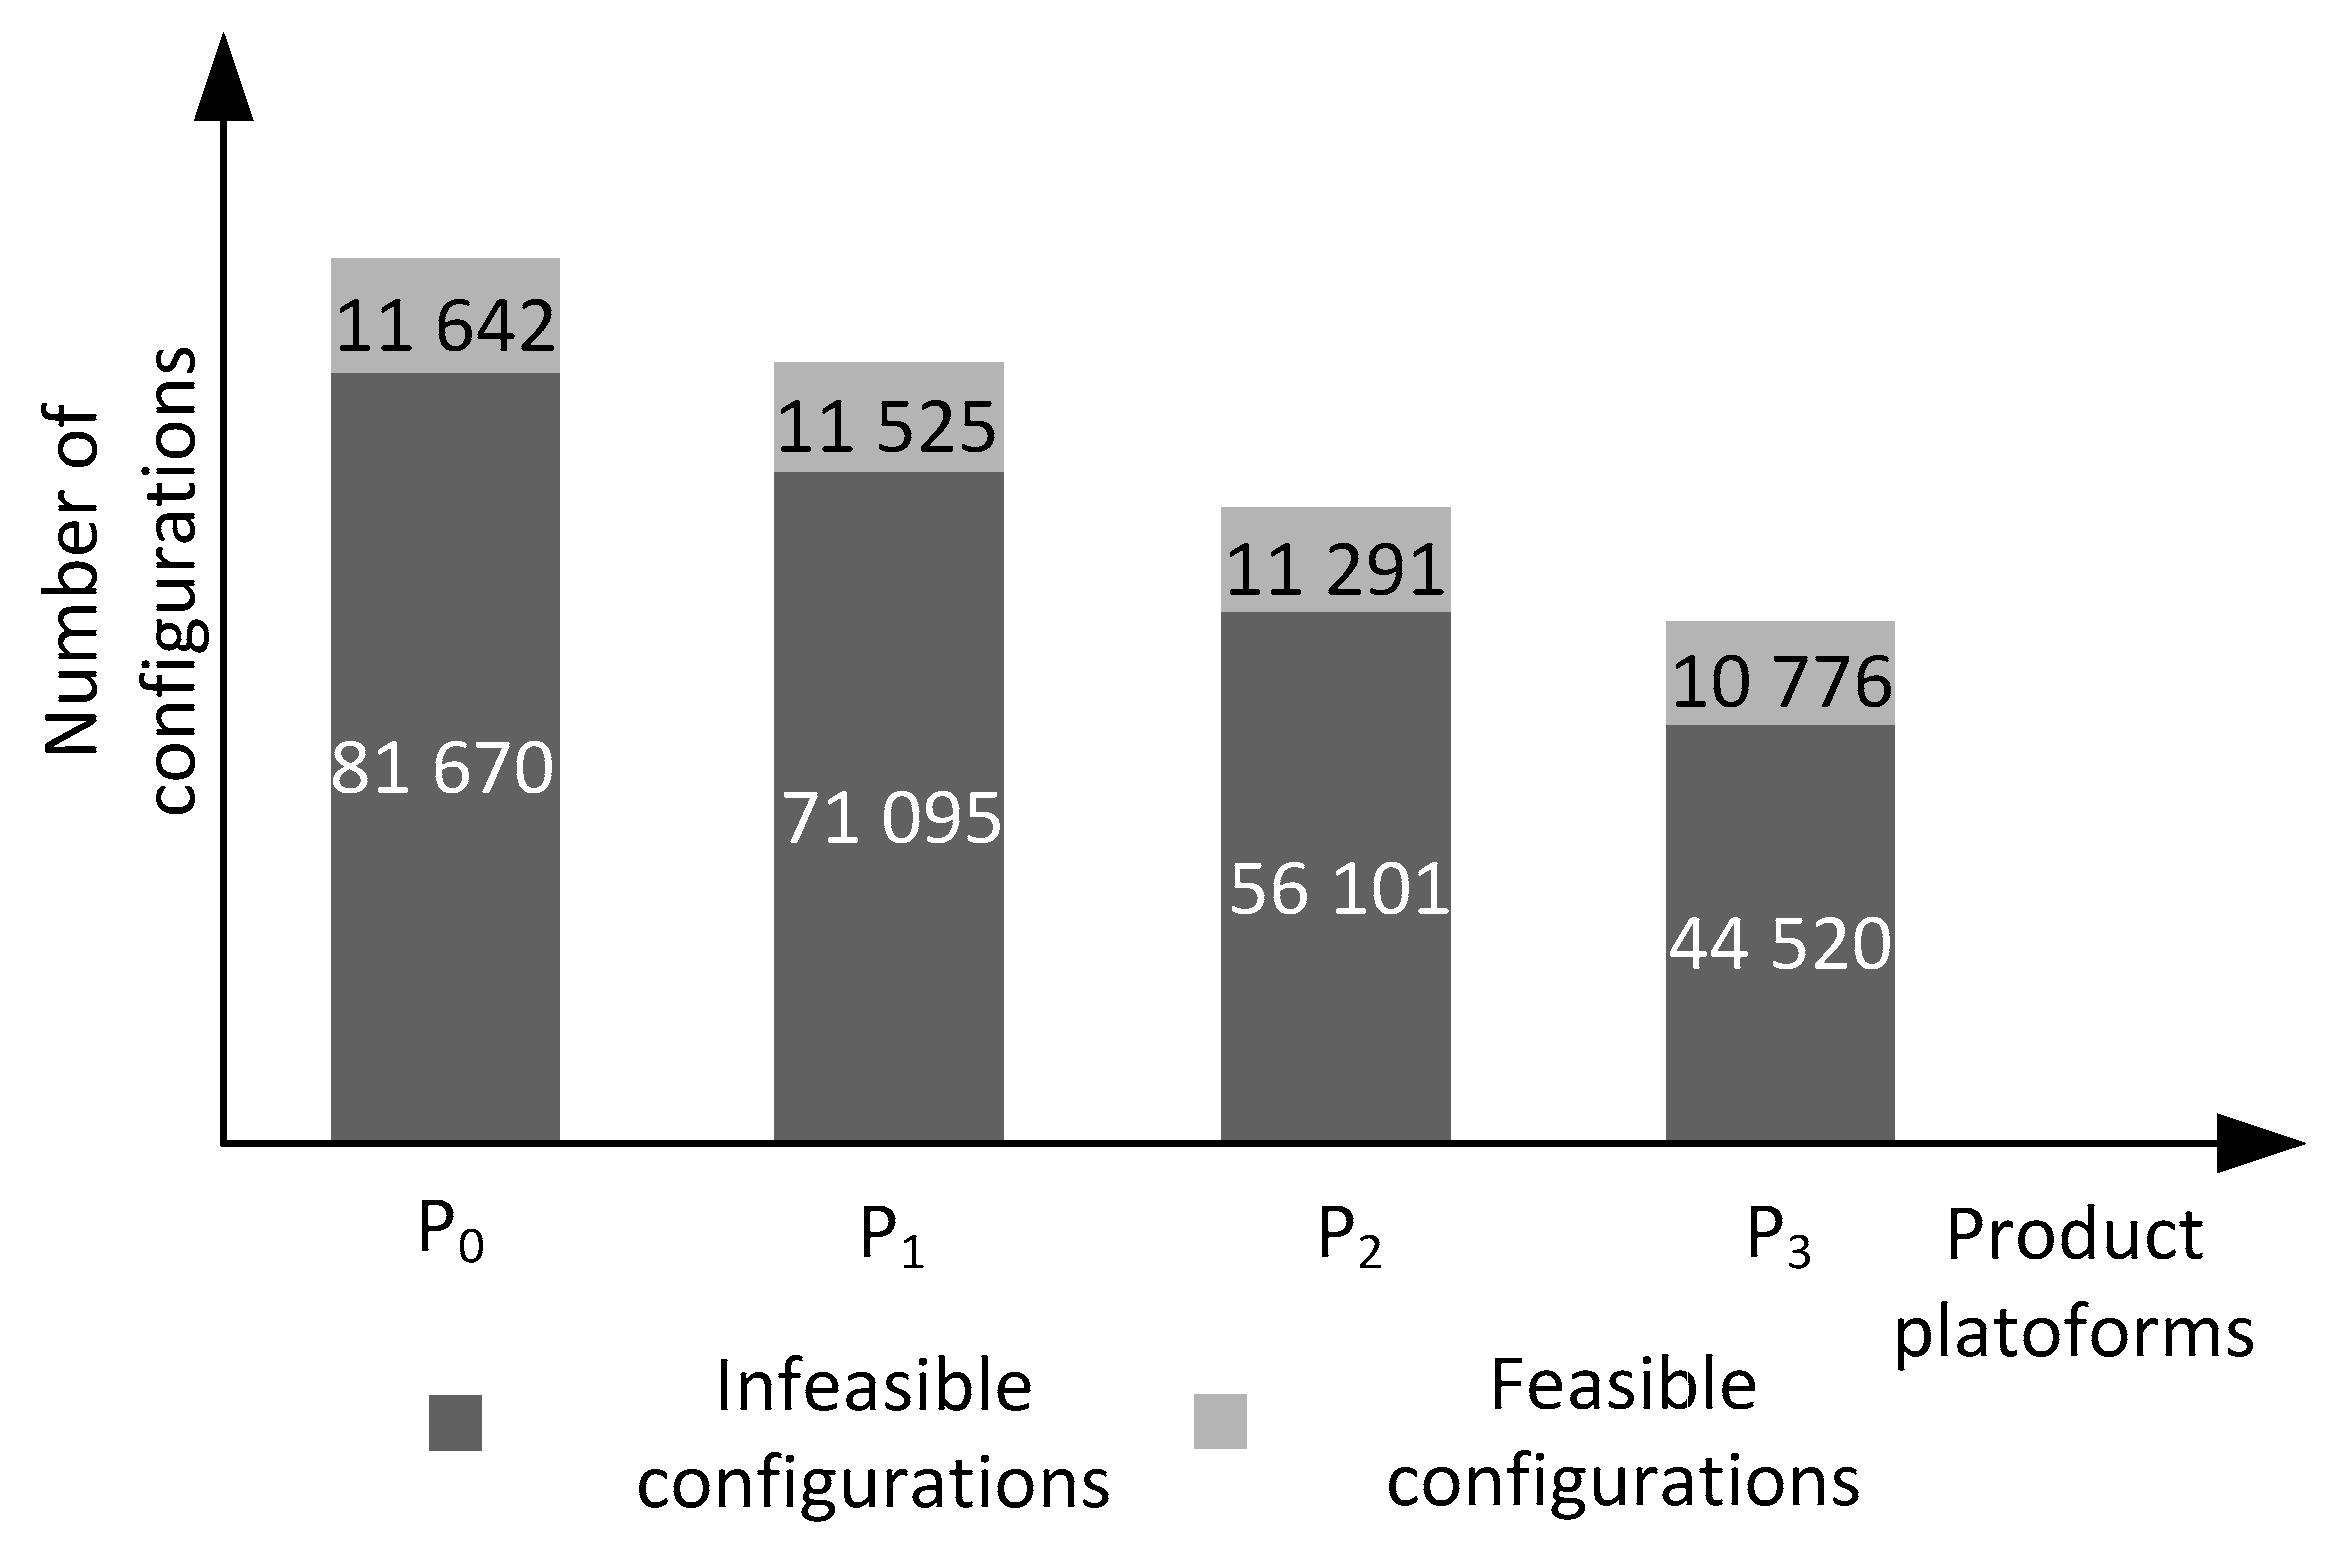
The truck product platform, when ignoring the restrictions, includes 93,312 valid products, from which 81,670 are infeasible due to the restrictions. This product platform is considered as the original complete product platform P0 with Nc0 being 93,312 and Nv0 equaling 11,642 (Figure 5). The number of product combinations when restrictions are omitted (Nc0) and the number of feasible product combinations (Nv0) was calculated with an online calculator [40].
To decrease the negative complexity of the product platform P0, we decreased the number of incompatible optional components. If we removed from original product platform the restricted pair of components A22 and F2, since A22 requires F2, then we obtained alternative product platform P1 with a Nc1 value of 82,620, a Nv1 of 11,525, and a Nw1 of 71,095 (Figure 5).
We created another alternative of the original product platform by removing P1 restricted pairs of components A23, A27, and F1 from the alternative product platform, since A23 requires component F1 and A27 requires F1. The obtained alternative product platform P2 contained the following numbers of configurations: Nc2 was 67,392, Nv2 was 11,291, and Nw2 was 56,101 (Figure 5).
As many restrictions still exist in P2 that cause negative complexity, the next product platform P3 (Figure 5) was created. We removed restricted pair of components A28 and B1 from product platform P2, since A28 excludes B1. This resulted in a Nc3 value of 55,296, a Nv3 of 10,776, and a Nw3 of 44,520. Then, the positive and negative complexity percentage rates were calculated according to Equations (3) and (4), and are shown in Table 3.
Then, we compared product platforms P0, P1, P2, and P3 using the decision-making algorithm described in Section 4. For this purpose, we needed to separately compare product platforms P0 with P1, P0 with P2, and P0 with P3 using the results of ∆Nv0,i and ∆Nw0,i from Table 3. Seeing that ∆Nw0,1 value was larger than ∆Nv0,1, ∆Nw0,2 was larger than ∆Nv0,2, and ∆Nw0,3 was larger than ∆Nv0,3, the product platforms P1, P2, and P3 were identified as better alternatives to P0. Subsequently, we found the best product platform by comparing the product platforms P1, P2, and P3 using the criteria according to the algorithm in Figure 3. The results obtained by applying the criteria were: ∆Nw0,2 − ∆Nv0,2 was larger than ∆Nw0,1 − ∆Nv0,1, and ∆Nw0,3 − ∆Nv0,3 was larger than ∆Nw0,2 − ∆Nv0,2.
Based on this, product platform P3 was identified as the best alternative of the four options. The argument for this decision is supported by the fact that when product platforms P0 and P3 are compared, the incompatible configurations (negative complexity) decreased by 46% from 81,670 to 44,520, and the number of compatible configurations decreased only 7.5% from 11,642 to 10,776.
6. Discussion and Conclusions
Infeasible combinations present a serious problem for companies that offer a variety of options on a product, either consciously or unconsciously. Companies usually overlook the core problem and deal only with its effects. Based on the results obtained from the practical example, the proposed algorithm can be used as a valid solution to eliminate or minimize the number of infeasible configurations from product options to prevent customer disappointment. Moreover, this approach results in positive implications for producers, which are as follows: (1) Decreased number of incompatible components will simplify managerial and control activities and lower costs. (2) Decreased number of incompatible components reduces direct production costs. (3) Product managers can more easily assess competitive product variety platforms against each other to evaluate their qualitative attributes through quantitative differences. (4) Designers using this method can create possible product platform alternatives by removing a voluntary amount of incompatible components from the initial product structure.
Companies applying this approach can support the MC of products and break related barriers for its further expansion. The development of this method will yield positive social, economic, and environmental implications in a variety of applications. We anticipate that mass customized manufacturing will offer new job opportunities and have the potential for positive indirect economic effects. The reduction of incompatible components is expected to be beneficial for the environment due to lower material and energy usage.
Complementary research work in this area was dedicated to the development of software guiding users in selecting or deselecting components when configuration conflict occurs during the configuration processes. As this approach had not been previously used to solve the problem, the method could enrich knowledge in many areas.
Acknowledgments
This paper has been supported by VEGA project V-16-013-00 granted by the Ministry of Education of the Slovak Republic and is part of actual research activities in the project SME 4.0 (Industry 4.0 for SMEs) with funding received from the European Union’s Horizon 2020 research and innovation program under the Marie Skłodowska-Curie Grant Agreement No 734713.
Author Contributions
Vladimir Modrak conceived and designed the empirical construct of customers behavior when facing with infeasible product options based on the analogy with the Koechlin’s experiment; Zuzana Soltysova and Vladimir Modrak developed the algorithm for selection of optimized product platform from four alternative product platforms; Jan Modrak processed program code for proposed algorithm with possibility to validate algorithm through online calculator; and Annamaria Behunova verified the algorithm through the practical example of transport motor vehicle for long-distance transport.
Conflicts of Interest
The authors declare no conflict of interest. The founding institutions had no role in the writing of the manuscript, and in the decision to publish the results.
Appendix A
Figure A1.
Program code for proposed algorithm.
References
- Davis, S.M. Future perfect. In Human Resource Management in International Firms; Palgrave Macmillan: Basingstoke, UK, 1990; pp. 18–28. [Google Scholar]
- Tseng, M.M.; Jiao, J.; Merchant, M.E. Design for mass customization. CIRP Ann. Manuf. Technol. 1996, 45, 153–156. [Google Scholar] [CrossRef]
- ElMaraghy, H. (Ed.) Enabling Manufacturing Competitiveness and Economic Sustainability. In Proceedings of the 4th International Conference on Changeable, Agile, Reconfigurable and Virtual Production, Montreal, QC, Canada, 2–5 October 2011; Springer: New York, NY, USA, 2011. [Google Scholar]
- De Weck, O.L.; (Massachusetts Institute of Technology, Cambridge, MA, USA); Suh, E.S.; (Massachusetts Institute of Technology, Cambridge, MA, USA); Chang, D.; (General Motors Research and Development, Warren, MI, USA). Product Family Strategy and Platform Design Optimization. Working Paper. 2004. Available online: http://web.mit.edu/deweck/www/PDF_archive/2%20Refereed%20Journal/2_14_JIM_portfolio_optimization_v1.pdf (accessed on 21 August 2014).
- Crippa, R.; Bertacci, N.; Larghi, L. Representing and Measurement Manufacturing Flow Complexity in the Extended enterprise: The D4G Approach. In Proceedings of the 6th International Congress of Logistics Research RIRL, Pontremoli, Italy, 3–6 September 2006; pp. 231–242. [Google Scholar]
- Götzfried, M. Managing Complexity Induced by Product Variety in Manufacturing Companies: Complexity Evaluation and Integration in Decision-Making. Ph.D. Dissertation, University of St. Gallen, St. Gallen, Switzerland, 2013. Available online: https://www1.unisg.ch/www/edis.nsf/SysLkpByIdentifier/4148/$FILE/dis4148.pdf (accessed on 17 May 2013).
- Seepersad, C.C.; Hernandez, G.; Allen, J.K. A Quantitative Approach to Determining Product Platform Extent. In Proceedings of the ASME Advances in Design Automation Conference, Baltimore, MD, USA, 10–13 September 2000; Available online: https://www.researchgate.net/publication/245017801_A_Quantitative_Approach_to_Determining_Product_Platform_Extent (accessed on 19 May 2014).
- De Weck, O.L. Determining product platform extent. In Product Platform and Product Family Design; Simpson, T.W., Siddique, Z., Jiao, R.J., Eds.; Springer: New York, NY, USA, 2006; pp. 241–301. ISBN 978-0-387-29197-0. [Google Scholar]
- Michaelis, M.T.; Johannesson, H.; ElMaraghy, H.A. Function and process modeling for integrated product and manufacturing system platforms. J. Manuf. Syst. 2015, 36, 203–215. [Google Scholar] [CrossRef]
- Heradio, R.; Perez-Morago, H.; Alférez, M.; Fernandez-Amoros, D.; Alférez, G.H. Augmenting measure sensitivity to detect essential, dispensable and highly incompatible features in mass customization. Eur. J. Oper. Res. 2016, 248, 1066–1077. [Google Scholar] [CrossRef]
- Bonev, M.; Hvam, L.; Clarkson, J.; Maier, A. Formal computer-aided product family architecture design for mass customization. Comput. Ind. 2015, 74, 58–70. [Google Scholar] [CrossRef] [Green Version]
- Hu, S.J.; Zhu, X.; Wang, H.; Koren, Y. Product variety and manufacturing complexity in assembly systems and supply chains. CIRP Ann. Manuf. Technol. 2008, 57, 45–48. [Google Scholar] [CrossRef]
- Modrak, V. (Ed.) Mass Customized Manufacturing: Theoretical Concepts and Practical Approaches; CRC Press: Boca Raton, FL, USA, 2017. [Google Scholar]
- Rauch, E.; Dallasega, P.; Matt, D.T. Sustainable production in emerging markets through Distributed Manufacturing Systems (DMS). J. Clean. Prod. 2016, 135, 127–138. [Google Scholar] [CrossRef]
- Sonsino, D.; Benzion, U.; Mador, G. The complexity effects on choice with uncertainty–Experimental evidence. Econo J. 2002, 112, 936–965. [Google Scholar] [CrossRef]
- Rice, J. Will an ecosystem approach mitigate the factors of unsustainability? FAO Fish. Rep. 2005, 782, 191. [Google Scholar]
- Abdelkafi, N. Variety Induced Complexity in Mass Customization: Concepts and Management; Erich Schmidt Verlag GmbH & Co KG: Berlin, Germany, 2008. [Google Scholar]
- Huffman, C.; Kahn, B.E. Variety for sale: Mass customization or mass confusion? J. Retail. 1998, 74, 491–513. [Google Scholar] [CrossRef]
- Boër, C.R.; Dulio, S. Mass Customization and Footwear: Myth, Salvation or Reality? A Comprehensive Analysis of the Adoption of the Mass Customization Paradigm in Footwear, from the Perspective of the EUROShoE (Extended User Oriented Shoe Enterprise) Research Project; Springer: Berlin, Germany, 2007. [Google Scholar]
- Ulrich, K.T.; Eppinger, S.D. Product Design and Development; McGraw-Hill: New York, NY, USA, 2004. [Google Scholar]
- Pitiot, P.; Aldanondo, M.; Vareilles, E. Concurrent product configuration and process planning: Some optimization experimental results. Comput. Ind. 2014, 65, 610–621. [Google Scholar] [CrossRef]
- Helo, P.T.; Xu, Q.L.; Kyllönen, S.J.; Jiao, R.J. Integrated vehicle configuration system connecting the domains of mass customization. Comput. Ind. 2010, 61, 44–52. [Google Scholar] [CrossRef]
- Mailharro, D. A classification and constraint-based framework for configuration. Artif. Intell. Eng. Des. Anal. Manuf. 1998, 12, 383–397. [Google Scholar] [CrossRef]
- Aldanondo, M.; Vareilles, E.; Djefel, M. Towards an association of product configuration with production planning. Int. J. Mass Cust. 2010, 3, 316–332. [Google Scholar] [CrossRef]
- Quelch, J.A.; Jocz, K.E. Greater Good: How Good Marketing Makes for Better Democracy, 1st ed.; Harvard Business Review Press: Brighton, MA, US, 2008; p. 339. [Google Scholar]
- Orsvärn, K.; Axling, T. The Tacton view of configuration tasks and engines. In Workshop on Configuration, Proceedings of the Sixteenth National Conference on Artificial Intelligence (AAAI-99), Orlando, FL, USA, 18–22 July 1999. [Google Scholar]
- Fraizer, S.; Wells, R. System for Presenting Customer Constrained Purchase Choices in an On-Line Store. W.O. Patent 2001091019 A1 filed; 25 May 2001 and issued 29 November 2001,
- Hora, M.; Hankammer, S.; Canetta, L.; Sel, S.K.; Gomez, S.; Gahrens, S. Designing Business Models for Sustainable Mass Customization: A Framework Proposal. Int. J. Ind. Eng. Manag. 2016, 7, 143–152. [Google Scholar]
- Osorio, J.; Romero, D.; Betancur, M.; Molina, A. Design for Sustainable Mass-Customization: Design Guidelines for Sustainable Mass-Customized Products. In Proceedings of the 2014 International Conference on Engineering, Technology and Innovation (ICE), Bergamo, Italy, 23–25 June 2014; pp. 1–9. [Google Scholar]
- Spinney, L. Roots of brutality. New Sci. 2015, 228, 40–43. [Google Scholar] [CrossRef]
- Gromet, D.M.; Goodwin, G.P.; Goodman, R.A. Pleasure from another’s pain: The Influence of a Target’s Hedonic States on Attributions of Immorality and Evil. Personal. Soc. Psychol. Bull. 2016, 42, 1077–1091. [Google Scholar] [CrossRef] [PubMed]
- Fried, I. Syndrome, E. Lancet 1997, 350, 1845–1847. [Google Scholar] [CrossRef]
- Krus, P. Design Space Configuration for Minimizing Design Information Entropy. In ICoRD’15—Research into Design across Boundaries: Theory, Research Methodology, Aesthetics, Human Factors and Education; Springer: Berlin, Germany, 2015; Volume 1, pp. 51–60. ISBN 978-81-322-2231-6. [Google Scholar]
- Modrak, V.; Krus, P.; Bednar, S. Approaches to product variety management assuming configuration conflict problem. FME Trans. 2015, 43, 271–278. [Google Scholar] [CrossRef]
- Modrak, J. Product Platform Calculator. Available online: http://www.fvt.tuke.sk/download/algoritmus.html (accessed on 17 September 2017).
- Mercedes-Benz Configurator. Available online: https://toc.mercedes-benz.com/lkw_konfigurator_toc_uk1/toc.dll (accessed on 10 August 2017).
- Benavides, D.; Segura, S.; Ruiz-Cortés, A. Automated analysis of feature models 20 years later: A literature review. Inf. Syst. 2010, 35, 615–636. [Google Scholar] [CrossRef] [Green Version]
- Bontemps, Y.; Heymans, P.; Schobbens, P.Y.; Trigaux, J.C. Generic Semantics of Feature Diagrams Variants. FIW 2005, 51, 58–77. [Google Scholar]
- Yang, D.; Dong, M. A constraint satisfaction approach to resolving product configuration conflicts. Adv. Eng. Inf. 2012, 26, 592–602. [Google Scholar] [CrossRef]
- Software Product Lines Online Tools. Available online: www.splot-research.org (accessed on 5 July 2017).
Figure 1.
Koechlin’s experiment on Syndrome E.
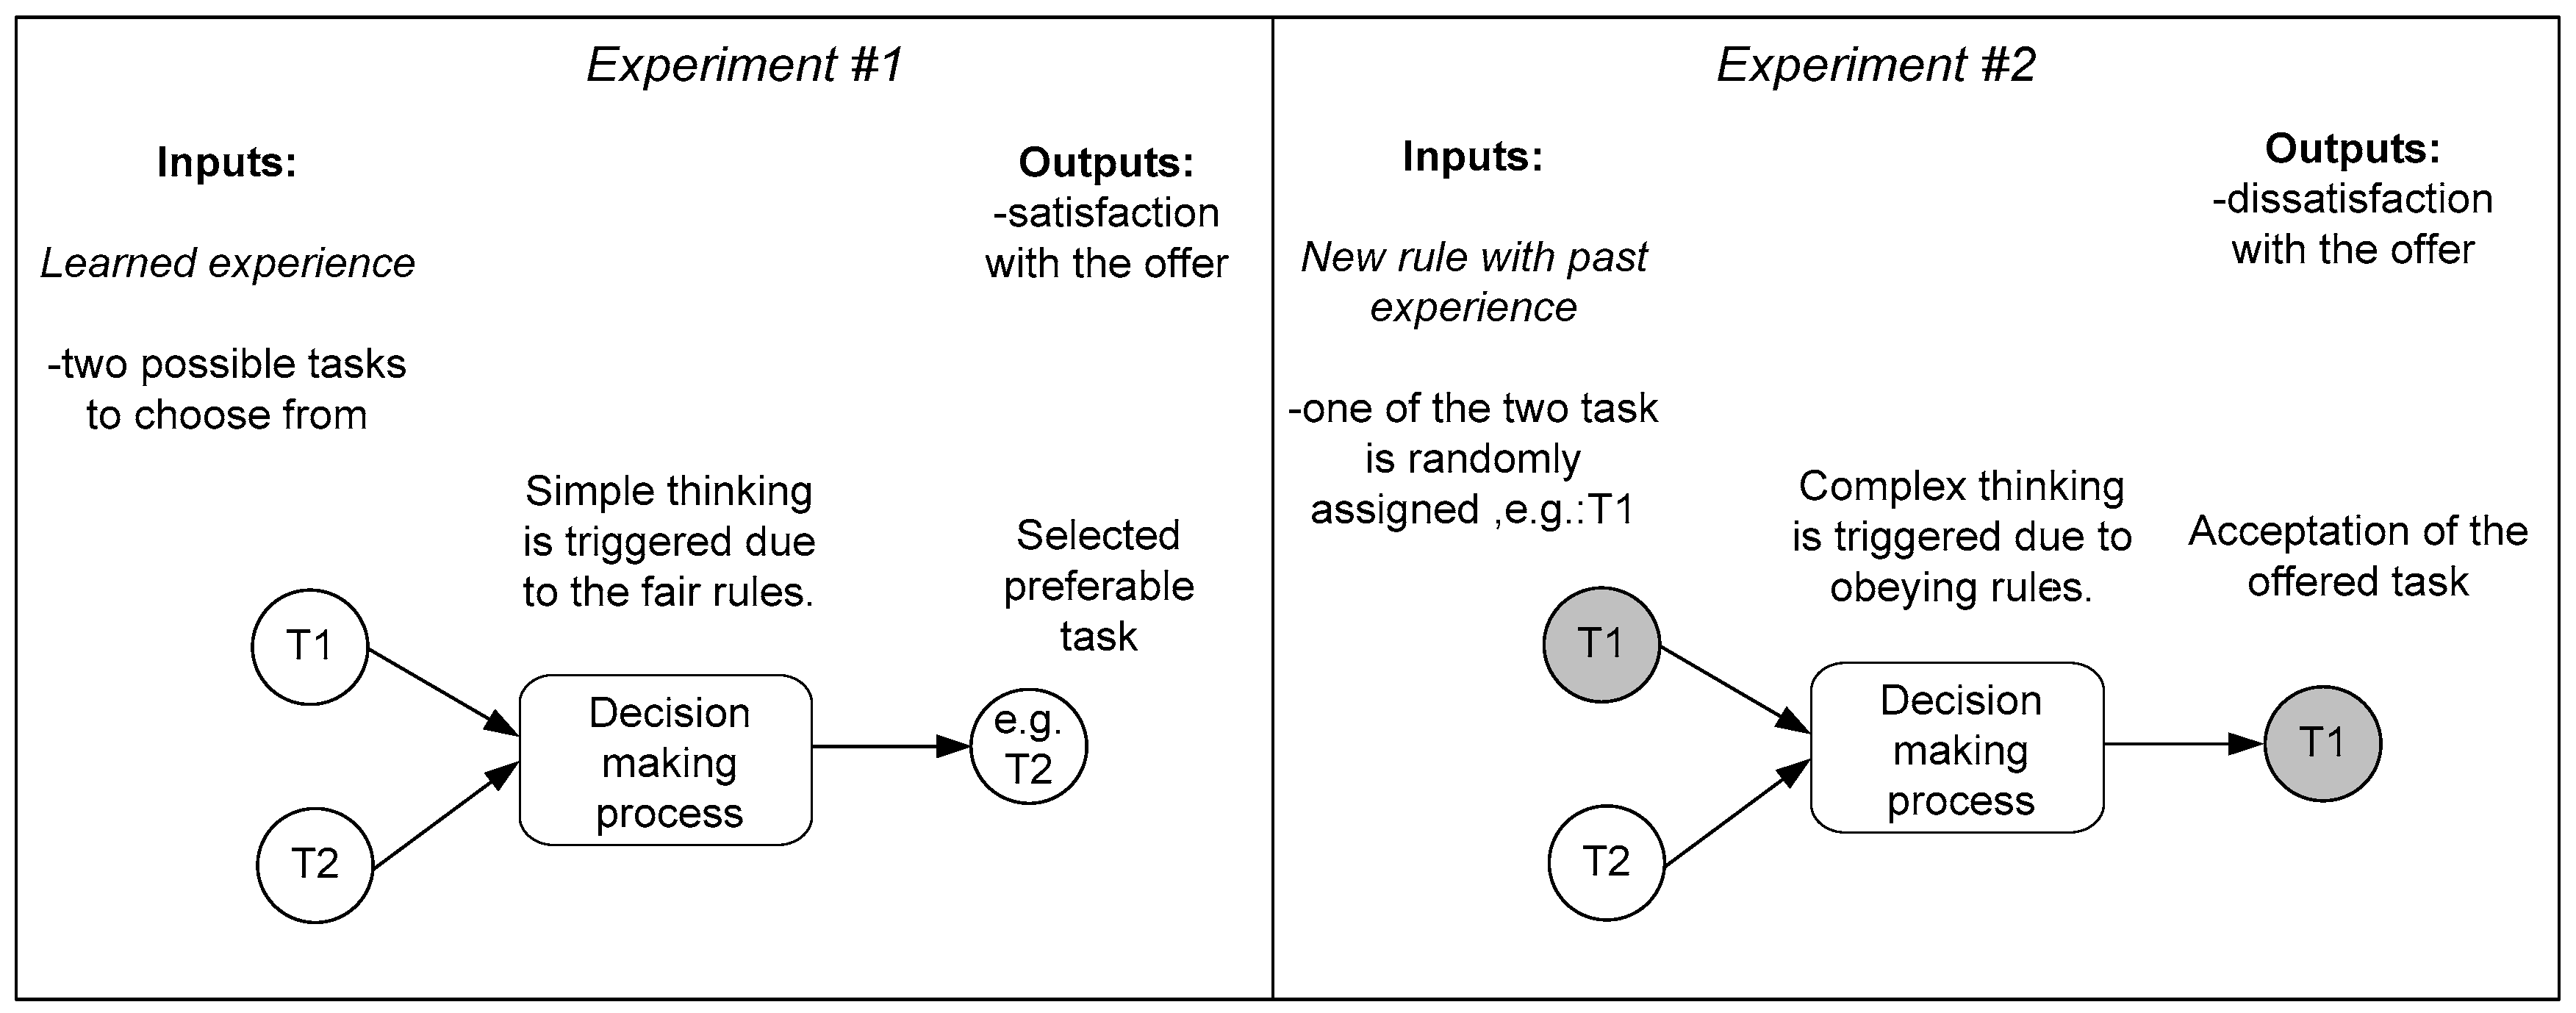
Figure 2.
Empirical construct of customer’s satisfaction/dissatisfaction: (a) convenient situation causing customer satisfaction; and (b) inconvenient situation causing customer dissatisfaction.
Figure 2.
Empirical construct of customer’s satisfaction/dissatisfaction: (a) convenient situation causing customer satisfaction; and (b) inconvenient situation causing customer dissatisfaction.
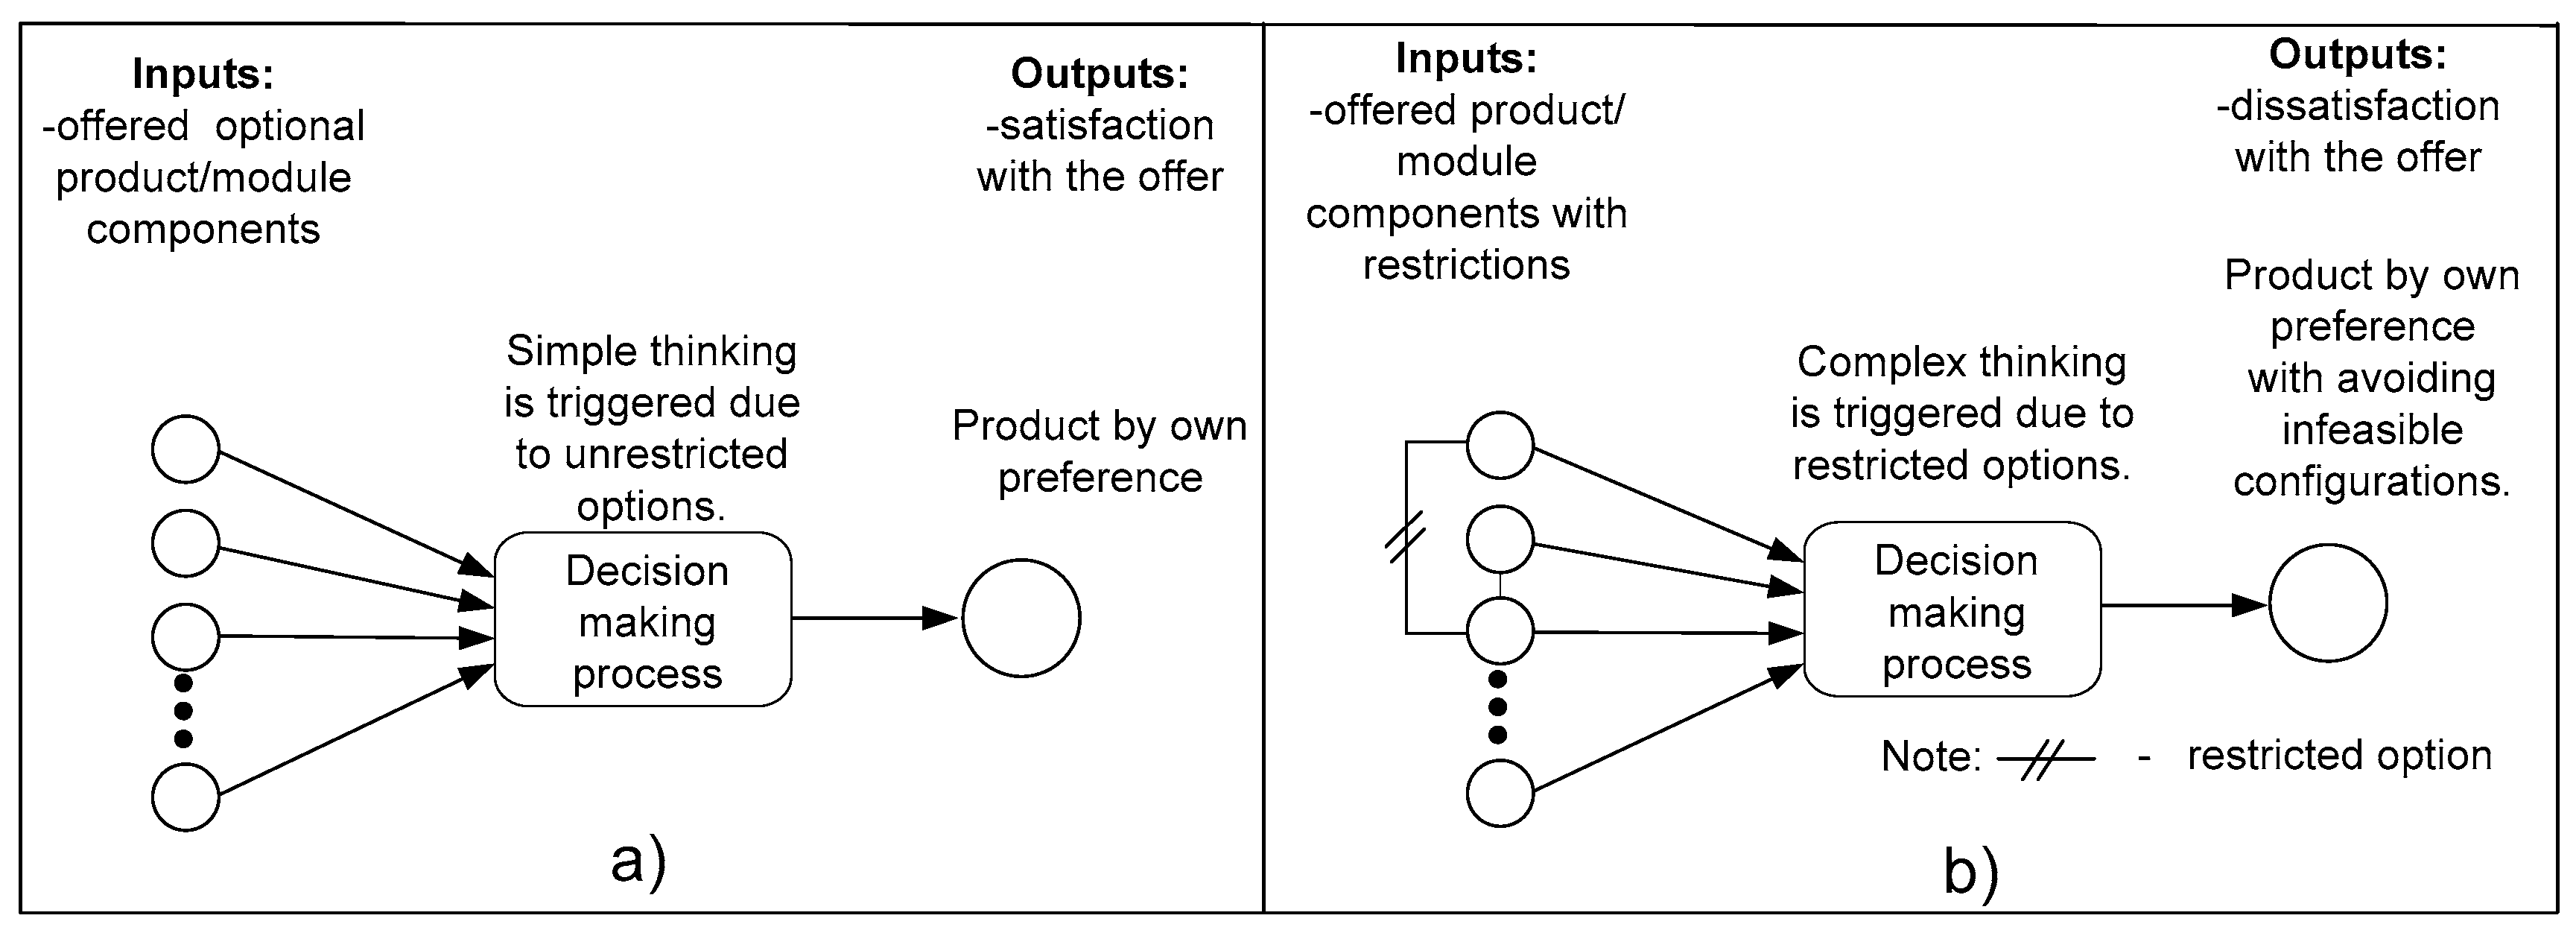
Figure 3.
Decision-making flow chart algorithm for determining an optimal product platform.

Figure 4.
Feature model diagram for a long-distance transport motor vehicle.

Figure 5.
Quantitative properties of the original complete product platform P0 and alternative product platforms P1, P2, and P3.
Figure 5.
Quantitative properties of the original complete product platform P0 and alternative product platforms P1, P2, and P3.

Table 1.
Require rules for online truck configuration.
| No. | Rule Description | |
|---|---|---|
| R#1 | Require Rules | Com A21 → ComF5, F6, F7, and F8 |
| R#2 | Com A22 → Com F2 | |
| R#3 | Com A23 → Com F1 | |
| R#4 | Com A24 → Com F3, F4, F5, and F8 | |
| R#5 | Com A25 → Com F3, F4, F5, and F8 | |
| R#6 | Com A26 → Com F5, F6, F7, and F8 | |
| R#7 | Com A27 → Com F1 | |
| R#8 | Com A28 → Com F3, F4, and F5 | |
| R#9 | Com A29 → Com F3, F4, and F5 |
Note: Com means component; → means require.
Table 2.
Incompatible rules for online truck configuration.
| No. | Rule Description | No. | Rule Description | |
|---|---|---|---|---|
| R#1 | Incompatible Rules | ⌐ (Com A11˄ Com F1, F2, F3, F4, F5, F7, F9) | R#26 | ⌐ (Com A25 ˄ Com D1) |
| R#2 | ⌐ (Com A12 ˄ ComB1) | R#27 | ⌐ (Com A26 ˄ Com D1) | |
| R#3 | ⌐ (Com A12 ˄ Com F1, F2, F3, F4, F5, F6, F7, F9, F17, F18) | |||
| R#4 | ⌐ (Com A13 ˄Com B1, B8, B9, B18) | R#28 | ⌐ (Com A27 ˄ Com B1) | |
| R#5 | ⌐ (Com A13 ˄Com D1) | R#29 | ⌐ (Com A27 ˄ Com D1) | |
| R#6 | ⌐ (Com A13 ˄Com F1, F2, F4, F6, F8, F10, F11, F12, F13, F14, F15, F16, F17, F18) | R#30 | ⌐ (Com A28 ˄ Com B1) | |
| R#7 | ⌐ (Com A14 ˄ Com B1, B2, B10, B11, B12) | R#31 | ⌐ (Com A28 ˄ Com D1) | |
| R#8 | ⌐ (Com A14 ˄ Com D1) | R#32 | ⌐ (Com A29 ˄ Com B1) | |
| R#9 | ⌐ (Com A14 ˄ Com F1, F2, F3, F4, F5, F7, F9, F16, F17, F18) | R#33 | ⌐ (Com A29 ˄ Com D1) | |
| R#10 | ⌐ (Com A15 ˄ Com D1) | R#34 | ⌐ (Com B1 ˄ Com C2, C11, C12) | |
| R#11 | ⌐ (Com A15 ˄ Com F1, F2, F3, F4, F5, F8, F9) | R#35 | ⌐ (Com B1 ˄ Com F1, F2, F3, F4, F9) | |
| R#12 | ⌐ (Com A16 ˄ Com D1) | R#36 | ⌐ (Com B2 ˄ Com C2, C11, C12) | |
| R#13 | ⌐ (Com A16 ˄ Com B1) | R#37 | ⌐ (Com B5 ˄ Com C15, C16) | |
| R#14 | ⌐ (Com A16 ˄Com F1, F2, F3, F4, F5, F7, F9, F16, F17, F18) | R#38 | ⌐ (Com B6 ˄ Com C15, C16) | |
| R#15 | ⌐ (Com A17 ˄Com D1) | R#39 | ⌐ (Com B7 ˄ Com C15, C16) | |
| R#16 | ⌐ (Com A17 ˄ Com B1, B8, B9, B18) | R#40 | ⌐ (Com B8 ˄ Com C15, C16) | |
| R#17 | ⌐ (Com A17 ˄ Com F1, F2, F3, F4, F5, F6, F7, F9, F17, F18) | R#41 | ⌐ (Com B8 ˄ Com F9) | |
| R#18 | ⌐ (Com A21 ˄ Com D1) | R#42 | ⌐ (Com B9 ˄ Com C15, C16) | |
| R#19 | ⌐ (Com A22 ˄ Com B1) | R#43 | ⌐ (Com B9 ˄ Com F9) | |
| R#20 | ⌐ (Com A22 ˄ Com D1) | R#44 | ⌐ (Com B10 ˄ Com C2, C11, C12) | |
| R#21 | ⌐ (Com A23 ˄ Com B1) | R#45 | ⌐ (Com B11 ˄ Com C2, C11, C12) | |
| R#22 | ⌐ (Com A23 ˄ Com D1) | R#46 | ⌐ (Com B12 ˄ Com C2, C11, C12) | |
| R#23 | ⌐ (Com A24 ˄ Com B1) | R#47 | ⌐ (Com B16 ˄ Com C15, C16) | |
| R#24 | ⌐ (Com A24 ˄ Com D1) | R#48 | ⌐ (Com B17 ˄ Com C15, C16) | |
| R#25 | ⌐ (Com A25 ˄ Com B1, B2, B10, B11, B12) | R#49 | ⌐ (Com B18 ˄ Com C15, C16) | |
| R#50 | ⌐ (Com B18 ˄ Com F9) |
Note: Com means component; ⌐ denotes exclude; ˄ denotes and.
Table 3.
Percentage rates of positive and negative complexity of the created product platforms.
| Product Platform | ∆Nv0,i i = 1, 2, 3 | ∆Nw0,i i = 1, 2, 3 |
|---|---|---|
| P0 | - | - |
| P1 | 1 | 13 |
| P2 | 3 | 31 |
| P3 | 7 | 46 |
© 2017 by the authors. Licensee MDPI, Basel, Switzerland. This article is an open access article distributed under the terms and conditions of the Creative Commons Attribution (CC BY) license (http://creativecommons.org/licenses/by/4.0/).
Share and Cite
MDPI and ACS Style
Modrak, V.; Soltysova, Z.; Modrak, J.; Behunova, A. Reducing Impact of Negative Complexity on Sustainability of Mass Customization. Sustainability 2017, 9, 2014. https://doi.org/10.3390/su9112014
AMA Style
Modrak V, Soltysova Z, Modrak J, Behunova A. Reducing Impact of Negative Complexity on Sustainability of Mass Customization. Sustainability. 2017; 9(11):2014. https://doi.org/10.3390/su9112014
Chicago/Turabian StyleModrak, Vladimir, Zuzana Soltysova, Jan Modrak, and Annamaria Behunova. 2017. "Reducing Impact of Negative Complexity on Sustainability of Mass Customization" Sustainability 9, no. 11: 2014. https://doi.org/10.3390/su9112014
Note that from the first issue of 2016, this journal uses article numbers instead of page numbers. See further details here.