Article

Emergy Perspectives on the Environmental Performance and Sustainability of Small-Scale Gold Production Systems in Ghana

State Key Joint Laboratory of Environmental Simulation and Pollution Control, School of Environment, Beijing Normal University, Beijing 100875, China
*
Author to whom correspondence should be addressed.
Sustainability 2017, 9(11), 2034; https://doi.org/10.3390/su9112034
Submission received: 20 August 2017 / Accepted: 21 October 2017 / Published: 15 November 2017

Abstract

:
Small-scale gold mining is an important component of the Ghanaian economy but it has also caused enormous damage to local ecosystems. In this paper, an emergy analysis was conducted in Ghana to assess the environmental performance and the relative sustainability of two artisanal and small-scale gold production systems: alluvial “dig and wash” and underground “ghetto” mines. Results show that both production systems have high environmental impacts, as indicated by an environmental loading ratio (ELR) of 4.31 and environmental sustainability index (ESI) of 0.33 for the alluvial system and 2.53 and 0.52 for the underground system, respectively. Concerning the international trade balance, the emergy exchange ratios of the two systems are both lower than one, at, 0.23 and 0.33 for the alluvial and underground systems, respectively, indicating a significant amount of resource loss to foreign regions. This study could assist in the regulation of the small-scale mining sector bearing in mind the unsustainable nature of their activities. In addition, supporting miners to consider land rehabilitation ethics is urgently needed.

1. Introduction

Globally, approximately 330 tonnes of gold are produced yearly on a small-scale [1], which represents about 12% of the total gold supply. Artisanal and small-scale gold mining (ASGM) contributes to the economy of nations through capital inputs, including direct money inputs through foreign exchange earnings, particularly for developing nations, and provides employment to citizens. In 2012, ASGM employed an estimated five million people from 13 major gold producing countries worldwide, about eight times the number of people employed in large-scale gold mines [2].
Ghana has been mining and depending on mineral resources such as gold for over 1000 years [3]. The Ghanaian economy benefits from both the Gross Value Added (GVA) from gold and the employment generated. In terms of these contributions, PwC ranks Ghana, with gold accounting for 8% of the GDP, as second only to Papua New Guinea, with gold being 15% of the GDP as a gold producing nation whose economy is greatly influenced by the gold resource dynamics [2]. The enormous role that gold mining plays in its economic development makes Ghana no exception to resource extraction menaces and the gold industry has actively operated without any sound sustainable management. Gold is extracted by individuals, groups of individuals, and corporate mining organizations, on either large- or small-scale production basis. Although the number of large-scale gold mining companies has not increased significantly over the last two decades, the number of ASGM activities has substantially increased since 1989, when the Government of Ghana (GoG) enacted laws to legalize small-scale mining under the Provisional National Defense Council Law 218. Several words have been used to describe the small-scale mining activities including low technology use and labour-intensiveness of small-scale mining activity [4,5]. The ASGM are usually operated and financed by individual Ghanaians or organized groups of Ghanaians of four to eight individuals, or cooperatives of 10 or more individuals [6]. The major ASGM methods in Ghana are the “chisel and hammer” method, the “dig and wash” method, the “more blade” method, and the “dredge” method, which are all categorized as surface mines in this study, as well as ghetto methods, which are underground mines [7]. In terms of the quantity and production capacity, the underground ghetto and alluvial (“dig and wash”) are the most commonly practiced ASGM in Ghana.
Notwithstanding the considerable economic benefits ASGM has brought to the country and the improved livelihoods of local people [4], the activity poses numerous threats to the environment, including the water, land, and air. For instance, the mercury that is an integral component of the ASGM gold amalgamation process pollutes water bodies. In the southern part of Ghana where small-scale mining is intensified, most water bodies are found to contain a high amount of mercury (Hg), well above the WHO standard of 3 µg/L for non-exposed persons [8]. The lives of inhabitants are threatened when fish is consumed, a situation commonly referred to as bioaccumulation [9]. The soil surrounding the mining areas is eroded, which subsequently causes siltation of the water bodies that the ASGM communities depend upon for their livelihoods [10]. This disrupts the proper functioning of water ecosystems and makes the water impure for human use. With the continual destruction of water bodies, Nyanor [11] expects Ghana to face a severe water crisis by 2025 if nothing is done to address the water pollution menace. In addition to the environmental pollution of water, the small-scale gold mining activities have had a direct impact on the ecological integrity of mined lands. Hilson [12] observed that the mining has been responsible for and has intensified the removal of vast quantities of surface vegetation, including protected forestland, mainly because small-scale gold mining is a migratory industry. Several studies have recognized that ecosystem stressors, such as deforestation, forest degradation, biodiversity loss, riparian ecosystem deterioration, soil quality decline, etc., are evident in regions where ASGM activities are on-going [4,5,13,14,15]. Ultimately, mining overwhelms the inherent abilities of the affected ecosystems to be restored to their previous states without assistance. Ignoring these degradation threats would have some significant negative implications for the Sustainable Development Agendas (SDGs) in Ghana. A complete or full environmental cost breakdown for the sector is required to help implement sound policies [16]. Investigating the environmental sustainability of Ghana’s small-scale gold mining is important from a case perspective, however, to the best of the researchers’ knowledge, no study has analysed this sector from emergy perspective.
Emergy is “the sum of the available energy, i.e., the type previously required directly and indirectly through input pathways to make a product or service” [17]. Emergy analysis is capable of extensively consider a system’s resource requirements while approximating the work of the environment to replace it, thereby analysing its sustainability [17]. It then compares two or more production systems by transforming their resource inputs (renewable, non-renewable, and purchased) into a common unit of solar emjoules (SEJ). The method combines irreversible thermodynamics principles and system ecology as the basis for evaluating the environmental performance of a product system, by using indicators such as emergy yield ratio (EYR), environmental loading ratio (ELR), emergy sustainability index (ESI), and emergy exchange ratio (EER).
For nearly 35 years of its development and application, emergy analysis has been used for evaluating the environmental performance of industrial processes. However, only a few analyses have focused on extractive industries. Zhang et al. used emergy analysis to evaluate the environmental pollution problems associated with coal mining [18]. Hardy compared a proposed copper mine and an old copper mine in Arizona, USA through emergy analysis [19]. His results revealed that the proposed copper mine was more efficient in the embodied energy savings. To the best of the researchers’ knowledge, only Ingwersen [20] has explicitly used the emergy (and LCA) method to evaluate gold mining activities. His research, however, focused on a relatively large-scale mining operating in Peru which had an annual production capacity of 9.40 × 10⁷ g of gold and 1.23 × 10⁸ g of silver combined as gold-silver bullion in 2005. Not only did his research focus on the production capacity, but also on the relative abundance of gold geologic deposits in the earth crust and the impacts of their extraction. In fact, the indictors used to create policies for the large-scale sector may not be applicable to the small scale sector, yet emergy research tends to neglect the small-scale gold production sector. The dynamics of the alluvial and the underground small-scale gold productions systems must be studied given the range of associated environmental concerns [3]. Performing an explicit evaluation of the small-scale mines in Ghana using the emergy method could create new understanding about the management of the environmental consequences of gold production systems. Additionally, by providing insights into the environmental sustainability of the production systems, potential future improvement options could be realized.
Thus, emergy analysis was applied in this study to examine the environmental sustainability of small-scale gold mining activity in Ghana, which focused on two artisanal and small scale gold mining systems: alluvial mining (by AMASS Limited, Odumase, Ghana) and underground mining (by JYK Co. Limited, Konongo, Ghana). The main goals of this study were to: (1) conduct a systematic accounting and comparison analysis of the environmental sustainability associated with the alluvial and underground ASGMs; (2) investigate fair trade from the perspective of biophysical loss or gain during international trade; and (3) provide policy implications for the ASGM industry in Ghana.

2. Materials and Methods

2.1. ASGM Case Systems

This study analysed two typical ASGM production types in Ghana: alluvial mining (performed by AMASS Limited) and underground mining (performed by JYK Co. Limited). The first company extracts gold from alluvial sediments, herein referred to as the alluvial system, while the latter engages in underground mining by extracting gold from rock oxides, herein referred to as the underground system. Both companies are located in the Asante Akim North Municipality (AANM) of the Ashanti Region of Ghana (Figure 1). The AANM lies within the renowned Ashanti gold belt. The study sites and case systems were selected based on several considerations emanating from the research problem. For instance, the selected cases are located both on- and off-river and are facing environmental problems [5,13,14,15]. In terms of the quantity and production capacity, the selected cases are the most common type of ASGM practiced locally.
As mentioned before, AMASS Limited uses a sophisticated form of the dig and wash gold production method in its operation. In addition to the traditional rudimentary equipment, the company uses excavators to scoop soil from the ground at depths not exceeding three meters. AMASS dig and wash small-scale activities are undertaken both off-river, usually in low-lying areas or valleys, and on-river. The mining company uses 50 acres of land with 100 workers working 10-h days and produces 6.00 × 10³ g of gold per year (Table 1). The alluvial gold production process typically involves three main stages: resource extraction, leaching, and gold amalgamation and refinery. First, miners clear surface vegetation to allow for easy scooping of unwanted topsoil. The exposed gold-rich sediments are excavated and stockpiled. Thus, the process involves disturbing large tracts of soil ecosystems, which makes the soil prone to erosion, so soil loss should be seen as an input to production. The ASGM miners use local processes to leach the gold ore from the sediments.
JYK Co. Limited uses the underground system that is commonly referred to as “ghetto mine”. Thus, these activities mostly occur in abandoned mine pits [21]. The production process also includes three stages. However, the major differences are the source of the raw materials, the material type (rock oxide), and the rock crushing. At the mine sites, rock oxides are extracted several meters underneath the earth. Here, explosives are used to fragment rock lumps which are stored in jute bags. Miners use wood from local tree species (Sena siamea) to build braces also known as “cages” to prevent mine collapse while extraction is on-going. The rocks stored in bags are transported to processing sites and are further fragmented into a relatively smaller and usable form for the rock crusher. Afterwards, the rock is further processed with a milling machine. In these cases, the crusher machine and the milling machine used are commercial machines and as such, the service costs involved were recorded. The finely processed rock oxide is leached by applying mercury to amalgamate the several fragments of the gold ores. In 2015, the manager of this ASGM used 1285 workers on 25 acres of land at 10 work hours per day to produce 5.20 × 10⁴ g of gold (Table 1). The higher number of workers observed at this ASGM case confirms the assertion by Bansah et al. [7] that the production system is tedious. The data for this study were extracted from the accounting books of mine owners as well as personal interviews. A semi-structured interview guide that contained questions on the specific phases of the mine cycle was used. Data for mine equipment were obtained from their design reports.

2.2. Emergy Analysis

Pathways illustrating a system of interrelated components of typical ASGM production systems, drawn using the emergetic language shown in Figure 2 and Figure 3, are based on the works of Odum [17] and Brown and Ulgiati [22]. Before diagramming, we defined the system boundary to start from the resource extraction until its processing before it enters the market and/or other production systems. This definition revealed three basic process units for both the alluvial and the underground mines. The main production units considered in this study were the extraction, processing, and amalgamation units. Inputs for each process unit were categorized and integrated into the system diagram. For these systems, based on the results of the inventory analysis, all production inputs were categorized into environmental resources (renewable and non-renewable inputs) and economic resources (purchased materials and services). Aggregating resource inputs into renewable and non-renewable is an essential component of emergy analysis (Table 2) because it assists in providing simple definitions for several emergy indicators that would emanate from the systems being studied, and would support decision-making [23]. The renewable flows (R) included sun, rain, river water, wood, etc. Non-renewable resource inputs included soil, mineral (rock) oxide, groundwater, charcoal, etc. Inputs from the economy (F) were categorized as non-renewable purchased (electricity, fuel, machinery, other costs, etc.) and renewable purchased inputs (labour, purchased wood, etc.). The portion of the purchased inputs that were deemed as being from renewable origins were described as renewable purchased (FR), whereas those of non-renewable origins were described by non-renewable purchase (FN).
The present analysis spanned one year, so all equipment was scaled to a one-year cycle (Appendix A Table A1 and Table A2). As a precaution to allow transparent comparison with older values, the unit emergy values were rescaled based on geo-biosphere baseline. The emergy baseline is established by a calculation procedure that takes into account the connection between the solar radiation, geothermal heat, and gravitational potential energy, which are the main drivers of the geo-biosphere. This resulted in a series of baselines. The geo-biosphere baseline for the emergy calculation in this study was 15.83 × 1024 sej/year [30]. Therefore, all the UEVs calculated using the old planetary baselines, such as 12.00 × 1024 sej/year, 9.44 × 1024 sej/year and 9.26 × 1024 sej/year were scaled up to 15.83 × 1024 sej/year with factors such as 0.58, 1.32, and 1.68, respectively.

3. Results and Discussion

3.1. Emergy Accounting

The results obtained for the emergy analysis for the alluvial and underground ASGM systems are presented in Table 3. 
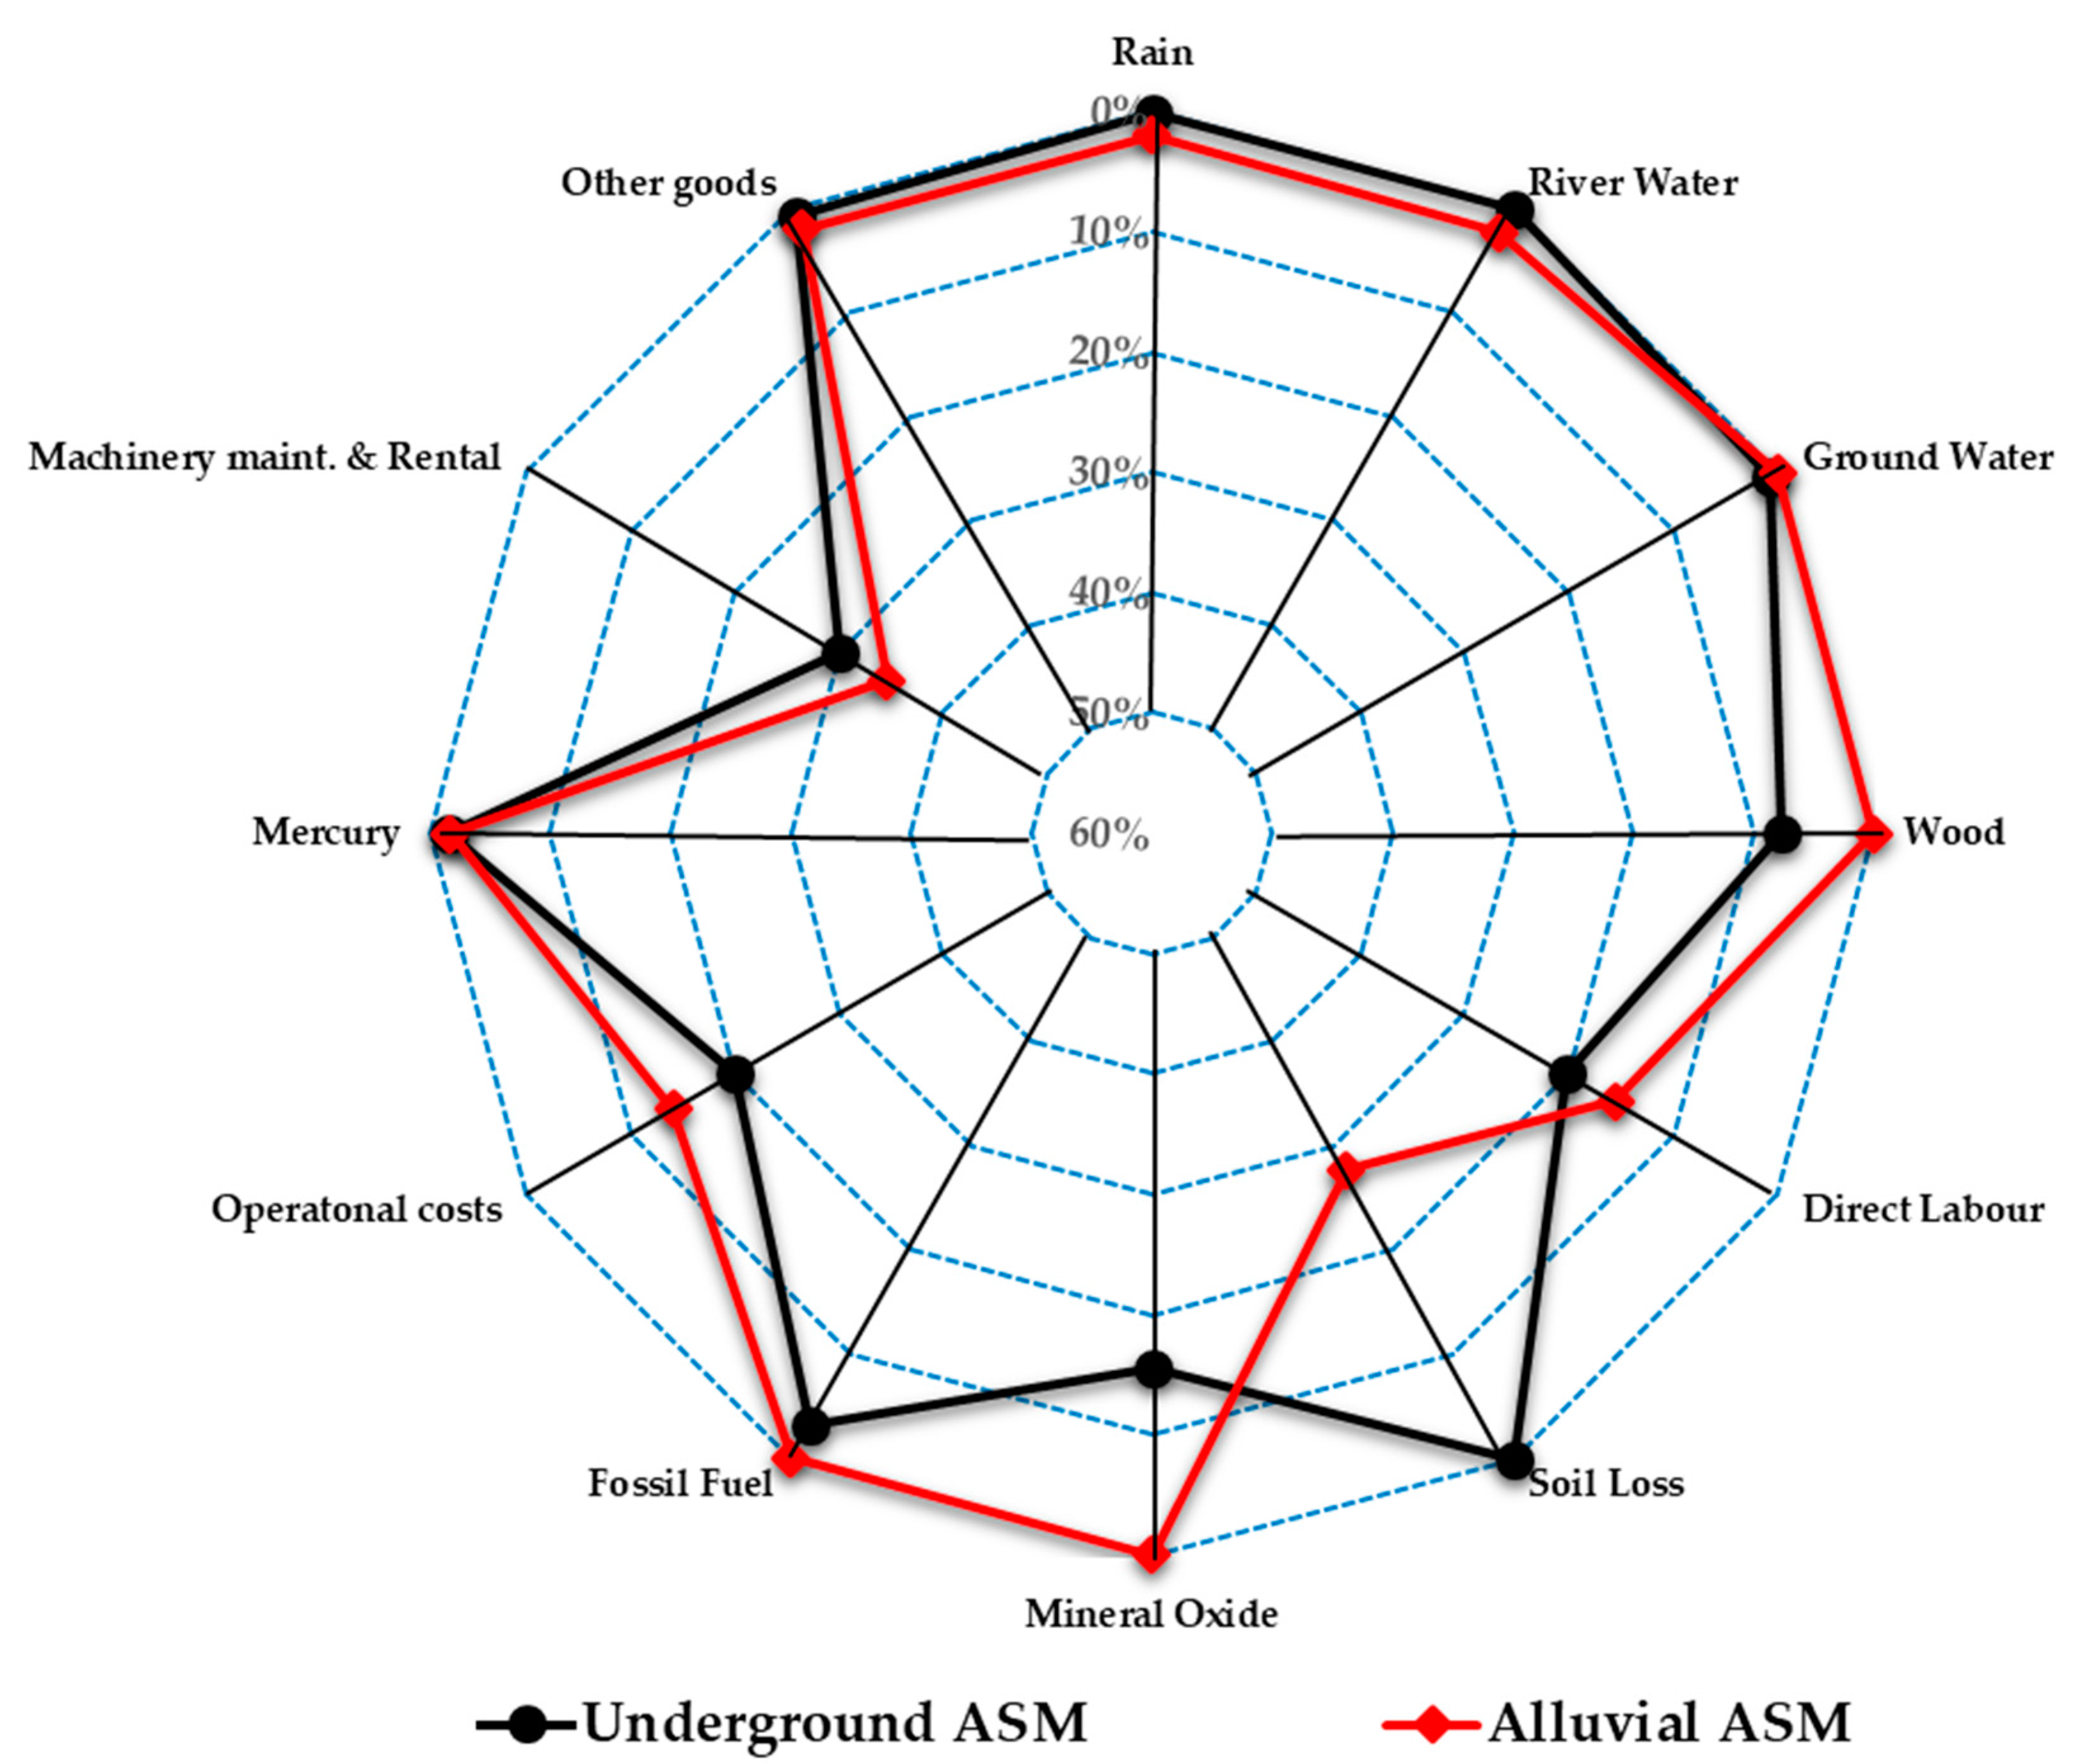
Figure 4 compares the proportions of the total emergy budget that were used by the major resource inputs in the emergy structure of the alluvial and the underground production systems. Such detailed structuring is useful to ascertain the vital resource flows for the respective systems and for comparison purposes to perceive the contrasting nature of the studied systems.
The results reveal that the use of renewable resources in the alluvial system was considerably less than the underground system. Within the alluvial system, renewable resources account for 2.3% (5.73 × 10¹⁶ sej) of its total emergy budget, compared to the underground system where it accounts for 7.8% (1.26 × 10¹⁸ sej). The reason for this difference is the harvest and use of local renewable resources (wood energy) to build cages that are used as supports to prevent the collapse of mines in their underground mining activities. Whereas the alluvial system had a lower renewable resource demand, it demanded more resources in terms of the amount of non-renewable resources used compared to the underground system usage of rocks and ground water. Thus, the non-renewable resource component of the system accounted for 28.3% (6.97 × 10¹⁷ sej) of its emergy budget compared to the underground mine whose rock oxide and groundwater, as non-renewable resources, formed 16.3% (2.64 × 10¹⁸ sej) of its total emergy used. The alluvial system does not use rock oxide and pumps groundwater but instead excavates alluvial sediments for gold production purposes, which makes the soil loose and subject to soil erosion. Similarly, soil loss was not part of the total emergy budget of the underground system since it does not use these sediments.
The feedback from the economy (F) was the largest contributor for the two systems. Major contributors were machine maintenance, labour, and operational costs (Table 3 and Figure 4). A greater proportion (35.5%; 8.72 × 10¹⁷ sej) of total emergy used by the alluvial system was due to the economic inputs, specifically the renting of machinery and their maintenance. This is critical because the former production system uses expensive excavators to scoop the less useful topsoil to make available the sub- and gold-rich sediments. Comparatively, the emergy in the economic inputs of the underground system were mostly due to the cost of commercial rock crushing, rock grinding machines, etc. (30.2%; 4.90 × 10¹⁸ sej). Their costs depend on the number of bags of rock oxide being processed. A different trend was observed for the labour emergy. The alluvial system had a lower labour emergy (15.8%; 3.91 × 10¹⁷ sej) relative to the underground system, whose labour emergy formed 20.0% (3.29 × 10¹⁸ sej) of its total emergy budget. This may be attributed to the less expensive and easily available local-based and unskilled at the disposal of the underground system. The operation costs for the studied systems included economic flows such as monies for food, royalties, etc. The emergy in the operation costs of the underground system represented 20.0% (3.26 × 10¹⁸ sej), which was significantly higher than the alluvial system (14.4%; 3.56 × 10¹⁷ sej). This may be due to the food supply for the larger number of cheap local employees and the higher royalties paid to work in previously owned mine concessions.

3.2. Emergy-Based Indices

The ability of emergy analysis to categorize upstream inputs into renewable, non-renewable resources, and purchased inputs make it influential in revealing the environmental sustainability of a product system. A number of indicators were calculated to assess the environmental performance and the sustainability of the two production systems. They included Unit Emergy Value (UEV), per cent renewable (%R), emergy yield ratio (EYR), environmental loading ratio (ELR), emergy exchange ratio (EER), and emergy sustainability index (ESI). They are discussed as follows:
Unit Emergy Value (UEV) measures the efficiency of the production system. When two or more processes yielding the same output are being compared, the higher UEV can be seen as a measure of lower efficiency because more resources are needed to produce the same amount of product [17,30,37]. For these systems, we found that the alluvial system had a higher emergy per year to produce a gram of gold, with a UEV value of 4.11 × 10¹⁴ sej/g, compared to the underground system at 3.12 × 10¹⁴ sej/g. Therefore, the alluvial system was less efficient compared to the underground system. Moreover, the results suggest that when the same amount of emergy is supplied to both production systems, the underground mine can produce more gold. Technologies that can improve the extraction efficiency is required to ensure that these migratory production systems exhaust mineable lands before they move to a new location. The UEVs obtained for the studied systems are both higher than the 1.50 × 10¹³ sej/g that Ingwersen [20] obtained for a Peruvian mining system. This is probably because of the incorporation of an additional higher energy level, water reuse, into the system during the assessment. Moreover, Lefroy and Rydberg [38] also reported that specific emergies are sensitive to location, products, and technology and cannot be the only parameter upon which an assessment can be performed. Cohen et al. [35] also found a UEV of 5.00 × 10¹¹ sej/g for crustal gold in an attempt to segregate and compute specific emergies for different crustal elements, based on the previous global sedimentary cycle of 1.68 × 10⁹ sej/g.
In a given system, the per cent renewable (%R) explains the degree of sustainability to some extent. A higher %R of a system indicates a stronger ability to survive economic stress [25]. The %R of the alluvial system was 18.8%, relatively lower than that of the underground mine, which was 28.4%, indicating a higher dependency on non-renewable resources during the extraction and processing of the alluvial gold than the underground gold. From this perspective, the underground mine is more sustainable. In the long run, it is more likely to survive economic competition. The result of lower renewable resource contribution and hence high non-renewable inputs from this study did not come as a surprise, since Ingwersen [20] also found a significant renewable resource contribution, with a %R of 35%, for the Peruvian large-scale gold mine. To some extent, and judging by the renewability values, the Peruvian large-scale mining system is more sustainable and is more likely to survive economic stress than the studied systems.
Emergy Yield Ratio (EYR) provides evidence of a system’s ability to exploit available local resources using purchased resources [39]. Systems with the lowest possible EYR value of one depend solely on purchased resources [23]. In general, EYR is sensitive to environment resources inputs and economic resource inputs, regardless of their renewability [38]. This suggests that the higher the EYR, the higher the relative contributions of the free sources of emergy to the process. The EYR value of 1.44 computed for the alluvial system is higher than that of underground system at 1.32. This implies that the former has better market competitiveness and may be interpreted as having a higher emergy used to produce the gold than the emergy in the raw resources. This may be the result of soil losses in the non-renewable resource category, an important environmental cost, which accounted for a large fraction of the emergy budget of the alluvial system. In addition, a major boost of the economic input of the underground mine was from the large and cheap indigenous labour force of the mining communities and beyond. The fact that the alluvial and underground systems used economic resource inputs, which accounted for 69.4% and 76.0% of their total emery budget, respectively, may explain the discrepancy between the EYR of the two systems.
The environmental loading ratio (ELR) is based on the concept of environmental service trade-offs [40]. The intensity of the environment’s emergy dissipates when used by a product system, particularly during the transformation process. ELR is used to indicate the pressures on the environment from product systems. A higher ELR means higher environmental stress [38] and less sustainability [26] and vice versa. With an ELR of 4.31, the alluvial system places more stress on the environment compared to the underground system that recorded an ELR of 2.53. The finding of higher environmental load by the alluvial system may be attributed to the excavation of large stretches of land in the short term. This leaves the lands bare, which are then subject to large annual soil organic matter loss. The alluvial system is sometimes on-river and/or on river basins that may result in the deteriorated water bodies and the creation of diversion channels. The ELR reaffirms the extremely damaging effects of ASGM on the environment that have been suggested by Hentschel et al. [4]. The relatively higher ELR associated with surface alluvial mining is inconsistent with the findings of Scheuler et al. [41] who found that the economic growth of the mining sector is associated with more economic and social costs than had previously perceived. A thorough exploration of a proposed mine site should be completed before the main production activity is performed. This would minimize the environmental load and help mines stay within the limits of the environmental carrying capacity.
The emergy sustainability index (ESI) aggregates the yield ratio relative to the environmental loads. The concept of ESI is premised on minimizing the environmental load while encouraging long-term production. This agrees with the study of Ulgiati and Brown [37] who found that to be sustainable, the load that a process exerts on the environment, measured by ELR, should be lower relative to a higher yield ratio. A gold production system may be termed as environmentally sustainable if it can concurrently provide gold, while reducing the overall environmental degradation. However, the ESI values calculated for the alluvial and underground systems, at 0.33 and 0.52, respectively, depict otherwise, though they do not differ markedly from each other. This implies that both systems provide a very low emergy return at the expense of a relatively high environmental load. However, the alluvial mine system had poorer sustainability performance than the underground system due to the greater dependence on non-renewable resources, such as the high emergy cost of surface soil loss.
The Emergy Exchange Ratio (EER) is used to describe the strength of the Ghanaian gold at the global trade interface. From a biophysical perspective, the EER indicates the emergy benefits or losses from the sale of Ghanaian gold. Generally, a fair and equitable trade at the global front is realized when the EER equals one [38]. However, this is usually not the case and equitable trade of Ghanaian gold is not an exception to this situation. Both systems had an EER lower than one, which suggests that both companies supplied more emergy to the consumer, including trade partners and foreign regions, than they received. The calculated EER for the alluvial system was 0.23, whereas that of the underground mine was 0.33. Comparatively, the alluvial system losses slightly more than the underground mine. Ultimately, these trade partners undervalue the ecological impacts associated with these production systems, unlike the Peruvian large-scale mining, which received, in return for the supply of lower emergy, a higher emergy from trade partners (Table 4). Given this empirical evidence, the prices of the Ghanaian gold should be made higher at the global front during international trade compared to those determined by the market prices. Based on the results of this study, we suggest a policy that is similar to the Forest Law Enforcement, Governance and Trade (FLEGT) and Voluntary Partnership Agreement (VPA) in Ghana that have shown success within the forestry sector. This trade agreement between Ghana and the E.U. aims to address illegal logging of timber, and forest governance and trade through the exportation of only FLEGT-licensed timber. Similarly, the gold that has been produced using environmentally friendly methods and/or has complied with agreed-upon standards should be bought at an EER of one by their trade partners to ensure equity. We see this as a new method of ecological compensation in the mining sector. However, further research work is needed to ascertain the environmental friendliness of the sector. Again, the standard by which the gold produce on small-scale basis must conform must be researched further.
This study has provided the basis for the Environmental Protection Agency (EPA) to plan sustainable land management. Because the miner’s choice of a production system does not depend on the ratio of economic inputs to outputs or the exacerbation of environmental loads and environmental sustainability, but rather the resource types, abundance, their location in the earth, and access to land. The rising popularity of ASGM in Ghana, therefore, would mean a higher load on the land, vegetation, and groundwater recharge, for alluvial and underground mines. This is because the amount of non-renewable emergy use, a critical environmental cost, revealed in our study, dominates the resource inputs in their production process.

4. Conclusions

Ghana’s economic development relies largely on the gold industry, but the environmental cost is very high, particularly in the ASGM sector. This study compared the sustainability of the alluvial and underground gold production systems using the emergy method. Our emergy accounting for the two ASGM showed that the two systems differ markedly in the raw material extraction stages of their respective process chain. The alluvial system extracts surface sediments and the underground system extracts rock minerals. Furthermore, both systems have a high emergy budget from total non-renewable inputs of 81.2% and 71.6% for the alluvial and underground mines, respectively. Overall, both systems have a high emergy cost of gold production. The higher ELR of 4.31, EYR of 1.44, UEV of 4.11 × 10¹⁴ sej/g, and the lower %R of 18.8% and ESI of 0.33 obtained for the alluvial system signal the unsustainable nature of the activity.
Our emergy analysis has revealed that Ghana loses during the trade of gold with foreign regions, even though the production systems are associated with high environmental costs. As clearly indicated by the EER, the emergy buyers give in return for the Ghanaian gold is four times and three times lesser than the emergy used in the alluvial and underground production systems, respectively. To promote post-mining land reclamation or rehabilitation, the losses incurred by Ghana in exporting gold to the global market should be minimized. Gold produced by miners who have properly accounted for and given value to their environmental costs should be bought at an EER of one by their trade partners to ensure equity, which is a new method of ecological compensation in the mining sector. Our case study has shown the performance of EER in this regard.
In the policy arena, we suggest the Government of Ghana (GoG) should strengthen resource conservation laws, particularly land acquisitions laws at the local level. Generally, permits should be given when miners have provided evidence that they can rehabilitate degraded lands, at least to a specified end land-use.
Emergy analysis is a donor-side method. Thus, it accounts for all the resources that are directly or indirectly supplied to support the alluvial and underground production systems, which is independent of the actual demand of the gold in the respective system’s life cycle. It implies that the method is not good at measuring environmental pollution, a user-side problem, as the cost would be higher if it was involved. Therefore, further studies are needed to provide a more systematic accounting of the environmental costs of negative health impacts. For instance, a large amount of mercury was used in the production of gold, which would definitely cause damage to the health of the local ecosystem and people.

Acknowledgments

This work was supported by the National Science and Technology Major Project of the Ministry of Science and Technology of China (2017YFC0505703), Funds for International Cooperation and Exchanges of the National Natural Science Foundation of China (51661125010) and National Natural Science Foundation of China (41371521). E.F.A. acknowledges Dela Eugene Setsoafia for his immense contributions towards the preparation of the manuscript.

Author Contributions

Lixiao Zhang and Ernest Frimpong Asamoah conceived and designed the experiments; Ernest Frimpong Asamoah performed the experiments; Ernest Frimpong Asamoah and Mingyue Pang analysed the data; Sai Liang and Shoujuan Tang contributed reagents/materials/analysis tools; and Ernest Frimpong Asamoah wrote the paper.

Conflicts of Interest

The authors declare no conflict of interest.

Appendix A

Table A1. Endnote on emergy calculation for the alluvial ASGM.
DescriptionValueUnitSource
1SUN
Sunlight Flow for Ghana1.20 × 1021J[30]
Total Land Area2.30 × 107ha
Production Area20.334ha
Sun Energy for Production Area Sunlight   Flow   ( J )   Total   Land   Area   ( ha )   ×   20.334
1.06 × 10¹⁵J
UEV of Sun1.00sej/J[30]
Sun Emergy1.06 × 1015sej
Per Cent of Emergy Budget0.04%
2RAIN
Rain Energy for Ghana1.80 × 1018 [37]
Total Land Area2.30 × 107ha
Production Area20.334ha
Rain Energy for Production Area Rain   Energy   ( J )   Total   Land   Area   ( ha )   × 20.334
1.59 × 10¹²J
UEV of Rain3.10 × 104sej/J[30]
Rain Emergy4.93 × 1016sej
Per Cent of Emergy Budget2.00%
3RIVER WATER
Time of Pump Use300min/day
Rate of Pump Flow0.416m3/min
Water Use (Volume/year)[(Time use) × (Rate of flow) × 365] ÷ 20.3 ha
4.55 × 10⁵m3
UEV of River Water1.26 × 1011sej/m3[32]
River Water Emergy5.73 × 1016sej
Per Cent of Emergy Budget2.32%
4SOIL LOSS
Annual Soil Loss2.40 × 105g/year
Organic Matter Fraction0.56dimensionlessHWSD, v1.2 (accessed June 2016)
Energy Content kcal/g
Total Soil Loss Energy[(Annual soil loss) × (Organic matter fraction) × (Energy content) × (1000 g/kg) × (4186 J/kcal)] ÷ 20.3 ha
5.62 × 10¹²J/year
UEV of Soil Loss1.24 × 105sej/J[30]
Soil Loss Emergy6.97 × 1017sej
Per Cent of Emergy Budget28.27%
5FOSSILS
Diesel Oil1080L/year
Patrol Fuel216L/year
Total Fossils1299L/year
Fossil Energy[(L/year × 3.14 × 10⁷ J/L)] ÷ 20.3 ha = J/year/ha
4.06 × 10¹⁰J
UEV of Fossils3.85 × 104sej/J[33]
Fossil Emergy1.56 × 1015sej
Per Cent of Emergy Budget0.06%
6MACHINERY Assumed lifespan
Pump Machine1.50 × 103g/y5 years
Leach Machine5.00 × 104g/y3 years
Total Machinery Mass5.15 × 104g/year
UEV of Machinery1.79 × 1010sej/g[30]
Machinery Emergy9.23 × 1014sej
Per Cent of Emergy Budget0.04%
7BLANKETS (WOOLEN)
Quantity3bundles
Mass/Bundle7.50 × 104g
Total Mass of Blanket2.25 × 105g/year
UEV of Blanket1.34 × 1011sej/g[17]
Emergy of Blanket3.02 × 1016sej
Per Cent of Emergy Budget1.22%
8MERCURY
Mass1.00 × 103g/year
UEV of Mercury4.20 × 1013sej/g[34]
Mercury Emergy4.02 × 1016sej
Per Cent of Emergy Budget1.70%
9LABOUR4.80 × 104GH¢/year
1.26 × 10⁴$/year
UEV3.10 Csej/$[37]
Labour Emergy3.91 × 1017sej
Per Cent of Emergy Budget15.82%
10WOOD1.98 × 103GH¢/year
5.21 × 10²$/year
UEV3.10 × 1013sej/$[37]
Wood Emergy1.61 × 1016sej
Per Cent of Emergy Budget0.65%
11MACHINE RENTAL AND MAINTENANCE2.81 × 104GH¢/year
1.07 × 10⁵$/year
UEV3.10 × 1013sej/$[37]
Machinery Emergy8.72 × 1017sej
Per Cent of Emergy Budget35.29%
12REFINERY COST1.20 × 102GH¢/year
3.13 × 101$/year
UEV3.10 × 1013sej/$[37]
Refinery Emergy9.70 × 1014sej
Per Cent of Emergy Budget0.04%
13OPERATIONAL COST4.40 × 104GH¢/year
1.15 × 10⁴$/year
UEV3.10 × 1013sej/$[37]
Operation Cost Emergy3.56 × 1017sej
Per Cent of Emergy Budget14.1%
As at 31 December 2015, a US dollar was equivalent to GH¢ 3.8 [43].
Table A2. Footnotes of the emergy calculations for the underground ASGM production system.
DescriptionValueUnitSource
1SUN
Sunlight Flow for Ghana1.20 × 1021J[30]
Total Land Area2.30 × 107ha
Sun Energy for Production Area Sunlight   Flow   ( J )   Total   Land   Area   ( ha )   ×   10.2
7.00 × 10¹⁴J/year
UEV of Sun1.00sej /J[30]
Sun Emergy7.00 × 1014sej
Per Cent of Emergy Budget0.00%
2WIND
Wind Energy for Ghana7.50 × 1016J[37]
Total Land Area2.30 × 107ha
Wind Energy for Production Area Wind   Energy   ( J )   Total   Land   Area   ( ha )   ×   10.2
4.38 × 10¹⁰J/year
UEV of Wind2.45 × 103sej/J[30]
Wind Emergy1.07 × 1014sej
Per Cent of Emergy Budget0.00%
3RAIN
Rain Energy for Ghana1.80 × 1018 [37]
Total Land Area2.30 × 107ha
Rain Energy for Production Area Rain   Energy   ( J )   Total   Land   Area   ( ha )
1.05 × 10¹²J/year
UEV of Rain3.10 × 104sej/J[30]
Rain Emergy3.26 × 1016sej
Per Cent of Emergy Budget0.20%
4WOOD
Quantity3.60 × 108g/year
UEV3.50 × 109sej/g[17]
Wood Emergy1.26 × 1018
Per Cent of Emergy Budget7.76%
5CHARCOAL
Quantity1.16 × 104Kg/year
Energy in Charcoal3.30 × 107J/kgSee Endnotes
Total Energy3.60 × 1011J/year
UEV of Charcoal1.78 × 105sej/J[17]
Charcoal Emergy1.26 × 1017sej
Per Cent of Emergy Budget0.04%
6GROUND WATER
Time of Pump Use120min/day
Rate of Flow of Pump0.416m3/minute
Water Use (Vol./year)[(Time use) × (Rate of flow) × 365] ÷ 10.2 ha
1.80 × 10⁵m3/year
UEV of Ground Water6.23 × 1011sej/m3[32]
Groundwater Emergy1.12 × 1017sej
Per Cent of Emergy Budget0.69%
7ROCK OXIDE
Quantity3.65 × 105Bags
Unit Mass40kg/bag
Total Rock Mass1.46 × 1012g/year
UEV of Rock1.73 × 106sej/g[32]
Rock Oxide Emergy2.53 × 1018sej
Per Cent of Emergy Budget15.55%
8FOSSILS
Diesel Oil2.92 × 104L/year
Patrol Fuel1.54 × 104L/year
Total Fossils4.46 × 104L/year
Fossil Energy(L/year × 3.14 × 10⁷ J/L)
1.40 × 10¹³J/year
UEV of Fossils3.85 × 104sej/J[33]
Fossil Emergy5.39 × 1017sej
Per Cent of Emergy Budget3.32%
9ELECTRICITY
Total Paid9.13 × 104GH¢/year
Price of Electricity per kWh is 0.158 GH¢ http://www.costtotravel.com/cost/electricity-in-ghana
Total Power5.78 × 105KWh
Contact Time3120h/year
EnergyPower × TimeJ
1.80 × 10⁹J/year
UEV of Electricity2.92 × 105sej/J[17]
Emergy of Electricity5.24 × 1014sej
Per Cent of Emergy Budget0.00%
10MACHINERY
Pump Machine3.00 × 103g/yearAssuming 5-year lifespan
Ball Mill Machine1.27 × 105g/yearAssuming 3-year lifespan
Total Machinery Mass1.30 × 106g/year
UEV of Machinery1.79 × 1010sej/g[30]
Machinery Emergy2.32 × 1016sej
Per Cent of Emergy Budget0.14%
11EXPLOSIVES
Mass of Explosives1.00 × 104g/year
UEV of Explosives4.19 × 109sej/g[35]
Explosives Emergy4.19E × 1013sej
Per Cent of Emergy Budget0.00%
12BLANKETS
Quantity5bundles
Mass per Bundle3.00 × 104g
Mass of Blanket1.50 × 105g/year
UEV of Blanket1.34 × 1011sej/g[17]
Emergy of Blanket2.01 × 1016sej
Per Cent of Emergy Budget0.12%
13MERCURY
Mass6.09 × 103g/year
UEV of Mercury4.20 × 1013sej/g[34]
Mercury Emergy2.51 × 1016sej
Per Cent of Emergy Budget1.57%
14LABOUR COST4.03 × 105GH¢/year
1.06 × 10⁵$/year
UEV3.10 × 1013sej/$[37]
Labour Emergy3.29 × 1018sej
Per Cent of Emergy Budget20.23%
15WOOD7.00 × 103GH¢/year
1.83 × 10³$/year
UEV3.10 × 1013sej/$[37]
Wood Emergy5.67 × 1016sej
Per Cent of Emergy Budget0.35%
16MACHINE RENTALS AND MAINTENANCE6.00 × 105GH¢/year
1.58 × 10⁵$/year
UEV3.10 × 1013sej/$[37]
Machinery Emergy4.90 × 1018sej
Per Cent of Emergy Budget30.28%
17REFINERY COST1.62 × 102GH¢/year
4.26 × 101$/year
UEV3.10 × 1013sej/$[37]
Refinery Emergy1.32 × 1015sej
Per Cent of Emergy Budget0.01%
18OPERATIONAL COST4.00 × 105GH¢/year
1.05 × 10⁵$/year
UEV3.10 × 1013sej/$[37]
Operation Cost Emergy3.26 × 1018sej
Per Cent of Emergy Budget20.14%

References

  1. Artisanal Gold Council (AGC). The World Artisanal Productions. 2011. Available online: http://artisanalgold.blogspot.co.uk/2011/06/world-artisanal-gold-production.html (accessed on 31 December 2016).
  2. PwC Analysis. The Direct Economic Impact of Gold. 2013. Available online: https://www.pwc.com/gx/en/mining/publications/assets/pwc-the-direct-economic-impact-of-gold.pdf (accessed on 19 February 2017).
  3. Hilson, G. The environmental impact of small-scale mining in Ghana: Identifying problems and possible solutions. Geogr. J. 2002, 168, 57–72. [Google Scholar] [CrossRef]
  4. Hentschel, T.; Hruschka, F.; Priester, M. Global Report on Artisanal and Small-Scale Mining: Challenges and Opportunities; International Institute for Environment and Development (IIED) and WBCSD Publishing: London, UK, 2003. [Google Scholar]
  5. Hilson, G. Small-scale mining, poverty and economic development in sub-Saharan Africa: An overview. Resour. Policy 2009, 34, 1–5. [Google Scholar] [CrossRef]
  6. Hilson, G. Small-scale mining and its socio-economic impact in developing countries. Nat. Resour. Forum 2002, 26, 3–13. [Google Scholar] [CrossRef]
  7. Bansah, K.J.; Yalley, A.B.; Dumakor-Dupey, N. The Hazardous Nature of Small-Scale Underground Mining in Ghana. J. Sustain. Min. 2016. [Google Scholar] [CrossRef]
  8. World Health Organization (WHO). Recommended Health-Based Limits in Occupational Exposure to Heavy Metals; World Health Organization: Geneva, Switzerland, 1980. [Google Scholar]
  9. Adimado, A.A.; Baah, D.A. Mercury in human blood, urine, hair, nail, and fish from the Ankobra and Tano River Basins in Southwestern Ghana. Bull. Environ. Contam. Toxicol. 2002, 68, 339–346. [Google Scholar] [CrossRef] [PubMed]
  10. Kinanya, C.A. Small Scale Mining in West Africa and Environment Security: The Case Study of Tarkwa in Ghana. Master’s Thesis, the University of Ghana, Legon, Ghana, December 2013. Available online: www.ugspace.eg.edu.gh/bitstream/123456789/21264/4/ (accessed on 24 September 2017).
  11. Nyanor, G. Pollution of Water Bodies: Experts Predict Severe Water Crisis in Ghana by 2025. 2013. Available online: http://edition.myjoyonline.com/pages/news/201303/103466.php (accessed on 15 September 2016).
  12. Hilson, G. Harvesting mineral riches: 1000 years of gold mining in Ghana. Resour. Policy 2002, 28, 13–26. [Google Scholar] [CrossRef]
  13. Pyatt, F.B.; Gilmore, G.; Grattan, J.P.; Hunt, C.O.; McLaren, S. An Imperial Legacy? An Exploration of the Environmental Impact of Ancient Metal Mining and Smelting in Southern Jordan. J. Archaeol. Sci. 2000, 27, 771–778. [Google Scholar] [CrossRef] [Green Version]
  14. Rajaee, M.; Obiri, S.; Green, A.; Long, R.; Cobbina, S.J.; Nartey, V.; Buck, D.; Antwi, E.; Basu, N. Integrated Assessment of Artisanal and Small-Scale Gold Mining in Ghana—Part 2: Natural Sciences Review. Int. J. Environ. Res. Public Health 2015, 12, 8971–9011. [Google Scholar] [CrossRef] [PubMed]
  15. Al-Hassan, S.; Amoako, R. Environmental and security aspects of contemporary small-scale mining in Ghana. In Proceedings of the 2014 3rd UMaT Biennial International Mining and Mineral Conference, Tarkwa, Ghana, 30 July–2 August 2014; pp. 146–151. [Google Scholar]
  16. Murphy, A. What Are Environmental Costs?—Part 1. 2010. Available online: http://www.microempowering.org/external-blog/what-are-environmental-costs-part-1 (accessed on 19 August 2017).
  17. Odum, H.T. Environmental Accounting, Emergy and Decision Making; John Wiley: New York, NY, USA, 1996. [Google Scholar]
  18. Zhang, J.; Xiao, B.; Du, H.X.; Wang, L.; Ge, B.Z.; Shi, H. Emergy Evaluation of Pollutants Emission in Coal Mine: A Case Study of DaLiuTa Mine in Northern Shaanxi Province, China. Adv. Mater. Res. 2012, 599, 428–433. [Google Scholar] [CrossRef]
  19. Handy, J.B. Measuring the Sustainability of a Proposed Copper Mine in Arizona: A Temporal Comparison. Master’s Thesis, Oregon State University, Corvallis, OR, USA, June 2015. Available online: http://ir.library.oregonstate.edu/xmlui/bitstream/handle/1957/56357/HandyJohnB2015.pdf?sequence=1 (accessed on 25 July 2016).
  20. Ingwersen, W.W. Emergy as a Life Cycle Impact Assessment Indicator: A Gold Mining Case Study. J. Ind. Ecol. 2011, 15, 550–567. [Google Scholar] [CrossRef]
  21. World Bank. Working Together: How Large-Scale Mining Can Engage with Artisanal and Small-Scale Miners; World Bank: Washington, DC, USA, 2008. [Google Scholar]
  22. Brown, M.T.; Ulgiati, S. Emergy analysis and environmental accounting. Encycl. Energy 2004, 2, 329–354. [Google Scholar]
  23. Hu, Q.H.; Zhang, L.X.; Wang, C.B. Emergy-based analysis of two chicken farming systems: A perception of the organic production model in China. The 18th Biennial Conference of International Society for Ecological Modelling. Procedia Environ. Sci. 2012, 13, 445–454. [Google Scholar] [CrossRef]
  24. Pang, M.; Zhang, L.; Ulgiati, S.; Wang, C. Ecological impacts of small hydropower in China: Insights from an emergy analysis of a case plant. Energy Policy 2015, 76, 112–122. [Google Scholar] [CrossRef]
  25. Cavalett, O.; de Queiroz, J.F.; Ortega, E. Emergy Assessment of Integrated Production Systems of Grains, Pig and Fish in Small Farms in the South Brazil, Ecological Modelling. Available online: https://doi.org/10.1016/j.ecolmodel.2005.07.023 (accessed on 26 October 2017).
  26. Zhang, L.X.; Ulgiati, S.; Yang, Z.F.; Chen, B. Emergy evaluation and economic analysis of three wetland fish farming systems in Nansi Lake area, China. J. Environ. Manag. 2011, 92, 683–694. [Google Scholar] [CrossRef] [PubMed]
  27. Pang, M.; Zhang, L.; Wang, C.; Liu, G. Emergy Analysis of a Biomass Direct-fired Power Plant in Inner Mongolia of China. J. Environ. Account. Manag. 2013, 1, 321–331. [Google Scholar] [CrossRef]
  28. Brown, M.T.; Ulgiati, S. Emergy-based indices and ratios to evaluate sustainability: Monitoring economies and technology toward environmentally sound innovation. Ecol. Eng. 1997, 9, 51–69. [Google Scholar] [CrossRef]
  29. Liu, G.; Yang, Z.; Chen, B. Emergy-based ecological economic evaluation of Beijing urban ecosystem. Procedia Environ. Sci. 2011, 5, 18–24. [Google Scholar] [CrossRef]
  30. Odum, H.T.; Brown, M.T.; Brandt-Williams, S. Handbook of Emergy Evaluation, Folio #1; Center for Environmental Policy, Environmental Engineering Sciences, University of Florida: Gainesville, FL, USA, 2000; Available online: https://cep.ees.ufl.edu/emergy/documents/folios/Folio_02.pdf (accessed on 5 January 2017).
  31. De Wilbiss, C.; Brown, M.T.; Ma, C.; Ingwersen, W. Emergy Research for supply chain. J. Environ. Account. Manag. 2015, 3, 308–338. [Google Scholar]
  32. Bastianoni, S.; Campbell, D.E.; Ridolfi, R.; Pulselli, F.M. The solar transformity of petroleum fuels. Ecol. Model. 2009, 220, 40–50. [Google Scholar] [CrossRef]
  33. Brown, M.T.; Bardi, E. Folio #3: Emergy of Ecosystems. Handbook of Emergy Evaluation: A Compendium of Data for Emergy Computation Issued in a Series of Folios; Center for Environmental Policy, Environmental Engineering Sciences, University of Florida: Gainesville, FL, USA, 2001. [Google Scholar]
  34. Ascione, M.; Campanella, L.; Cherubini, F.; Ulgiati, S. Environmental driving forces of urban growth and development: An emergy-based assessment of the city of Rome, Italy. Landsc. Urban Plan 2009, 93, 238–249. [Google Scholar] [CrossRef]
  35. Cohen, M.J.; Sweeney, S.; Brown, M.T. Chapter 16. Computing the Unit Emergy Value of Crustal Elements. In EMERGY SYNTHESIS 4: Theory and Applications of the Emergy Methodology. Proceedings from the Fourth Biennial Emergy Conference; University of Florida: Gainesville, FL, USA, 2007; pp. 1–18. Available online: https://cep.ees.ufl.edu/emergy/documents/conferences/ERC04_2006/ERC04_2006_Chapter_16.pdf (accessed on 15 June 2017).
  36. NEAD. Emergy by Country; Ghana—2000. Available online: http://www.cep.ees.ufl.edu/nead/data.php?country=58&year=58 (accessed on 9 July 2016).
  37. Ulgiati, S.; Brown, M.T. Monitoring patterns of sustainability in natural and manmade ecosystems. Ecol. Model. 1998, 108, 23–36. [Google Scholar] [CrossRef]
  38. Lefroy, E.; Rydberg, T. Emergy evaluation of three cropping systems in southwestern Australia. Ecol. Model. 2003, 161, 195–211. [Google Scholar] [CrossRef]
  39. Agostinho, F.; Diniz, G.; Siche, R.; Ortega, E. The use of emergy assessment and the Geographical Information System in the diagnosis of small family farms in Brazil. Ecol. Model. 2008, 210, 37–57. [Google Scholar] [CrossRef]
  40. Dong, X.; Brown, M.T.; Pfahler, D.; Ingwersen, W.W.; Kang, M.; Jin, Y.; Ulgiati, S. Carbon modeling and emergy evaluation of grassland management schemes in Inner Mongolia. Agric. Ecosyst. Environ. 2012, 158, 49–57. [Google Scholar] [CrossRef]
  41. Schueler, V.; Kuemmerle, T.; Schröder, H. Impacts of Surface Gold Mining on Land Use Systems in Western Ghana. AMBIO 2011, 40, 528–539. [Google Scholar] [CrossRef] [PubMed]
  42. PMBull, Historical Gold Prices: December 2015. Available online: http://www.pmbull.com/gold-price/december-2015/ (accessed on 4 November 2016).
  43. World Currency Exchange Rates and Currency Exchange Rates History, Ghanaian Cedi (GHS) per US Dollar (USD). Available online: https://www.exchange-rates.org/history/GHS/USD/T (accessed on 4 November 2016).
Figure 1. The location of the study sites.
Sustainability 09 02034 g001
Figure 2. System diagram depicting the interrelated components of an alluvial artisanal and small-scale gold mining (ASGM) system.
Sustainability 09 02034 g002
Figure 3. System diagram depicting the interrelated components of the underground ASGM system. Source: an outside source of energy, a forcing function; Pathway line: a flow of energy, often with a flow of materials; Interaction: process which combines different types of flows or materials to produce an outflow in proportion to a function of the inflow; Box: miscellaneous symbol for whatever unit of function is labelled; Storage: a compartment of energy storage within a system storing quantity as the balance of inflows and outflows; System’s boundary: a rectangular box drawn to depict the boundary of the system being studied; Producer: unit that collects and transforms low quality energy under controlled interactions of higher quality flows; Transaction: a unit that indicates the sale of goods or services (solid line) in exchange for the payment money (dashed line).
Sustainability 09 02034 g003
Figure 4. Comparison of the emergy structure of the alluvial and underground gold production systems.
Sustainability 09 02034 g004
Table 1. Description of the two production systems.
Case NameTypeScaleCapacity (g/Year)No. of WorkersArea Exploited
AMASS Ltd.Alluvial (“dig and wash”)Small-scale6.00 × 10310050 acres
JYK Co., Ltd.Underground (“ghetto” mine)Small-scale5.20 × 104128525 acres
Table 2. Classification of emergy flows used in environmental accounting and indices.
ItemsExpressionDescription
Renewable Natural ResourcesRIncludes river water, the sun, wind, etc.
Non-Renewable Natural ResourcesNIncludes soil, rock mineral, etc.
Feedback from EconomyFThe economic resource inputs.
Purchased Renewable Resources FRThe portion of the economic resources inputs that are from renewable sources.
Purchased Non-Renewable ResourcesFNThe portion of the economic resource inputs that are of non-renewable origin.
Total Emergy UsedU = R + N + FThe total emergy used to support the whole production system.
System YieldYThe total gold (grams) produced.
Unit Emergy ValueUEV = U/YThe ratio of the total invested emergy to the yield of the system. A lower UEV implies higher efficiency [24].
Per Cent Renewable %R = (R + FR)/UThe ratio of the renewable inputs divided by the total emergy of the system. The higher the %R, the more likely the system will survive against the economic stress and the more sustainable the system. The opposite is also true.
Emergy Yield Ratio EYR = U/FThe ratio of total emergy used divided by the emergy inputs from the economy. Higher EYR implies lesser use of external inputs and dependence on local resources [25,26,27].
Emergy Exchange RatioEER = [($income) × (sej/$)world]/UThe EER is the ratio of emergy embodied in the money received to the emergy embodied in the products sold to the market. When EER < 1, it indicates the emergy in the money received is less than the emergy in the products.
Environmental Loading Ratio ELR = (N + FN)/(R + FR)The ratio of non-renewable emergy to the renewable inputs. Systems with higher ELR depend on indirect resources compared to a fully natural system that depends on local renewable resources [28].
Emergy Sustainability Index ESI = EYR/ELRESI is the composite ratio of the emergy yield ratio to the environmental loading ratio, indicating the process trade-off between the emergy advantage provided by the process and its environmental pressure. Systems with an ESI lower than 1 is less resource-depleting and high environmental stress. 1 < ESI < 10 implies that the system has good economic viability and good sustainability. ESI > 10 implies the system is undeveloped [29].
Table 3. Emergy accounting table for underground mining and alluvial mining systems on a yearly basis.
ItemEm-Flow Φ (Sej/Year)UEV (Sej/Unit)Ref.
“U” System“A” System
Renewable Resource Inputs (R)
1Sun7 × 10141.06 × 10151.00[30]
2Wind1.07 × 1014 2.45 × 10³[30]
3Rain3.26 × 10164.93 × 10163.10 × 104[30]
4River water 5.73 × 10161.26 × 1011[31]
5Wood1.26 × 1018 3.50 × 10⁹[30]
Subtotal (R)1.26 × 10185.73 × 1016
Non-renewable Resource (N)
6Charcoal6.82 × 1015 1.78 × 10⁵[17]
7Soil loss 6.97 × 10171.24 × 104[17]
8Groundwater1.12 × 1017 6.23 × 10¹¹[31]
9Mineral oxide2.53 × 1018 1.73 × 10⁶[31]
Subtotal (N)2.64 × 10186.97 × 1017
Purchased Resources (F)
10Fuel 5.39 × 10171.56 × 10153.85 × 104[32]
11Electricity 5.24 × 10¹⁴ 2.92 × 10⁵[17]
12Machinery 2.32 × 10169.23 × 10141.79 × 1010[30]
13Explosives 4.19 × 10¹³ 4.19 × 10⁹[33]
14Blanket 2.01 × 10163.02 × 10161.34 × 1011[34]
15Mercury 2.56 × 10174.20 × 10164.20 × 1013[35]
16Labour *3.29 × 10183.91 × 10173.10 × 1013[36]
17Wood *5.67 × 10161.61 × 10163.10 × 1013[36]
18Machine rentals and M 4.90 × 10188.72 × 10173.10 × 1013[36]
19Refinery cost 1.32 × 10159.70 × 10143.10 × 1013[36]
20Operational cost 3.26 × 10183.56 × 10173.10 × 1013[36]
Purchased Renewable Resources(FR)3.35 × 10184.07 × 1017
Purchased Renewable Resources (FN)8.99 × 10181.31 × 1018
Subtotal (F)1.23 × 10191.71 × 1018
Total Emergy Used (U)1.62 × 10192.47 × 1018
refers to non-renewable purchased resources; * presents renewable purchased resources. Φ refer to Appendix A Table A1 and Table A2 for the calculations of emergy values for the various resource flowing into the alluvial and underground system, respectively. “U” system refers to the underground mining (JYK Co. Limited) whereas “A” system refers to the alluvial mining system (AMASS Co Limited).
Table 4. Summary of emergy indices for the studied systems.
IndicesUnitCases
Alluvial SystemUnderground SystemPeruvian Mine
Emergy used (U)sej2.47 × 10181.62 × 10191.41 × 1021 *
Yield (Y)g6.00 × 1035.20 × 1049.40 × 107 **
Market ValueUSD2.27 × 1051.97 × 1061.19 × 109 *
Emergy Receivedsej/USD6.14 × 10175.32 × 10183.22 × 1021 *
UEVsej/g4.11 × 10143.12 × 10141.50 × 1013 **
%R%18.828.435.0 **
EYR 1.441.32-
ELR 4.312.53-
ESI 0.330.52-
EER 0.230.332.28 **
* Means values were deduced based on the values from Ingswersen [20]. According to Ingswersen, the unit price of gold as retrieved from metal prices was $12.69 USD/g in 2005 [20]. ** means the values were directly quoted from Ingwersen. The economic performance (market value) of gold was based on $37.89 USD/g of gold as of 31 December 2015 [42]. The em$ equivalent of the market value was based on the world emergy per dollar value of 2.70 × 10¹² sej/$, according to the National Environment Accounting Database [30].

