How Third-Party CSR Evaluation Matters: Keeping Up with Rivals in CSR Performance Ratings of Korean Firms, 2011–2015

College of Business, Hongik University, Seoul 121-791, Korea
Sustainability 2017, 9(11), 2137; https://doi.org/10.3390/su9112137
Submission received: 10 October 2017
/
Revised: 7 November 2017
/
Accepted: 15 November 2017
/
Published: 20 November 2017
(This article belongs to the Section Economic and Business Aspects of Sustainability)
Abstract
:Does corporate social responsibility (CSR) evaluation by third-party entities (i.e., external agencies, including civic organizations) affect the CSR performance of firms? This article explores the question of whether and how third-party CSR ratings change the subsequent CSR behavior and hence performance of rated firms. Combining insights from the research on ratings/rankings and a behavioral theory of firms, we hypothesize that firms with large negative CSR rating gaps—i.e., CSR ratings below the industry average—are more prone to improving their subsequent CSR behavior, and hence performance ratings, than those with small negative gaps, because of the desire to avoid being viewed as CSR laggards relative to their industry rivals. As a result, efforts are directed at enhancing CSR performance. Empirical support for this conjecture is found through random effect regression analyses of publicly listed firms in Korea that were rated by the KEJI (Korean Economic Justice Institute) during 2011–2015 with respect to multiple dimensions of CSR. Further results show that the positive effect of negative CSR rating gaps on subsequent CSR ratings appears only in the firms without well-established reputations, suggesting the possibility that firms with weak reputations have stronger incentives to keep up with other industry incumbents in CSR performance ratings than their counterparts.
1. Introduction
Recent years have witnessed the proliferation of various corporate social responsibility (CSR) ratings (and rankings) across the globe. For instance, the Dow Jones Sustainability Indices (DJSI), the indices resulting from the assessment of the CSR performance of a collection of large companies listed on the Dow Jones Market Index, are a nice exemplary that is often regarded as one of the most influential indicators affecting the decisions of the investment community. Similarly, Kinder, Lydenberg, Domini Research and Analytics (KLD) has been tracking and rating the CSR performances of many companies traded in the United States (U.S.) stock market for many years. Forbes, a widely read, U.S.-based business magazine, has been featuring the companies with the best CSR reputations since 2012. The prevalence of CSR ratings/rankings is not limited to the U.S. For example, among others, the Ethical Corporation, a business intelligence company based in the United Kingdom (U.K.), has been listing socially responsible firms and giving “Responsible Business Awards” for some 20 years. Toyo Keizai, a Japanese magazine, has been annually publishing the CSR performance scores and rankings of large Japanese firms since 2006. Likewise, the KEJI (Korean Economic Justice Institute) has been assessing the CSR performances of Korean firms since 2000.
Much of the prior research on CSR has typically considered such third-party CSR ratings merely as empirical proxies that more or less accurately reflect firms’ actual CSR performance. Yet this literature has overlooked the research and findings from the literature on ratings/rankings [1,2,3,4,5,6,7,8], which suggests that ratings/rankings in and of themselves could impact organizational behavior. In this paper, we explore the possibility that firms might care more about CSR ratings per se. If this is the case, we should observe that firms’ improvement in CSR is partly attributable to such a tendency.
Combining insights from the research on ratings/rankings [1,2,3,4,5,6,7,8] and a behavioral theory of the firm [9,10,11,12,13,14,15], we hypothesize that rated firms are more likely to enhance their subsequent CSR behavior, and hence performance ratings, when their negative CSR rating gaps—CSR ratings below the industry average—are large rather than small, while positive CSR rating gaps—CSR ratings above the industry average—are unlikely to change their subsequent behavior. We reason that this relationship arises because firms tend to seek to eschew being seen as CSR laggards compared with their industry rivals, thereby putting more efforts toward elevating their CSR performance. Contrarily, firms will be less prone to changing their current practices pertaining to CSR when their CSR ratings indicate they are performing well above their rivals. Moreover, we predict that such tendency will be contingent on firms’ existing reputational standing (i.e., brand reputation). Our hypothesis is that firms are motivated to improve their CSR performance ratings in the subsequent period after their negative CSR rating gaps heighten only when their existing reputational standing is not sufficiently strong.
We validate our theoretical argument using data on the publicly listed Korean firms, whose CSR performances are evaluated by the KEJI (Korean Economic Justice Institute) with respect to multiple dimensions of CSR, including: community contribution and diversity, consumer protection, fair trade with business partners, employee satisfaction, environmental protection, and corporate governance [16,17]. We believe that our empirical context serves as an attractive setting to test our hypotheses, largely because the societal demand for ethical conduct from local companies has peaked in Korea during the last two decades. Such calls for corporate social responsibility in turn has been placing great pressures on many firms, especially firms under third-party scrutiny, to pay a great deal of attention to their CSR-related practices.
We find robust empirical support for our hypotheses through random effect regression analyses of 628 firm-year observations, with 278 unique firms rated by the KEJI during 2011–2015. Our results from a series of analyses confirm that there is a positive association between a focal firm’s negative CSR rating gap—CSR ratings below the industry average—and its subsequent CSR rating. Yet our findings indicate that such a relationship appears to hold only in the firms with less well-established reputations.
Overall, the theory and evidence provided in this study document a novel way in which third-party CSR ratings might influence a large group of target firms. We demonstrate that CSR ratings indeed can change the CSR behavior (and hence CSR performance) of certain firms (i.e., those firms with the CSR ratings below the industry average), and that the firms with weak reputations in particular tend to be subject to more pressure to improve their CSR practices and performance upon receiving below industry average CSR ratings. Our study thus fills a gap in the literature on CSR by shedding further light on the sources of firms’ CSR performance that exist beyond organizational boundaries.
2. Theory and Hypotheses
A burgeoning body of research has documented a host of organization-level factors positively associated with firms’ CSR behavior and performance. For instance, studies showed that certain psychological and socio-economic traits of high-ranking corporate officers tend to affect the CSR performance of their firms. This stream of work notes that the level of CSR efforts by firms is partly determined by the moral orientations of the individuals in influential positions [18,19,20]. More interestingly, some researchers suggested that the desires of the upper-echelon members of firms for more public attention, a better reputation, and higher labor market value are also important drivers behind their firms’ pursuit of CSR initiatives [20,21]. While this line of work focuses on the attributes of individual firm decision-makers as an explanation for the CSR performance of firms, others moved their attention up to group-level features of the key decision-making body within firms. For instance, numerous studies found that the demographic composition of board members matters in a firm’s involvement and performance in CSR-related matters [22,23,24,25,26].
In contrast to the ever-growing literature on the organizational antecedents of the CSR performance of firms, however, far less is known about extra-organizational sources that might account for a large amount of attention and resource allocation directed toward boosting CSR performance by many firms. Due to this gap in the existing literature, this paper shifts its focus from factors inside organizations toward those beyond organizations. In particular, we explore the role of external CSR evaluation—in other words, those CSR assessments carried out by third-party agencies, including market intermediaries, government agencies, and civic organizations—that are typically publicized and disseminated in the form of ratings/rankings.
In essence, ratings/rankings are social measures designed to evaluate the specified performance of a target group of organizations (sometimes individual product offerings), and they are typically manifested in reduced numeric forms (i.e., standardized scores or rank orders). The research on the phenomenon of ratings/rankings notes that ratings/rankings are part of a broad trend toward quantification and standardization in contemporary life. These ratings/rankings are devised to ensure the accountability and transparency of a target group, and third-party entities such as market intermediaries, government agencies, and civic movement groups conduct the majority of evaluation activities and publicize the outcomes [1,2,3,4,5,6,7,8]. It is also noted that due to the high level of publicity, elicited ratings/rankings are socially salient and widely shared, and such characteristics thus render ratings/rankings as useful benchmarks for decision-making by many outside stakeholders. As these outside parties often face the problem of information asymmetry, ratings/rankings help reduce uncertainty about the actual quality (i.e., the qualities underlying CSR performance or financial performance) of organizations, which is somewhat difficult to observe directly. Most notably, research further suggests that ratings/rankings are not just outcomes of measurement and evaluation by external entities, but also can cause reactive responses from those under evaluation. An awareness of being rated/ranked can lead target organizations under evaluation to change their behavior according to evaluation criteria, which is motivated by a desire to receive more favorable ratings and the accompanying benefits [1,2].
Scholars of the behavioral theory of firms have long argued that a firm’s current performance below or above a specific reference point (i.e., the industry average) determines managers’ perception of their firm’s degree of failure or success [9,10,11,12,13,14,15]. In particular, perceptions of failure compared with industry rivals are likely to motivate managers to allocate more efforts and resources toward finding solutions that they believe can remedy the shortfalls in the firm’s current performance vis-à-vis those of their rivals [9,10,11,12,13,14,15]. That is, when managers see their firm’s current performance falling below the expectation or reference level, they will perceive the current state of their firm’s operations as being problematic, and in need of updates or overhaul [9,10,11,12,13,14,15].
Combining the aforementioned insights from the research on ratings/rankings and the research on the behavioral theory of the firm to the CSR context, we contend that third-party CSR ratings can influence rated firms by compelling them to compare their CSR ratings with those of their industry rivals. We specify that the firms with the CSR ratings negatively deviating from those of industry peers (i.e., the industry average CSR rating), or what we call “negative CSR rating gaps” in this article, will be induced to implement organizational changes pertaining to CSR. We reason that such changes would be triggered by a problem-driven (i.e., the below industry average CSR rating) search, and culminate in the improvement of the subsequent CSR performance ratings. In other words, those firms performing lower than the average of their industry rivals in third-party CSR ratings will be compelled to allocate more managerial attention and resources to CSR-related matters, and thus undertake some form of organizational change that helps fix their CSR underperformance.
By contrast, we expect that the firms with positive CSR rating gaps—CSR ratings above the industry average—will be less likely to be concerned about further improving their CSR-related practices, and hence there will be no change in their subsequent CSR behavior and performance. We suggest that this is so because, unlike the managers of the firms with negative CSR rating gaps who are more likely to be anxious about enhancing their future CSR performance to avoid being viewed as CSR laggards, the managers of the firms that are already performing well compared with their industry rivals are less likely to be anxious about enhancing their future CSR performance, and more likely to be satisfied with the status quo. Accordingly, we expect that firms will subsequently improve their CSR ratings when their negative CSR rating gaps increase, but not when their positive CSR rating gaps increase. In sum, we hypothesize:
Hypothesis 1 (H1).
A focal firm’s CSR rating is positively associated with its negative CSR rating gap—its CSR rating below the industry average—in the previous year.
Nevertheless, we suspect that such a tendency might be contingent on a firm’s existing reputational standing (i.e., brand reputation). That is, our Hypothesis 1, a claim stating that firms are likely to improve their CSR performance as their negative CSR rating gaps increase, is likely to hold only with those firms with weak reputational standing, and is not likely to hold with their counterparts with strong reputations.
Corporate reputation refers to comprehensive perceptions held by external stakeholders about a focal firm’s quality along multiple dimensions [27]. Corporate reputation typically takes a long time to build, and is thus less amenable to quick change unless large-scale, dramatic negative events occur [27]. As a result, highly reputable firms might feel less urgency to introduce quick measures that are geared towards addressing the problem of below industry average CSR ratings, as they are assured in the knowledge that their reputations with outside stakeholders are already secure. By contrast, upon receiving below industry average CSR ratings, those firms without well-established reputations might have stronger incentives to compensate for weak reputational standing. Therefore, these firms are more likely to seek to keep up with the average CSR performance of their industry incumbents compared with their counterparts. Thus, we predict that our hypothesized relationship (H1) will be more pronounced in the firms with weak reputations (i.e., well-established brand reputations). Formally,
Hypothesis 2 (H2).
Brand reputation negatively moderates the relationship between a focal firm’s negative CSR rating gap and its subsequent CSR rating.
In what follows, we describe our data and empirical strategy in detail. Then, the results that corroborate our hypotheses are presented, with the addition of results from supplementary analysis and robustness checks. Finally, we discuss the implications of our findings, state the limitations of the current work, and provide directions for future research.
3. Methods
3.1. Data Sources and Sample
To compile a dataset to test our hypotheses, we consulted multiple sources, including (1) the KEJI’s annual list of “the 200 Best Companies in CSR” with available KEJI indices; (2) the KIS-VALUE database owned and managed by the Korea Listed Companies Association, which contains detailed financial information of the firms listed in the Korean stock exchanges (KSE); (3) “The Most Valuable Korean Brands” announced by Brand Finance, a U.K.-based, leading independent brand valuation consultancy.
It is useful to briefly describe here the background of the KEJI and how it evaluates a target population of local firms. During the late 1980s, the notion that Korean firms lagged far behind their global competitors in terms of CSR performance had led many outside actors, including the government and civic organizations, to push for reforms in business practices in the private sector. As part of this nationwide endeavor, the Citizens’ Coalition for Economic Justice, a local civic group, was founded in 1989. In 1991, the KEJI was established by the Citizens’ Coalition for Economic Justice as a research affiliate responsible for assessing the CSR performance of Korean firms. In its role as an external evaluator of local companies, the KEJI devised a rating system now known as the KEJI Index, and has been publishing the CSR ratings of Korean firms since 2000.
The coverage of CSR-related issues by the KEJI index includes community contributions (i.e., charitable giving, tax issues, and support for community and human rights), diversity (i.e., inclusion and fair treatment of minority groups), consumer protection, fair trade with business partners, employee satisfaction, environmental protection, and soundness in corporate governance and investments [16,17]. The KEJI reports that they collect relevant CSR information from a wide array of sources, including government agencies, mass media coverage, and other civic organizations. It is also reported that the KEJI check the validity of the information obtained from these sources through company interviews. The KEJI states that their goal is to distinguish those socially responsible companies with sustainable business practices that provide benefits for the country and people from the less responsible Korean firms [16].
Although the KEJI has been publishing its annual list of “the 200 Best Companies in CSR” under various names since 2000, the KEJI rating system was substantially altered in 2011 (as of 2016, they issued their 26th ratings) [16]. Since the consistency and stability of evaluation criteria is important to our empirical test, we decided to limit our sample to those firms rated during the period from 2011 to 2015. The detailed summary statistics of the KEJI ratings and the breakdowns of these ratings during 2011–2015 by each of the KEJI’s six CSR elements—i.e., community and diversity, consumer protection, employee satisfaction, environmental protection, fair trading, and corporate governance—are provided in Table A1 and Table A2 in Appendix A.
We constructed our sample firms using the following procedures. First, we matched the data from the three aforementioned data sources. Second, since we are interested in measuring the effect of being rated by the KEJI—in particular, a negative CSR rating gap—in the past on the subsequent improvement in a focal firm’s KEJI rating, it is important to restrict our sample to those firms not just with current ratings, but also with a history of being rated. The number of the firms that were rated at least once during 2011–2015 is 809 (See Appendix B, Table A3). Among these firms, we excluded 181 firm-year observations that were rated only once. Thus, in our sample, all of the firms that were rated at least once during 2011–2015 have the history of being rated at least once prior to a given year, for which we used the KEJI rating data that goes back to 2005. These procedures leave us with 628 firm-year observations with 278 unique firms (See Appendix B, Table A3). The distribution of the affiliated industries (one-digit Korean standard industry classification (SIC) code) with the firms included in our sample is as follows: manufacturing (82%), communication and information technology (4%), wholesale and retail distribution (3.5%), financial services (3%), transportation (2.2%), specialty services (2.2%), energy (1.2%), business services (0.8%), and entertainment (0.4%).
Although our sample firms were rated at least twice, it is still possible that some firms are not included in “the 200 Best Companies in CSR” in some years. In these cases, we assigned a 0 to those not included in the 200 list. We chose to do so because our theoretical interest lies in exploring the disciplining effect of the ratings system per se, which requires that we distinguish the occasions of being rated—where firms are highly scored and thus included in the 200 list—from the occasions of not being rated.
Still, the likelihood of being rated—i.e., being included in the KEJI’s annual list of “the 200 Best Companies in CSR”—is not random, which can create concerns about sample selection. To address this selectivity issue, we follow the common procedure of including the inverse Mills ratio in the regression models. Based on Lee’s (1982) adaptation of Heckman’s (1979) two-step method devised to correct for such selection bias, we estimated the first-stage selectivity model on a dummy variable that indicates whether a given firm is in the KEJI 200 list in a given year [28,29]. We ran this model on the larger sample of publicly traded Korean firms covered by KIS-VALUE. This model includes a dummy variable that codes a 1 if a firm was listed in the KEJI list in the prior year, and all of the control variables included in our main regression models (see Table A4 in Appendix C).
3.2. Dependent Variable and Independent Variables
Our dependent variable is a firm’s CSR rating, as published in the KEJI’s annual list of “the 200 Best Companies in CSR” in a given year during 2011–2015.
Our independent variable is a spline variable, and is referred to as the negative CSR performance rating gap of a focal firm in a given year. We compute spline variables using the following steps:
where is a focal firm, is its industry rivals included in a given industry Gi,t, and n(Gi,t) is the number of the firms in each industry group.
Industry average CSR ratingt = Σ CSR ratingt/n(Gi,t), where i, j ∈ Gi,t
Positive CSR rating gapi,t = CSR rating i,t − Industry average CSR ratingt if CSR rating i,t − Industry average CSR ratingt > 0; otherwise 0
Negative CSR rating gapi,t = CSR rating i,t − Industry average CSR ratingt if CSR rating i,t − Industry average CSR ratingt < 0; otherwise 0
3.3. Moderating Variables
Our moderating variable is the reputational standing of a focal firm in a given year, for which we relied on the list of “The Most Valuable Korean Brands” published by Brand Finance. Brand Finance states that they measure the strength of a brand based on multiple attributes, including emotional connection, financial performance, and sustainability, among others. We consider the firms included in this list as having strong corporate reputations, and code them as a 1 in the variable of brand reputation, and a 0 otherwise. We used the list published for the year 2012, and hence this is a time-invariant variable.
3.4. Control Variables
We included several control variables that might affect a firm’s CSR rating. First, we controlled for basic firm attribute indicators, such as the value of total assets. Second, the extent of a firm’s financial and market success was controlled using two indicators of firm performance, such as return on equity (ROE) and Tobin’s q, which is the ratio between the market value of a firm’s assets and their replacement value. Third, we measured the variables capturing a firm’s investment intensity in research and development (R & D), advertising, and labor intensity, and we also included intangible assets.
Finally, several attributes of a firm’s ownership structure were controlled for, including the portion of ownership by foreign investors, the largest shareholder, and the inside members of the firm. The investment by a focal firm in other related firms was also controlled for. Finally, we included year dummies to adjust for period effects.
In the robustness checks, we further included the variable capturing the number of rated firms in a given industry to mitigate against the concern that these variables might be driving the observed relationship between negative CSR rating gap and the subsequent CSR performance rating, as those firms operating in an industry populated by many rated firms are more likely to be subject to more competitive pressures than their counterparts.
3.5. Statistical Models
Given that we have the unbalanced panel data and one of our hypothesis-testing variables (i.e., brand reputation) is time-invariant, we fit the random effects estimator to test the two hypotheses proposed above [30]. The Hausman (1978) specification test indicated that the random effects (RE) estimator provided an adequate model fit [31]. All variables, except for the dependent variable, are lagged one year in the regression models. We use the heteroskedasticity-robust standard error estimator in running our models. We build our regression models as follows:
where H1 predicts that β1 > 0, which indicates that the negative CSR rating gap (reverse coded) is positively associated with the subsequent CSR performance ratings. H2 predicts that β2 < 0, that is, brand reputation negatively moderates the relationship hypothesized in H1.
CSR ratingi,t = β0 + β1(Negative CSR rating gapi,t−1) + β2(Control variablesi,t−1) + εi,t−1
CSR ratingi,t = β0 + β1(Negative CSR rating gapi,t−1) + β2(Brand reputationi,t−1) + β3(Control variablesi,t−1) + εi,t−1
CSR ratingi,t = β0 + β1(Negative CSR rating gapi,t−1) + β2((Negative CSR rating gapi,t−1) × (Brand reputationi,t−1)) + β3(Control variablesi,t−1) + εi,t−1
In the robustness checks, we reran the models using random effect Tobit regression, because the value of our dependent variable is a continuous variable taking on non-negative values and bounded by the maximum CSR rating of 80 [32].
4. Results
4.1. Descriptive Statistics
Table 1 exhibits the descriptive statistics of our study variables. Table 2 presents the correlation coefficients among these variables. Our variance inflation factors (VIFs) fall well outside the conventional threshold of 10. Thus, we are assured that the multicollinearity problem is not serious in our data.
Table 3 reports the results of our random effect regression analyses. We first estimated a baseline model with control variables only, along with year dummy and industry dummy variables (Model 1). Notably, firms with strong brand reputations appear less likely to improve their CSR ratings in the subsequent year, whereas their counterparts with weak brand reputations appear more likely to focus on boosting their subsequent CSR ratings. Such findings, we speculate, can be attributable to the notion that existing reputation can serve as a buffer that shields firms from the damage that arises from lowered CSR ratings. In other words, highly reputable firms might be under less pressure to adopt quick measures that are geared towards enhancing CSR ratings, as they are assured in the knowledge that their reputations with outside stakeholders are already secure. Contrarily, the firms that have yet to establish reputations might be under stronger pressure to heighten their CSR ratings, since they do not possess the same level of reputational insurance that the former enjoys.
In Model 2, we enter our independent variables (two spline variables). Model 2 shows that there is a statistically positive relationship between a focal firm’s negative CSR rating gap (reverse coded) and its CSR performance rating in the subsequent year. We added the interaction term between brand reputation and negative CSR rating gap in Model 3. This effect is negative and statistically significant. Overall, these results lend support to our H1 and H2. In Model 4 through Model 6, we replicate Model 1 to Model 3 without industry fixed effects, and find substantially consistent results.
4.2. The Effects of CSR Ratings and Brand Reputation
In Figure 1, the interaction effect (H2) is plotted. This graph clearly demonstrates that our H1 holds only in the firms with weak reputational standing (dotted line). By contrast, such effect appears to reverse among those firms with well-established reputations (straight line).
4.3. Supplementary Analysis
Instead of using the comprehensive KEJI performance ratings, we broke down this composite index into six CSR elements—community contribution and diversity, consumer protection, employee satisfaction, environmental protection, fair trading with business partners, and corporate governance. As a result, we created six different independent variables, and fitted our regression model with each of these variables. Although the results from these additional analyses remain largely consistent (see Table 4), the negative interaction effects fall short of being statistically significant in the cases of employee welfare and environmental protection (see Table 4).
4.4. Robustness Checks
We conducted several robustness checks to ensure our results remained consistent across alternative specifications and with the additions of other variables. First, we re-estimated our models with the random effect Tobit regression, since the value of our dependent variable is a censored, continuous variable [32] (Table 5, Models 20–22). Second, we included the variable capturing the number of rated firms in a given industry (Table 5, Model 23) to mitigate against the concern that this variable might be driving the observed relationship between negative CSR rating gap and the subsequent CSR performance rating, as those firms operating in an industry populated by many rated firms are more likely to be under stronger competitive pressures than those in an industry with few such firms. This additional result confirms that our findings remain robust to alternative estimation. In sum, multiple robustness checks ensure that the findings presented in Table 4 are not particularly sensitive to the usage of any particular specifications, or the inclusion of any additional variable.
5. Discussions and Conclusions
In this article, we have examined whether the firms under external or third-party evaluation in the form of CSR ratings—i.e., rated firms—are focused on elevating their CSR performance ratings regardless of their industry rivals’ CSR ratings, or are focused on avoiding being viewed as CSR laggards compared with those rivals, so as not to diminish their relative social standing in the eyes of outside stakeholders. To this end, we have integrated the research on ratings/rankings with core ideas from a behavioral theory of firms.
Analyzing a sample of publicly listed firms in Korea that have been rated by the KEJI from 2011 to 2015, we found evidence in line with the idea that third-party CSR ratings influence rated firms by compelling them to compare their CSR ratings with those of their industry rivals, and that firms will subsequently allocate more (less) managerial attention to CSR-related matters as their negative CSR rating gap relative to rivals increases (decreases). Specifically, results suggest that firms with a large negative gap will subsequently improve their CSR performance (and hence CSR ratings). Nevertheless, this tendency appears only in the firms with weak reputational standing, and reverses among their counterparts with strong reputations. We further confirmed that these findings remain largely robust.
Overall, this study demonstrates how firms’ attempts to avoid being viewed as CSR laggards and keep up with rivals are a key driver behind the influence of CSR rankings on firms’ voluntary improvement of CSR performance. Taken together, our study is expected to contribute to the literature on CSR at least in two ways. First, our study goes one step deeper than previous studies on CSR, through exploring the role of third-party ratings, and how they matter. Thus, our study provides novel insights as to how third-party CSR ratings might influence target firms by demonstrating that CSR ratings indeed change the CSR behavior (and hence CSR performance) of certain firms (i.e., those below the industry average of CSR performance ratings). Second, the finding that the firms with weak reputations tend to be subject to more pressure to improve their CSR practices highlights corporate reputation as a key contingency in this process.
Our study suffers from several limitations, which might be addressed in future studies. First, our findings might not be generalizable to organizations operating in institutional contexts where public demand for more socially responsible companies remains low. Thus, the theoretical idea proposed in this paper merits further empirical examination across different contexts in future research. Second, although we find the empirical results largely consistent with our argument, our current work says relatively little about why firms with strong reputations might not be further encouraged from pushing for more improvement in their CSR performance. This is an intriguing aspect that is underexplored in the current work, and thus needs to be further unpacked through future research. Lastly, the CSR research community would benefit further from more in-depth, qualitative research that offers a more nuanced, fine-grained understanding on the role of ratings and corporate reputation in the CSR arena.
Acknowledgments
This work was supported by the National Research Foundation of Korea Grant funded by the Korean Government (NRF-2017S1A5A2A03068073)
Conflicts of Interest
The authors declare no conflict of interest.
Abbreviations
The following abbreviations are used:
| CSR | Corporate Social Responsibility |
| DJSI | The Dow Jones Sustainability Indices |
| KLD | Kinder, Lydenberg, Domini Research and Analytics |
| KEJI | Korean Economic Justice Institute |
| SIC | Standard Industry Classification |
| R & D | Research and Development |
| ROE | Return on Equity |
| VIF | Variance Inflation Factor |
| RE | Random Effects |
| FE | Fixed Effects |
Appendix A
Table A1 details the descriptive statistics of the KEJI CSR ratings and the breakdowns of these ratings during 2011–2015. This table also shows how each CSR element—community contribution and diversity, consumer protection, employee satisfaction, environmental protection, fair trading with business partners, and corporate governance—contributes to the total CSR rating. Table A2 provides correlations between CSR elements.

Table A1.
Summary Statistics of Ratings by CSR Element.
| Ratings by CSR Element | Year | Mean | S.D. | Min | Max | Influence * |
| Community | 2015 | 5.91 | 1.3 | 3.75 | 8.59 | 0.47 |
| Environmental | 2015 | 4.95 | 1.44 | 0 | 7.2 | 0.11 |
| Consumer | 2015 | 10.11 | 0.52 | 7.6 | 11.2 | 0.15 |
| Employee | 2015 | 9.67 | 1.08 | 5.41 | 11.56 | 0.21 |
| Fairness | 2015 | 14.97 | 1.24 | 9.95 | 17.15 | 0.16 |
| Corporate Governance | 2015 | 16.87 | 2.74 | 12.78 | 30.65 | 0.3 |
| Total | 2015 | 62.46 | 2.08 | 59.74 | 68.41 | 1 |
| Ratings by CSR Element | Year | Mean | S.D. | Min | Max | Influence |
| Community | 2014 | 6.64 | 1.25 | 4 | 9.52 | 0.45 |
| Environmental | 2014 | 5.23 | 1.06 | 0 | 7.45 | 0.12 |
| Consumer | 2014 | 9.62 | 0.71 | 6.65 | 10.6 | 0.05 |
| Employee | 2014 | 9.59 | 0.87 | 7.04 | 11.22 | 0.21 |
| Fairness | 2014 | 15.92 | 1.01 | 11.75 | 17.15 | 0.16 |
| Corporate Governance | 2014 | 17.75 | 1.75 | 13.43 | 25.43 | 0.49 |
| Total | 2014 | 64.75 | 1.92 | 62.02 | 70.19 | 1 |
| Ratings by CSR Element | Year | Mean | S.D. | Min | Max | Influence |
| Community | 2013 | 6.67 | 1.32 | 3.78 | 10.37 | 0.36 |
| Environmental | 2013 | 5.4 | 1.2 | 0 | 7.2 | 0.23 |
| Consumer | 2013 | 9.85 | 0.7 | 6.95 | 11.05 | 0.11 |
| Employee | 2013 | 8.91 | 1.04 | 5.54 | 11.05 | 0.29 |
| Fairness | 2013 | 15.12 | 1.17 | 11.75 | 16.85 | 0.15 |
| Corporate Governance | 2013 | 18.21 | 2.17 | 13.88 | 27.95 | 0.32 |
| Total | 2013 | 64.17 | 2.01 | 61.62 | 72.16 | 1 |
| Ratings by CSR Element | Year | Mean | S.D. | Min | Max | Influence |
| Community | 2012 | 6.71 | 1.15 | 3.93 | 11.71 | 0.37 |
| Environmental | 2012 | 5.29 | 0.94 | 0 | 7.25 | 0.35 |
| Consumer | 2012 | 10.01 | 0.42 | 7.6 | 10.85 | 0.08 |
| Employee | 2012 | 9.88 | 0.87 | 7 | 11.81 | 0.11 |
| Fairness | 2012 | 15.19 | 1.22 | 9.95 | 17.15 | 0.26 |
| Corporate Governance | 2012 | 17.85 | 1.84 | 14.11 | 29.81 | 0.32 |
| Total | 2012 | 64.92 | 1.79 | 62.67 | 71.14 | 1 |
| Ratings by CSR Element | Year | Mean | S.D. | Min | Max | Influence |
| Community | 2011 | 6.6 | 1.17 | 3.51 | 11.3 | 0.31 |
| Environmental | 2011 | 4.44 | 1.85 | 0 | 8 | −0.13 |
| Consumer | 2011 | 10.08 | 1.03 | 8.15 | 13.7 | 0.26 |
| Employee | 2011 | 8.65 | 1.45 | 3.82 | 11.14 | −0.02 |
| Fairness | 2011 | 16.02 | 1.14 | 11.95 | 17.15 | −0.1 |
| Corporate Governance | 2011 | 18.84 | 3.13 | 13.78 | 29.42 | 0.52 |
| Total | 2011 | 64.63 | 1.87 | 62.1 | 70.99 | 1 |
* The influence on the total CSR rating.
Table A2.
Correlation Coefficients among Six CSR Elements (2011–2015).
| 2015 | 1 | 2 | 3 | 4 | 5 | 6 | |
| 1 | Community | 1 | |||||
| 2 | Environmental | −0.09 | 1 | ||||
| 3 | Consumer | −0.18 | 0.09 | 1 | |||
| 4 | Employee | −0.13 | 0.56 | 0.17 | 1 | ||
| 5 | Fairness | −0.16 | 0.11 | 0.19 | 0.17 | 1 | |
| 6 | Corporate Governance | 0.09 | −0.69 | −0.18 | −0.59 | −0.42 | 1 |
| 2014 | 1 | 2 | 3 | 4 | 5 | 6 | |
| 1 | Community | 1 | |||||
| 2 | Environmental | −0.01 | 1 | ||||
| 3 | Consumer | −0.24 | −0.07 | 1 | |||
| 4 | Employee | −0.09 | −0.05 | 0.03 | 1 | ||
| 5 | Fairness | −0.26 | −0.2 | 0.19 | 0.07 | 1 | |
| 6 | Corporate Governance | 0.07 | −0.3 | −0.26 | −0.22 | −0.2 | 1 |
| 2013 | 1 | 2 | 3 | 4 | 5 | 6 | |
| 1 | Community | 1 | |||||
| 2 | Environmental | 0.03 | 1 | ||||
| 3 | Consumer | −0.26 | 0.25 | 1 | |||
| 4 | Employee | −0.05 | 0.21 | 0.09 | 1 | ||
| 5 | Fairness | −0.3 | −0.12 | 0.27 | 0.05 | 1 | |
| 6 | Corporate Governance | −0.02 | −0.47 | −0.39 | −0.35 | −0.26 | 1 |
| 2012 | 1 | 2 | 3 | 4 | 5 | 6 | |
| 1 | Community | 1 | |||||
| 2 | Environmental | 0.09 | 1 | ||||
| 3 | Consumer | −0.13 | 0.34 | 1 | |||
| 4 | Employee | −0.14 | −0.21 | −0.09 | 1 | ||
| 5 | Fairness | −0.1 | 0.19 | 0.01 | 0.02 | 1 | |
| 6 | Corporate Governance | −0.14 | −0.33 | −0.2 | −0.17 | −0.46 | 1 |
| 2011 | 1 | 2 | 3 | 4 | 5 | 6 | |
| 1 | Community | 1 | |||||
| 2 | Environmental | −0.01 | 1 | ||||
| 3 | Consumer | −0.01 | −0.81 | 1 | |||
| 4 | Employee | −0.13 | 0.65 | −0.68 | 1 | ||
| 5 | Fairness | −0.34 | 0.21 | −0.3 | 0.25 | 1 | |
| 6 | Corporate Governance | 0.01 | −0.78 | 0.73 | −0.68 | −0.44 | 1 |
Appendix B
We built our risk set following the steps described below. Matching the KEJI’s list of the “200 Best CSR Firms” that were rated during 2011–2015 with the data from KIS-VALUE (with financial data) resulted in 809 (152 + 155 + 160 + 164 + 178) firms (Table A3a). Among these rated firms, we excluded 181 firm observations, because they were not previously rated throughout 2005–2014. After this procedure, our final sample includes 628 firm-year observations (Table A3b).
Table A3.
(a) Sample Construction; (b) Final Sample.
| (a) | |||
| Frequency | % | ||
| 2011 | Non-rated firms with financial data | 1620 | 91.42 |
| Rated firms with financial data | 152 | 8.58 | |
| Total | 1772 | 100 | |
| 2012 | Non-rated firms with financial data | 1650 | 91.41 |
| Rated firms with financial data | 155 | 8.59 | |
| Total | 1805 | 100 | |
| 2013 | Non-rated firms with financial data | 1672 | 91.27 |
| Rated firms with financial data | 160 | 8.73 | |
| Total | 1832 | 100 | |
| 2014 | Non-rated firms with financial data | 1692 | 91.16 |
| Rated firms with financial data | 164 | 8.84 | |
| Total | 1856 | 100 | |
| 2015 | Non-rated firms with financial data | 1722 | 90.63 |
| Rated firms with financial data | 178 | 9.37 | |
| Total | 1900 | 100 | |
| (b) | |||
| Frequency | |||
| 2011 | Rated firms with past ratings | 90 | |
| 2012 | Rated firms with past ratings | 122 | |
| 2013 | Rated firms with past ratings | 138 | |
| 2014 | Rated firms with past ratings | 128 | |
| 2015 | Rated firms with past ratings | 150 | |
| Total | 628 | ||
Appendix C
To deal with the concern about selection bias, we estimated the first-stage probit model that predicts the likelihood of being included in the KEJI’s list of “the 200 Best CSR Companies” as follows (Model 24), and then computed and included the inverse Mills ratio in our second stage regression models.
Table A4.
First Stage Probit Model of the Likelihood of Being Rated.
| Variables | Model 24 |
|---|---|
| Probit | |
| Brand reputation | −0.095 |
| (0.171) | |
| ROE | 0.137 *** |
| (0.026) | |
| Tobin’s q | 0.027 |
| (0.018) | |
| Assets | −0.106 * |
| (0.046) | |
| Advertising intensity | 0.702 |
| (1.279) | |
| R & D intensity | −1.300 |
| (1.096) | |
| Labor intensity | −0.759 + |
| (0.426) | |
| Intangible assets | −0.020 + |
| (0.010) | |
| Foreign ownership | 0.008 *** |
| (0.002) | |
| Ownership by largest shareholder | −0.000 |
| (0.054) | |
| Inside ownership | −0.105 |
| (0.103) | |
| Investment in other firms | 0.005 |
| (0.004) | |
| Rated in the prior year | 1.320 *** |
| (0.070) | |
| Constant | −3.651 *** |
| (0.528) | |
| Observations | 7917 |
| Industry FE | Yes |
| Year FE | Yes |
Robust standard errors are in parentheses; *** p < 0.001, * p < 0.05, + p < 0.1; All right-hand side variables are one-year lagged.
References
- Espeland, W.N.; Sauder, M. Rankings and reactivity: How public measures recreate social worlds. Am. J. Sociol. 2007, 113, 1–40. [Google Scholar] [CrossRef]
- Sauder, M.; Espeland, W.N. The discipline of rankings: Tight coupling and organizational change. Am. Sociol. Rev. 2009, 74, 63–82. [Google Scholar] [CrossRef]
- Bastedo, M.N.; Bowman, N.A. US News & World Report college rankings: Modeling institutional effects on organizational reputation. Am. J. Educ. 2009, 116, 163–183. [Google Scholar]
- Bowman, N.A.; Bastedo, M.N. Anchoring effects in world university rankings: Exploring biases in reputation scores. High. Educ. 2011, 61, 431–444. [Google Scholar] [CrossRef]
- Bastedo, M.N.; Bowman, N.A. College rankings as an interorganizational dependency: Establishing the foundation for strategic and institutional accounts. Res. High. Educ. 2011, 52, 3–23. [Google Scholar] [CrossRef]
- Slager, R.; Gond, J.P.; Moon, J. Standardization as institutional work: The regulatory power of a responsible investment standard. Organ. Stud. 2012, 33, 763–790. [Google Scholar] [CrossRef]
- Mingers, J.; Willmott, H. Taylorizing business school research: On the ‘one best way’ performative effects of journal ranking lists. Hum. Relat. 2013, 66, 1051–1073. [Google Scholar] [CrossRef]
- Paradeise, C.; Thoenig, J.C. Academic institutions in search of quality: Local orders and global standards. Organ. Stud. 2013, 34, 189–218. [Google Scholar] [CrossRef] [Green Version]
- Cyert, R.M.; March, J.G. A Behavioral Theory of the Firm; Prentice-Hall: Englewood Cliffs, NJ, USA, 1963. [Google Scholar]
- Festinger, L. A theory of social comparison processes. Hum. Relat. 1954, 7, 117–140. [Google Scholar] [CrossRef]
- Baum, J.A.C.; Dahlin, K.B. Aspiration performance and railroads’ patterns of learning from train wrecks and crashes. Organ. Sci. 2007, 18, 368–385. [Google Scholar] [CrossRef]
- Desai, V.M. Constrained growth: How experience, legitimacy, and age influence risk taking in organizations. Organ. Sci. 2008, 19, 594–608. [Google Scholar] [CrossRef]
- Moliterno, T.P.; Beck, N.; Beckman, C.M.; Meyer, M. Knowing your place: Social performance feedback in good times and bad times. Organ. Sci. 2014, 25, 1684–1702. [Google Scholar] [CrossRef]
- Kuusela, P.; Keil, T.; Maula, M. Driven by aspirations, but in what direction? Performance shortfalls, slack resources, and resource-consuming vs. resource-freeing organizational change. Strateg. Manag. J. 2017, 28, 1101–1120. [Google Scholar] [CrossRef]
- Hu, S.; He, Z.L.; Blettner, D.P.; Bettis, R.A. Conflict inside and outside: Social comparisons and attention shifts in multidivisional firms. Strateg. Manag. J. 2017, 38, 1435–1454. [Google Scholar] [CrossRef]
- KEJI. Best Companies in CSR Sourcebook, 2008–2015; Korea Economic Justice Institute: Seoul, Korea, 2016. [Google Scholar]
- Yu, J.; Lee, S. The impact of greenhouse gas emissions on corporate social responsibility in Korea. Sustainability 2017, 9, 1135. [Google Scholar] [CrossRef]
- Williams, R.J. Women on corporate boards of directors and their influence on corporate philanthropy. J. Bus. Eth. 2003, 42, 1–10. [Google Scholar] [CrossRef]
- Hyun, E.; Yang, D.; Jung, H.; Hong, K. Women on boards and corporate social responsibility. Sustainability 2016, 8, 300. [Google Scholar] [CrossRef]
- Borghesi, R.; Houston, F.; Naranjo, A. Corporate socially responsible investments: CEO altruism, reputation, and shareholder interests. J. Corp. Financ. 2014, 26, 164–181. [Google Scholar] [CrossRef]
- Tang, Y.; Qian, C.; Chen, G.; Shen, R. How CEO hubris affects corporate social (ir)responsibility. Strateg. Manag. J. 2015, 36, 1138–1357. [Google Scholar] [CrossRef]
- Petrenko, O.V.; Aime, F.; Ridge, J.; Hill, A. Corporate social responsibility or CEO narcissism? CSR motivations and organizational performance. Strateg. Manag. J. 2016, 37, 262–279. [Google Scholar] [CrossRef]
- Harjoto, M.; Laksmana, I.; Lee, R. Board diversity and corporate social responsibility. J. Bus. Eth. 2015, 132, 641–660. [Google Scholar] [CrossRef]
- Shaukat, A.; Qiu, Y.; Trojanowski, G. Board attributes, corporate social responsibility strategy, and corporate environmental and social performance. J. Bus. Eth. 2016, 135, 569–585. [Google Scholar] [CrossRef] [Green Version]
- Hafsi, T.; Turgut, G. Boardroom diversity and its effect on social performance: Conceptualization and empirical evidence. J. Bus. Eth. 2013, 112, 463–479. [Google Scholar] [CrossRef]
- Rao, K.; Tilt, C. Board composition and corporate social responsibility: The role of diversity, gender, strategy and decision-making. J. Bus. Eth. 2016, 138, 327–347. [Google Scholar] [CrossRef]
- Bear, S.; Rahman, N.; Post, C. The impact of board diversity and gender composition on corporate social responsibility and firm reputation. J. Bus. Eth. 2010, 97, 207–221. [Google Scholar] [CrossRef]
- Lee, L.F. Some approaches to the correction of selectivity bias. Rev. Econ. Stud. 1982, 49, 355–372. [Google Scholar] [CrossRef]
- Heckman, J.J. Sample selection bias as a specification error. Econometrica 1979, 47, 153–161. [Google Scholar] [CrossRef]
- Wooldridge, J.M. Econometric Analysis of Cross Section and Panel Data; MIT Press: Cambridge, MA, USA, 2010. [Google Scholar]
- Hausman, J.A. Specification tests in econometrics. Econometrica 1978, 154, 1251–1271. [Google Scholar] [CrossRef]
- Wooldridge, J.M. Introductory Econometrics: A Modern Approach, 4th ed.; South-Western Cengage Learning: Mason, OH, USA, 2009. [Google Scholar]
Figure 1.
The Moderating Role of Brand Reputation.
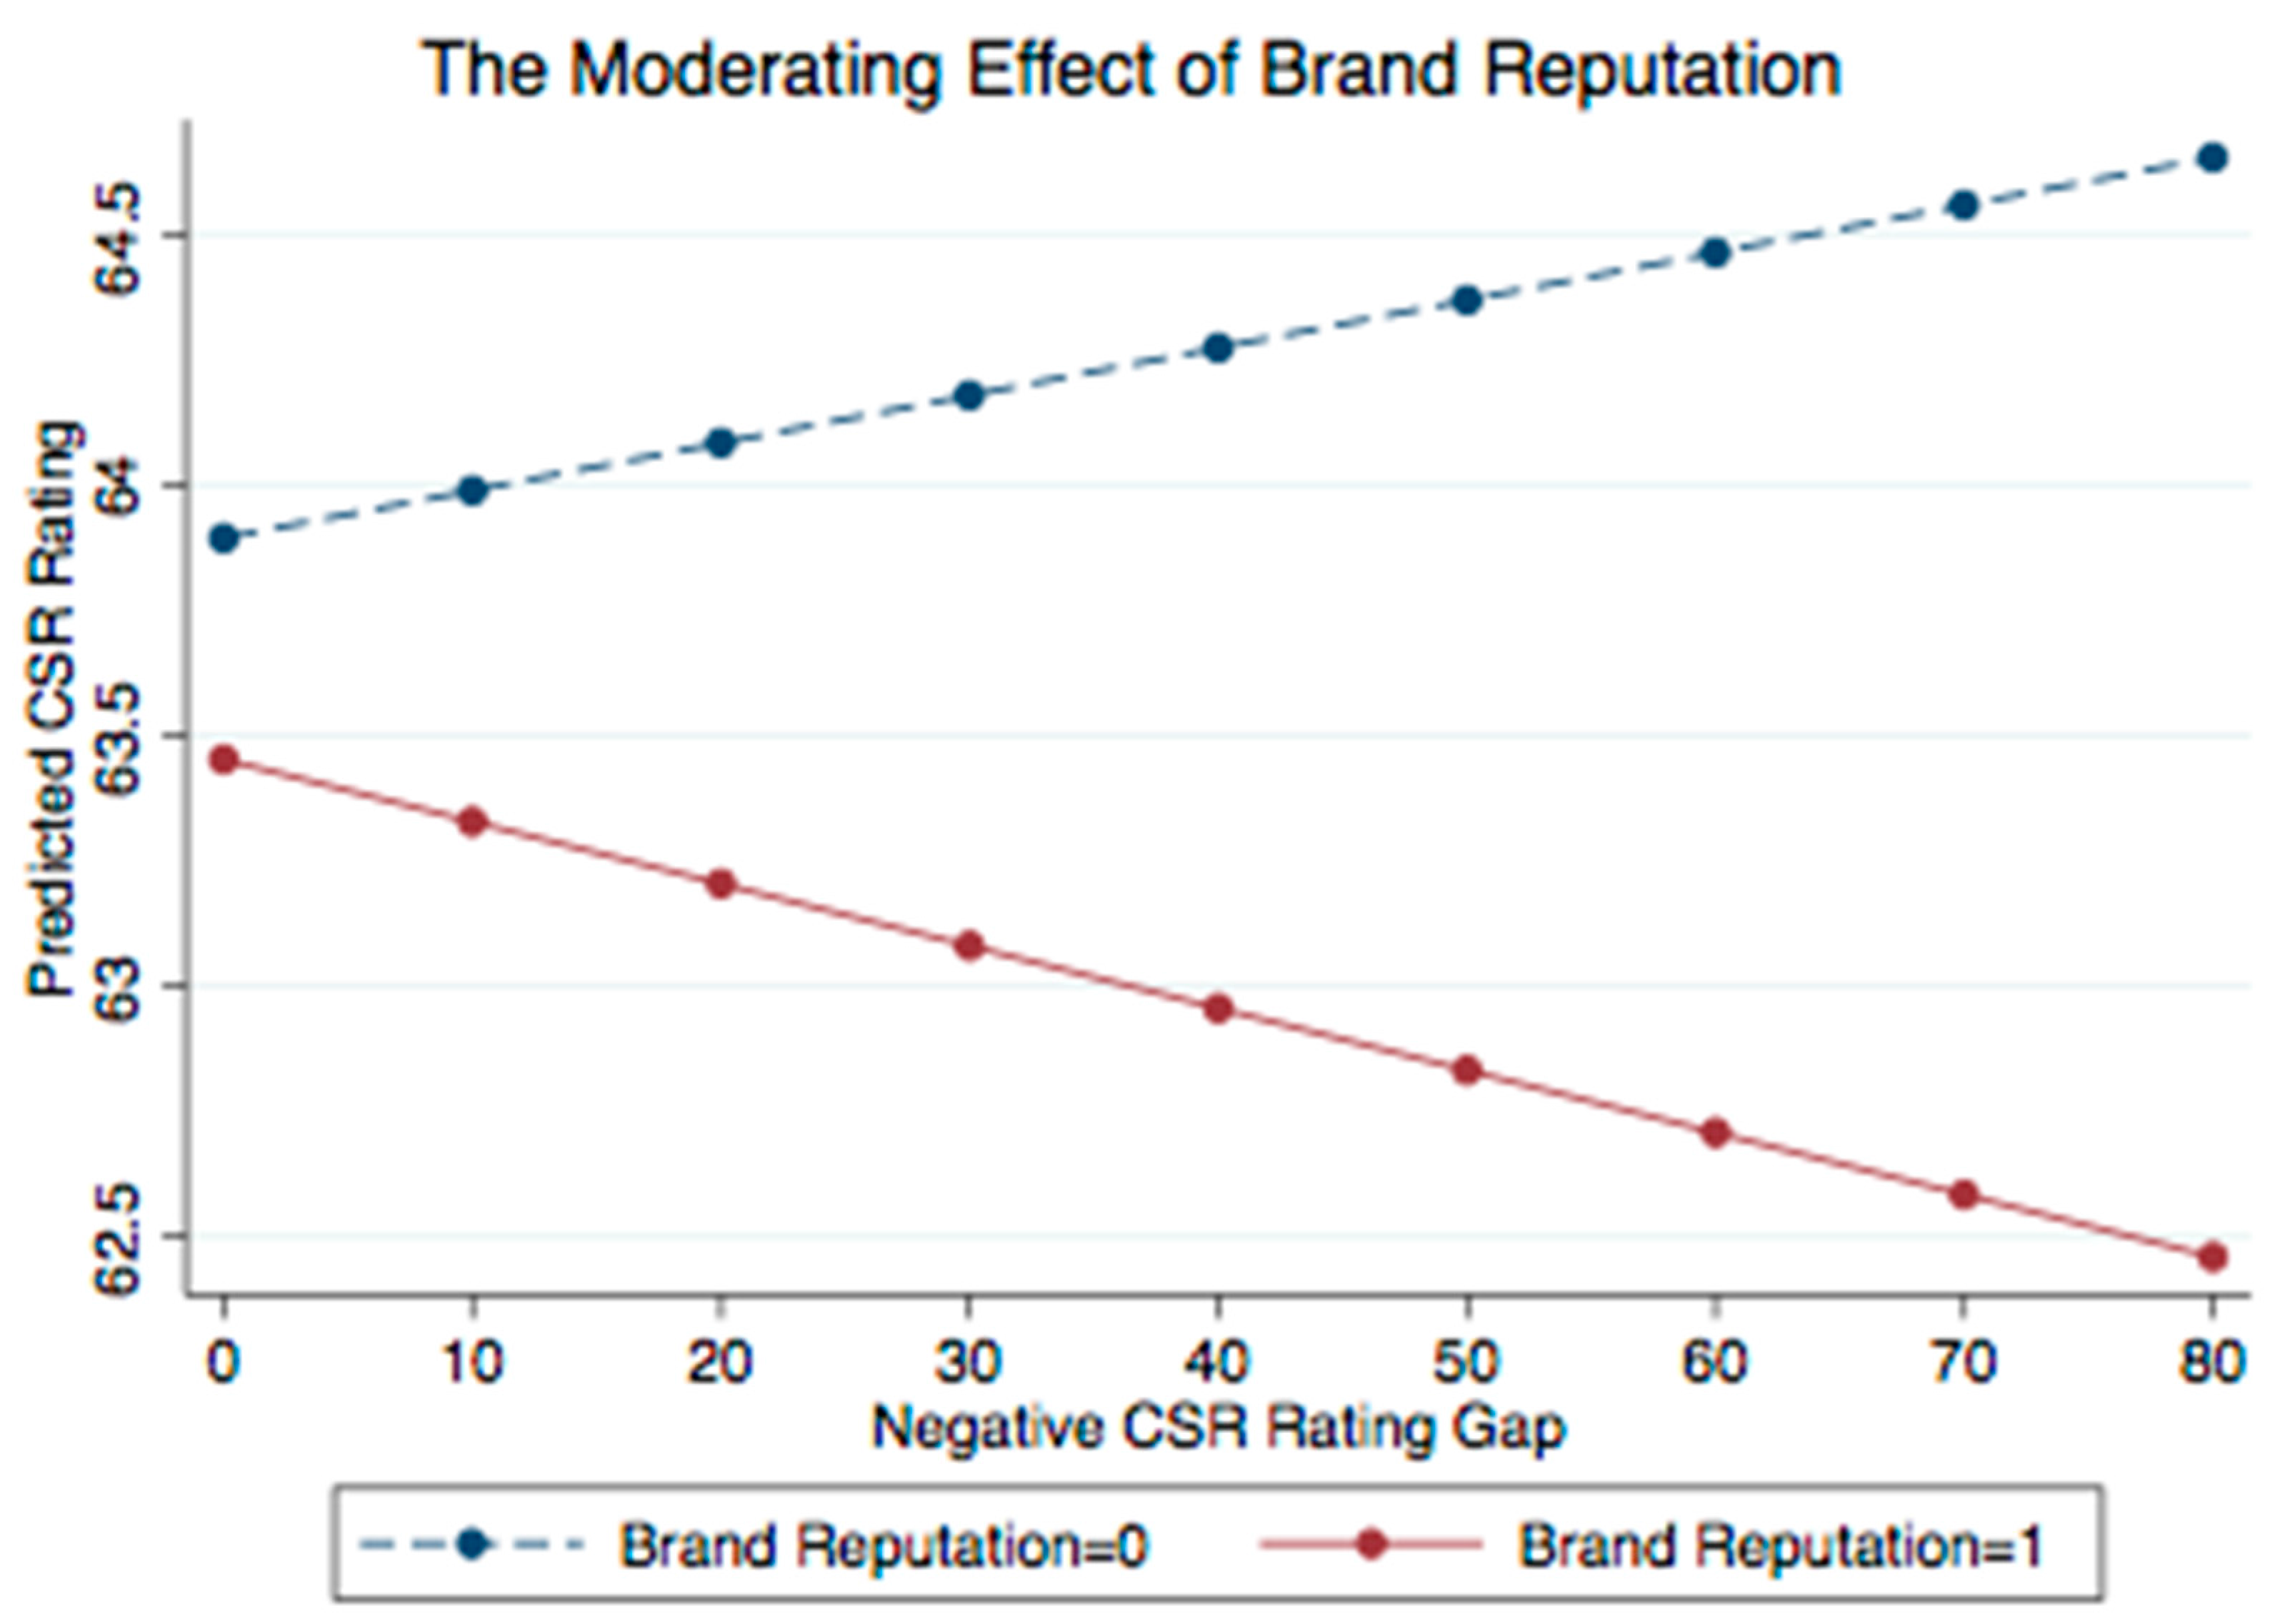
Table 1.
Summary Statistics of Study Sample. CSR: Corporate social responsibility; ROE: Return on equity; R&D: Research & development.
Table 1.
Summary Statistics of Study Sample. CSR: Corporate social responsibility; ROE: Return on equity; R&D: Research & development.
| Variables | Mean | S.D. | Min | Max |
|---|---|---|---|---|
| CSR ratingst | 64.15 | 2.14 | 59.74 | 72.16 |
| Positive CSR rating gapt−1 | 2.98 | 4.46 | 0 | 26.17 |
| Negative CSR rating gapt−1 * | 26.63 | 27.22 | 0 | 67.04 |
| Assetst−1 ** | 20.15 | 1.64 | 16.32 | 26.12 |
| ROEt−1 | 0.11 | 0.13 | −2.09 | 1.04 |
| Tobin’s qt−1 | 1.09 | 0.61 | 0.28 | 6.25 |
| Advertising intensityt−1 | 0.01 | 0.02 | 0 | 0.14 |
| R & D intensityt−1 | 0.01 | 0.02 | 0 | 0.15 |
| Labor intensityt−1 | 0.07 | 0.09 | 0 | 0.65 |
| Intangible assetst−1 ** | 15.55 | 2.53 | 0 | 22.46 |
| Foreign ownershipt−1 | 12.44 | 14.93 | 0 | 89.21 |
| Ownership by largest shareholdert−1 | 3.6 | 0.67 | 1.79 | 4.44 |
| Inside ownershipt−1 | 0.08 | 0.19 | 0 | 1.31 |
| Investment in other firmst−1 | 11.04 | 8.14 | 0 | 23.51 |
*: This variable is reverse-coded; **: These variables are logged due to large skewness; All right-hand side variables are one-year lagged, as indicated by the subscript t−1.
Table 2.
Correlation Coefficients.
| Variables | 1 | 2 | 3 | 4 | 5 | 6 | 7 | 8 | |
| 1 | CSR ratings | 1 | |||||||
| 2 | Positive CSR rating gap | −0.13 | 1 | ||||||
| 3 | Negative CSR rating gap | 0.16 | −0.65 | 1 | |||||
| 4 | Brand reputation | 0.06 | −0.08 | −0.01 | 1 | ||||
| 5 | ROE | 0.05 | −0.08 | 0.1 | 0.1 | 1 | |||
| 6 | Tobin’s q | 0.17 | −0.12 | 0.13 | 0.03 | 0.21 | 1 | ||
| 7 | Assets | 0.22 | −0.08 | −0.03 | 0.45 | 0.13 | 0.11 | 1 | |
| 8 | Advertising intensity | 0.19 | −0.04 | 0.06 | −0.02 | −0.05 | 0.29 | 0.07 | 1 |
| 9 | R & D intensity | 0.18 | −0.03 | 0.13 | 0.01 | −0.01 | 0.24 | −0.01 | 0.24 |
| 10 | Labor intensity | 0.09 | −0.1 | −0.09 | −0.06 | −0.16 | 0.05 | 0.02 | 0.3 |
| 11 | Intangible assets | 0.21 | −0.1 | 0.01 | 0.27 | 0.11 | 0.19 | 0.7 | 0.17 |
| 12 | Foreign ownership | 0.18 | −0.06 | 0.04 | 0.22 | 0.13 | 0.4 | 0.48 | 0.22 |
| 13 | Ownership by largest shareholder | −0.22 | 0.11 | −0.11 | −0.06 | 0.05 | −0.17 | −0.13 | −0.17 |
| 14 | Inside ownership | 0.03 | −0.03 | 0.02 | −0.01 | −0.02 | 0 | −0.08 | 0.12 |
| 15 | Investment in other firms | 0.03 | −0.01 | −0.01 | 0.16 | 0.03 | −0.05 | 0.48 | −0.05 |
| 16 | Inverse Mills ratio | −0.15 | 0.08 | −0.17 | −0.03 | −0.05 | −0.53 | −0.02 | −0.39 |
| Variables | 9 | 10 | 11 | 12 | 13 | 14 | 15 | 16 | |
| 9 | R & D intensity | 1 | |||||||
| 10 | Labor intensity | 0.12 | 1 | ||||||
| 11 | Intangible assets | 0.13 | 0.08 | 1 | |||||
| 12 | Foreign ownership | 0.06 | −0.05 | 0.38 | 1 | ||||
| 13 | Ownership by largest shareholder | −0.08 | −0.16 | −0.18 | −0.01 | 1 | |||
| 14 | Inside ownership | 0.15 | 0.19 | 0.03 | −0.05 | −0.05 | 1 | ||
| 15 | Investment in other firms | −0.01 | −0.13 | 0.38 | 0.19 | 0.02 | −0.06 | 1 | |
| 16 | Inverse Mills ratio | −0.33 | −0.04 | −0.09 | −0.38 | 0.22 | −0.04 | 0.02 | 1 |
Table 3.
Random Effects Regression Models Predicting CSR Ratings of Firms (Test of H1 & H2).
| Variables | Model 1 | Model 2 | Model 3 | Model 4 | Model 5 | Model 6 |
|---|---|---|---|---|---|---|
| OLS (With Industry FE) | OLS (With Industry FE) | OLS (With Industry FE) | OLS (W/o Industry FE) | OLS (W/o Industry FE) | OLS (W/o Industry FE) | |
| Negative CSR rating gap | 0.008 * | 0.009 * | 0.010 ** | 0.012 *** | ||
| (0.004) | (0.004) | (0.003) | (0.004) | |||
| Negative CSR rating gap × brand reputation | −0.022 * | −0.027 * | ||||
| (0.011) | (0.011) | |||||
| Positive CSR rating gap | 0.002 | 0.008 | 0.018 | 0.024 | ||
| (0.022) | (0.022) | (0.021) | (0.021) | |||
| Brand reputation | −1.099 * | −1.096 * | −0.441 | −1.166 * | −1.158 + | −0.326 |
| (0.556) | (0.557) | (0.598) | (0.590) | (0.596) | (0.593) | |
| ROE | 1.177 ** | 0.949 * | 0.929 * | 1.018 * | 0.788 + | 0.757 + |
| (0.408) | (0.389) | (0.388) | (0.417) | (0.410) | (0.409) | |
| Tobin’s q | 0.254 | 0.225 | 0.223 | 0.193 | 0.167 | 0.171 |
| (0.219) | (0.219) | (0.219) | (0.223) | (0.223) | (0.222) | |
| Assets | 0.452 *** | 0.457 *** | 0.454 *** | 0.359 *** | 0.360 *** | 0.365 *** |
| (0.112) | (0.111) | (0.110) | (0.099) | (0.098) | (0.097) | |
| Advertising intensity | 1.101 | 1.839 | 1.907 | 6.809 | 7.236 | 7.160 |
| (7.035) | (6.704) | (6.648) | (6.712) | (6.452) | (6.409) | |
| R & D intensity | 11.426 * | 11.216 * | 11.011 * | 14.441 * | 13.874 * | 13.561 * |
| (5.430) | (5.488) | (5.490) | (5.768) | (5.811) | (5.814) | |
| Labor intensity | 4.340 ** | 4.473 ** | 4.347 ** | 0.263 | 0.555 | 0.662 |
| (1.649) | (1.611) | (1.604) | (1.289) | (1.296) | (1.295) | |
| Intangible assets | −0.050 | −0.051 | −0.053 | −0.049 | −0.046 | −0.051 |
| (0.044) | (0.045) | (0.045) | (0.043) | (0.044) | (0.044) | |
| Foreign ownership | −0.004 | −0.002 | −0.002 | −0.003 | −0.001 | −0.001 |
| (0.006) | (0.006) | (0.006) | (0.007) | (0.007) | (0.007) | |
| Ownership by largest shareholder | −0.807 *** | −0.793 *** | −0.785 *** | −0.801 *** | −0.796 *** | −0.788 *** |
| (0.214) | (0.211) | (0.212) | (0.227) | (0.223) | (0.222) | |
| Inside ownership | 0.019 | −0.018 | −0.000 | 0.069 | 0.021 | 0.039 |
| (0.510) | (0.488) | (0.485) | (0.499) | (0.478) | (0.474) | |
| Investment in other firms | −0.024 * | −0.024 * | −0.023 * | −0.019 | −0.018 | −0.018 |
| (0.012) | (0.011) | (0.011) | (0.012) | (0.011) | (0.011) | |
| Inverse Mills ratio | −0.465 | −0.333 | −0.374 | −0.448 | −0.327 | −0.327 |
| (0.467) | (0.451) | (0.445) | (0.434) | (0.425) | (0.420) | |
| Constant | 58.319 *** | 57.319 *** | 58.129 *** | 61.151 *** | 60.319 *** | 60.688 *** |
| (2.161) | (2.001) | (2.225) | (1.874) | (1.861) | (1.839) | |
| Observations | 628 | 628 | 628 | 628 | 628 | 628 |
| R-squared | 0.351 | 0.367 | 0.370 | 0.315 | 0.321 | 0.328 |
| Log likelihood | −3519 | −3513 | −3509 | −3505 | −3510 | −3509 |
| Hausman test + | 13.12 (0.66) | 13.26 (0.56) | 13.44 (0.71) | 14.21 (0.39) | 15.46 (0.49) | 17.22 (0.44) |
| Number of firms | 278 | 278 | 278 | 278 | 278 | 278 |
| Industry fixed effects (FE) | Yes | Yes | Yes | No | No | No |
| Year FE | Yes | Yes | Yes | Yes | Yes | Yes |
Robust standard errors are in parentheses; *** p < 0.001, ** p < 0.01, * p < 0.05, + p < 0.1; All right-hand side variables are one-year lagged; +: The Hausman test evaluates the null hypothesis that the coefficients estimated by the random effects (RE) estimator are the same as those estimated by the FE estimator. If the test results are insignificant, then a RE model is appropriate and preferred, because it allows for both within and between information to calculate estimates, whereas the FE model allows for only within information to be used.
Table 4.
RE Regression Results (Analyses by Six CSR Elements).
| Variables | Community & Diversity | Consumer Protection | Employee Welfare | Environmental Protection | Corporate Governance | Fair Trade | ||||||
|---|---|---|---|---|---|---|---|---|---|---|---|---|
| Model 7 | Model 8 | Model 9 | Model 10 | Model 11 | Model 12 | Model 13 | Model 14 | Model 15 | Model 16 | Model 17 | Model 18 | |
| Negative CSR rating gap | 0.071 * | 0.088 * | 0.054 * | 0.065 ** | 0.052 * | 0.060 * | 0.074 + | 0.089 * | 0.030 * | 0.038 ** | 0.026 + | 0.031 * |
| (0.035) | (0.036) | (0.024) | (0.025) | (0.025) | (0.026) | (0.043) | (0.045) | (0.012) | (0.013) | (0.015) | (0.016) | |
| Negative CSR rating gap × brand reputation | −0.258 *** | −0.152 * | −0.131 | −0.152 | −0.075 ** | −0.088 + | ||||||
| (0.074) | (0.073) | (0.096) | (0.111) | (0.028) | (0.053) | |||||||
| Other control variables | All | All | All | All | All | All | All | All | All | All | All | All |
| Year FE | Yes | Yes | Yes | Yes | Yes | Yes | Yes | Yes | Yes | Yes | Yes | Yes |
| Industry FE | Yes | Yes | Yes | Yes | Yes | Yes | Yes | Yes | Yes | Yes | Yes | Yes |
| Observations | 628 | 628 | 628 | 628 | 628 | 628 | 628 | 628 | 628 | 628 | 628 | 628 |
| Number of firms | 278 | 278 | 278 | 278 | 278 | 278 | 278 | 278 | 278 | 278 | 278 | 278 |
Robust standard errors are in parentheses; *** p < 0.001, ** p < 0.01, * p < 0.05, + p < 0.1; All right-hand side variables are one-year lagged.
Table 5.
RE Regression Results (Robustness Checks).
| Variables | Model 19 | Model 20 | Model 21 | Model 22 | Model 23 |
|---|---|---|---|---|---|
| Tobit | Tobit | Tobit | Tobit | OLS | |
| Negative CSR rating gap | 0.008 + | 0.009 * | 0.010 * | 0.012 ** | 0.009 * |
| (0.004) | (0.004) | (0.004) | (0.004) | (0.004) | |
| Negative CSR rating gap × brand reputation | −0.022 + | −0.026 * | −0.022 * | ||
| (0.013) | (0.013) | (0.011) | |||
| The number of CSR-rated firms in the industry | 0.009 | ||||
| (0.014) | |||||
| Other control variables | All | All | All | All | All |
| Industry FE | Yes | Yes | Yes | Yes | Yes |
| Year FE | Yes | Yes | Yes | Yes | Yes |
| Observations | 628 | 628 | 628 | 628 | 628 |
| Number of firms | 278 | 278 | 278 | 278 | 278 |
Robust standard errors are in parentheses; ** p < 0.01, * p < 0.05, + p < 0.1; All right-hand side variables are one-year lagged.
© 2017 by the author. Licensee MDPI, Basel, Switzerland. This article is an open access article distributed under the terms and conditions of the Creative Commons Attribution (CC BY) license (http://creativecommons.org/licenses/by/4.0/).
Share and Cite
MDPI and ACS Style
Hyun, E. How Third-Party CSR Evaluation Matters: Keeping Up with Rivals in CSR Performance Ratings of Korean Firms, 2011–2015. Sustainability 2017, 9, 2137. https://doi.org/10.3390/su9112137
AMA Style
Hyun E. How Third-Party CSR Evaluation Matters: Keeping Up with Rivals in CSR Performance Ratings of Korean Firms, 2011–2015. Sustainability. 2017; 9(11):2137. https://doi.org/10.3390/su9112137
Chicago/Turabian StyleHyun, Eunjung. 2017. "How Third-Party CSR Evaluation Matters: Keeping Up with Rivals in CSR Performance Ratings of Korean Firms, 2011–2015" Sustainability 9, no. 11: 2137. https://doi.org/10.3390/su9112137
Note that from the first issue of 2016, this journal uses article numbers instead of page numbers. See further details here.