1. Introduction
Energy is the driving force for economic development. Most of the advances in livelihoods and life quality that we enjoy today can be traced back to the abundant and cheap supply of fossil fuels that humanity has been enjoying over the past century. However, owing to the rising crude oil price and stricter emission standards, the demand for alternative energy sources is growing.
The European Union has committed itself to comply with the Kyoto Protocol on Climate Change and greenhouse gas emission reduction by 2020 through adopting a series of Directives aiming at promoting the use of renewable energy sources (RESs) [
1]. Among the available alternative energy sources that would help to respond to such challenges, biomass crops have many advantages over conventional energy and over some other RESs (e.g., wind and photovoltaic), in particular because of the reduced dependence on short-term weather changes, the promotion of regional economic structures, and the provision of alternative sources of employment in rural areas [
2].
In 2010, Italy adopted the National Action Plan (NAP) for renewable energy sources, which is the implementation of the Directive 2009/28/EC that sets binding targets by 2020. NAP provides that RESs have to meet 17% of final energy consumption and 10% of consumption in transport by 2020. According to NAP, bioenergy will play an important role, having to contribute in the short term with an electricity production of 18,780 GWh (19% overall target of electrical RES in 2020). Concerning the production of thermal energy (heat and cooling), the target is 5.6 million tons of oil equivalent (Mtoe), which correspond to 54% of the total thermal energy of RES. Furthermore, the National Energy Strategy, approved in the spring of 2013, aims at overcoming NAP objectives.
Within this context, the biomass produced on agricultural soils will play an important role, related to short rotation forestry (SRF) [
3,
4]. In order to achieve the plan objectives, convincing farmers of the cost-effectiveness of growing bioenergy crops is necessary since, above all, there are no longer any European aids to promote the energy crop cultivation.
In Italy, especially in the South, the yield SRF values are usually lower than 9 tDM/ha/yr [
5], the minimum value of biomass production making positive the gross margin for SRF cultivation [
6]. Therefore, irrigation and application of fertilizers are necessary to achieve high productivity levels, especially in environments characterized by water deficits, notably in summer [
7]. The use of unconventional water resources is becoming a common practice, encouraged by the European Union [
8], useful to supply water and nutrients to the crops.
Since the reduction of energy consumption and the carbon footprint of wastewater treatment plants (WWTPs) is an increasing concern [
9], the implementation of “vegetation filter systems” in producing energy biomasses and phytoremediation of wastewater with willows (
Salix spp.) and poplars (
Populus spp.) [
10] is a sound alternative to conventional SRF because of their considerable economic and environmental benefits [
10,
11,
12]. Simplified treatment plants produce refined water that can be reused in agroforestry systems to provide nutrients and organic carbon necessary to soil activities and plants growth. By means of suitable modifications on plant operating parameters, which reduce biological activities for nutrients removal, it is possible to recover fertilizer compounds from wastewater for sustainable soil irrigation, minimizing costs and environmental impacts of the wastewater cycle. The biological removal of contaminants occurring in the biological compartment in WWTPs is favored by plants, consequently reducing the amount of dissolved oxygen necessary for the activities of heterotrophic and autotrophic bacteria. Indeed, wastewater supplies water and macronutrients, i.e., nitrogen and phosphorus, to the plants, thus favoring the growth of crops. The plants, characterized by high transpiration rates, are able to refine wastewater treatment by uptaking the dissolved elements, including organic and inorganic micropollutants. Therefore, since the phytoremediation of wastewater does not require an aeration system, the management costs, linked especially to aeration, which is known to be the main contributor to the energy and carbon footprint in WWTPs [
13], decrease. Moreover, a fertigation system reduces the use of drinking water for soil irrigation, as well as the pollution of water reservoirs used for agroforestry needs, contributing to environmental policies towards water saving.
The main objective of this study is the application of a GIS-based spatial analysis model aiming at identifying areas potentially suitable for creating vegetation filter systems with poplars to size a plant of energy production. Through the spatial model, combined with an economic evaluation, it is possible to identify the cost-effectiveness areas for biomass production and calculate the achievable energy from them based on estimated biomass yields. The use of a large-scale analysis model allows us to understand the energy potential of the territory, to achieve the national energy targets and help public and private decision-makers to make targeted investments [
14].
The proposed model, applied to the whole Basilicata region (Southern Italy), is a development of the model proposed by Cozzi et al. [
15], in which nitrate vulnerable zones have been introduced. This is possible thanks to the system, developed by the School of Engineering of the University of Basilicata, for the treatment of urban wastewater. This system, based on a modification of a conventional activated sludge system, allows for the production of water with a varying load of organic carbon, nitrogen, and phosphorus, enabling the adaptation of reclaimed wastewater to the needs of irrigated crops and to the environmental constraints (see [
16] for details on the treatment scheme). Moreover, this non-conventional configuration can contribute to minimize nitrous oxide (N
2O) and carbon oxide (CO
2) emissions during biological nitrogen removal processes (i.e., nitrification, denitrification, and nitrifier denitrification) and organic carbon oxidation processes along the water treatment line, towards a sustainable wastewater cycle.
2. Materials and Methods
2.1. Simplified Treatments for Agricultural Wastewater Reuse
Modified treatment configurations, able to remove pathogens and, at the same time, release nutrients for fertigation of energy crops, allow us to ensure simultaneously the high quality of the treated wastewater and the sustainable irrigation of biomass.
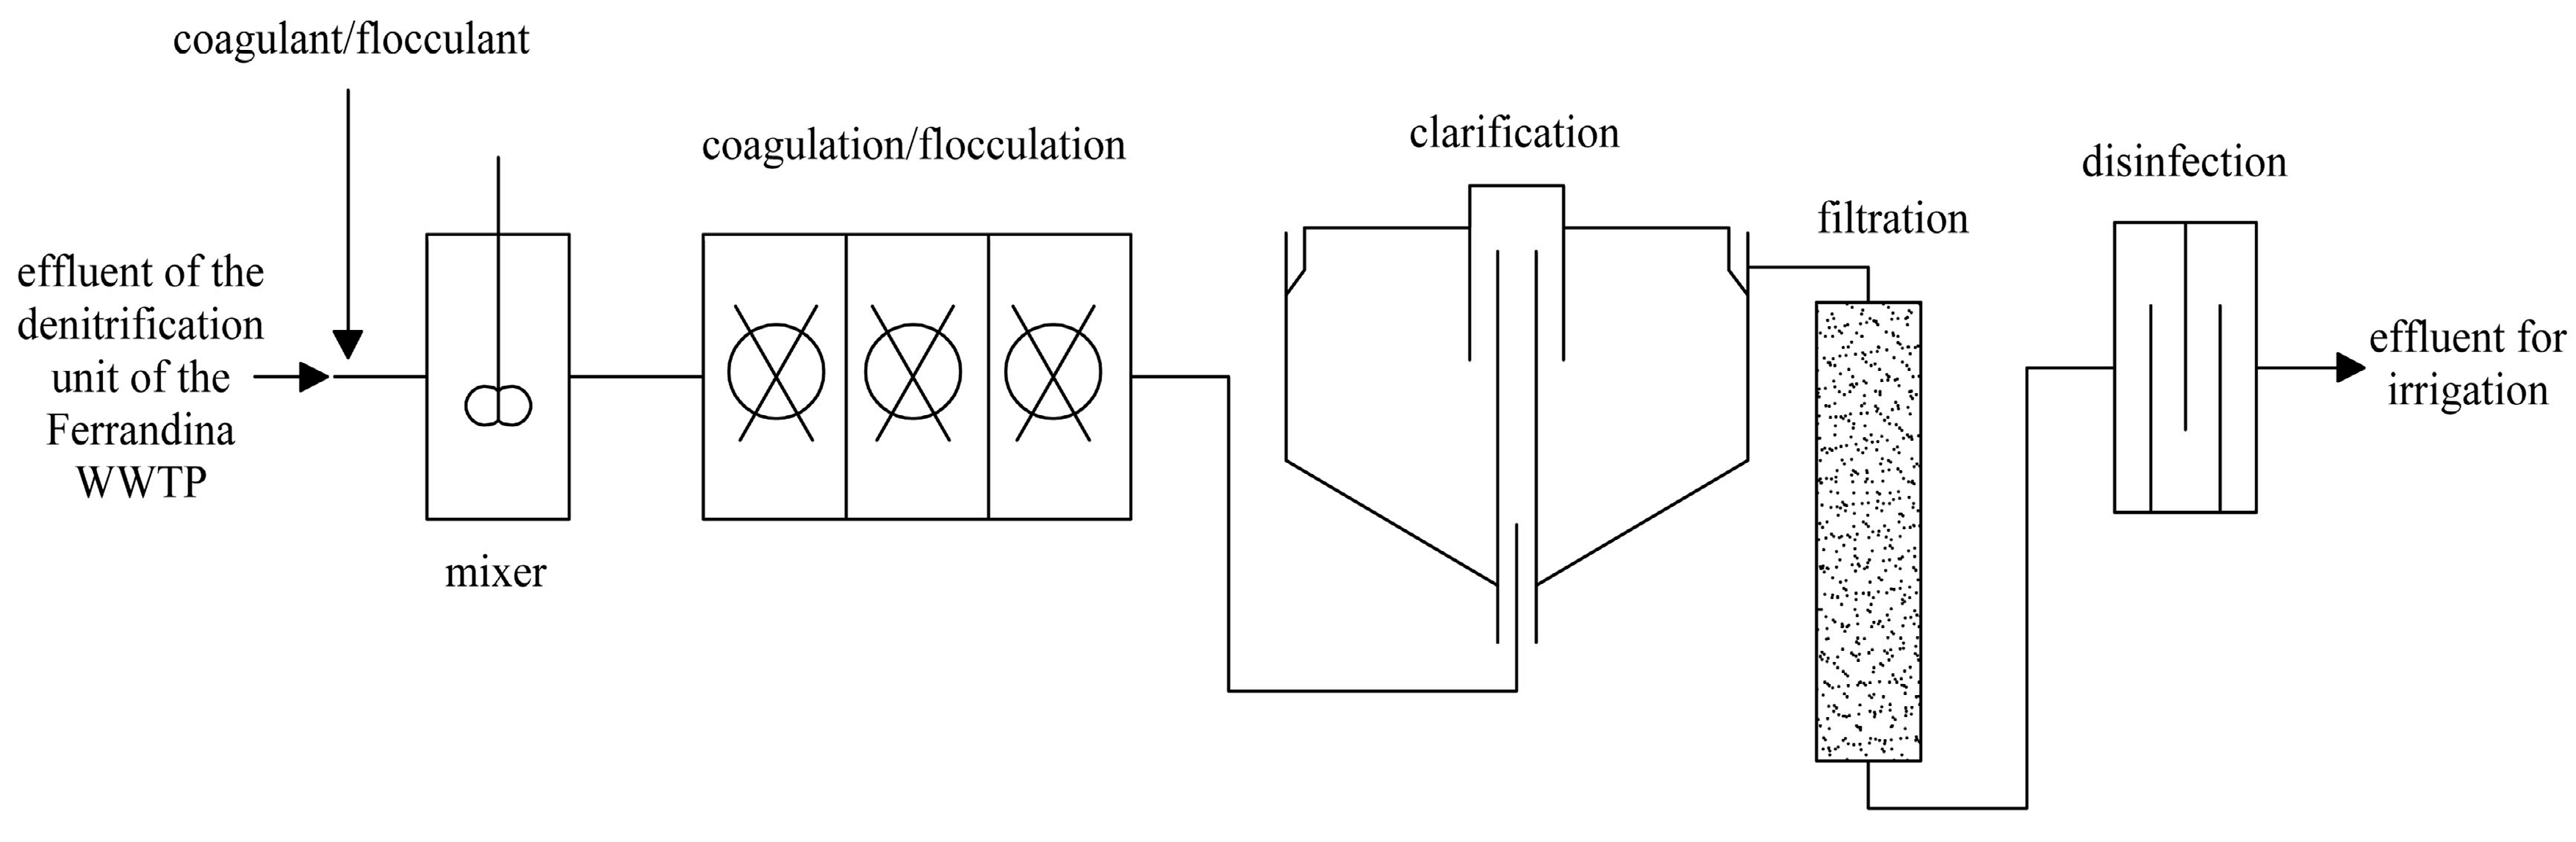
A simplified WWTP was designed by the Sanitary Engineering Research Group of the University of Basilicata (
Figure 1). The pilot plat is fed with the effluent of the denitrification unit of the conventional WWTP of the city of Ferrandina to obtain a refined effluent that is suitable for irrigation.
Indeed, the proposed simplified scheme excludes biological processes for organic matter and nitrogen removal in order to recover and use them as fertilizers. Therefore, the aeration system, designed to supply the amount of oxygen needed for bacteria activities in a conventional activated sludge system, is here excluded from the energy and carbon mass balance, reducing the management and energy costs linked to aeration and the indirect CO2 emissions due to energy consumption. The first pre-treatment unit of the simple scheme is a bottle-holder grate for manual cleaning in which heavy solids are removed from the influent. The coagulation/flocculation step follows, consisting in a dosing, reacting system and a rapid mixer, in which the particle collision and the growth of flocs are favored by chemicals. This unit is followed by clarification to ensure solid separation from the treated wastewater by means of gravity settling.
A hydraulic system allows for sludge extraction from the settler underflow, whereas the clarified effluent enters into the filtration unit consisting in a one-layer sand bed. Since the control of pathogens and fecal compounds (i.e., total coliforms, Fecal coliforms, Escherichia coli, Fecal streptoc, and Salmonella) is fundamental to minimize the health risks linked to wastewater recovery and reuse, the clarified wastewater is treated in the disinfection unit. Finally, the effluent is stored in an underground tank to irrigate crops through a supply pipe.
The simplified scheme was tested on a pilot plant [
17], currently still operating, and employed at the pilot site of Ferrandina (Basilicata region, Southern Italy) to irrigate olive trees. The pilot plant has achieved important results regarding the selective removal of readily biodegradable fractions and the partial removal of nitrogen compounds. The pilot plant characteristics are summarized in
Table 1.
Table 2 lists the average values of main physico-chemical and microbial parameters measured at the effluent of the pilot plant, as also reported in Lopez et al. [
16].
The chemical analyses of the treated wastewater showed that the amount of nutritive elements distributed by irrigation with wastewater treated by the pilot plant in Ferrandina satisfied the plant nutrient requirements [
17]. Moreover, in comparison with rainfed conditions, the treated effluent determines a yield increase of 50%, accelerating the tree growth, as well as improving the characteristics of the olives. Furthermore, the effluent obtained by means of the simple scheme had a microbiological quality not significantly worse than that of conventional secondary effluents also tertiary treated [
17].
2.2. GIS-Based Spatial Model
The spatial model used to locate the supply areas of biomass that is derived from short rotation forestry fertigated with urban wastewater was implemented using a GIS (Geographic Information System) software, as proposed by Cozzi et al. [
15] to which readers are referred for a detailed discussion of the model.
GIS may be defined as a computer-based system that enables users to collect, store, process, analyze, and present spatial data in a coordinate system. GIS models generally return output as derivatives of base maps and can comprise hierarchical trees of data and functions.
In the present study, the input geographic database is made up of a set of maps characterizing the land area, including information concerning the criterion variables useful for the analysis (
Table 3).
The database of wastewater treatment plants consists of an attribute table containing information about each WWTP (identification number, monthly and seasonal flow rates in m
3/d, elevation, spatial coordinates). When necessary, the vector data were converted to raster images for the execution of specific spatial analysis functions (
Table 4).
The land suitability map was obtained using a multi-criteria evaluation (MCE) method addressed to identify lands that are suitable for the SRF cultivation with poplars (as described in
Section 2.2.1). The biomass productivity and the irrigation water requirements were also estimated (as shown in
Section 2.2.2). The former was used to quantify the economic yield resulting from the sale of wood chips and to size the processing plants. The calculation of the IWR was used to assess the irrigation capacity of the WWTPs, which was calculated as the soil area that can be irrigated by the flow rate of each WWTP, given by the ratio between the flow rate (m
3) and the seasonal IWR (m
3/ha). The raster map of the land rent was obtained by using the values per hectare of arable lands, for different agricultural regions. One hectare can be considered the optimal reference unit for this analysis; therefore, we represented the whole area under study through a reference grid resolution of 100 m.
The development of the model followed a logical path, on which basis the raster map of the areas of influence of each WWTP was created. Each area was identified on the map through the distance allocation function and the identification number of the relevant treatment plant was assigned, so that any information collected within each area could be easily associated with it. In this way, the amount of energy produced by each SRF area irrigated by each WWTP was known.
2.2.1. Multi-Criteria Evaluation (MCE) Model
A multi-criteria evaluation model, integrated with GIS, may be conceived as a process that combines and transforms both spatial and non-spatial data (input) in a decision-making result (output), by defining a relationship between input maps and output maps that are influenced by geographical data and decision preferences, which are handled by following specific combination rules [
18,
19]. Among the different MCE methods [
18], the method chosen in this study for the land suitability analysis is the ordered weighted averaging (OWA) operator, combined with relative linguistic quantifiers, as proposed by Romano et al. [
19]. Indeed, a linguistic quantifier can best represent the decision maker’s qualitative information with regard to his or her perception of the relationship among different evaluation criteria, especially when the analysis involves a high number of criterion maps that makes it difficult, or even impossible, to make decisions and establish the most effective methodology.
There are three main input components of the GIS-OWA method: (i) criterion maps (and relative standardization procedures), (ii) criterion weights (and relative procedures for defining preferences regarding the relative importance of criteria), and (iii) order weights (and the relative ORness degree of the OWA operator) [
18].
Therefore, given a set of standardized criterion maps, the method provides the calculation of criterion weights and order weights. The criterion weights are calculated using the analytical hierarchy process (AHP) method, and order weights are determined by the following equation:
where
uk is the weight of the criterion rearranged on the basis of the value of the criterion map (
j), for
j = 1, 2, …,
n, and
α is the parameter associated with the RIM (Regular Increasing Monotone) linguistic quantifier [
19].
In the determination of order weights, it is important to arrange the criterion maps in a decreasing order and to choose the appropriate linguistic quantifier on the basis of the best decision-making preferences.
The criterion maps and the fuzzy functions used in the analysis are reported in
Table 5, while, based on the considerations made by Cozzi et al. [
15], the linguistic quantifier “a few” (with
α = 0.5) was chosen to calculate the ordered weights. The maps value results are shown in
Table 6.
It is noteworthy that the analysis excluded the soils whose land suitability did not allow SRF cultivation, such as artificial areas, permanent crops, wooded areas, wetlands, and water bodies.
To facilitate the understanding of the results achieved using the OWA procedure, the values of the suitability map have been discretized using the Chen–Hwang method [
20]. This method is a sound and well-established tool to convert cardinal values to quality attributes, as it provides the mathematical representation of a linguistic term. Chen and Hwang identified eight scales of linguistic terms. Assuming moderate risk-aversion, according to Scale 2 of this method, we have the unsuitable areas within the 0–0.77 range and the suitable ones within the 0.77–1 range.
2.2.2. Biomass Productivity and Irrigation Water Requirements
Since the main objective of the present work is to calculate the achievable energy from biomass derived from SRF plantation, the biomass productivity (also used in the economic evaluation) was calculated.
The potential production of the annual dry biomass was determined by multiplying the water use efficiency (WUE), expressed in grams of dry biomass per kilo of water lost by evapotranspiration, by the seasonal crop evapotranspiration (
ETc) [
21].
The WUE was determined from the study conducted by Guidi et al. [
22] on vegetation filters in Mediterranean environments and was equal to 2.4 g of dry biomass per kilo of water lost by evapotranspiration for poplars.
The
ETc is given by multiplying the reference crop evapotranspiration (
ET0) and the crop coefficient (
Kc) [
23]. In the case of the vegetation filter,
ETc also represents the maximum amount of wastewater that can be supplied to the plantation, avoiding environmental risks of pollution from nutrient leaching to groundwater [
24].
In the present study, considering SRF with biennal coppicing, the monthly
ETc (mm) was calculated for both growing seasons by means of raster images representing the monthly
ET0 (mm), whereas
Kc values for poplars were derived from the study by Guidi et al. [
22].
Therefore, the raster of two-year productivities expressed in tons of dry matter was obtained considering the biomass produced in two growing seasons.
A thorough analysis of the irrigation water requirements of the crop was also performed to estimate the areas that can be irrigated with the effluent of each WWTP.
IWR is the amount of water that has to be applied in addition to rainfall to serve water requirements of crop. For irrigation planning, it is determined as the difference between
ETc and that part of rainfall that is effectively used by plants (
Pe) [
25], according to Equation (2):
where
fc is the correction factor depending on soil moisture (for the present study, it is assumed to be 1, which is the value in standard soil conditions);
P is the total monthly rainfall (mm).
The monthly Pe (mm) was calculated for both the growing seasons using raster images representing the monthly P (mm) and the monthly ETc already calculated considering SRF with biennial coppicing.
The obtained results are the monthly and seasonal IWR values, calculated for both the growing seasons, converted to cubic meters.
2.3. Energy Production Evaluation
2.3.1. Economic Analysis
In order to size the energy plants for each SRF areas, an economic evaluation was carried out to choose the areas that are cost-effective for the creation of vegetation filter systems.
The economic indicators generally used as a reference point for farmers for alternative investment evaluations in agriculture are the net present value (NPV) and the payback period (PBP) [
15].
Considering a production cycle of 12 years with biennial coppicing, a plant density of 10,000 plants ha
−1, and a discount rate of 4.5% [
15], the economic evaluation involves the determination of all costs and benefits related to the investments.
Economic expenditures can be disaggregated into crop costs and fertigation costs. The former, related to setting up, management, and restoration of the land, are those reported in
Table 7.
The fertigation system costs include the installed water conveyance pipe from the WWTP to the SRF areas (200 €/m), the storage tank (50,000 Euros), as well as the installation and management costs for pumps and filters (50,000 Euros) required for the distribution and pre-treatment of water.
The investment benefits derive mainly from the sale of wood (chips): they have been obtained by multiplying estimated biennial production by the selling price of fresh matter (50% WC) that amounts to 55 €/t at roadside [
26].
In addition, the alternative treatment of wastewater through vegetation filter systems results in an economic advantage for the companies in charge of water treatment. A study conducted in Ireland has demonstrated that this compensation for farmers may amount to 788–2004 GBP/ha year [
27]. In our case study, following estimates carried out after wastewater treatment by the conventional activated sludge process, the amount of compensation is considered to be 0.19 €/m
3 of water used in fertigation [
15].
2.3.2. Processing Plant Dimension
Despite the large number of techniques for the conversion of biomass into energy, processes can be subdivided into two large groups: thermochemical and biochemical processes.
The choice of the process type is the function of the characteristics of the biomass and the final energy use (thermal and/or electric, biofuel, etc.). In our case, being ligno-cellulosic biomass, the analysis concerned the energy comparison among three different types of thermo-chemical plants: thermal, electrical, and cogeneration plants [
14].
Based on the amounts of estimated biomass, the potential processing plant for each WWTP influence area was designed. The power of each plant (
P) was calculated using the following equation:
where energy represents the biomass energy, and time is the average annual operating hours of facilities.
For the calculation of the achievable energy from estimated biomass quantities, the following equation was used:
where
C is the annual available biomass in tons;
coefR is the yield coefficient of thermal (0.80 ter), electrical (0.25 el), and cogeneration plants (0.76 ter and 0.18 el); 2.23 MWh/t is the lower calorific value of poplar wood with a water content (WC) of 45–50%.
In order to estimate the amount of potential energy, 7920 annual operating hours for the production of electrical energy and 4320 running hours (in winter) for thermal power were assumed, respectively. The heat power produced during the rest of the year, through the cogeneration plant, could be used to dry out woodchips or be supplied to the neighboring industrial sites for the particular needs of their production cycle.
3. Results
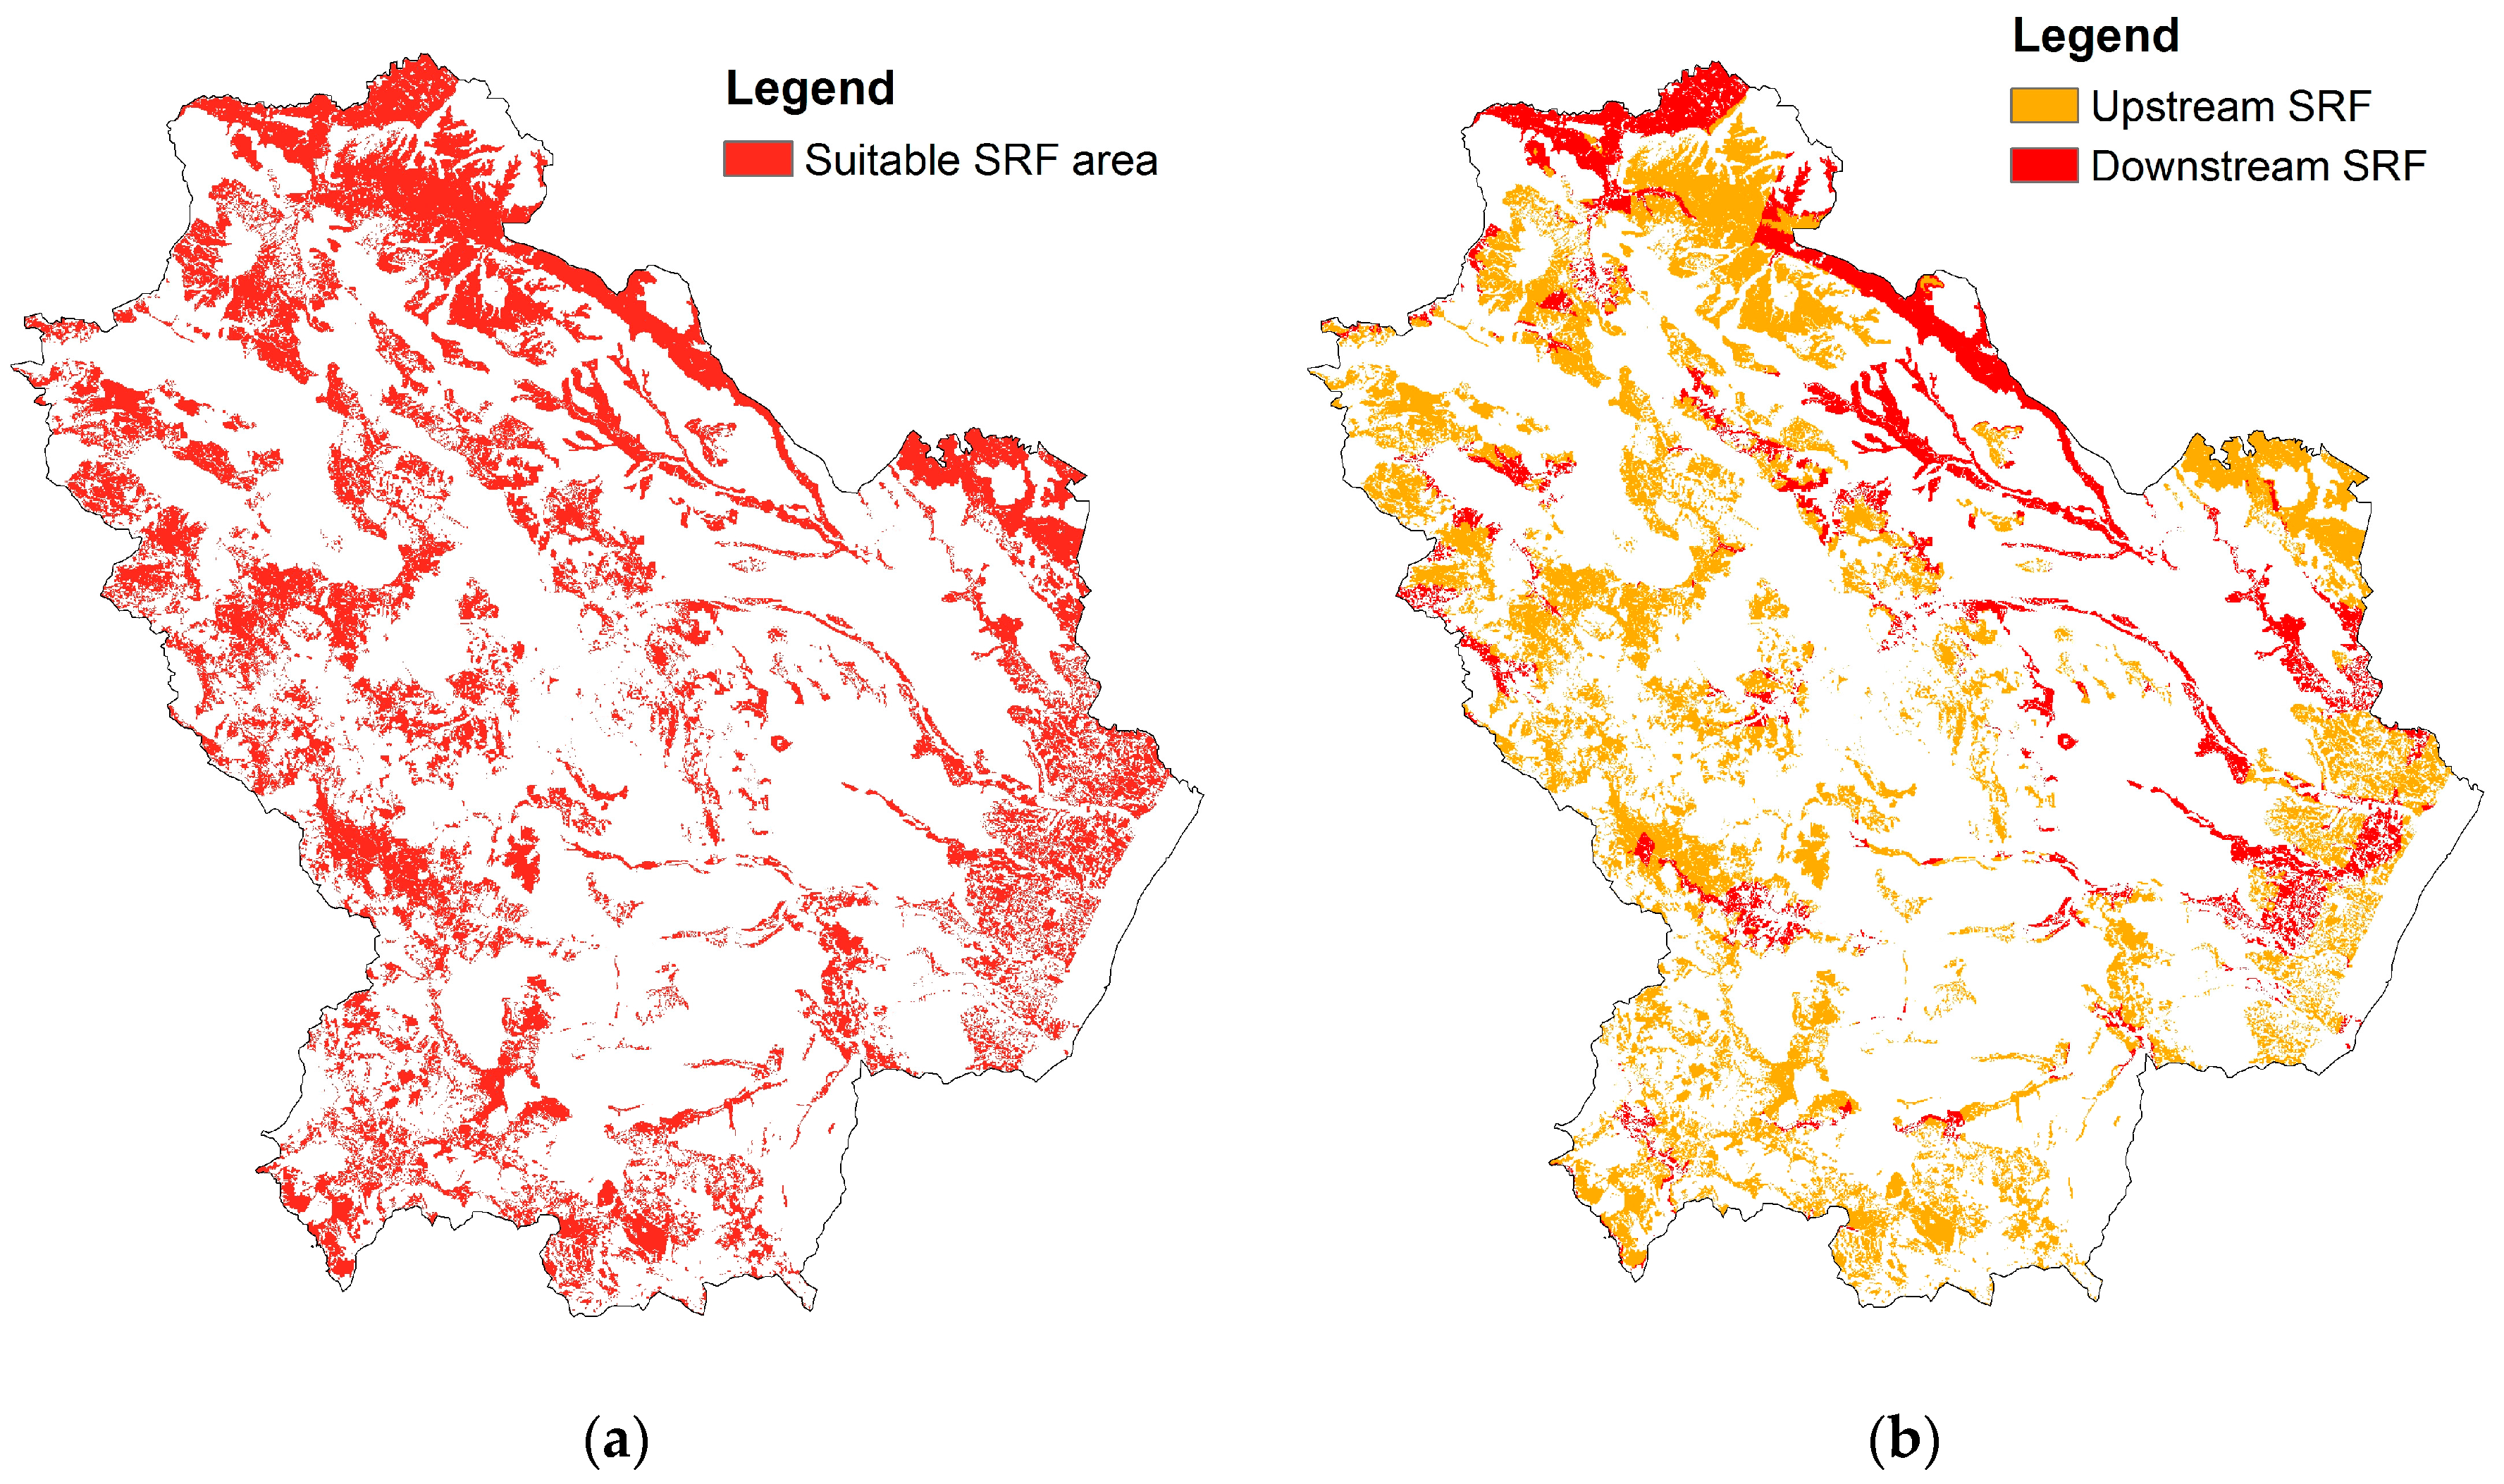
The suitability map of SRF for poplars resulting from the MCE model is shown in
Figure 2a. The possibility of including the nitrate vulnerable zones in the analysis, to identify the areas that can be fertigated by WWTPs present in the region, makes us able to consider all suitable soils with a surface area of 258,512 ha, almost 100,000 ha more compared to the results of Cozzi et al. [
15] (158,884 ha).
Considering only WWTPs with a potential irrigable service area upper than 10 ha, 73,331 ha of SRF soils sited downstream of 45 WWTPs were identified (
Figure 2b).
Based on the final result of the spatial analysis model, which has supplied for each SRF area information on the potential irrigable area of the associated treatment facility, the distance from the SRF area to the facility, and the mean values of biomass productivity, cost-effectiveness indicators were calculated.
Results indicate 156 SRF areas with a positive net present value falling within the areas of 39 WWTPs. The choice of areas in which direct investments should be directed depends both on the NPV and on the need of investors and their willingness to accept a longer payback period of investment in order to have a greater economic benefit [
14,
15]. For our purpose, only the SRF areas with the best economic indicators (highest NPV, lowest PBP) were chosen to size the processing plants with a surface area of 1606 ha (
Table 8).
The results concerning the sizing of the plants on the basis of the available biomass for each area are presented in
Table 9, which shows that the sector of dedicated crops, adjacent and linked with the WWTPs, expresses a total capacity of 50.56 MW for thermal, 8.25 MW for electrical, and 31 MW for cogeneration plants (25.07 MWt and 5.94 MWe). Particularly, the specific capacity ranges from 0.25 to 17.87 MW for the thermal, from 0.04 to 2.91 MW for electrical, and from 0.16 to 10.96 MW for cogeneration plants (from 0.13 to 8.86 MWt and from 0.03 to 2.10 MWe), respectively.
The analyses concerning the achievable energy from biomass derived from SRF plantation, conducted in the Basilicata region, show diversified plant capacities. Beside the achievable power and, consequently, the amount of produced energy (thermal and electrical) with different costs, the choice of the plant type also depends on the plant design and management costs, which are affected by multiple technological solutions available on both international and national levels.
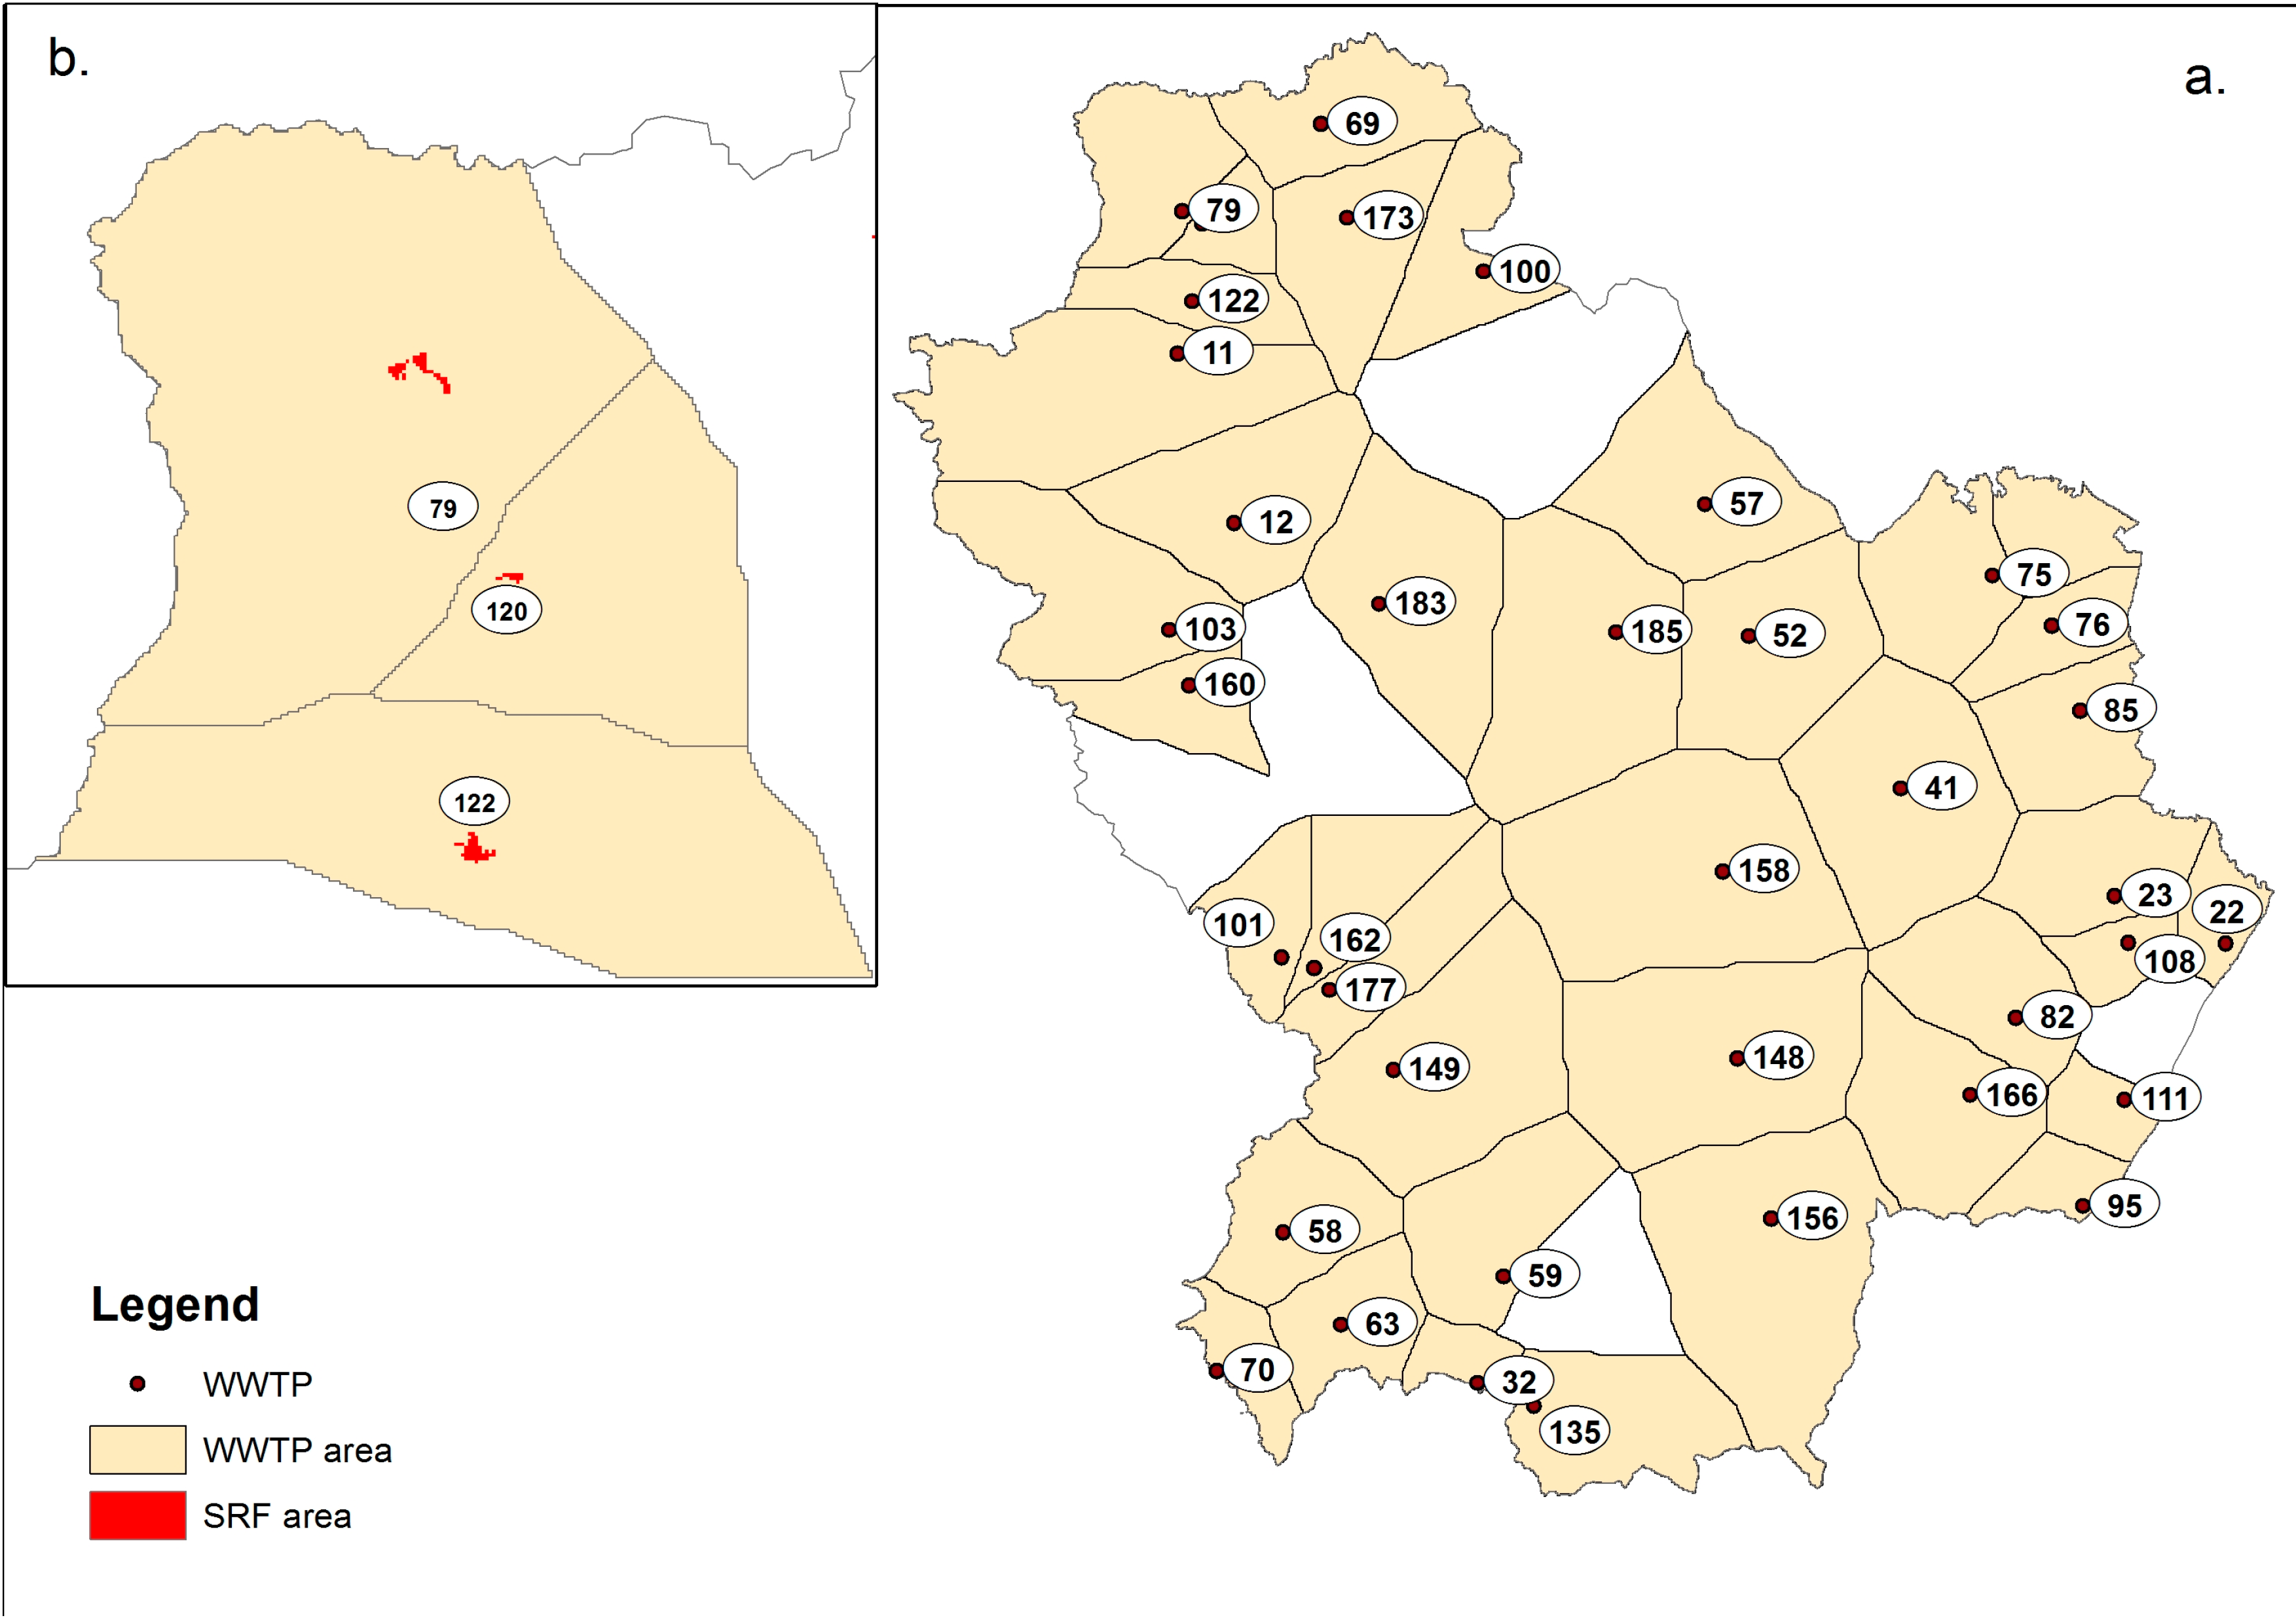
The spatial model (
Figure 3a) shows WWTPs potentially suitable for creating vegetation filter systems. The link between the database and the map allows for the simple identification of SRF areas (
Figure 3b).
4. Conclusions
To avoid the competition between food and fuel crop production, the new Program 2014–2020 does not provide direct incentives to promote the dissemination of dedicated energy crops, in comparison to the last Common Agricultural Policy (2007–2013). Therefore, it might be difficult to reach the objectives concerning energy production from biomass, as suggested by the National Action Plan for Renewable Energy (NAP). Indeed, as suggested by NAP, solid, gaseous, and liquid biomass will cover 44% of the total renewable energy (22.3 Mtep). Thereafter, the management of the forest areas, as well as of urban and agricultural districts, needs to be reconsidered. Urban and rural areas, thanks to their extension and potentiality, could be a good place to produce and store biomass, ensuring a form of crops more similar to agriculture than to forests. Therefore, in order to reach significant production rates, the irrigation and the use of soil improvers are necessary.
Non-conventional waters, such as municipal wastewater, could be a sustainable solution to promote the use of energy crops. The resulting benefits are (1) that wastewater provides water and nutrients, increasing the production rates (economic sustainability in cultivation) and reducing the use of drinking water and fertilizers (environmental sustainability in cultivation); (2) that crops, thanks to their low growth rates, can refine wastewater treatment, reducing organic loads and nutrients (environmental sustainability in wastewater treatment) and, consequently, ensuring lower treatment costs than those of conventional WWTPs (economic sustainability in wastewater treatment).
The findings of the Basilicata region show that the use of treated municipal wastewater is economically advantageous to cultivate up to 1606 ha of SRF of poplars, contributing to achieve the objectives of the NAP with 50 MW for thermal, 8 MW for electrical, and up to 31 MW for cogeneration plants.
Furthermore, thanks to the wastewater pre-treatment system, developed by the research group of the School of Engineering of the University of Basilicata, it is possible to use wastewater in accordance with environmental constraints (e.g., nitrate sensitive areas), contributing to increases in the potentiality of a region. The results, compared with those obtained by Cozzi et al. [
15], show that the surface available for the vegetation filter systems doubles if nitrate sensitive areas can be used.
Finally, the present study proves that the increase in yields due to fertigation with wastewater represents not only an economic advantage but also an increase in energy efficiency.
Indeed, taking into account the yields obtained in conventional SRF system in Southern Italy (6 tDM/ha/yr) [
28,
29], an area 12 times greater than that used in the case of wastewater (i.e., 19,500 ha) is necessary to produce the same amount of energy.
Therefore, besides the economic and environmental advantages, the use of wastewater in energy crops allows for a reduction in land grabbing and competition between food and fuel, which has occurred in recent years because of the unrestrained race towards the increase of renewable energy production, strongly encouraged by international governments.

 ,
, 
