Factors Affecting the Adoption of Gamified Smart Tourism Applications: An Integrative Approach

1
Department of Culture & Tourism Content, Kyung Hee University, Seoul 02447, Korea
2
Department of Journalism and Mass Communication, Sungkyunkwan University, Seoul 03063, Korea
*
Author to whom correspondence should be addressed.
Sustainability 2017, 9(12), 2162; https://doi.org/10.3390/su9122162
Submission received: 31 October 2017
/
Revised: 14 November 2017
/
Accepted: 15 November 2017
/
Published: 23 November 2017
(This article belongs to the Special Issue Mobile Technology and Smart Tourism Development)
Abstract
:Considering that the core concerns in sustainability are threats to the survival of humankind and the ecosystems that humans depend on, changing the consumption and production behaviors of individuals and society is inevitable. However, people are reluctant to change their own behavior in support of sustainability goals. This tendency seems to be especially strong in tourism because the main value of tourism is hedonic utility. Thus, the tourism industry is now introducing gamification and smart tourism to shift tourist behavior toward sustainability, but most of studies and practices only focus on the performance and application of gamification without considering customer adoption patterns and perceptions during the process. This study empirically investigated what factors affect the adoption of smart tourism applications that incorporate game elements, using the Google Maps tourist guide program. As an initial approach, we incorporated diverse theoretical approaches: perceived usefulness; perceived ease of use; perceived enjoyment from technology acceptance model; information and interaction motivations from the uses and gratifications theory; the network effect; distributive justice; flow as responses to the game characteristics of smart tourism applications; and information privacy concerns as a negative factor for diffusion. The result showed that hedonic characteristics of the gamified smart tourism application (GSTA) are strong in adoption. Perceived enjoyment had a significant influence on the intention to use, but information quality, related to cognitive experience, did not. The flow and perceived distributive justice associated with the game content were not significant, but the interaction motivation was significant in the research model. The results of this study show that individuals regard a GSTA as a low-level game tool. Also, it is important to preoccupy the smart tourism application market in terms of marketing strategy because the network effect is relevant to both perceived usefulness and perceived enjoyment. We also found that the need to provide personal information would negatively affect the adoption of a gamified smart tourism application.
1. Introduction
Sustainability in tourism is twofold. On one side, the tourism industry is regarded as one of the most desirable industries for sustainable development and growth. It creates economic profits through the intangible values of a region’s nature and cultures, thereby minimizing damage to nature, and preserving cultural sources of economic value. Also, the economic value created by tourism contributes to the local community, which thus gains the potential to achieve sustainable growth while minimizing its economic, environmental, and social effects and to promote diversity through communication during the value-creation process [1,2]. On the other side, the tourism industry is one of the biggest enemies of sustainability. The movement of people induced by tourism is a direct threat to fragile natural ecosystems. It also causes negative effects on the local community by generating pollution and cultural conflicts, and it reduces diversity through globalization [2,3].
To avoid those problems, governments and various business entities in the tourism industry have made many efforts to promote sustainability. Governments have introduced various policies, incentives, and regulations to reduce pollution and increase environmental protection and social equity. Business entities have also sought sustainable development through resource consumption control, pollution management, effective traffic design, and cooperation with local communities [4].
Considering that the core concerns in sustainability are threats to the survival of humankind and the ecosystems that humans depend on, changing the consumption and production behaviors of individuals and society is inevitable [5,6]. Therefore, various attempts to shift customer behavior toward more sustainable activities continued, using multidisciplinary techniques from psychology, communication, and persuasion [7,8]. The tourism industry also agreed that tourists’ behavior desperately needs to change to achieve sustainability, but most of its attempts toward change have not been successful. Engaging tourists to support sustainability has not seriously been considered [3].
However, getting tourists to participate in sustainability efforts shows strong potential. A survey analysis showed that most tourists are well aware of the environmental and social problems caused by tourism, and they expressed their willingness to engage in eco-friendly activities during their vacations. Unlike their good intentions, only 10% of tourists actually kept their promises by purchasing eco-social components of vacation packages [9]. Most tourists are reluctant to change their own behavior in support of sustainability goals [3]. This tendency seems to be especially strong in tourism because the main value of tourism is hedonic utility [1]. Thus, the tourism industry is now introducing gamification and smart tourism to shift tourist behavior toward sustainability.
The convergence of mobile technology, location information, the Internet of things, sensors, open data, and social networks has directly connected the real world with the virtual world and allows communication between them in real time. Based on that technological background, smart tourism has emerged as a social phenomenon that enhances tourists’ experience through information technology [10,11]. The key objectives of smart tourism are to build new information infrastructure and business ecosystems, create new businesses using those systems, and enhance the experience of tourism by integrating mobile technology innovations into the tourism industry [12,13]. Therefore, the smart tourism ecosystem inherently places a high priority on economic and environmental sustainability [10]. From this perspective, scholars believe that smart tourism can support sustainability by increasing the efficiency of the tourism industry with process automation, creating additional value from tourists through new technologies, enhancing tourists’ understanding of local cultures to reduce cultural conflicts, and reducing environmental damage through movement control supported by information manipulation [1,12].
In this regard, the application of gamification in smart tourism is a natural conclusion from the sustainability perspective. Gamification can be defined as the use of game mechanics in non-game contexts [14]. Due to its strong potential to enhance customer experiences and motivations, gamification has now been applied in various fields, such as education, human resources management, customer relations, sustainability, and tourism [15,16]. In the tourism industry, frequency-based loyalty programs have decreased, and gamification-based loyalty programs are increasing to attract a new generation of customers familiar with virtual worlds [1].
Although gamification has enormous potential to persuade, motivate, and manipulate users [17], applying it without considering how it will be adopted by users can generate serious problems. One well-known example occurred at a Disney land hotel in Anaheim, California. The hotel adopted a gamification tool for its housekeeping department to enhance employee performance. Using the electronic keys that all housekeepers have, the hotel made a leaderboard to monitor the work speed of employees and encouraged employees to compete with one other using that information. However, it generated severe competition among employees. In some cases, employees did not perform their housekeeping work completely, so they could win the competition. The high stress induced by the leaderboard itself became a serious social problem [1,18]. Experts in gamification have long warned that inadequate goals, improperly applied game mechanics, inaccurate expectations, and unethical intentions can create serious problems when adopting gamification. Because of those issues, Gartner forecast that almost 80% of current gamification projects would fail within two years [19,20,21].
Despite such warnings, current gamification studies in sustainability and smart tourism have focused only on the performance and application of gamification without considering customer adoption patterns and perceptions during the process [22,23,24]. Plenty of optimistic speculations suggest that users generously adopt gamification because games are fun, but those beliefs appear to be biased by early adopters who always follow a hedonic buying pattern. Major customers usually make adoption decisions from a pragmatic viewpoint, unlike early adopters [25]. Making industry-wide changes using gamification requires a serious consideration of how gamification will be adopted in major markets.
From that perspective, we here empirically investigate which factors affect the adoption of gamified smart tourism applications. To consider the complex characteristics of gamified smart tourism applications, we incorporate diverse theoretical approaches. First, we review the concept of smart tourism and gamification from the sustainability perspective to investigate tourists’ adoption of gamified smart tourism applications. Second, we review diverse theoretical approaches and draw hypotheses about the adoption of gamified smart tourism applications. Because smart tourism has emerged from information communication technology, this study uses the framework of the technology acceptance model to explain adoption behaviors. The key benefits of smart tourism applications from the tourist perspective are that they provide information and hedonic content during travel. Therefore, we also apply the uses and gratifications theory and theory of consumption value to explain the unique adoption patterns of hedonic goods. To explain the unique characteristics of the application, we incorporate the network effect, distributive justice, and flow theory in our model. An important factor impeding the spread of smart tourism apps, information privacy concerns, is also considered. In the third part, we use an actual case, the Google Maps local guide program, to explain the adoption behaviors of tourists through surveys and structural equation modeling. Finally, we discuss our findings and their implications.
2. Smart Tourism and Gamification
2.1. Smart Tourism
Technology innovation and changes in tourism behavior induced by innovation have created a new social phenomenon, smart tourism, by combining mobile information technology with tourism [11]. Smart tourism can be defined as a mobile information system that uses the physical information infrastructure in a tourism context to create a new kind of experience for tourists. Smart tourism should be understood in a holistic way, combining technology, systems, and management [10,26].
The digital transformation of the tourism industry has not been an instant one, but it has been continuous. The tourism industry rapidly adopted information and communication technology because the core of its business is connecting a wide range of information and intangible values to a physical location [27]. The Internet and e-commerce created the concept of e-tourism, which changed the whole distribution structure and all the communication channels of the tourism industry [28].
In this respect, smart tourism can be misunderstood as an extension of e-tourism. However, smart tourism connects the digital world and the physical world before, during, and after travel to create new value, whereas e-tourism affects those connections only before and after travel [10]. Smart tourism creates its value by combining the ecosystem with technology, infrastructure, and business, so the difference between smart tourism and e-tourism is huge [11,13].
Smart tourism has also attracted attention as an effective tool for sustainable development in the tourism industry. The smart tourism ecosystem inherently places a high priority on economic and environmental sustainability [10,12]. Creating smart destinations through the convergence of physical infrastructure and information and communication technology (ICT) and creating a new business ecosystem based on that new information infrastructure increases efficiency, enhances experience, and ultimately enhances sustainability in tourism [29]. Specifically, location information enables smart tourism to increase the efficiency of resource consumption, reduce traffic jams and tourist waiting times by optimizing travel routes, and support communication between the local community and tourists [1]. The convergence of technology innovation and tourism under the smart tourism concept reduces the negative effects of tourism and increases the positive effects from the sustainability perspective by working as a strategic tool for sustainable development [30].
Despite its potential, skepticism about achieving sustainability through smart tourism is high. The tourism industry structure is far from being sustainable, like most modern industries [4]. Also, tourism business entities have received strong criticism for using sustainability as a buzzword to increase profitability or for efficient public relations [31].
This skepticism can be interpreted using the three different academic perspectives of sustainability in tourism: resource-based tradition, activity-based tradition, and community-based tradition [32,33]. The resource-based tradition is rooted in strong sustainability and focuses on protecting natural resources and the socio-cultural environment from the damage caused by tourism activities and clarifying the limitations and regulations on tourism [34,35]. On the contrary, the activity-based tradition is rooted in weak sustainability and focuses on tourism development to generate sustainable economic growth in the belief that the whole value to be conveyed to the future is more important than the original condition [36,37]. The community-based tradition focuses on finding a balance among the various stakeholders in the tourism industry and emphasizes the coexistence of tourism development and local communities [38,39]. Therefore, meaningful sustainable actions as understood by the activity-based tradition are often undesirable to members of the resource-based and community-based traditions, and vice versa.
In this situation, we focus on the preconditions for sustainability: that individuals and society should change their ways of production and consumption for the survival of humankind in the future [6]. Therefore, we need to pay attention to the ICT that encourages sustainable behavior and consider its applications to sustainable tourism [7]. Previous attempts to encourage sustainable behavior using ICT have been criticized for not using clear measures and failing to provide a meaningful solution for behavioral change [40]. However, the introduction of gamification, optimizing motivation-based experiences through game mechanics, changed the landscape for manipulating sustainable behavior using ICT, moving it from theory to practice [1,16].
2.2. Gamification
The main purpose of games is for players to have fun. As side effects, games motivate people, allow them to maintain high emotional intensity, and allow them to focus on the game for a considerable period of time [14,41]. Based on the expectation that game mechanics will give people enjoyable experiences, motivate them, and ultimately change their behaviors in the world of products and services rather than games, gamification uses game mechanics in a non-game context [14,42]. Thus, game mechanics are a rule-based system that people explore easily to learn about the characteristics of the game spaces with continuous feedback [43].
In the tourism industry, gamification has been adopted to increase brand identity (Foursquare, Brazil Quest Game), enhance tourists’ experiences (REXplorer by Regensburg, Germany), manipulate tourists’ movements (Geocoaching Tripadvisor), increase customer loyalty (Earn your wings by Air Canada), and optimize human resource management (Marriot My Hotel), and this trend is expanding continuously [22,24,44]. Traditionally, the tourism industry has used frequency-based loyalty programs and stamp tours, which are the simplest forms of gamification by which customers gather points and get incentives [16]. Thus, the tourism industry has applied more sophisticated gamification more quickly than other industries because it has been using gamification elements for a long time, just without using the word gamification. The reward system in gamification motivates users and can manipulate behavioral change. For example, it can encourage tourists to perceive the value of sustainability during travel, diversify their travel experiences, and engage in sustainable behaviors [45]. Therefore, gamification is attracting increasing attention as a core tenet of smart tourism from the sustainability perspective [1].
These characteristics of gamification in tourism contribute sustainability in various ways. Negruşa et al. (2015) have analyzed the linkage between gamification in tourism and sustainability, and reviewed the benefits of gamification in tourism for main stakeholders on the three pillars of sustainability: economic, social, and environmental [1]. For tourists, gamified applications in tourism (e.g., SPG mayor program, Ceasars Entertainment, and Starbucks loyalty program) reinforce sustainability in gaining economic value by brand loyalty, increasing visibility of social status in the local communities, and reducing resource consumption by efficient communication and services [16,22]. For tourism organizations and employees, gamified applications in tourism (e.g., MyMarriott Hotel, Costa, and Disneyland) reinforce sustainability in improving productivity and customers’ experience through efficient learning, training, and management, increasing employability by gamified practices and learning, and reducing resources consumption by increased process efficiency [18,22]. Finally, for communities, gamified applications in tourism (e.g., TripAdvisor, Hotel Prinz Luitpld, and Tourism Australia) reinforce sustainability in empowering local business, facilitating networking among local business entities, changing behaviors of local communities and tourists, and increasing awareness of sustainability in the environment perspective [16,17,44].
Negruşa et al. (2015) also found that even the gamified applications only focusing on attracting tourists have visible sustainable features through the content analysis of existing gamified applications in tourism. Therefore, they concluded that gamification could be an interface between tourists, organizations, and local communities to leverage responsible and ethical behaviors for sustainability [1].
Despite the success stories from its various applications, gamification still garners many criticisms and concerns [23]. Gartner forecast that almost 80% of current gamification projects would fail within two years [20] because inadequate goals, improperly applied game mechanics, faulty expectations, and unethical intentions can create serious problems in gamification [19,20,21]. When only external incentives are considered, gamification can become an extremely irrational incentive program because rewards are paid to those who understand game systems rather than those who make meaningful contributions. When only internal motivations are considered, gamification can become an unfair contract that demands output without any payment [46,47]. In proper uses of gamification, the main design axis should move from the provider to the customers. Therefore, understanding how customers perceive and adopt gamification should ensure that its key elements will work as expected.
3. Literature Review and Hypotheses
3.1. Technology Acceptance Model (TAM)
Early adoption studies of ICT assumed that users make the adoption decision based on the perceived costs and benefits of the target tool or technology. Thus, based on theory of reasoned action (TRA), TAM considers two major aspects of accepting information systems, perceived usefulness and perceived ease of use [48].
The basic assumption of TAM is that the decision maker is rational, so TAM has a limited ability to include the emotional or social aspects of hedonic goods. Perceived usefulness cannot explain the adoption of hedonic goods, which do not offer productive utility [49]. This limitation of TAM is not restricted to hedonic goods because enjoyment is not restricted to hedonic goods. Tangible and highly functional products also provide emotional value. Some consumers even say that they are in love with their cars [50]. In the adoption of information systems with excellent technological advances, the enjoyment of experiencing the newest technology is an important adoption factor, along with the functional benefits [51,52].
Thus, various studies have modified TAM to apply to hedonic goods, and those studies can be summarized into two ways. One type of work extends TAM by adding hedonic factors into the original assumptions [53]. This extended TAM considers the relationships among perceived usefulness (PU), perceived ease of use (PEU), and perceived enjoyment (PE), which vary depending on the characteristics of the target goods. For hedonic goods, the explanatory power of enjoyment is higher than that of perceived usefulness [51,52,54]. In some cases, perceived usefulness had no explanatory power [55]. For general consumer goods, which are difficult to divide into hedonic and utilitarian products, enjoyment provided meaningful explanatory power in the adoption decisions of customers [56,57]. In those cases, perceived ease of use remained statistically important as a utilitarian evaluation factor [52,54,58].
The other modification of TAM uses multi-disciplinary theories from fields such as psychology, management, and marketing to analyze the adoption of hedonic goods. Video game adoption studies using TRA or the theory of planned behavior [59] and web activity studies using flow theory [60] fall to this category. One of the most notable theories used to modify TAM to accommodate the hedonic perspective is the theory of consumption value [49]. Previously, hedonic product adoption models based on TAM posited that hedonic factors were related to utilitarian value. However, in the theory of consumption value, hedonic value is considered to be an independent value that is equal to utilitarian value [49,61]. Gamification applications in smart tourism have inherently high utilitarian value during travel and the hedonic value of game mechanics. Thus, we combine TAM and the theory of consumption value to propose the following hypotheses:
Hypothesis 1 (H1).
The perceived usefulness (PU) of the gamified smart tourism applications (GSTA) will positively affect intention to use (IU).
Hypothesis 2-1 (H2-1).
The perceived ease of use (PEU) of GSTA will positively affect IU.
Hypothesis 2-2 (H2-2).
The PEU of GSTA will positively affect their PU.
Hypothesis 3 (H3).
The perceived enjoyment (PE) of GSTA will positively affect IU.
3.2. Information Quality
The effects of product quality on purchasing can be easily understood from a utility maximization perspective. If other conditions are the same, including price, and the quality is relatively higher, the benefit (or utility) that can be obtained from the product becomes larger, and therefore a reasonable consumer chooses the product with better quality. The same logic can be applied to a gamified smart tourism application because it is a product that consumers must decide whether to purchase or use. In the case of the gamified smart tourism application, we focus on information quality because the purpose of the tourism application is to provide information to users.
Previous studies that analyzed websites that function as apps provide direct implications for this study. Website quality can be divided into system quality, service quality, and information quality [62]. System quality describes the performance from an engineering point of view, such as the interface. Service quality relates to operational aspects, such as user complaints, and information quality is related to the quality of information provided by a website. In this study, we focus on information quality, which we define to encompass both the engineering and operational perspectives of previous studies [62]; it is difficult to assess system quality and service quality without actually experiencing an app.
In previous studies that use product quality as a variable, mostly specific theories are not presented. It is intuitively understood that a positive relationship exists between an evaluation that a product is of high quality and its use. However, to construct a precise research model, a theoretical basis for the relationship between quality and use is needed. We use the expected utility theory [63], which is a basic economic theory explaining consumer consumption. According to the expected utility theory, consumers decide whether to purchase an item based on the size of the utility they expect to gain by using it. The main reason that individuals use a gamified smart tourism application is the acquisition of information, and the size of the utility gained through the use of such information can be expected to have a functional relationship with the quality of that information.
Previous studies have suggested that the quality of online services has a statistically significant effect on PE, PEU, and PU, similar to the beliefs consumers have about products. Thus, TAM and the expected utility theory are closely linked. Lederer et al. [64] and Liao et al. [65] demonstrated empirically that the quality of an online service has a statistically significant effect on PU and PEU. Koufaris [66] has shown that the quality of online services can alter affective beliefs, such as PE, as well as cognitive beliefs such as PU and PEU.
Based on that theoretical and empirical discussion, we suggest the following research hypotheses:
Hypothesis 4-1 (H4-1).
The information quality of GSTA will positively affect PU.
Hypothesis 4-2 (H4-2).
The information quality of GSTA will positively affect PEU.
Hypothesis 4-3 (H4-3).
The information quality of GSTA will positively affect PE.
3.3. Uses and Gratifications Theory
It is reasonable to consider a gamified smart tourism application as a kind of medium because it is operated using a smartphone, which is a medium. The uses and gratifications theory is a representative theory explaining the use of media, and it is suitable for this study because it is widely used in the initial diffusion process of specific media. The uses and gratifications theory suggests that individuals choose and use media appropriate to meet their needs. Unlike previous communication theories, which assumed consumers to be the recipients of messages, the uses and gratifications theory suggests that individuals are purpose-oriented and self-aware and choose the most optimal alternative from their given choice set [67]. Uses and gratifications theory has frequently been used to identify individuals’ specific needs when a new medium appears in the market.
Most studies applying the uses and gratifications theory focus primarily on finding and organizing the motivations or needs for using specific media. In addition to traditional media such as TV, newspapers and radio [68], various motivations for using new media such as the Internet [69] and social media [70], have been presented through empirical studies. However, as different motives for using media are presented for each medium, criticism has been leveled in terms of comparing media-use motives and the difficulty of generalizing research results. In response to that criticism, detailed usage motives were grouped into similar items and typified, with Rubin's work (1983) being representative [71]. Rubin distinguished between ritualized motivations and instrumental motivations based on the activity of media users. However, that dichotomy lacks explanatory power for interactive information technology, which strongly demands consumer activity. Hoffman and Novak [72] argued that for ICT, it is more useful to distinguish between utilitarian and hedonic motives.
Utilitarian motivation refers to the use of ICT for information gathering to achieve goals based on rationality, and hedonic motivation refers to the stimulation of the five senses and fun such as chatting and content use [72]. In particular, Cotte et al. [73] argue that in the case of networked IT, hedonic motivation is closely linked to interactions with others. Given that gamified smart tourism applications are inherently network-based ICT, we here seek to distinguish utilitarian motives and hedonic motives. After extracting usage motives by media, many studies have analyzed how those motives affect actual usage or intention to use. Determining which motivations influence media use relatively strongly can provide important knowledge for practitioners. However, the proposition that the extracted usage motives affect actual use needs more theoretical elaboration. Currently, the relationship between motivations and actual or intended use of media is a theoretical assumption of the uses and gratifications theory.
Based on the above discussion, the following research hypotheses are presented.
Hypothesis 5-1 (H5-1).
Utilitarian motivations will positively affect the IU of GSTA.
Hypothesis 5-2 (H5-2).
Hedonic motivations will positively affect the IU of GSTA.
3.4. Flow Theory
Because gamified smart tourism applications actively embrace gaming elements, we consider flow theory, which is frequently used to explain the use of hedonic content such as games. In particular, individuals can experience a high level of emotional arousal in the process of playing games to pursue pleasure. In their analysis of web service usage, Hoffman et al. [72] proposed a seamless sequence of responses facilitated by machine interactivity. They posited that the main properties of flow were intrinsic enjoyment accompanied by a loss of self-consciousness and insisted that the flow experience could affect the continuous use of web services. In this study, we follow several studies in defining flow as a pleasure experienced through concentration [55,74,75,76].
The relationship between flow and PE needs to be clarified because PE has already been applied to our study model in the process of extending TAM. PE or perceived playfulness has been found in several studies to have a significant effect on the use of a service or content with a hedonic character [77,78]. Previous studies have shown that PE is a more comprehensive concept than flow. Flow is primarily defined as a specific experience, whereas PE is defined as an overall affect associated with pleasure (playability) [77]. Therefore, when both flow and PE are put into the research model, it is necessary to define flow narrowly as a specific experience that could affect PE, which could in turn affect IU.
Therefore, we propose the following research hypothesis.
Hypothesis 6 (H6).
Flow will positively affect PE.
3.5. Distributive Justice
One of the key characteristics of gamified applications is that they require huge user involvement compared to other mobile applications [79,80]. For gamified smart tourism applications, the requirement for customer involvement is even heavier because gathering customer reactions and reviews are crucial to enhancing service quality [13,22,81]. However, increasing the demands on customers can feel unfair and cause service failure [82]. From a distributive justice perspective, which is based on social exchange theory, customers judge a situation as acceptable when their cost for an outcome is equivalent to the gain of that outcome [83]. If the cost is higher than the gains, customers will take action to reduce the level of unfairness [84]. Thus, customers will not adopt a gamified smart tourism application if they believe the required involvement is higher than the gains it provides.
Justice and fairness have been extensively studied in various fields [85,86,87,88]. In tourism, studies on justice have focused on human resource management [89], revenue management [82,90], and customer service [91]. Those studies revealed that customers evaluate justice using three pillars: outcomes (distributive justice), procedural fairness (procedural justice), and interaction treatment (interactional justice) [82].
Distributive justice affects customers’ perceived value as they compare reward and expectation. Thus, it is now considered a decision factor for technology adoption [86]. For a gamified mobile application, customers compare their expected experience using the application against the time and effort required by the application. From that perspective, distributive justice is a utilitarian value. However, studies in service failure have reported that perceived justice has a strong relationship with emotions. Increasing the level of distributive justice raises enjoyment, and low perceived justice causes highly negative emotions [88,92].
Thus, we propose the following research hypotheses.
Hypothesis 7-1 (H7-1).
Perceived distributive justice will positively affect PU.
Hypothesis 7-2 (H7-2).
Perceived distributive justice will positively affect PE.
3.6. The Network Effect
The network effect suggests that the value of a product or service increases as its user network increases. Katz and Shapiro (1986) first brought the network effect from traditional networks, such as railroad and telephone networks, to the adoption of new technologies [93]. Since then, the network effect has been recognized as a key factor in consumer adoption of new technologies [94].
Because TAM originally dealt with corporate information systems, the network effect wasn’t added until after TAM expanded to customer goods [95,96]. However, the original TAM reflected the network effect indirectly using social influence factors [97,98]. In the traditional view, social influence is based on TRA [99], but it can also be understood as an indirect network effect for new mobile applications.
Interestingly, the network effect has both utilitarian and hedonic value. From the utilitarian perspective, the installed base of a smart tourism application, which has high technological uncertainty, works as a signal and makes a positive feedback loop for adoption [100]. Also, application performance increases as the installed based grows because the information quality depends on the number of customers [93].
From the hedonic perspective, the installed based is highly related to social relationships. If the people in a customer’s social network use or purchase a certain technology, that customer will probably view the technology positively and might take a positive adoption attitude [55]. The network effect based on social relationships seems to be strong on mobile devices and applications, which are mainly used to maintain social relationships with close friends [56]. Thus, we propose the following hypotheses.
Hypothesis 8-1 (H8-1).
The network effect will positively affect PE.
Hypothesis 8-2 (H8-2).
The network effect will positively affect PU.
3.7. Information Privacy Concerns
Rational individuals take risks, as well as benefits, into consideration when making decisions. Such a benefit-cost analysis is generally conducted internally, and the alternative chosen has the highest benefit-cost ratio among the various alternatives. This logic applies to the decision-making process for using smart tourism applications, just as it does for everything else. In the process of adopting ICT, the fact that personal information can be leaked worries individuals. The gamified smart tourism applications are based on network technology, and the concern about privacy is amplified because they provide information such as user location and tastes to app operators.
In the context of communication privacy management theory, Smith et al. [101] explained information privacy using four concepts: human rights, commodity, a state of limited access, and the ability to control information about oneself. Information privacy is a unique right of human beings. In the market, that information is traded as a commodity with value. Therefore, individuals who want information privacy must be able to control their own information, resulting in limited access. Using ICT carries a cost or risk whenever the infringement of information privacy is a possibility. In particular, Smith et al. [102] classified four types of privacy concerns: information collection, unauthorized access, errors, and secondary use. The fact that privacy concerns affect the decision-making process has been confirmed through several studies, but only a few studies tested that process in the context of ICT adoption. Therefore, it is necessary to put information privacy concerns as an influencing variable into the research model as an exploratory inquiry.
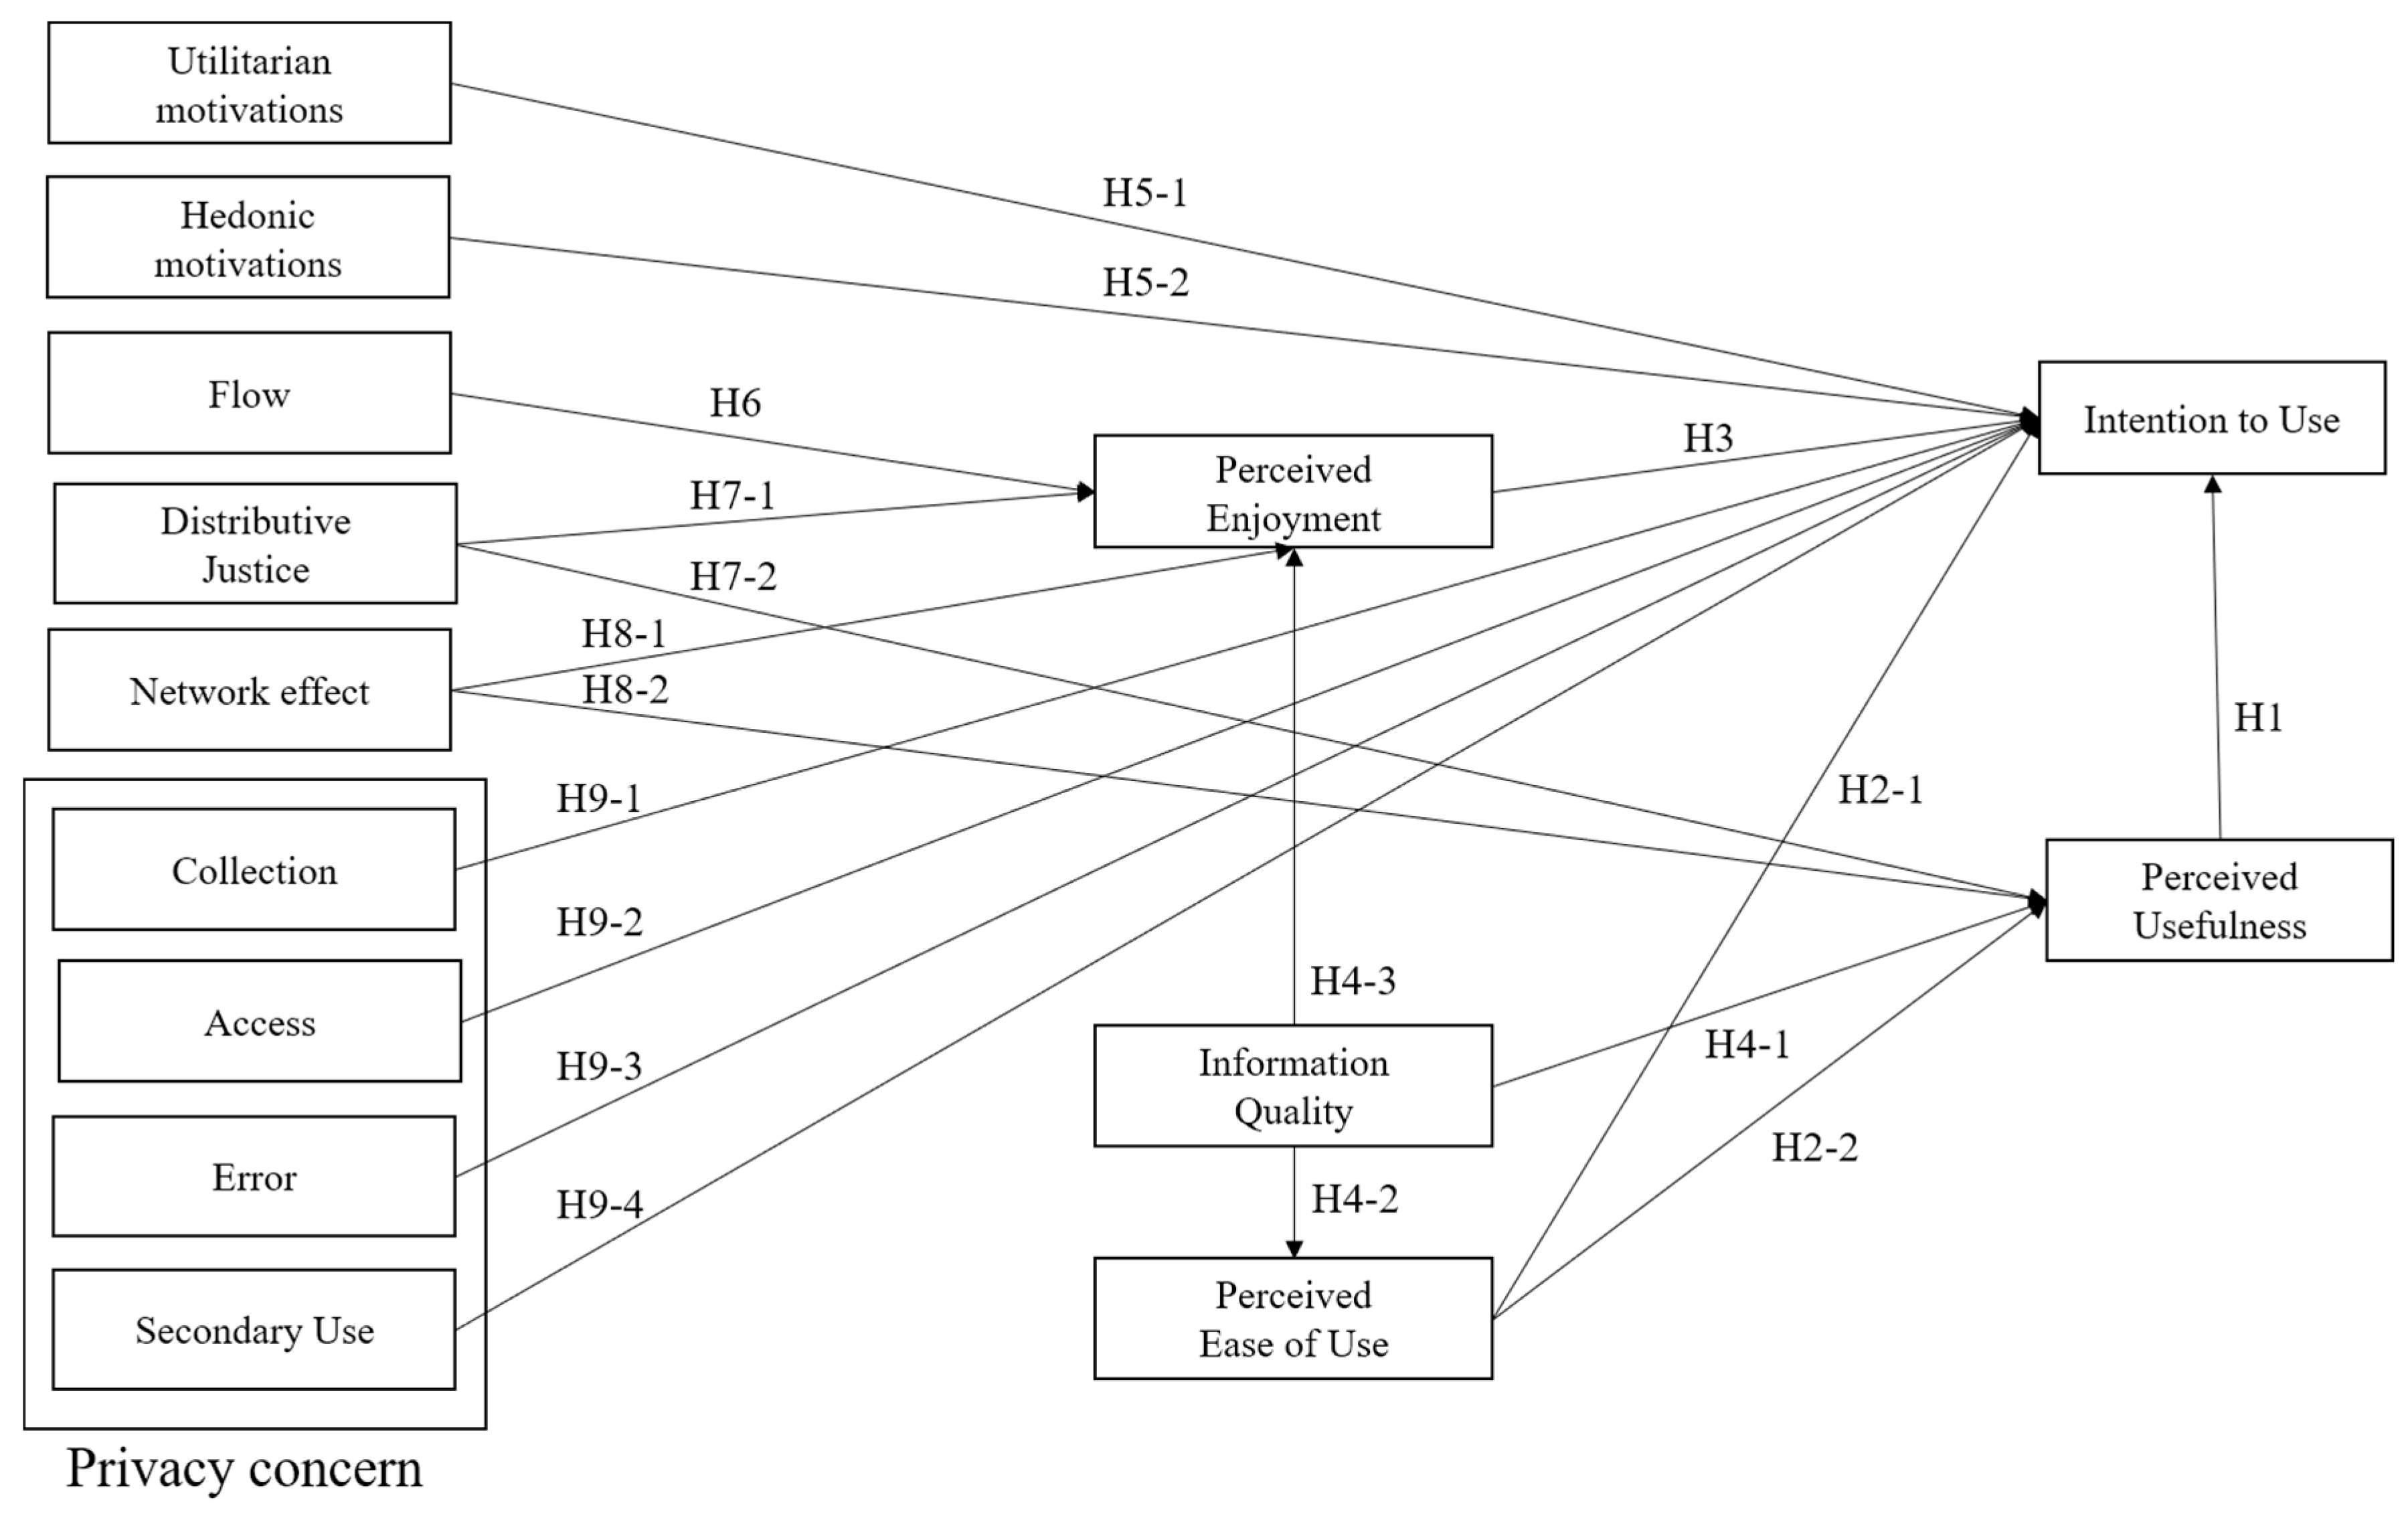
From that discussion, we propose the following research hypotheses and Figure 1 represents the proposed hypotheses of the study.
Hypothesis 9-1 (H9-1).
Privacy concerns about information collection will negatively affect IU.
Hypothesis 9-2 (H9-2).
Privacy concerns about unauthorized access will negatively affect IU.
Hypothesis 9-3 (H9-3).
Privacy concerns about errors will negatively affect IU.
Hypothesis 9-4 (H9-4).
Privacy concerns about secondary use will negatively affect IU.
4. Research Methods
4.1. Sampling Procedure and Sample
Survey data were collected from 315 Korean participants with experience using smartphone applications. To help participants understand smart tourism services, we provided information about Google Maps, an actual local guide application service. Google Maps is a global community in which users can create their own reviews, share photos, participate in Q&A sessions, and add new places. Users also can use that information to plan their tour destination and schedule. All respondents in this study were asked to answer a questionnaire after reading an explanation about how to share information, a compensation system that involved getting points and levels, and so on.
The survey was conducted online for 9 days (9–17 August 2017) by an online survey company, Marcromill Embrain. The quota sampling method was used considering gender and age. As listed in Table 1, 157 (49.8%) of the respondents to the questionnaires were male, and 158 (50.2%) were female. 79 (25.1%) of the respondents were aged 20–29, followed by those aged 30–39 (79, 25.1%), 40–49 (76, 24.1%), and 50–59 (81, 25.7%). The largest proportion of respondents had a university degree (234, 74.3%), followed by a high school diploma (55, 17.5%) and graduate school (26, 8.3%). The monthly household income of almost a third of the respondents was Korean won (₩ 1,000) 20,000–29,999 (27.9%), followed by 10,000–19,999 (17.1%), 30,000–39,999 (17.1%), more than 50,000 (14.0%), 40,000–49,999 (12.4%), and less than 9,999 (11.4%).
4.2. Measurement and Analysis Method
The research model includes the following 14 variables: intention to use, perceived usefulness, perceived ease of use, perceived enjoyment, information quality, motivations, flow, distributive justice, network effect, and privacy concerns (collection, unauthorized access, errors, and secondary use).
This research studied the adoption of a mobile travel application service with gamification. The motivation factors affecting the acceptance of a mobile application were revised based on Rodgers and Sheldon (2002)’s study about Internet motivation and usage [103]. In addition, new items were added by asking 70 participants to give their motivation for using a tourism application with gamification. In the end, we used 20 items for the motivation variable.
To measure the network effect, we used three items from [104]. Distributive justice was measured using three items based on studies of [87,89]. Privacy concern was divided into four sub-variables, collection, unauthorized access, errors, and secondary use. For all sub-variables, we used items from [102]. Collection is defined as a concern that the application system operator will collect the user’s private information, such as location information, in an inappropriate or neglectful way. Unauthorized access is a concern that the operator could permit outside access to private information without the user’s approval. Errors are a concern about the improper management of private information or the provision of incorrect information through a system error. Secondary use is a concern that private information could be shared or sold to third parties without user approval.
Information quality is defined as the degree to which users are aware of the quality of the travel information provided by the application service. The four items for this variable came from online commercial service utilization research [62]. Flow is defined as a perceived immersive experience when using a travel application, and the items used were based on a study by [105]. Perceived enjoyment was measured by three items based on [106]. PEU, PU, and IU were also measured using three items from [106]. All items were measured on a five-point Likert scale in which 1 = strongly disagree and 5 = strongly agree.
5. Results
5.1. Measurement Model
All data were analyzed using structural equation modeling in Amos software. Construct validity and the reliability of the measurement model were assessed based on confirmatory factor analysis. All values of composite reliability and Cronbach’s α were greater than 0.7. The indicator reliability was evaluated based on the criterion that loading should be higher than 0.7 and that every loading below 0.4 should be eliminated [107]. All the loadings were higher than 0.7 and statistically significant at 0.01, confirming good indicator reliability for the instrument (See Table 2). The validity test was analyzed using average variance extracted (AVE), and all constructs were greater than 0.5 [108]. All constructs of the square root of AVE were greater than the correlation between other variables [108]. Discriminant validity was verified (See Table 3).
5.2. Hypothesis Testing
To test research mode, variance-covariance matrix was used. Before verifying the hypotheses, we confirmed the fit of the structural model. As shown in Table 4, all the fitness indices (x2/df = 1.544, NFI = 0.887, TLI = 0.952, CFI = 0.957, RMSEA = 0.042) signaled a good model fit.
The results of the analysis are shown in Table 5. PU (B = 0.494, p < 0.001) had statistically significant effects on IU. Therefore, Hypotheses 1 was supported. PEU (B = 0.201, p < 0.001) had statistically significant effects on PU. Perceived enjoyment influenced on IU significantly (B = 0.335, p < 0.001). The influence of information quality (IQ) was significant on perceived ease of use (PEU) (B = 1.089, p < 0.001), but the relationships between IQ and PU and IQ and PE were not statistically significant. Among the motivation variables, the Utilitarian motivation was not significantly however the Hedonic motivation affected on IU (B = 0.151, p < 0.001). Next, Flow had no effect on IU, therefore hypothesis 6 was rejected. Distributive justice had also no effects in this research model. The network effect influenced PU (B = 0.729, p < 0.001) and PE (B = 1.004, p < 0.001) positively. Among the privacy concern variables, collection (B = −0.191, p < 0.05). Therefore, hypothesis 9 was partially supported.
6. Discussion and Conclusions
Through efficient use of resources, smart tourism is expected to have a positive effect on sustainability. This study empirically investigated what factors affect the adoption of smart tourism applications that incorporate game elements. As an initial approach, we incorporated diverse theoretical approaches: PU, PEU, and PE from TAM; information and interaction motivations from the uses and gratifications theory; the network effect, distributive justice, and flow as responses to the game characteristics of smart tourism applications; and information privacy concerns as a negative factor for diffusion. Data were collected through online surveys and analyzed by structural equation modeling. The analysis confirmed eight of our 18 research hypotheses.
TAM was well applied in this study. PU and PE had statistically significant effects on IU. These results are closely related to the attributes of the gamified smart tourism applications that we set out to analyze in this study. The smart tourism applications offer travelers emotional pleasure (through gaming elements) and cognitive information. They have both utilitarian and hedonic attributes, so the theoretical implication is that the traditional TAM focused only on utilitarianism wouldn’t have enough explanatory power. PEU had a statistically significant effect on PU, but not on the level of use. The theoretical implication is that the influence of PEU is generally limited to PU, and it is difficult to see that it directly affects IU. The results of this study also provide a domain-specific implication that PEU is not important for the gamified smart tourism applications. Given the market situation in Korea, where smartphone apps are routinely used, individuals might not be worried about whether a gamified smart tourism application will be difficult to use. Although PEU has a statistically significant effect on PU (p = 0.042), the significance is low, implying that the influence of PEU is not strong in the context of the gamified smart tourism application.
Based on previous research and expected utility theory, this study predicted that information quality in the gamified smart tourism application would have a significant effect on PU, PEU, and PE, which are key variables in TAM. In the analysis, information quality significantly influenced only PEU; its relationship with the other variables was not significant. These results indicate that users do not expect the level of information quality in the gamified smart tourism application to be high. The results of this study thus raise the need to elaborate the influence of information quality. Information quality did not affect PU, which is a typical utilitarian variable, which implies that the cognitive effect of information quality is limited when alternative information sources are sufficient. It is easy to understand that the relationship between information quality and PE was not significant because the relationship between information quality and PU, which has a stronger theoretical connectivity, was not significant.
One of the interesting findings of this study is that information quality has a significant relationship with PEU. In general, PEU is interpreted in an app context as being easy to operate. However, this result suggests that the ease of using information contributes to how individuals perceive overall ease of use. That is, the quality of information includes the concept that the information can be easily understood and used appropriately. These results provide the theoretical implication that it is necessary to consider ease of use in both functional operation and informational understanding when constructing a research model about informational apps.
The uses and gratifications theory suggests specific motives for certain actions based on motivational theories. It has been frequently used in studies to reveal the specific motives for using media and determining which of those motives is most influential. Media use motives can be categorized as cognitive and emotional. Similarly, this study found both information motivation and interaction motivation because gamified smart tourism applications have the complex function of providing tourism related information in a hedonic gaming format.
An interesting finding of this study is that the information motivation did not have a significant relationship with IU, but the interaction motivation did. Theoretically, this result shows that people think about various motives for using media, but really, only a few motives substantially affect actual behavior. Gamified smart tourism applications are generally thought to be used to collect tourist information and interact with others through games. Interestingly, however, users’ interactive desires could have a greater effect on their use than their information needs. These results can be explained through the concept of expected gratifications in the uses and gratifications theory. Reasonable individuals want to adopt media that allow them to accomplish a specific purpose. Individuals choose the best medium after calculating the degree to which their goals can be achieved and deducing the final utility through those calculations. Given the information-providing capabilities of the gamified smart tourism applications, individuals want to use them to acquire tourist information. However, as discussed earlier, it is unlikely that smart tourism applications will provide differentiated information (that is, achieve a high level of satisfaction) because tourism information can be easily obtained through various other sources. Because of those low expectations, the information motivation may not have a real effect on the use of the gamified smart tourism applications, although that motivation is easily recalled by individuals.
The preceding results suggest that individuals consider enjoyment or gaming factors to be important when using the gamified tourism application. However, we also found that the game attributes that individuals expect from a gamified smart tourism application differ from those they hold for a general game. In this study, we conceptualized flow as a high-level emotional experience felt by an individual in the course of a game, and we conceptualized perceived distributive justice as pertaining to the rules of the game. The results show that flow did not affect PE, and perceived distributive justice did not affect PU or PE. By definition, flow is assumed to produce considerable stimulation while playing, whereas PE is a general hedonic experience, including low-level stimulation. Flow's lack of a meaningful relationship with PE suggests that individuals do not expect high levels of emotional stimulation when using a gamified smart tourism application. Perceived distributive justice is not influential either because individuals do not pursue the gaming attributes of the smart tourism application on a serious level. This result raises theoretical questions about the introduction of flow theory when analyzing media with gaming elements. It is necessary to find new concepts to describe low-level hedonic experience, which is different from flow, because it is unreasonable to expect high emotional stimulation in a game played through a smartphone application.
In this study, we assumed that the network effect would be significant to the PU and PE of a smart tourism application with network-based gaming attributes. Our analysis confirmed that our theoretical logic was appropriate. Flow and perceived distributive justice are difficult to apply to the smartphone interface because they relate to the content attributes of the game. However, because the network is a basic technical characteristic of smartphones, the network effect was confirmed in the context of gamified smart tourism applications. Because the network effect theory is generally described from a utilitarian point of view, it is easy to understand that it affects PU in the context of gamified smart tourism application. However, we found that the network effect can also significantly alter the PE for products such as gamified smart tourism applications, producing strong affective attributes.
Gamified smart tourism applications require a variety of personal information, such as location and preferences, in the process of providing personally relevant information and interacting with other people through network technology. In this study, we found that the need to provide personal information would negatively affect the adoption of a gamified smart tourism application. Information privacy concerns have been classified as collection, unauthorized access, errors, and secondary use. In this study, collection had negative effects on IU. Potential users might be careful when adopting technology in situations in which a provider is collecting personal information over a potentially insecure network. Future research should consider that, when adopting network-based technology, individuals negatively view the collection of their personal information in the name of big data.
The results of this study provide developers, operators, and policy makers with various guidelines for the design and diffusion of gamified smart tourism applications. First, when planning a gamified smart tourism application, pay attention to the hedonic aspects. The present study showed that PE, related to hedonic experience, had a significant influence on IU, but information quality, related to cognitive experience, did not. Second, pay more attention to interactions with other users than to game content and interaction with game elements. The flow and perceived distributive justice associated with the game content were not significant, but the interaction motivation was significant in the research model. The results of this study show that individuals regard a gamified smart tourism application as a low-level game tool. Third, it is important to preoccupy the smart tourism application market in terms of marketing strategy because the network effect is relevant to both PU and PE. Policy makers should notice that the present study indicates a need for appropriate policy intervention to prevent monopolization through market preemption. Fourth, it is necessary to realize that information privacy concerns could hinder the spread of smart tourism. Operators need to investigate and reflect the specific concerns individuals have about their services. Policy agencies need policy frames to ensure information security or pseudonym usage.
This study emphasizes that smart tourism can promote the sustainability of society by inducing the efficient use of tourism resources. With the development of network technology and the smartphone industry, smart tourism is expected to spread naturally through the market. This study provided theoretical implications and practical guidelines to help accelerate this diffusion. However, as with other studies, this research also has some drawbacks. In this study, it is regrettable that the survey was not conducted among actual users because smart tourism is still in the early stage. Therefore, to increase the validity of the survey, it is necessary to apply the same model to actual users through a follow-up study after a certain period of time. In addition, this study was conducted in South Korea, and its results might not be generalizable to other countries. Therefore, it is necessary to compare countries to increase the external validity of the results. In particular, subsequent studies should compare results from different countries to confirm or deny that results differ depending on network technology level, smartphone penetration rate, and cultural characteristics (for example, collectivism versus individualism).
Author Contributions
Changsok Yoo and Byenghee Chang conceived and designed the experiments; Shinhye Kwon and Hyunsoo Na performed the experiments; Changsok Yoo, Shinhye Kwon analyzed the data; Shinhye Kwon and Hyunsoo Na contributed reagents/materials/analysis tools; Changsok Yoo, Byenghee Chang, Shinhye Kwon wrote the paper.
Conflicts of Interest
The authors declare no conflict of interest.
References
- Negruşa, A.L.; Toader, V.; Sofică, A.; Tutunea, M.F.; Rus, R.V. Exploring gamification techniques and applications for sustainable tourism. Sustainability 2015, 7, 11160–11189. [Google Scholar] [CrossRef]
- United Nations Environment Programme (UNEP); World Trade Organization (WTO). Making Tourism more Sustainable: A Guide for Policy Makers; World Tourism Organization Publications: Madrid, Spain, 2005. [Google Scholar]
- Budeanu, A. Sustainable tourist behavior—A discussion of opportunities for change. Int. J. Consum. Stud. 2007, 31, 499–508. [Google Scholar] [CrossRef]
- Buckley, R. Sustainable tourism: Research and reality. Ann. Tour. Res. 2012, 39, 528–546. [Google Scholar] [CrossRef]
- Kuhlman, T.; Farrington, J. What is sustainability? Sustainability 2010, 2, 3436–3448. [Google Scholar] [CrossRef]
- United Nations Environment Programme (UNEP). ABC of SCP: Clarifying Concepts on Sustainable Consumption and Production; UNEP: Nairobi, Kenya, 2010. [Google Scholar]
- Huber, M.Z.; Hilty, L.M. Gamification and sustainable consumption: Overcoming the limitations of persuasive technologies. In ICT Innovations for Sustainability; Springer: Cham, Switzerland, 2015; pp. 367–385. [Google Scholar]
- Silva, F.; Analide, C.; Rosa, L.; Felgueiras, G.; Pimenta, C. Gamification, social networks and sustainable environments. Int. J. Interact. Multimed. Artif. Intell. 2013, 2, 52–59. [Google Scholar] [CrossRef] [Green Version]
- Chafe, Z.; Honey, M. Consumer Demand and Operator Support for Socially and Environmentally Responsible Tourism; Center on Ecotourism and Sustainable Development: Washington, DC, USA, 2005. [Google Scholar]
- Gretzel, U.; Werthner, H.; Koo, C.; Lamsfus, C. Conceptual foundations for understanding smart tourism ecosystems. Comput. Hum. Behav. 2015, 50, 558–563. [Google Scholar] [CrossRef]
- Hunter, W.C.; Chung, N.; Gretzel, U.; Koo, C. Constructivist research in smart tourism. Asia Pac. J. Inform. Syst. 2015, 25, 105–120. [Google Scholar] [CrossRef]
- Buhalis, D.; Amaranggana, A. Smart tourism destinations. In Information and Communication Technologies in Tourism 2014; Springer: Cham, Switzerland, 2014; pp. 553–564. [Google Scholar]
- Gretzel, U.; Sigala, M.; Xiang, Z.; Koo, C. Smart tourism: Foundations and developments. Electron. Mark. 2015, 25, 179–188. [Google Scholar] [CrossRef]
- Deterding, S.; Dixon, D.; Khaled, R.; Nacke, L. From game design elements to gamefulness: Defining gamification. In Proceedings of the 15th International Academic MindTrek Conference: Envisioning Future Media Environments, Tampere, Finland, 28–30 September 2011; ACM: New York, NY, USA, 2011; pp. 9–15. [Google Scholar]
- Caponetto, I.; Earp, J.; Ott, M. Gamification and education: A literature review. In Proceedings of the European Conference on Games Based Learning, Berlin, Germany, 9–10 October 2014; Academic Conferences International Limited: Sonning Common, UK, 2014; p. 50. [Google Scholar]
- Xu, F.; Weber, J.; Buhalis, D. Gamification in tourism. In Information and Communication Technologies in Tourism 2014; Springer: Cham, Switzerland, 2013; pp. 525–537. [Google Scholar]
- Sigala, M. The application and impact of gamification funware on trip planning and experiences: The case of tripadvisor’s funware. Electron. Mark. 2015, 25, 189–209. [Google Scholar] [CrossRef]
- Lopez, S. Disneyland workers answer to ‘electronic whip’. Los Angeles Times, 19 October 2011. [Google Scholar]
- Finley, K. How ‘Gamification’ Can Make Your Customer Service Worse. Available online: https://www.wired.com/2012/11/gamification-customer-service/ (accessed on 14 November 2012).
- Fogel, G. Will 80% of Gamification Projects Fail? Giving Credit to Gartner’s 2012 Gamification Forecast; Gameeffective.com: New York, NY, USA, 2015. [Google Scholar]
- Smalls, M. The Problem with Gamification; Destination CRM.com: New York, NY, USA, 2013. [Google Scholar]
- Bulencea, P.; Egger, R. Gamification in Tourism; Books on Demand: Norderstedt, Germany, 2015. [Google Scholar]
- Schöbel, S.; Söllner, M. How to gamify information systems-adapting gamification to individual user preferences. In Proceedings of the 24th European Conference on Information Systems (ECIS), Istanbul, Turkey, 12–15 June 2016. [Google Scholar]
- Xu, F.; Buhalis, D.; Weber, J. Serious games and the gamification of tourism. Tour. Manag. 2017, 60, 244–256. [Google Scholar] [CrossRef]
- Rogers, E.M. Diffusion of Innovations, 3rd ed.; The Free Press: New York, NY, USA, 1983. [Google Scholar]
- Koo, C.; Yoo, K.-H.; Lee, J.-N.; Zanker, M. Special section on generative smart tourism systems and management: Man–machine interaction. Int. J. Inform. Manag. 2016, 6, 1301–1305. [Google Scholar] [CrossRef]
- Cho, V. World Wide Web resources. Ann. Tour. Res. 1998, 25, 518–521. [Google Scholar] [CrossRef]
- Buhalis, D.; Deimezi, O. E-tourism developments in Greece: Information communication technologies adoption for the strategic management of the Greek tourism industry. Tour. Hosp. Res. 2004, 5, 103–130. [Google Scholar] [CrossRef] [Green Version]
- Gretzel, U.; Koo, C.; Sigala, M.; Xiang, Z. Special issue on smart tourism: Convergence of information technologies, experiences, and theories. Electron. Mark. 2015, 25, 175–177. [Google Scholar] [CrossRef]
- Touray, K.; Jung, T. Exploratory study on contributions of ICTs to sustainable tourism development in Manchester. In Information and Communication Technologies in Tourism 2010; Springer: Vienna, Austria, 2010; pp. 493–505. [Google Scholar]
- Sheldon, P.J.; Park, S.-Y. An exploratory study of corporate social responsibility in the U.S. travel industry. J. Travel Res. 2011, 50, 392–407. [Google Scholar] [CrossRef]
- Saarinen, J. Critical sustainability: Setting the limits to growth and responsibility in tourism. Sustainability 2014, 6, 1–17. [Google Scholar] [CrossRef]
- Saarinen, J. Traditions of sustainability in tourism studies. Ann. Tour. Res. 2006, 33, 1121–1140. [Google Scholar] [CrossRef]
- Buckley, R. Ecological indicators of tourist impacts in parks. J. Ecotour. 2003, 2, 54–66. [Google Scholar] [CrossRef]
- Taylor, J.P. Authenticity and sincerity in tourism. Ann. Tour. Res. 2001, 28, 7–26. [Google Scholar] [CrossRef]
- Burns, P. Paradoxes in planning tourism elitism or brutalism? Ann. Tour. Res. 1999, 26, 329–348. [Google Scholar] [CrossRef]
- Butler, R.W. The concept of a tourist area cycle of evolution: Implications for management of resources. Can. Geogr 1980, 24, 5–12. [Google Scholar] [CrossRef]
- Bryant, R.L.; Wilson, G.A. Rethinking environmental management. Prog. Hum. Geogr. 1998, 22, 321–343. [Google Scholar] [CrossRef]
- Hughes, G. The cultural construction of sustainable tourism. Tour. Manag. 1995, 16, 49–59. [Google Scholar] [CrossRef]
- Brynjarsdottir, H.; Håkansson, M.; Pierce, J.; Baumer, E.; DiSalvo, C.; Sengers, P. Sustainably unpersuaded: How persuasion narrows our vision of sustainability. In Proceedings of the SIGCHI Conference on Human Factors in Computing Systems, Austin, TX, USA, 5–10 May 2012; ACM: New York, NY, USA, 2012; pp. 947–956. [Google Scholar]
- Hamari, J.; Lehdonvirta, V. Game design as marketing: How game mechanics create demand for virtual goods. Int. J. Bus. Sci. Appl. Manag. 2010, 5, 14–29. [Google Scholar]
- Zichermann, G.; Cunningham, C. Gamification by Design: Implementing Game Mechanics in Web and Mobile Apps; O’Reilly Media, Inc.: Sebastopol, CA, USA, 2011. [Google Scholar]
- Sicart, M. Defining game mechanics. Game Stud. 2008, 8, 1–14. [Google Scholar]
- Corrêaa, C.; Kitanoa, C. Gamification in tourism: Analysis of Brazil quest game. In Proceedings of the ENTER, Lugano, Switzerland, 3–6 February 2015. [Google Scholar]
- Kim, S. Interdisciplinary Approaches and Methods for Sustainable Transformation and Innovation; Multidisciplinary Digital Publishing Institute: Basel, Switzerland, 2015. [Google Scholar]
- Shahri, A.; Hosseini, M.; Phalp, K.; Taylor, J.; Ali, R. Towards a code of ethics for gamification at enterprise. PoEM 2014, 197, 235–245. [Google Scholar]
- Nelson, M.J. Soviet and American precursors to the gamification of work. In Proceedings of the 16th International Academic MindTrek Conference, Tampere, Finland, 3–5 October 2012; ACM: New York, NY, USA, 2012; pp. 23–26. [Google Scholar]
- Davis, F.D. Perceived usefulness, perceived ease of use, and user acceptance of information technology. MIS Q. 1989, 13, 319–340. [Google Scholar] [CrossRef]
- Turel, O.; Serenko, A.; Bontis, N. User acceptance of hedonic digital artifacts: A theory of consumption values perspective. Inform. Manag. 2010, 47, 53–59. [Google Scholar] [CrossRef]
- Sheth, J.N.; Newman, B.I.; Gross, B.L. Why we buy what we buy: A theory of consumption values. J. Bus. Res. 1991, 22, 159–170. [Google Scholar] [CrossRef]
- Hong, S.-J.; Tam, K.Y. Understanding the adoption of multipurpose information appliances: The case of mobile data services. Inform. Syst. Res. 2006, 17, 162–179. [Google Scholar] [CrossRef]
- Van der Heijden, H. User acceptance of hedonic information systems. MIS Q. 2004, 28, 695–704. [Google Scholar] [CrossRef]
- Agarwal, R.; Karahanna, E. Time flies when you’re having fun: Cognitive absorption and beliefs about information technology usage. MIS Q. 2000, 24, 665–694. [Google Scholar] [CrossRef]
- Yu, J.; Ha, I.; Choi, M.; Rho, J. Extending the TAM for a t-commerce. Inform. Manag. 2005, 42, 965–976. [Google Scholar] [CrossRef]
- Hsu, C.-L.; Lu, H.-P. Why do people play on-line games? An extended TAM with social influences and flow experience. Inform. Manag. 2004, 41, 853–868. [Google Scholar] [CrossRef]
- Chun, H.; Lee, H.; Kim, D. The integrated model of smartphone adoption: Hedonic and utilitarian value perceptions of smartphones among Korean college students. Cyberpsychol. Behav. Soc. Netw. 2012, 15, 473–479. [Google Scholar] [CrossRef] [PubMed]
- Kim, K.J.; Sundar, S.S. Does screen size matter for smartphones? Utilitarian and hedonic effects of screen size on smartphone adoption. Cyberpsychol. Behav. Soc. Netw. 2014, 17, 466–473. [Google Scholar] [CrossRef] [PubMed]
- Lee, M.K.; Cheung, C.M.; Chen, Z. Acceptance of internet-based learning medium: The role of extrinsic and intrinsic motivation. Inform. Manag. 2005, 42, 1095–1104. [Google Scholar] [CrossRef]
- Lin, C.P.; Bhattacherjee, A. Extending technology usage models to interactive hedonic technologies: A theoretical model and empirical test. Inform. Syst. J. 2010, 20, 163–181. [Google Scholar] [CrossRef]
- Huang, M.H. Flow, enduring, and situational involvement in the Web environment: A tripartite second-order examination. Psychol. Mark. 2006, 23, 383–411. [Google Scholar] [CrossRef]
- Kim, H.-W.; Chan, H.C.; Gupta, S. Value-based adoption of mobile internet: An empirical investigation. Decis. Support Syst. 2007, 43, 111–126. [Google Scholar] [CrossRef]
- Ahn, T.; Ryu, S.; Han, I. The impact of web quality and playfulness on user acceptance of online retailing. Inform. Manag. 2007, 44, 263–275. [Google Scholar] [CrossRef]
- Von Neumann, J.; Morgenstern, O. Theory of Games and Economic Behavior; Princeton University Press: Princeton, NJ, USA, 2007. [Google Scholar]
- Lederer, A.L.; Maupin, D.J.; Sena, M.P.; Zhuang, Y. The technology acceptance model and the World Wide Web. Decis. Support Syst. 2000, 29, 269–282. [Google Scholar] [CrossRef]
- Liao, Z.; Cheung, M.T. Internet-based e-shopping and consumer attitudes: An empirical study. Inform. Manag. 2001, 38, 299–306. [Google Scholar] [CrossRef]
- Koufaris, M. Applying the technology acceptance model and flow theory to online consumer behavior. Inform. Syst. Res. 2002, 13, 205–223. [Google Scholar] [CrossRef]
- Katz, E.; Blumler, J.G.; Gurevitch, M. Utilization of mass communication by the individual. In The Uses of Mass Communications: Current Perspectives on Gratifications Research; Blumler, J.G., Katz, E., Eds.; Sage: Beverly Hills, CA, USA, 1974; pp. 19–32. [Google Scholar]
- Katz, E.; Haas, H.; Gurevitch, M. On the use of the mass media for important things. Am. Social. Rev. 1973, 164–181. [Google Scholar] [CrossRef]
- Stafford, T.F.; Stafford, M.R.; Schkade, L.L. Determining uses and gratifications for the internet. Decis. Sci. 2004, 35, 259–288. [Google Scholar] [CrossRef]
- Leung, L. Generational differences in content generation in social media: The roles of the gratifications sought and of narcissism. Comput. Hum. Behav. 2013, 29, 997–1006. [Google Scholar] [CrossRef]
- Rubin, A.M. Television uses and gratifications: The interactions of viewing patterns and motivations. J. Broadcast. Electron. Media 1983, 27, 37–51. [Google Scholar] [CrossRef]
- Hoffman, D.L.; Novak, T.P. Marketing in hypermedia computer-mediated environments: Conceptual foundations. J. Mark. 1996, 60, 50–68. [Google Scholar] [CrossRef]
- Cotte, J.; Chowdhury, T.G.; Ratneshwar, S.; Ricci, L.M. Pleasure or utility? Time planning style and Web usage behaviors. J. Interact. Mark. 2006, 20, 45–57. [Google Scholar] [CrossRef]
- Ghani, J.A.; Supnick, R.; Rooney, P. The Experience of Flow in Computer-Mediated and in Face-To-Face Groups; ICIS: NewYork, NY, USA, 1991; pp. 229–237. [Google Scholar]
- Ellis, G.D.; Voelkl, J.E.; Morris, C. Measurement and analysis issues with explanation of variance in daily experience using the flow model. J. Leis. Res. 1994, 26, 337. [Google Scholar]
- Webster, J.; Trevino, L.K.; Ryan, L. The dimensionality and correlates of flow in human-computer interactions. Comput. Hum. Behav. 1993, 9, 411–426. [Google Scholar] [CrossRef]
- Davis, F.D.; Bagozzi, R.P.; Warshaw, P.R. Extrinsic and intrinsic motivation to use computers in the workplace. J. Appl. Soc. Psychol. 1992, 22, 1111–1132. [Google Scholar] [CrossRef]
- Moon, J.-W.; Kim, Y.-G. Extending the TAM for a World-Wide-Web context. Inform. Manag. 2001, 38, 217–230. [Google Scholar] [CrossRef]
- Deterding, S.; Björk, S.L.; Nacke, L.E.; Dixon, D.; Lawley, E. Designing gamification: Creating gameful and playful experiences. In Proceedings of the CHI’13 Extended Abstracts on Human Factors in Computing Systems, Paris, France, 27 April–2 May 2013; ACM: New York, NY, USA, 2013; pp. 3263–3266. [Google Scholar]
- Hamari, J. Transforming homo economicus into homo ludens: A field experiment on gamification in a utilitarian peer-to-peer trading service. Electron. Commer. Res. Appl. 2013, 12, 236–245. [Google Scholar] [CrossRef]
- Xu, F.; Tian, F.; Buhalis, D.; Weber, J.; Zhang, H. Tourists as mobile gamers: Gamification for tourism marketing. J. Travel Tour. Mark. 2016, 33, 1124–1142. [Google Scholar] [CrossRef]
- Choi, S.; Mattila, A.S. Hotel revenue management and its impact on customers’ perceptions of fairness. J. Revenue Pricing Manag. 2004, 2, 303–314. [Google Scholar] [CrossRef]
- DeConinck, J.B. The effect of organizational justice, perceived organizational support, and perceived supervisor support on marketing employees’ level of trust. J. Bus. Res. 2010, 63, 1349–1355. [Google Scholar] [CrossRef]
- Kuo, Y.-F.; Wu, C.-M. Satisfaction and post-purchase intentions with service recovery of online shopping websites: Perspectives on perceived justice and emotions. Int. J. Inform. Manag. 2012, 32, 127–138. [Google Scholar] [CrossRef]
- Blodgett, J.G.; Hill, D.J.; Tax, S.S. The effects of distributive, procedural, and interactional justice on postcomplaint behavior. J. Retail. 1997, 73, 185–210. [Google Scholar] [CrossRef]
- Mitchell, J.I.; Gagné, M.; Beaudry, A.; Dyer, L. The role of perceived organizational support, distributive justice and motivation in reactions to new information technology. Comput. Hum. Behav. 2012, 28, 729–738. [Google Scholar] [CrossRef]
- Moorman, R.H. Relationship between organizational justice and organizational citizenship behaviors: Do fairness perceptions influence employee citizenship? J. Appl. Psychol. 1991, 76, 845. [Google Scholar] [CrossRef]
- Williams, S. The effects of distributive and procedural justice on performance. J. Psychol. 1999, 133, 183–193. [Google Scholar] [CrossRef]
- Hemdi, M.A.; Nasurdin, A.M. Investigating the influence of organizational justice on hotel employees’ organizational citizenship behavior intentions and turnover intentions. J. Hum. Resour. Hosp. Tour. 2007, 7, 1–23. [Google Scholar] [CrossRef]
- McMahon-Beattie, U. Trust, fairness and justice in revenue management: Creating value for the consumer. J. Revenue Pricing Manag. 2011, 10, 44–46. [Google Scholar] [CrossRef]
- Chang, H.-S.; Hsiao, H.-L. Examining the casual relationship among service recovery, perceived justice, perceived risk, and customer value in the hotel industry. Serv. Ind. J. 2008, 28, 513–528. [Google Scholar] [CrossRef]
- Schoefer, K.; Ennew, C. The impact of perceived justice on consumers’ emotional responses to service complaint experiences. J. Serv. Mark. 2005, 19, 261–270. [Google Scholar] [CrossRef]
- Katz, M.L.; Shapiro, C. Technology adoption in the presence of network externalities. J. Political Econ. 1986, 94, 822–841. [Google Scholar] [CrossRef]
- Gretz, R.T.; Basuroy, S. Why quality may not always win: The impact of product generation life cycles on quality and network effects in high-tech markets. J. Retail. 2013, 89, 281–300. [Google Scholar] [CrossRef]
- Beck, R.; Beimborn, D.; Weitzel, T.; König, W. Network effects as drivers of individual technology adoption: Analyzing adoption and diffusion of mobile communication services. Inform. Syst. Front. 2008, 10, 415–429. [Google Scholar] [CrossRef]
- Dickinger, A.; Arami, M.; Meyer, D. The role of perceived enjoyment and social norm in the adoption of technology with network externalities. Eur. J. Inform. Syst. 2008, 17, 4–11. [Google Scholar] [CrossRef]
- Venkatesh, V.; Morris, M.G.; Davis, G.B.; Davis, F.D. User acceptance of information technology: Toward a unified view. MIS Q. 2003, 27, 425–478. [Google Scholar] [CrossRef]
- Ajzen, I. The theory of planned behavior. Organ. Behav. Hum. Decis. Process. 1991, 50, 179–211. [Google Scholar] [CrossRef]
- Fishbein, M.; Ajzen, I. Belief, Attitude, Intention, and Behavior: An Introduction to Theory and Research; Addison-Wesley: Reading, MA, USA, 1977. [Google Scholar]
- Arthur, W.B. Increasing returns and the new world of business. Harv. Bus. Rev. 1996, 74, 100–109. [Google Scholar] [PubMed]
- Smith, H.J.; Dinev, T.; Xu, H. Information privacy research: An interdisciplinary review. MIS Q. 2011, 35, 989–1016. [Google Scholar] [CrossRef]
- Smith, H.J.; Milberg, S.J.; Burke, S.J. Information privacy: Measuring individuals’ concerns about organizational practices. MIS Q. 1996, 20, 167–196. [Google Scholar] [CrossRef]
- Rodgers, S.; Sheldon, K.M. An improved way to characterize internet users. J. Advert. Res. 2002, 42, 85–94. [Google Scholar] [CrossRef]
- Zhu, K.; Kraemer, K.L.; Gurbaxani, V.; Xu, S.X. Migration to open-standard interorganizational systems: Network effects, switching costs, and path dependency. MIS Q. 2006, 30, 515–539. [Google Scholar] [CrossRef]
- Novak, T.P.; Hoffman, D.L.; Duhachek, A. The influence of goal-directed and experiential activities on online flow experiences. J. Consum. Psychol. 2003, 13, 3–16. [Google Scholar]
- Chung, N.; Koo, C. The use of social media in travel information search. Telemat. Inform. 2015, 32, 215–229. [Google Scholar] [CrossRef]
- Churchill, G.A., Jr. A paradigm for developing better measures of marketing constructs. J. Mark. Res. 1979, 16, 64–73. [Google Scholar] [CrossRef]
- Fornell, C.; Larcker, D.F. Structural equation models with unobservable variables and measurement error: Algebra and statistics. J. Mark. Res. 1981, 18, 382–388. [Google Scholar] [CrossRef]
Figure 1.
Research model.


Table 1.
Demographic information for the sample.
| Characteristics | Frequency | % | |
|---|---|---|---|
| Gender | Male | 157 | 49.8 |
| Female | 158 | 50.2 | |
| Age | 20–29 | 79 | 25.1 |
| 30–39 | 79 | 25.1 | |
| 40–49 | 76 | 24.1 | |
| 50–59 | 81 | 25.7 | |
| Education | High school | 55 | 17.5 |
| University | 234 | 74.3 | |
| Graduate school | 26 | 8.3 | |
| Income (₩1,000) | Less than 9,999 | 36 | 11.4 |
| 10,000–19,999 | 54 | 17.1 | |
| 20,000–29,999 | 88 | 27.9 | |
| 30,000–39,999 | 54 | 17.1 | |
| 40,000–49,999 | 39 | 12.4 | |
| More than 50,000 | 44 | 14.0 | |
| Total | 315 | 100.0 | |
Table 2.
Descriptive analysis.
| Items (c) | Cross Loading | C.R. (a) | AVE (b) | Cronbach’s α |
|---|---|---|---|---|
| IU1 | 0.895 | 0.939 | 0.837 | 0.918 |
| IU2 | 0.872 | |||
| IU3 | 0.899 | |||
| PU1 | 0.891 | 0.937 | 0.833 | 0.897 |
| PU2 | 0.897 | |||
| PU3 | 0.807 | |||
| PEU1 | 0.837 | 0.991 | 0.974 | 0.893 |
| PEU2 | 0.864 | |||
| PEU3 | 0.873 | |||
| EN1 | 0.852 | 0.920 | 0.793 | 0.900 |
| EN2 | 0.887 | |||
| EN3 | 0.861 | |||
| IQ 1 | 0.810 | 0.924 | 0.752 | 0.869 |
| IQ 2 | 0.769 | |||
| IQ 3 | 0.782 | |||
| IQ 4 | 0.808 | |||
| MO_UT01 | 0.818 | 0.955 | 0.725 | 0.940 |
| MO_UT02 | 0.827 | |||
| MO_UT03 | 0.829 | |||
| MO_UT04 | 0.817 | |||
| MO_UT05 | 0.789 | |||
| MO_HE1 | 0.863 | 0.918 | 0.693 | 0.912 |
| MO_HE2 | 0.865 | |||
| MO_HE3 | 0.781 | |||
| FL1 | 0.843 | 0.869 | 0.690 | 0.824 |
| FL2 | 0.805 | |||
| FL3 | 0.704 | |||
| DJ1 | 0.863 | 0.949 | 0.822 | 0.921 |
| DJ2 | 0.864 | |||
| DJ3 | 0.834 | |||
| NE1 | 0.790 | 0.879 | 0.709 | 0.853 |
| NE2 | 0.753 | |||
| NE3 | 0.695 | |||
| PC_CO1 | 0.843 | 0.903 | 0.756 | 0.875 |
| PC_CO2 | 0.847 | |||
| PC_CO3 | 0.820 | |||
| PC_UA1 | 0.828 | 0.848 | 0.651 | 0.849 |
| PC_UA2 | 0.698 | |||
| PC_UA3 | 0.785 | |||
| PC_ER1 | 0.784 | 0.880 | 0.710 | 0.868 |
| PC_ER2 | 0.810 | |||
| PC_ER3 | 0.818 | |||
| PC_SU1 | 0.873 | 0.920 | 0.793 | 0.903 |
| PC_SU2 | 0.861 | |||
| PC_SU3 | 0.890 |
(a) CR = (∑Standardized factor loading)2/[(∑Standardizedfactorloading)2 + (∑Measurementerror)] (b) AVE = (∑Standardized factor loading2)/[(∑Standardizedfactorloading2) + (∑Measurementerror)] (c) IU = intention to use, PU = perceived usefulness, PEU = perceived ease of use, EN = enjoyment, IQ = information quality, MO_UT = utilitarian motivations, MO_HE = hedonic motivations, FL = flow, DJ = distributive justice, NE = network effect, PC_CO = privacy concern collection, PC_UA = privacy concern unauthorized access, PC_ER = privacy concern error, PC_SU = privacy concern secondary use.
Table 3.
Test of discriminant validity.
| 1 | 2 | 3 | 4 | 5 | 6 | 7 | 8 | 9 | 10 | 11 | 12 | 13 | 14 | |
|---|---|---|---|---|---|---|---|---|---|---|---|---|---|---|
| 1. IU | 0.915 | |||||||||||||
| 2. PU | 0.735 | 0.913 | ||||||||||||
| 3. PEU | 0.619 | 0.699 | 0.987 | |||||||||||
| 4. EN | 0.708 | 0.746 | 0.726 | 0.891 | ||||||||||
| 5. IQ | 0.568 | 0.639 | 0.660 | 0.678 | 0.867 | |||||||||
| 6. MO_UT | 0.622 | 0.645 | 0.661 | 0.687 | 0.671 | 0.851 | ||||||||
| 7. MO_HE | 0.557 | 0.474 | 0.498 | 0.552 | 0.507 | 0.583 | 0.832 | |||||||
| 8. FL | 0.564 | 0.530 | 0.539 | 0.575 | 0.620 | 0.593 | 0.648 | 0.831 | ||||||
| 9. DJ | 0.563 | 0.527 | 0.614 | 0.679 | 0.626 | 0.612 | 0.549 | 0.628 | 0.907 | |||||
| 10. NE | 0.688 | 0.660 | 0.669 | 0.730 | 0.648 | 0.640 | 0.516 | 0.617 | 0.635 | 0.842 | ||||
| 11. PC_CO | 0.045 | 0.007 | 0.041 | 0.029 | 0.050 | 0.004 | 0.070 | 0.030 | 0.048 | 0.009 | 0.869 | |||
| 12. PC_UA | 0.026 | 0.028 | 0.062 | 0.002 | 0.022 | 0.056 | 0.039 | 0.056 | 0.067 | 0.005 | 0.635 | 0.807 | ||
| 13. PC_ER | 0.101 | 0.083 | 0.009 | 0.091 | 0.029 | 0.048 | 0.061 | 0.147 | 0.016 | 0.095 | 0.648 | 0.739 | 0.843 | |
| 14. PC_SU | 0.039 | 0.062 | 0.001 | 0.083 | 0.055 | 0.001 | 0.019 | 0.088 | 0.004 | 0.064 | 0.59 | 0.650 | 0.670 | 0.891 |
* Diagonal elements (bold) show the square root of the average variance extracted (AVE).
Table 4.
Model fit for structural model test.
| Fit Index | x2 | x2/df | NFI | TLI | CFI | RMSEA |
|---|---|---|---|---|---|---|
| Criterion | p ≥ 0.05 | ≤3 | ≥0.9 | ≥0.9 | ≥0.9 | ≤0.08 |
| Research Model | 1425 (p = 0.000) | 1.544 | 0.887 | 0.952 | 0.957 | 0.042 |
Table 5.
Hypothesis test.
| Path | Estimate | S.E. | Sig. | H Test | |
|---|---|---|---|---|---|
| H1 | Perceived usefulness → Intention to use | 0.494 | 0.087 | 0.000 | Supported |
| H2-1 | Perceived ease of use → Intention to use | −0.064 | 0.094 | 0.499 | Rejected |
| H2-2 | Perceived ease of use → Perceived usefulness | 0.201 | 0.099 | 0.042 | Supported |
| H3 | Perceived enjoyment → Intention to use | 0.335 | 0.095 | 0.000 | Supported |
| H4-1 | Information quality → Perceived usefulness | 0.083 | 0.112 | 0.460 | Rejected |
| H4-2 | Information quality → Perceived ease of use | 1.089 | 0.092 | 0.000 | Supported |
| H4-3 | Information quality → Perceived enjoyment | 0.026 | 0.118 | 0.823 | Rejected |
| H5-1 | Utilitarian Motivation → Intention to use | 0.066 | 0.077 | 0.388 | Rejected |
| H5-2 | Hedonic Motivation → Intention to use | 0.151 | 0.052 | 0.004 | Supported |
| H6 | Flow → Perceived enjoyment | −0.167 | 0.102 | 0.102 | Rejected |
| H7-1 | Distributive justice → Perceived usefulness | −0.135 | 0.081 | 0.094 | Rejected |
| H7-2 | Distributive justice → Perceived enjoyment | 0.065 | 0.083 | 0.435 | Rejected |
| H8-1 | Network effect →Perceived usefulness | 0.729 | 0.139 | 0.000 | Supported |
| H8-2 | Network effect → Perceived enjoyment | 1.004 | 0.143 | 0.000 | Supported |
| H9-1 | Collection → Intention to use | −0.191 | 0.076 | 0.011 | Supported |
| H9-2 | Unauthorized Access → Intention to use | 0.232 | 0.134 | 0.084 | Rejected |
| H9-3 | Error → Intention to use | 0.044 | 0.125 | 0.725 | Rejected |
| H9-4 | Secondary Use → Intention to use | −0.063 | 0.065 | 0.331 | Rejected |
© 2017 by the authors. Licensee MDPI, Basel, Switzerland. This article is an open access article distributed under the terms and conditions of the Creative Commons Attribution (CC BY) license (http://creativecommons.org/licenses/by/4.0/).
Share and Cite
MDPI and ACS Style
Yoo, C.; Kwon, S.; Na, H.; Chang, B. Factors Affecting the Adoption of Gamified Smart Tourism Applications: An Integrative Approach. Sustainability 2017, 9, 2162. https://doi.org/10.3390/su9122162
AMA Style
Yoo C, Kwon S, Na H, Chang B. Factors Affecting the Adoption of Gamified Smart Tourism Applications: An Integrative Approach. Sustainability. 2017; 9(12):2162. https://doi.org/10.3390/su9122162
Chicago/Turabian StyleYoo, Changsok, Shinhye Kwon, Hyunsoo Na, and Byenghee Chang. 2017. "Factors Affecting the Adoption of Gamified Smart Tourism Applications: An Integrative Approach" Sustainability 9, no. 12: 2162. https://doi.org/10.3390/su9122162
Note that from the first issue of 2016, this journal uses article numbers instead of page numbers. See further details here.