Capturing Firms’ Heterogeneity through Marketing and IT Capabilities in SMEs


Department of Business Administration and Marketing, Pablo de Olavide University, 41013 Sevilla, Spain
*
Author to whom correspondence should be addressed.
Sustainability 2017, 9(12), 2180; https://doi.org/10.3390/su9122180
Submission received: 22 September 2017
/
Revised: 11 November 2017
/
Accepted: 21 November 2017
/
Published: 25 November 2017
(This article belongs to the Section Economic and Business Aspects of Sustainability)
Abstract
:To achieve sustainability, firms capable of surviving economic recessions is of key relevance; the capabilities that firms need to face dynamic environments remain an open question. In this work, a new procedure is proposed to capture firms’ heterogeneity with regard to the capabilities they possess in operating efficiently in dynamic environments. This approach enables the identification of the classes of firms that develop efficiency with a specific integration of resources. While the literature has most often measured firm capabilities using subjective measures, this study suggests the use of Data Envelopment Analysis to capture the ability to transform resources into outcomes and of Latent Class Regression to capture differences across firms that explain firms’ heterogeneity in the way they perform. By combining these two techniques, this work presents a way to identify those firms that need to invest in and develop certain capabilities. This work analyses a large dataset of manufacturing Small Medium Enterprises (SMEs) extracted from the Business and Strategy survey provided by Fundación de la Sociedad Estatal de Participaciones Industriales( SEPI) in Spain. The dataset used enfolds 10,960 observations from 2048 firms during the period 1994–2011. The complete dataset has been employed to calculate manufacturing firms’ efficiency. In a second step, data were cleaned to eliminate outliers, and to identify SMEs and observations with records of IT capabilities. As a result, 329 manufacturing SMEs were analysed to capture their heterogeneity. The results contribute to the current literature by explaining how manufacturing SMEs show a different need in their development of capabilities to be efficient and adapt to environmental changes. While approximately 20% of firms analysed really take advantage of recessions through their investment in R&D, the remaining 80% need to adjust their size or invest in IT capabilities to become competitive. The assumption shown in previous studies regarding the performance of SMEs to better confront recessions is discussed in this paper.
1. Introduction
Since its foundation in 1993, the European Union (EU) has been faced with periods of prosperity and recession. The most recent crisis befell Europe in the late 2000s, and was known as the European sovereign debt crisis. Several countries were driven to catastrophic situations that affected their local economies and the standard of living of their citizens [1]. Four countries especially suffered from this crisis: Portugal, Ireland, Greece, and Spain (PIGS). These four countries overcame the situation in different ways. Economic troubles in Portugal forced it into a punishing bailout program, which cut public-sector wages and pensions and left it with an unemployment rate of 17.5% in early 2013. In 2010, Ireland faced the bankruptcies of the now defunct Anglo Irish Bank and Irish Nationwide, and was unable to rescue them on its own, thereby forcing a bailout from the EU and the International Monetary Fund (IMF). Greece is currently undergoing the third infusion of funds in its bailout program, which started in 2009. Finally, in 2012, Spain acceded to the European Stability Mechanism to recapitalise its banks.
Spain was the only country of the PIGS that, during the European debt crisis, was not formally involved in a bailout. In 2007, Spain was ranked fifth with respect to its contribution to the business economic volume in Europe and, similar to most of the economies in the EU, its figures were explained by the increasing activity of two main sectors: services and construction. Moreover, from 1994 to 2007, with a short period of stability between 1999 and 2001, manufacturers increased their levels of labour productivity [2]. In 2010, the manufacturing industry was the only industry that presented growing rates in its contribution to the Gross National Product, while the two sectors that had traditionally contributed most to the GNP remained in recession. During 2010 and 2011, Spanish manufacturers’ contributions to the GNP were rising, and achieved rates of growth higher than 3% in 2011 [3]. No other industry contribution to the GNP in the country was increasing with such intensity. The first quarter of 2012 started with a growth of 3% for Spanish manufacturers and fell to negative results in the second quarter of 2012 [4]. When, in 2012, the Spanish Government launched the anti-crisis Law which curbed salaries in the public sector (Real Decreto-ley 20/2012, de 13 de julio, de medidas para garantizar la estabilidad presupuestaria y de fomento de la competitividad; Royal Decree-Law 20/2012, July, 13, Measures to guarantee budgetary stability and to promote competitiveness), manufacturers suffered a new recession due to the paralysis of business for retailers and wholesalers [5] and, consequently, growth was not possible in the short/medium term. Together, these circumstances led manufacturing firms to play a key role in the recovery of the crisis in Spain thereby making them an interesting setting to study.
This leads us to set certain research questions: How can the phenomenon of the manufacturers’ growing contribution to GNP in periods of recession in Spain be explained? Do these firms have critical characteristics that make them the first to recover in periods of recession? This work presents a methodology that strives to answer these research questions. The application of the proposed procedure to other countries and other contexts is also proposed as a future line of research.
The majority of Spanish firms are SMEs, and represent more than 99% of the total number of firms [2,6]. In the case of industrial firms, in 2011, SMEs were responsible for 47.5% of the industry’s turnover, and for 48.6% of the total exports for manufacturers [7]. However, the relevance of SMEs is not exclusive to the Spanish case nor to the manufacturing sector. In the EU, SMEs represent 99% of all enterprises and contribute to more than half of all value added created by business [8]. The Organization for Economic Cooperation and Development (OECD) identifies SMEs as a driving force for societies that are more inclusive and prosperous, and calls for evidence in the analysis of the SME business environment [9]. Specifically, SMEs that frequently appear as a result of an entrepreneurial activity contribute to economic growth, development, employment, and innovation. In this context, it is of the highest importance to study how SMEs manage to survive and compete in periods of crisis [1].
The aim of the present study is to highlight what resources and capabilities allow SMEs to adapt to changing markets. Capabilities play a key role in dealing with environmental forces through resource integration [10]. The literature summarises the key elements in the Resource-Based View (RBV) theory to explain resilience based on the idea that SMEs are able to manage resources properly in order to survive [11].
This study proposes the use of longitudinal analysis to provide a perspective of the alignment of resources and capabilities to be successful and considers various changing market conditions for SMEs [12,13]. The data used in this research have been extensively detailed in the sample description section; it is important to mention, however, that the time frame (1994–2011) has been selected in such a way that it considers all years previous to the application of anti-crisis regulation, that is, before the end of 2011. In 2012, with the application of the European Stability Mechanism, market conditions radically changed for manufacturers. The anti-crisis measures entailed the interaction of two different environmental forces: the economic situation and political forces. This new situation made it necessary for manufacturers to yet again adapt to a disruption in the market that appeared when they were still adjusting to cope with the recession. The results of these anti-crisis measures are impossible to measure nowadays because data are not yet available and the Spanish Government is still maintaining certain anti-crisis interventions with respect to public salaries. Consequently, the last year considered in this research is 2011.
Regarding the literature analysed, the method proposed in this paper constitutes an extension of previous work [14] by analysing how higher and lower levels of specific capabilities interact with the different levels of other capabilities. Not only do the results identify heterogeneity, but also how firms can be classified considering this heterogeneity, and how firms in a specific class of firms can achieve higher efficiency levels by managing their key capabilities. To achieve the goals of this work, an appropriate panel dataset has been used as well as methods that allow differences to be captured regarding how firms transform resources into results, thereby making it possible to explain heterogeneity. Data have been analysed using two different tools. Firstly, firms’ capabilities in transforming their resources into results have been captured using a methodology specifically designed to measure the efficiency of units in transforming input into outputs, known as Data Envelopment Analysis (DEA). This methodology provides an efficiency score for each company. Differences in efficiency levels have been used in previous studies to explain firms’ heterogeneity using the RBV [15,16]. As a second step, once an efficiency score has been obtained for each firm, the existence of a nominal variable that describes firms is proposed. This variable varies with the way that firms develop their efficiency. A simple example can be useful to illustrate this nominal variable: there is a difference in the way women and men use razors; it is clear and intrinsic to the nature of gender differences. Consequently, the razor market can be divided by gender, since there is an identified nominal variable, gender, which classifies consumers’ use. In the case of firms’ capabilities, it is observed that there are certain firms that behave differently from others, by transforming the same resources into different outputs; that is, there is durable firm’s heterogeneity that is latent. Is it possible to identify a nominal variable that explains this heterogeneity? In other words, what is the latent “gender” of the firm that aggregates firms depending on the way they adapt resources to market changes over time? The use of Latent Class Regression Analysis [17] in this work allows the levels of this latent nominal variable to be identified. As a result, a firm’s heterogeneity is captured by studying how it transforms resources into outcomes under different market conditions over time [13]. This approach presents a useful tool for decision makers interested in efficiency improvements and for the implementation of public policies in order to improve the growth rates of manufacturers and consequently, the GNP. In addition, a broad overview of company capabilities is shown in this work, whereby special attention is paid to the combination of Information and Technology (IT) capabilities that have yet to be studied jointly with marketing, innovation company capabilities, and market conditions in longitudinal analyses [18]. These should be considered as complementary capabilities that contribute to performance along with other firm assets and capabilities [19].
This work contributes to the existing literature by showing a framework that enables the identification of the resource integration needed in order to confront changes in market conditions due to environmental forces. To this end, a tool is provided that identifies firms with different needs for the development of capabilities in order to be more efficient in the market. This identification enables firms’ heterogeneity to be captured as a source of competitive advantage, and a variety of routines and investments that firms might execute over time to be identified, by making this knowledge available in the public domain. Consequently, the results provide useful implications to practitioners [20] and give firms the opportunity to learn and apply tested successful strategies. Additionally, industry and corporate effects are combined in this paper [21] with the analysis of resource integration proposed by the RBV of the firm [22]. The two approaches are complementary when heterogeneity crosses the boundaries of the industry and this is captured as an explanation of how firms respond to market changes, thereby setting a better integration of their resources to increase efficiency.
In the achievement of a sustainable future for society and the economic system, the identification and understanding of those SMEs that better confront unstable markets could not only help other firms to implement better strategies based on the lessons learned, but also establish public policies aimed at improving the economic system instead of implementing policies that may negatively affect firms during times of recession [23].
The paper is structured as follows: The Introduction covers the literature review and introduces the hypotheses. In the Section 2, the material and methods are presented. The paper then lays out the procedures and results, and finally a discussion is provided and the main conclusions are drawn.
1.1. Literature Review
Classic theories in industrial organisation explain how the most important resources of economic income for a business unit represent specific endowments, positions and strategies followed by the firm [21], and how industry and corporate effects should be complemented with the study of the resource environment of the firm in order to explain firm performance [24]. On the other hand, the RBV (or capabilities theory) focuses on firms’ resources that are rare, sustainable, and difficult to imitate because they represent a source of competitive advantage and a source of within-industry heterogeneity [25]. Specifically, in changing environments, these capabilities need to be adapted and, consequently, can be considered dynamic [22]. The need to adapt to external forces recognises the existence of environmental forces as well as certain idiosyncratic firm attributes that explain how firms adapt to changes in the environment [25]. Few studies consider both approaches, how firms resources into capabilities and how strategies, complemented with environmental factors, explain firms’ results [26]. Moreover, in the presence of environmental changes, such as rapid technological changes, firms need to develop dynamic capabilities in order to address these new situations [27]. In response to environmental and market changes, they should also develop identifiable organisational processes and reallocation of resources that, in moderately dynamic markets, could be understood as the traditional conception of routines [28]. Exposed to market conditions, the competitive advantage potential of firm’s capabilities can then be developed by an efficient combination of business processes and resources [29]. Consequently, to really capture the transformation of resources into competitive advantages over time, and to understand how the capability development and deployment affect firms’ performance under changing market conditions, it seems necessary to study both market conditions and firms’ resources and processes. Furthermore, the study of firms’ heterogeneity with respect to their adaptation to market conditions must include key aspects, such as the organisational capacity [15], the environmental and market complexity [30], and the competitive advantage developed for transforming firms’ resources into results [16].
Inter-firm heterogeneity in terms of adaptation to market conditions is referred to in this work as the transformation of resources to create higher levels of efficiency in specific situations over time. The relationship between firms’ heterogeneity and the market has been extensively studied in the literature from various points of view, thereby providing useful insights for decision makers. One of the perspectives taken by previous analyses [31] considers the productivity of heterogeneous firms in relation with different cap-and-trade program designs shows how these programs contribute to environmental quality while having no effect on the firms’ productivity. One interesting result [31] is that, in monopolistic situations, the reallocation of resources intensifies with the heterogeneity of firms. However, nothing is explained regarding what happens in non-monopolistic markets. Moreover, firms’ heterogeneity has been proven to be a key determinant of the relevant decisions taken by the firm; in particular, a recent study shows how a firm’s heterogeneity explains decisions concerning internationalisation [32]. Nevertheless, in [32], the phenomenon is studied using cross-sectional data gathered over one single period of time. Previous studies have shown that internationalisation decisions are dynamic and can be explained by a mix of resources and capabilities managed by the firm that determine the evolution from one state of internationalisation to another [33]. Heterogeneity in terms of individual characteristics of the firm also explains market selection [32,34] and how firms become more global through their access to extensive labour markets that increase firms’ productivity [35].
Nevertheless, the effect of macro-environment forces on SME performance remains controversial. Several authors point to the idea that when firms become larger, they are less vulnerable to the macro-economic situation [8], which is in contrast to the extended idea that SMEs adapt better to changes in the market because they present higher levels of strategic and operational flexibility due to their reduced size [11,26]. The adaptability of SMEs to changes in market conditions due to environment forces is based on flexibility and on the existence of a proactive attitude of the firm. Environmental forces can change the labour market, consumer demand, supply ability, and costs, thereby resulting in a volatile and uncertain market that requires a high level of adaptation of the firm’s resources [10].
Nevertheless, most previous studies into firms’ capabilities are based on cross-sectional data that cannot capture this evolution over time and, consequently, cannot capture the firms’ adaptability to changes in the environment [10,36]. Repeated measures have rarely been used and only in specific contexts. For example, in [37], only firms that are leaders in technology are considered. Other studies enfold the resource-based view theory by studying the capabilities that drive firms to adopt outsourcing in order to achieve strategic goals [38]. Finally, there are other studies that measure a firm’s efficiency in transforming resources [16], but the results of these studies fail to explain how market conditions and strategic decisions affect a firm’s efficiency.
1.2. Hypotheses—Marketing and IT Capabilities
Certain firms achieve superior business efficiency since they have a greater understanding of customers’ needs and wants, they provide superior services, set better strategies than their competitors, match channel requirements and developments, and are exposed to the market environment, which, in short, means that they manage tangible and intangible assets better than their competitors [29]. Specifically, firm survival is based on being able to identify opportunities for the creation of value of a firm by the use of their capabilities as a means to improve their performance in the industry’s ever-changing landscape. Key pre-entry capabilities in diversification strategies that explain survival during an industry shakedown for manufacturers include technology, corporate-level integrative capabilities, marketing, and distribution [39]. Specifically, distribution, advertising, R&D, and IT capabilities have been identified as the key variables for survival as well as antecedents of performance for manufacturing SMEs [40]. The hypotheses presented in this study are based on the idea that these capabilities are a result of the correct combination of tangible and intangible assets, which explains how manufacturing SMEs respond to market changes with different levels of efficiency.
Firms’ tangible and intangible assets can be estimated by their R&D and Marketing intensity [41] and by the complexity of the market [30]. Specifically, in the Marketing literature, Marketing is referred to as the processes needed to meet customers’ needs, and marketing capability should be understood as the management of market sensing and customers-linking capabilities [42]. The present work specifically focuses on the study of marketing capabilities in explaining firms’ efficiency under different market conditions rather than marketing expenditures as an input and sales as an output to measure efficiency in marketing [43]. Efficiency refers to the outcomes a firm achieves relative to the resources it uses due to the implementation and adjustment of these business processes in response to market changes that allow firms to outperform their competitors [16]. On assuming that marketing capabilities should include the capacity to adapt to market and environment changes, the gap should be filled between environmental needs and organisational capacity as a source to explain a firm’s heterogeneity within the industry [30].
Given all previous reasoning, it is expected that:
Hypotheses 1 (H1).
Marketing capabilities explain firms’ heterogeneity with respect to their efficiency in adapting to the market and environmental changes.
Within changing global environments, IT capabilities form part of this complex process; technological solutions are necessary to meet customers’ needs through the support of marketing activities with information technology [44]. Firms are in need of developing new knowledge regarding markets, products, and technologies, and of combining all of this knowledge in order to develop capabilities to become more competitive [45]. The joint analysis of marketing and IT has resulted in new approaches, such as e-marketing capabilities [18]. However, little attention has been paid to how small- and medium-sized producers are able to adapt to market changes by combining marketing and IT capabilities as the basis for the development of any strategic advantage when firms experience environmental turbulence [46]. In this work, the ways in which firms combine marketing and IT capabilities are suggested as predictors of firms’ efficiency. Firms can achieve a competitive advantage by using IT through the design of the appropriate IT structure and by building the capabilities needed for their management. On the one hand, IT resources include tangible, human-related, and relational resources, while, on the other hand, the concept of IT capability is defined as “a firm’s ability to mobilize and deploy IT resources effectively to perform strategic IT planning, develop Information Systems (IS) and leverage, use these systems, and manage IT functions and IT assets” [47] (p. 329). In the study of IT capabilities, as part of the process of business value creation, two elements should be included: the resources used by the company, and the results achieved by their use, which are a reflection of the capabilities of the company. It can be assumed that the results explained by the use of IT resources show the existence of IT capabilities in the company because resources themselves cannot create any business value. In this sense, capabilities can be seen as a transformer of inputs into outputs, in other words, a latent concept that can be measured by observing how two firms using the same resources may achieve different outcome levels [48]. For instance, the evaluation of IS has been implemented, and measures of its performance, as part of IT resource management, is integrated as a whole with all the company areas that interact to face changing environments in order to create learning and leverage, thereby contributing to the achievement of a firm’s goals [49]. Furthermore, depending on the extent to which a firm’s goals are achieved, there exist certain IT capabilities that contribute to the development of a competitive advantage reflected on higher levels of a company’s efficiency [50] that allow firms to create business value in changing environments [51].
The study of the relationship between IT capabilities and firms’ outcomes has failed to show conclusive results regarding a sustainable and positive effect of this capability on performance [52]. Not only do firms have to align IT capabilities with company strategies in order to achieve a better internal adjustment, but a firm’s environment also needs to be included in order to prevent firms from wasting their scarce resources [53] and to develop an ability to adapt to the changing environment that refers to IT capabilities.
Previous studies have shown that IT creates business value in certain circumstances while it fails to do so in other circumstances, and it is revealed that IT does not always lead to positive outcomes, which is because IT has a different utility in stable versus dynamic environments [47], and hence it is expected that IT capabilities capture firm heterogeneity over time [37]:
Hypotheses 2 (H2).
IT capabilities explain firms’ heterogeneity with respect to their efficiency in adapting to the market and environmental changes.
2. Materials and Methods
2.1. Methodology
The empirical analysis has been developed in two phases. In the first step, DEA has been used to measure a firm’s efficiency [54]. Firms are more efficient than others when they are able to better manage their resources in order to achieve business goals [55]. This is related to relative efficiency and is closely tied to the concept of competitive advantage [16]. Deterministic frontier methods have been designed to assess an individual firm’s efficiency relative to the best performers in an industry and are therefore well suited to address the challenges of measuring competitive advantage [43]. A firm’s efficiency is measured in terms of the distance of each specific firm from the industry’s efficient frontier from which results an efficiency score that is calculated as the possible percentage increase of “all outputs,” given the current input [16]. Data Envelopment Analysis is a multi-output, multi-input approach to the measurement of efficiency. According to the classic definition of efficiency [56], and using an output orientation, a unit is said to be efficient if it cannot increase any of its outputs without increasing any of its inputs or decreasing any of the other outputs. This efficiency score reflects the specificity of the firm in transforming resources into outputs. Data Envelopment Analysis has been preferred to stochastic production frontier analysis (SFA) for several reasons. First, DEA neither imposes a functional form nor a form of distributional assumptions on the variables, whereas stochastic frontier analysis requires the specification of a functional form, and a distributional assumption has to be made for the error and the inefficiency term. Furthermore, the relatively high value of the correlation among the three key inputs of our analysis may lead to multicollinearity problems that can severely affect the results of stochastic production frontiers (SPFs). Another reason is that SFA cannot successfully distinguish between technical improvements and efficiency improvements [57]; when using panel data, SPF estimators are often biased [58] and the independency of the inefficiency terms over the different time periods is difficult to hold [57]. Although DEA is not completely free of disadvantages, given the characteristics of the available data and the above reasons, this type of analysis was chosen in this particular study.
One key assumption in DEA is that firms have to be homogeneous. However, firms in different sectors use different technologies and may use different combinations of inputs to produce their outputs. Consequently, firms in the different sectors present sector specificities that cannot be ignored. To avoid problems of sector heterogeneity, certain previous studies introduce dummy variables for sector and time [59], but such a method assumes that the technology and the combination of inputs to produce outputs is the same for all sectors, and only allows constant deviations from the average frontier for each sector. In contrast, in the current study, each DEA model compares each observation with those operating in the same sector. Further to this, to avoid the mixed effect of firm efficiency and general economy seasonal effects, a different model has been run for each of the different time periods. Consequently, for each observation, the peer group was composed of those firms operating in the same sector and same time period as that of the unit under analysis. While time-, country- and industry-specific frontiers have been used in some studies to take productivity differentials into account, how to account for a firm’s specific heterogeneity remains unclear [58]. As DEA efficiency rates are relative to the observations in the peer group, the resulting efficiency scores represent how efficient a firm is relative to the other firms operating in the same sector and same time period, and hence the seasonal circumstances under which it operates does not affect the efficiency score. If a firm receives an efficiency score equal to 1, it means that there is no other firm in that sector operating better than the firm under analysis in that time period. If a firm receives an efficiency score equal to 0.8, it means that there are other firms in the peer group (operating in the same sector and same time period) that are more efficient than the unit under analysis. In this case, the firm being analysed could become efficient by increasing its outputs by 25% (The expansion rate would be equal to: Expansion rate = 1/TE = 1/0.8 = 1.25). From this step, an efficiency score has been produced for each company for each year under analysis.
Secondly, another step is needed to explain the firm’s heterogeneity [58]. Heterogeneity has been studied in this work by considering that capabilities are latent aspects of the company that cannot be directly observed and, consequently, an a priori segmentation that supposes that resources and strategies from firms with similar characteristics will show a similar impact on efficiency would introduce some bias into the analysis. Consequently, Latent Class (LC) Regression has been applied. The basic idea of the LC Regression is to specify a regression model from the generalized linear modelling (GLM) family using repeated measures or panel data in which parameters differ across latent classes thereby allowing the identification of heterogeneous groups of firms [17]. This technique searches for the “gender” of firms that affects their efficiency, that is, the analysis of classes with different regression coefficients enables the identification of how diverse levels of efficiency are achieved by different combinations of capabilities, that is, heterogeneity is explained, thereby making it possible to identify the capabilities that favour efficiency increases in each class of firm. Previous studies have tried to classify firms by considering their ability to transform resources into capabilities; however, they base their analysis on a priori segmentations, and suppose that firms behave in the way predicted [60].
To sum up, secondary data have been used to capture firms’ heterogeneity in a first step, and to capture the power of capabilities that explain this heterogeneity in a second step. Heterogeneity is understood as the differences that lead firms to perform differently and it is observed by calculating within-industry efficiency (by means of DEA) which is subsequently explained through latent class regression.
2.2. Description of the Dataset
This study uses longitudinal data provided by the Survey of Business Strategies (ESEE, “Encuesta Sobre Estrategias Empresariales”) which annually gathers data on Spanish manufacturing firms with 10 or more employees. The population used as a reference by Fundación SEPI for the ESEE is limited to manufacturers and excludes refineries and fuel treatment plants. Sample selection is based on a random method of exhaustive sampling. A more detailed description of the dataset can be found at [61]. In the dataset used for this research, there are 10,960 observations within a time span of 18 years (1994–2011) and includes a total of 20 different activities within the manufacturing sector. Since there were few observations in certain sectors, these were grouped in accordance with the NACE (NACE is the statistical classification of economic activities in the European Community. The term NACE is derived from the French “Nomenclature statistique des Activités économiques dans la Communauté Européenne”) Rev.2 classification into higher-level digits, resulting in a total of 9 sectors in the manufacturing activity. In the final sample, 12 of the 17 autonomous regions of Spain were represented. This sample was refined by eliminating outliers in order to calculate efficiency.
In a second step, the sample was cleaned again, mainly in order to constrain the sample to SMEs and to include the variables required for this study, that is, the variables regarding IT capabilities that were introduced in the survey in 2001, and therefore, although the whole dataset was used to calculate the efficiency score, the final sample size used for the LC Regression was composed of 329 manufacturing SMEs for a time span of 11 years [2001–2011].
3. Procedure and Results
3.1. Measuring Firms’ Efficiency: Procedure
The DEA technique was originally developed by [62] and was based on Farrell’s ideas. The original DEA model was developed by Charnes, Cooper and Rhodes in 1984. Since then, several DEA models have been proposed in the literature. The model used herein is that proposed by [63], commonly known in the literature as the BCC model. The main reason for the selection of the BCC model is that it allows more flexibility than the original CCR model. While the CCR model assumes constant returns to scale, the BCC model allows for varying returns to scale.
The following BCC DEA model was solved for each firm:
Maximize
Subject to
where xi,j corresponds to the amount of the i-th input of firm j, and xi,j0 corresponds to the amount of the i-th input of the firm being analysed. Analogously, yr,j represents the amount of output (in our case, there is just one output) of firm j, and yj0 represents the amount of output of the firm under evaluation. θ represents the expansion factor. For simplicity, the sub-indexes standing for time, t, and sector, s, are omitted but, as stated before, this model was run for each time period and each sector separately. The performance associated to each firm is given by:
Technical Efficiency yj0 = TE = 1/θj0 which varies between zero and one.
A unit is said to be efficient if theta equals 1 (TE = 1), and is inefficient otherwise (TE < 1). A DEA analysis not only provides a measure of inefficiency but it also provides a virtual efficient unit associated to each inefficient unit. Each virtual efficient unit is the ideal situation to which the associated inefficient unit should be transformed in order to reach efficiency. Hence, an inefficient unit should modify its outputs to reach efficiency. When using an output orientation, as in our case, a radial expansion of the outputs is performed by means of the optimal value of theta. If a unit is inefficient, it could become efficient if it expands its output levels by theta. For a wider explanation of the DEA technique, please refer to [54].
To analyse the evolution of productivity of manufacturing firms over the period analysed, several additional analyses were carried out: the technical change and the Malmquist Total Productivity index. The procedure followed is included in Appendix A. All efficiency related measures were calculated by programming in GAMS software (vers. 22.7, GAMS Development Corporation, Washington, DC, USA)
3.2. Measuring Firms’ Efficiency: Variables Employed and Results
A general measure of efficiency compared with those of the competitors can be obtained using a DEA model by considering the inputs of labour and capital and outputs such as sales. In our case, three inputs have been considered: Personnel costs (representing labour), purchases and fixed assets (representing capital). The output included in the analyses was that of total sales. This measure aims to capture whether labour and assets are efficiently used in order to adapt the company to the market represented in the sales output [43].
First, an outlier analysis based on the Mahalanobis distance was carried out and observations were eliminated based on a 5% significance level. Again, the outlier analyses were run separately for each industry sector because different sectors may use different combinations of inputs (resources) to produce their outputs. This reduced our sample size from 10,960 to 10,456 observations, which corresponds to 2048 firms operating over 18 years (1994–2011). Carrying out an outlier analysis prior to conduct a DEA analysis is important because extreme observations define the efficient frontier, consequently they can distort results making efficiency scores to appear unusually low. Three inputs were considered: personnel costs (representing labour), purchases and fixed assets (representing capital). The output considered was that of total sales. The descriptive statistics of our data are presented in Table 1 and Table 2. The average value of personnel costs for the whole dataset was 6.54 million euros, average purchases were 24.27 million euros and average fixed assets were 14.73 million euros (Table 1). The average total sales was 32.68 million euros. In Table 2, we can observe that firm efficiency was correlated to the rest of the variables included in the analysis, negative correlation to the inputs and a high positive correlation to the output. The coefficients of correlation among the three inputs were all significant, as expected.
Despite having removed outliers, the average value for the DEA efficiency scores remains low (Table 2). The low values of the DEA scores are due to two main reasons. Firstly, the technique itself is that which generally offers lower scores [54]. Secondly, this issue is particularly relevant in the case of many observations (since the DEA scores tend to diminish as the number of observations increase).
Nine different sets of models (one per sector) were used, each of which was run 18 times (one per time period), which made up a total of 162 BBC DEA analyses. These DEA analyses provided us with an efficiency rate for each observation. In this step, all firms are individually compared to the set of firms in the same sector that operated in the same time period as the unit under analysis, and therefore the efficiency estimates are free of the influence of the time effect and the sector effect. On average, firms were not very efficient. The average value was 0.164 (Table 3) with a standard deviation equal to 0.28. Figure 1 shows the average efficiency scores over time. It can be observed that efficiency scores follow no pattern from 1994 to 2006. This seems logical since, although one would expect increases in efficiency over time for certain firms, the rest of the firms eventually catch up, thereby reducing the difference in efficiency gains between them again, and hence on average, the differences in efficiency scores between the firms should remain similar over time. Note that these scores are relative to the firms operating in the same sector and same time period, therefore they do not capture efficiency gains over time. Results showed that 645 observations were fully efficient, representing roughly 6% of the total number of observations. However, only 66 firms were fully efficient over the 18 time years considered and 96 firms showed average efficiency levels over time higher than 0.90.
The technological change index and the Malmquist index were also calculated in order to capture the changes in technological change and total productivity over time. The Malmquist index includes the effect of both the firm’s inefficiency and its technological change and is given by the product of both indicators. These indexes show the evolution of productivity over time and indicate the start and evolution of the economic crisis. Following the procedure in [64], to calculate the Malmquist index, after calculating the firm’s efficiency, the inefficiency was removed from each firm by multiplying its output by the radial expansion rate. Another DEA model was then run using the modified (efficient) observations (see Appendix A) which include the firms in the base time period as the reference set so that the resulting scores of the second DEA model are only due to technical changes, since they remain free of the influence of the efficiency of each observation (Appendix A). The last year in our dataset (the year 2011) was chosen as the base time period for the analysis of the technological change over time. Note that the technological change is given by the change in the frontier from one time period to the base time period.
The estimated technical changes with reference to the base year 2011 are presented in Table 3. Interestingly, all technological change indicators are higher than 1 when compared to that of the year 2011, which suggests that the economic productivity had decreased over the recession, thereby leading to lower values during the last years of the crisis considered. Figure 2 also shows that, while technical change was kept relatively constant over the period 1997–2005, it experienced a sharp decline during the period 2006–2011, which coincides with the worst years of the economic crisis.
When comparing Figure 1 and Figure 2, it can be observed that, while there is no clear trend in average efficiency scores over time until 2006, average efficiency steadily increases (Figure 1) during times of crisis (from 2006 onwards). In contrast, Figure 2 shows decreasing levels of technical change or changes in productivity over time due to changes in productivity of efficient firms, from the year 2006 onwards, when the first signs of the economic recession appeared. While this may seem paradoxical, there is a clear explanation. Firstly, and most importantly, it is most probably only the best and most efficient firms that survive in adverse economic situations, and hence only the least efficient firms failed to survived the recession, consequently producing apparent increases in average efficiency. Secondly, firms that survive need to become more efficient, and thereby move closer to the best-practice frontier, when the economic environment is hard in an effort to survive economic recessions. Thirdly, it may well be that the least efficient firms fail to survive the crisis and year after year firms disappear from the database as they close down.
The estimation of the Malmquist index, which measures the effect of total productivity change including the efficiency change and the technological change, are presented in Table 2 and have been represented in Figure 3. The evolution of the Malmquist index implies that the changes in profitability was relatively stable over time until 2006 and it decreased from that year onwards, which in turn suggests that total productivity has been decreasing since the economic crisis started. Although there seems to be a slight increase in productivity in 2007 with respect to 2006, the productivity of that year with respect to all other previous years is much lower.
3.3. The Latent Nominal Variable, Capturing Firms’ Heterogeneity: Procedure
The resource-based view (RBV) theory maintains that resources by themselves cannot be a direct source of competitive advantage; they must be translated into capabilities. Consequently, capabilities must be understood in terms of resource allocation and the level of efficiency obtained. Capabilities relating to resource deployment in the market are usually associated with the marketing function (see, for example [65]). Two interrelated marketing capability areas have been identified: capabilities concerning individual ”marketing mix” processes, such as product development and management, pricing, selling, marketing communications, and channel management [45,66]; and capabilities concerned with the processes of marketing strategy development and execution [14,30].
Capabilities are latent aspects of the firm. There are several ways to measure a latent, unobservable phenomenon. One way is to use perceptions: For instance, the perceptions of CEOs, stakeholders, and employees concerning whether they consider that their firms are able to transform resources into performance better than that of competitors, and whether they can adapt these resources to changes in the market to develop a competitive advantage (see, for example [36]). Unfortunately, perceptions provide latent factors with measurement errors rather than direct and objective measures of capabilities. Another option could be to gather information using a qualitative approach: investigate in depth all the processes of the firm, compare more than one firm by analysing several cases, and draw a conclusion regarding how firms compete and behave (see, for example [53]). However, a proxy and not a real measure or description applicable to any firm could be used. To achieve a more objective measure of the level of capabilities, it is first necessary to identify those firms that are developing competitive advantages better than their competitors and to identify how these firms should use these resources over time to achieve higher levels of efficiency. This two-step idea can be captured using DEA and by subsequently applying latent class regression. The basic idea of the Latent Class Regression [17] is to specify a regression model from the generalized linear modelling (GLM) family in which parameters differ across latent classes thereby allowing the identification of different classes of firms through the use of repeated measures or panel data.
Latent Class (LC) Regression is defined by a single nominal latent variable x, Ti repeated observations of a single dependent continuous variable yit, and 1 < q < Q numeric or nominal predictors that affect yit via a GLM. The main difference with the LC Cluster is that in LC Regression there is a distinction between predictors and covariates. In the results, the levels identified in the nominal latent variable x correspond to the different classes [17,67]. The general probability structure used in the regression takes the following form:
where K represents the number of latent classes and Ti is the number of replications that may differ across cases. Equation (1) shows covariates and predictors. The LC Regression module in LatentGold® [17] considers that conditional densities have the same form for each t and direct effects between multiple responses are not allowed. Linear predictors have a specific form in LC Regression:
where is the class-specific intercept and is the class-specific regression coefficient corresponding to the predictor or covariate number p = 1, …, P, where P is the total number of predictors and covariates.
3.4. The Latent Nominal Variable, Capturing Firms’ Heterogeneity: Variables Used and Results
3.4.1 Predictors and Covariates
The use of surveys allows decision-makers to be interviewed using scales as accurate measures to estimate marketing and IT resources and their effect on performance, efficiency and value creation [18,45,68]. However, when capabilities are to be extracted from hard data, certain limitations appear since the concepts to be measured are not accurately available in secondary data sources and researchers need to use proxies. Meanwhile, secondary data sources have been previously used and, consequently, some useful measures are accepted in the literature [43]. Strategic marketing ambidexterity, for instance, is captured using a combination of advertising and R&D expenditures [69] and advertising expenditures by themselves allow the study of how short-term advertising causes long-term intangible assets [70] and firm value [71]. The linear/curvilinear, positive, negative effects of R&D, marketing capabilities and activities on performance have been broadly discussed (see [14]). Originally, resources and capabilities conform tangible and intangible assets, such as organisational processes and routines [22,25]. In this vein, Fang and Zou [72] introduced three dimensions to measure marketing capabilities, and strive to capture these capabilities in processes and resources invested to produce tangible and intangible marketing assets. These authors [72] measure marketing capabilities in terms of product development management (R&D and design, product service, etc.), customer relationship management (via the establishment of special relationships with customers), and supply chain management (control and relations in the distribution channel). The resource combination, integration, and deployment of these three elements provide the key for the creation and delivery of customer value and, consequently, for an increase in competitive advantages and financial performance. The following measures, taken from the ESEE, have been used to capture the marketing functions thereby introducing advertising, distribution and enhancement of customers’ relationships as well as IT and control variables.
- (1)
- Advertising expenses/sales: Percentage of the expenses in advertising and public relations (account 627 PGC: Spanish general accounting plan) represent over sales.
- (2)
- Direct Distribution/Sales: Percentage of the sales that have been sold directly by the firm. This variable records the percentage of those directly made sales plus those made through their own distribution network. It shows the firm’s distribution strategy. Higher levels mean that the firm has more control over the distribution channel and intermediaries.
- (3)
- Clients’ Concentration: Sales of the three main clients over overall sales (percentage). Percentage which represents the company’s total final sales made to its three main customers. Higher levels of the concentration of clients show specialization and a close relationship with the client. Research and Development have been considered as part of the new product development [12] because new product development is mainly developed to satisfy customers’ needs, which is the main aim of marketing activity [42] and therefore both should work together as part of the firms’ capabilities.
- (4)
- R&D/Sales: Percentage which represents total expenses in R&D on sales volume.
The use of technology leads the company towards the higher levels of efficiency, required to compete in the global environment, which characterize the present market. Specifically, firms would be more competitive if they properly employed technologies that facilitate efficiency, such as CAD, software and hardware, and properly training employees in their jobs [44].
- (1)
- CAD (Computer Aided Design): This variable is measured with the following question in the questionnaire “Do you use computer aided design?” and is a nominal variable with a dummy answer (Yes or No).
- (2)
- CPSO (Computer Programming Services’ level of Outsourcing): This is a categorical variable which indicates, for the software programming services, which of the different options is better adjusted to the operations of the company. The categories are: No use; Own firm; Partial outsourcing; and Full outsourcing.
- (3)
- ITE (IT Expenses): This is a percentage which the external expenses for training the employees in computing and information technologies represent on labour costs.
To measure how capabilities have been successfully adapted to market conditions, market dynamism was included in the analysis by considering two main aspects: First, a panel dataset was available that included 11 years where times of prosperity, stability and recession can be observed and where all firms in the sample have survived throughout this time, and hence it shows that these firms are able to adapt the company to changes by developing efficiency and confronting environmental turbulence [45]. Second, if the market is very dynamic and the need to adapt emerges, then markets conditions observed over time can also explain firm’s heterogeneity [30]. The following nominal variables were included:
- (1)
- Market Dynamism: This is a categorical variable that classifies companies according to the value of the Market Dynamism Index during the year. Categories of the variable include: Expansive (index between 65 and 100); Stable (index between 35 and 65); and Recessive (index between 0 and 35).Control variables:
- (2)
- Number of employees: Total number of employees as a measure of the size of a firm.
- (3)
- Industry: NACE’s codes introduced as a covariate to control for the activity sector.Consequently, our model includes nine predictors and a covariate.
3.4.2. Results
The main descriptive statistics of the variables used in this model are presented in Table 4 and Table 5.
Regarding the descriptive statistics shown in Table 4 and Table 5, the variables used cannot be considered as following a normal distribution, and, consequently, standard errors and Wald statistics were calculated using Robust methods (Sandwich) implemented in Latent Gold 4®. The optimum Bayesian Information Criterion (BIC) and the R2 were applied to determine the number of classes (see Table 6). The BIC values decrease until they achieve the minimum value for the Four-Class Regression model to continue increasing for models with a higher number of classes, suggesting that the Four-Class Regression model best fits the data. The overall R2 for the Four-Class Regression model was 0.8294, which can be considered appropriate.
Table 7 shows which variables contribute towards the hypotheses testing. Hypotheses 1 and 2 are supported by the results, since some Marketing and main IT aspects explain the firm’s heterogeneity. To specifically understand how these variables contribute towards explaining heterogeneity by capturing the difference between parameters across classes, and, consequently, to specifically understand how capabilities explain efficiency, it is necessary to analyse the results in depth. The p-values for the Wald statistics for all predictors (see Table 3) are lower than 0.05, which indicates that predictors significantly explain differences across classes. The “Wall (=)” statistic indicates that these differences in the betas are significant across the classes identified, which means that all four groups exhibit significantly different levels of these coefficients, that is, that there is heterogeneity across classes that can be explained by a number of the variables proposed. Regarding the marketing variables, it seems that distribution is not significant in explaining heterogeneity, whereas advertising is only significant at the 10% level. These two variables are directly observable by competitors and are consequently easy to imitate, and hence it is not surprising that differences in efficiency are easy to capture in terms of distribution and advertising efforts. In addition, previous studies have shown that the effect of advertising on a firm’s results needs a different analysis to capture the effect of advertising on the level of intangible resources, by differentiating between the instantaneous effect and the persistent effect [70]. At the same time, all IT indicators present significant values in the explanation of a firm’s heterogeneity as does market dynamism, and present a weak effect of firm’s size (number of employees) and industry (covariate). The size of the classes obtained is: Class 1 = 154 firms, Class 2 = 88 firms, Class 3 = 58 firms, and Class 4 = 29 firms.
Once heterogeneity has been identified, certain questions arise: What levels of efficiency have these firms achieved over time? What variables, and, consequently, what decisions and resources explain and can improve their level of efficiency?
Table 8 shows how Class 1 and Class 2 present the lowest mean values of efficiency. However, there is a key difference between them. Class 1 represents all those SMEs that need to adjust their size to increase their flexibility [11,26]. In Spain, from 2011 to early 2015, 17,283 SMEs in the industrial sector had disappeared, all of which were manufacturers, which represents more than 12% of the total number of SMEs [6]. Probably, those firms that disappeared were the ones that failed to adapt their size to be effective.
Class 2 SMEs appear to have a certain potential to increase their level of efficiency by investing in IT capabilities and disinvesting in R&D and Advertising. The efficiency of Class 2 SMEs is neither affected by the market nor by its number of employees. In this class, it is possible to identify those manufacturing SMEs that can increase their level of efficiency by developing IT capabilities as affordable practices in changing markets [73], and by developing digital assets to better serve costumers instead of following other strategies [40,74]. Specifically, firms in this class should develop their own CPSO or fully outsource CPSO, and they should train their employees to be able to implement it in a proper way (ITE).
Class 3 presents the second-best value for efficiency (TE mean = 0.3954). Firms identified in this class are those that take and advantage of recessive markets, seeing in them an opportunity to improve performance by developing new concepts through R&D investment [10]. They seem to be doing well in managing their resources and capabilities and the only variable that could help them to increase their efficiency is the investment in R&D. Firms with specific capabilities for recessive markets deserve better attention in the management literature [23]. During recessions, there are certain firms that are more proactive in marketing activities than others and they perceive recessions as an opportunity that finally leads them to achieve better results.
Finally, Class 4 SMEs include the most efficient group of firms. Interestingly, investment in R&D decreases the efficiency of firms in Class 4, while positive effects are observed for the investment in IT, specifically when this is partially outsourced, that is, these firms can be even more efficient if they invest in IT by emphasising the relevance of IT capabilities to increase their efficiency [40,74].
4. Discussion
In this work, a longitudinal data analysis is presented that studies the effect of key strategies that have been extensively related in the literature with firms’ success. The results from current theories from marketing and management are compared with the real results of the firms over time, in an effort to provide certain insights into how to manage resource allocation and the development of capabilities to efficiently compete in the marketplace.
Our contribution to the literature is that we offer a procedure for the analysis of firms’ heterogeneity in their capabilities and how to classify certain firms in accordance with their capabilities with the aim to identify which capabilities are best for each firm depending on the class of firms they belong to. Our procedure is based on two interesting techniques, Data Envelopment Analysis and Latent Class Regression. In our empirical analysis, a large dataset of manufacturing SMEs is analysed that supports our hypotheses and theoretical discussion. One way to identify firms that need to invest and develop certain capabilities instead of others is presented. This work provides a first step in the understanding of some previous results concerning the impact of resources and capabilities on firms’ performance since efficiency is considered an antecedent of performance.
While the literature has most often measured firm capabilities using subjective measures, or measures that are specific to the problem under analysis [34], in this study, DEA is used to capture the ability of resources transforming into outcomes. Other methods for the estimation of firm-specific effects have been used in previous studies, such as panel data and stochastic frontier analysis [32,59,75,76], however, DEA presents a set of advantages over other methods used in previous studies, such as not imposing any functional form or distributional assumptions on the error term, and it fitted well for the available data in this work. Nevertheless, future studies testing the suitability of the combined stochastic frontier analysis to estimate firm capabilities, followed by an LCC analysis, would be desirable when appropriate data become available.
To avoid the effects of time and sector, we recommend the use of a different DEA model for each sector and for each time period to be carried out. Several previous studies use dummy variables for sector and time [59], but such studies assume that the technology and the combination of inputs to produce outputs is the same for all sectors and only allows for constant deviations from the average frontier per sector, whereas, in this work, each sector in each time period is allowed to present a different technology. Furthermore, the practice of using dummy variables may lead to heterogeneity being masked as inefficiency [77].
Interestingly, results show that average efficiency has steadily been increasing since the first signs of recession appeared (from 2006 onwards) while at the same time the economy shows decreasing levels of technical change over time. Several conclusions could be drawn from these results. On the one hand, it implies that only the best and most efficient firms survive adverse economic situations, thereby producing an apparent increase in average efficiency. On the other hand, it seems that firms that survive need to struggle to become more efficient, thereby moving closer to the best-practice frontier, in an effort to survive economic recessions.
Our results extend the analysis of [78] by showing that even firms with low levels of TE can present a potential for survival if the firm develops certain capabilities. This work not only offers a new procedure to capture firm’s heterogeneity with regard to the capabilities they possess in operating efficiently in dynamic environments, but this approach also makes it possible to identify the classes of firms that develop capabilities with an exclusive combination of resources. That is, class members develop capabilities in a similar way, whereas members of other classes develop capabilities differently, and hence the resulting classification presents within-class homogeneity and interclass heterogeneity. From this analysis, it is possible to conclude that there is a nominal variable that classifies manufacturing SMEs that are analysed based on market conditions, firms’ marketing, and on IT capability effects on efficiency. This procedure extends previous work which, despite including non-linear relationships among the variables proposed, remained unable to classify firms in within-class homogeneous groups that could explain firm capabilities [79]. Information Technology capabilities are more difficult to imitate than Marketing capabilities [47] and therefore it is not surprising that IT capabilities present stronger effects in the explanation of firm heterogeneity than Marketing capabilities. The effect of advertising and distribution strategies should be analysed using new approaches such as serial analysis [70]. Future analyses of the data from the firms’ Strategic Business Units may show how these firms perform and develop their competitive advantages based on Marketing capabilities [80].
The nominal variable identified four different classes of firms. Firstly, there is a class of firms that need more flexibility in reducing its size (Class 1). There is a set of firms that take advantage of recessions through the identification and achievement of the opportunities of the crisis (Class 3). There is a third class of firms that can increase their levels of efficiency by developing IT capabilities. Finally, there is another class of firms, which are the most efficient: those that should better invest in IT capabilities while at the same time should not invest in in R&D (Class 4). The identification of these four groups allows firms to implement the theories discussed in the literature, although in the discussion of the previous literature certain approaches can appear contradictory since results show that all of the approaches are possible strategies in a recession, but are not valid for everyone. The contribution lies in the identification of those firms that should apply the most efficient strategies. For some firms, it is necessary to reduce their size, while, for others, to invest in IT capabilities [80]. One limitation of the dataset used in this work is that it fails to allow the identification of firms; the firms in the dataset used are identified with an ID number, which prevents direct contact with the firms in the various classes requesting detailed information, such as whether they have a specific market orientation or any other characteristics that can be observed using surveys [18,45,68]. This represents a limitation of the current study, but the method proposed to capture heterogeneity can be used along with other datasets such as COMPUSTAT where firms can be identified and contacted to better understand capabilities and where firms of a more diverse nature can be included in the sample.
Market conditions have been included as a result of environmental forces, that is, of a recession. Nevertheless, the concept of dynamic capabilities has not been specifically studied. The reason is that the speed of the changes produced in the market is not observed, thereby making it impossible to conclude whether markets are moderate or intensively dynamic [28]. Future research in this vein could provide a better understanding of how firms adapt to these changes by developing dynamic capabilities. The present study presents data from times of prosperity, stability, and recession (as shown in Figure 2) and it seems that firms have developed higher levels of efficiency due to the crisis, which implies that they are capable of adapting to changes in the environment [22]. Further research should focus on the study of the level of dynamism of these capabilities, and on the identification of those firms that respond to changes faster than others, and on the effect of this dynamism on long-term efficiency. The present study also calls for an improvement in the method available for the analysis of mixture models (LC) and repeated measures. Although packages such as Mplus® (Muthén & Muthén, Los Angeles, CA, USA) allow the inclusion of Structural Equation Models with non-linear effects and mediators with LC, there is no evidence in the literature that these models can be applied with repeated measures. Further research should explore methods to study how capabilities interact and mediate the apparition of efficiency.
5. Conclusions
In this work, a new procedure is offered for the analysis of firms’ heterogeneity with respect to the capabilities they possess; these capabilities are the key to achieving sustainable firms able to survive economic recessions. The most relevant conclusion from the results is that the investment in certain capabilities does not necessarily lead to better outcomes, but that it depends of each specific firm. Firms can be classified into different classes and, depending on the type of firms, some capabilities explain the results better than others, and firms can improve their levels of efficiency by investing in the specific resources that benefits them the most. Interestingly, most of the firms analysed would not achieve a competitive advantage by investing in R&D in recessive markets: less than 20% of the firms in the sample analysed (Class 3) could increase their efficiency by increasing their investment in R&D. The majority of firms, the remaining 80%, need to develop more flexibility or capabilities to improve their efficiency. Another intriguing conclusion is that, contrary to the common assumption that lower size provides more flexibility, only half of our sample should decrease its size to become more efficient during the recession analysed. The key implication for managers consists of being able to identify the class their firm belongs to and to design a proper integration of the resources. However, how to adapt to economic changes can be easily altered over time. For example, in 2011, before the intervention of the Spanish Government, manufacturing SMEs had the opportunity to develop efficiency by reducing their size and with the appropriate integration of resources. After the intervention, market conditions changed again and firms had to reorganise their strategies. Since at least 80% of the firms analysed were unprepared to make the most of the opportunities offered by a recession, they had to manage their firms without a clear understanding of their future policies.
It is challenging to solve the problem regarding the best way to manage public resources, and, unfortunately, the integration of public resources based on efficiency-enhancing key actors in the economy remains far from being put into practice.
Acknowledgments
This work has been financed by the Ministry of Economy and Competence of Spain through Project ECO2016-75047-P and by Junta de Andalucía through project SEJ1933.
Author Contributions
María A. Ramón-Jerónimo conceived and designed the initial conceptual model but both authors developed the conceptual model and analysed the data; María A. Ramón-Jerónimo and Inés Herrero contributed with analysis tools; and María A. Ramón-Jerónimo and Inés Herrero worked on the final version of the submitted manuscript.
Conflicts of Interest
The authors declare no conflict of interest. The founding sponsors had no role in the design of the study; in the collection, analyses, or interpretation of data; in the writing of the manuscript, and in the decision to publish the results.
Appendix A
The original work of [81] defined the Malmquist index between a given base time period (e.g., time s) and time period t as:
where and St is the production possibility set (i.e., technologically feasible and technically efficient output set for a given input set) in time period t. These distance functions can be calculated based on DEA models. As there are two possible Malmquist measures, that is, being based on period s or on period t, the index is defined as the geometric average of the two indexes [82]:
This index is calculated for each observation and then averaged over time. Malmquist indexes can be decomposed into two components (for a detailed methodology of the decomposition see [82]):
where the first factor in brackets represents the change in efficiency, and the second factor measures changes in the efficient frontier between time t and time s.
The calculation of the Malmquist indexes requires the dataset to be balanced. Since there were an insufficient number of firms operating over all time periods for all sectors considered to be able to estimate the Malmquist indexes, the procedure of [64] was followed. The methodology used in [64] is analogous to the original work of [81]. Their procedure uses two DEA models per observation. In the first model, the technical efficiency of each unit has to be estimated by comparing each unit with those operating in the same time period. The ratio of the average efficiency in each time period over the average efficiency reached in the base time period provides an estimate of the efficiency change between that time period and the base time period. This measure represents a good approximation to efficiency changes in the case of unbalanced panel data. The firms are then made efficient by radially expanding their outputs using the expansion rate obtained in the DEA model. In the following step, a new DEA model is run to which the efficient units are compared to the units in the base time period. In this case, the resulting inefficiency would be due, not to the firm itself, but to the changes in the efficient frontiers over time, that is, due to changes in productivity of the year at which the unit operates and the productivity in the base time period. Consequently, it represents the technical change with respect to the base time period. This procedure has been followed in this work because it presents the advantage that it allows the calculation of the Malmquist indexes even if the dataset is not balanced. For a detailed explanation of this procedure, see [64].
References
- Simón-Moya, V.; Revuelto-Taboada, L.; Ribeiro-Soriano, D. Influence of economic crisis on new SME survival: reality or fiction? Entrep. Reg. Dev. 2016, 28, 157–176. [Google Scholar] [CrossRef]
- Instituto Nacional de Estadística (INE). Quince Años del Sector Industrial (1993–2007). 2010. Available online: http://www.ine.es/revistas/cifraine/0110.pdf (accessed on 23 November 2017).
- Instituto Nacional de Estadística (INE). Contabilidad Nacional Trimestral de España. Base 2008 Cuarto Trimestre de 2011. 2012. Available online: http://www.ine.es/prensa/cntr0411.pdf (accessed on 23 November 2017).
- Instituto Nacional de Estadística (INE). Encuesta Industrial de Empresas Año 2012. Available online: http://www.ine.es/prensa/np825.pdf (accessed on 23 November 2017).
- Instituto Nacional de Estadística (INE). Encuesta Anual de Comercio. Estadística de Productos en el Sector Comercio. 2013. Available online: http://www.ine.es/prensa/np826.pdf (accessed on 23 November 2017).
- Minsiterio de Industria, Energía y Turismo. Estadísticas PYME, Evolución e Indicadores; Ministerio de Industria, Energía y Turismo: Madrid, Spain, 2016. [Google Scholar]
- Instituto Nacional de Estadística (INE). Encuesta Industrial de Empresas 2011. Available online: http://www.ipyme.org/publicaciones/estadisticas-pyme-2015.pdf (accessed on 23 November 2017).
- Filipe, S.F.; Grammatikos, T.; Michala, D. Forecasting distress in European SME portfolios. J. Bank. Financ. 2016, 64, 112–135. [Google Scholar] [CrossRef]
- OECD. Financing SMEs and Entrepreneurs 2017: An OECD Scoreboard; OECD: Paris, France, 2017. [Google Scholar]
- Battisti, M.; Deakins, D. The relationship between dynamic capabilities, the firm’s resource base and performance in a post-disaster environment. Int. Small Bus. J. 2017, 35, 78–98. [Google Scholar] [CrossRef]
- Pal, R.; Torstensson, H.; Mattila, H. Antecedents of organizational resilience in economic crises—An empirical study of Swedish textile and clothing SMEs. Int. J. Prod. Econ. 2014, 147, 410–428. [Google Scholar] [CrossRef]
- Murray, J.Y.; Gao, G.Y.; Kotabe, M. Market orientation and performance of export ventures: the process through marketing capabilities and competitive advantages. J. Acad. Mark. Sci. 2011, 39, 252–269. [Google Scholar] [CrossRef]
- Sirmon, D.G.; Hitt, M.A.; Ireland, R.D. Managing firm resources in dynamic environments to create value: looking inside the black box. Acad. Manag. Rev. 2007, 32, 273–292. [Google Scholar] [CrossRef]
- Feng, H.; Morgan, N.A.; Rego, L.L. Firm capabilities and growth: the moderating role of market conditions. J. Acad. Mark. Sci. 2017, 45, 76–92. [Google Scholar] [CrossRef]
- Balasubramanian, N.; Lieberman, M.B. Industry learning environments and the heterogeneity of firm performance. Strateg. Manag. J. 2010, 31, 390–412. [Google Scholar] [CrossRef]
- Chen, C.M.; Delmas, M.A.; Lieberman, M.B. Production frontier methodologies and efficiency as a performance measure in strategic management research. Strateg. Manag. J. 2015, 36, 19–36. [Google Scholar] [CrossRef]
- Vermunt, J.K.; Magidson, J. Technical Guide for Latent GOLD 4.0: Basic and Advanced; Statistical Innovations Inc.: Belmont, MA, USA, 2005. [Google Scholar]
- Trainor, K.J.; Rapp, A.; Skinner, L.; Schillewaert, N. Integrating information technology and marketing: An examination of the drivers and outcomes of e-Marketing capability. Ind. Mark. Manag. 2011, 40, 162–174. [Google Scholar] [CrossRef]
- Wade, M.; Hulland, J. The resource-based view and information systems research: review, extension, and suggestions for future research. MIS Q. 2004, 28, 107–142. [Google Scholar] [CrossRef]
- Bromiley, P.; Rau, D. Towards a practice-based view of strategy. Strateg. Manag. J. 2014, 35, 1249–1256. [Google Scholar] [CrossRef]
- Rumelt, R.P. How much does industry matter? Strateg. Manag. J. 1991, 12, 167–185. [Google Scholar] [CrossRef]
- Barney, J.; Wright, M.; Ketchen, D.J. The resource-based view of the firm: Ten years after 1991. J. Manag. 2001, 27, 625–641. [Google Scholar] [CrossRef]
- Wright, M.; Roper, S.; Hart, M.; Carter, S. Joining the dots: Building the evidence base for SME growth policy. Int. Small Bus. J. 2015, 33, 3–11. [Google Scholar] [CrossRef] [Green Version]
- Misangyi, V.F.; Elms, H.; Greckhamer, T.; Lepine, J.A.; Misangyi, V.; Elms, H.; Greckhamer, T.; Lepine, J.A. A new perspective on a fundamental debate: A multilevel approach to industry, corporate, and business unit effects. Strateg. Manag. J. 2006, 27, 571–590. [Google Scholar] [CrossRef]
- Barney, J.B. Firm resources and sustained competitive advantage. J. Manag. 1991, 17, 99–120. [Google Scholar] [CrossRef]
- Pucci, T.; Nosi, C.; Zanni, L. Firm capabilities, business model design and performance of SMEs. J. Small Bus. Enterp. Dev. 2017, 24, 222–241. [Google Scholar] [CrossRef]
- Teece, D.J.; Pisano, G.; Shuen, A.M.Y. Dynamic capabilities and strategic management. Strateg. Manag. J. 1997, 18, 509–533. [Google Scholar] [CrossRef]
- Eisenhardt, K.M.; Martin, J.A. Dynamic capabilities: What are they? Strateg. Manag. J. 2000, 21, 1105–1121. [Google Scholar] [CrossRef]
- Ray, G.; Barney, J.B.; Muhanna, W.A. Capabilities, business processes, and competitive advantage: Choosing the dependent variable in empirical tests of the resource-based view. Strateg. Manag. J. 2004, 25, 23–37. [Google Scholar] [CrossRef]
- Day, G.S. Closing the marketing capabilities gap. J. Mark. 2011, 75, 183–195. [Google Scholar] [CrossRef]
- Anouliès, L. Heterogeneous firms and the environment: a cap-and-trade program. J. Environ. Econ. Manag. 2017, 84, 84–101. [Google Scholar] [CrossRef]
- Alguacil, M.; Martí, J.; Orts, V. Firm heterogeneity and the market scope of European multinational activity. Int. Rev. Econ. Financ. 2017, 51, 645–659. [Google Scholar] [CrossRef]
- Kamakura, W.A.; Ramón-Jerónimo, M.A.; Vecino-Gravel, J.D. A dynamic perspective to the internationalization of small-medium enterprises. J. Acad. Mark. Sci. 2012, 40, 236–251. [Google Scholar] [CrossRef]
- Erhardt, K. On home market effects and firm heterogeneity. Eur. Econ. Rev. 2017, 98, 316–340. [Google Scholar] [CrossRef]
- Martín-barroso, D.; Núñez-serrano, J.A.; Velázquez, F.J. Firm heterogeneity and the accessibility of manufacturing firms to labour markets. J. Transp. Geogr. 2017, 60, 243–256. [Google Scholar] [CrossRef]
- Bhatt, G.D.; Grover, V. Types of information technology capabilities and their role in competitive advantage: An empirical study. J. Manag. Inf. Syst. 2005, 22, 253–277. [Google Scholar] [CrossRef]
- Lim, J.; Stratopoulos, T.C.; Wirjanto, T.S. Path dependence of dynamic information technology capability: An empirical investigation. J. Manag. Inf. Syst. 2012, 28, 45–84. [Google Scholar] [CrossRef]
- Whitaker, J.; Mithas, S.; Krishnan, M.S. Organizational Learning and Capabilities for Onshore and Offshore Business Process Outsourcing. J. Manag. Inf. Syst. 2011, 27, 11–42. [Google Scholar] [CrossRef]
- Furr, N.; Kapoor, R. Capabilities, technologies, and firm exit during industry shakeout: Evidence from the global solar photovoltaic industry. Strateg. Manag. J. 2017, in press. [Google Scholar] [CrossRef]
- Rice, J.; Galvin, P.; Martin, N. A configuration-based approach to integrating dynamic capabilities and market transformation in small and medium-sized enterprises to achieve firm performance. Int. Small Bus. J. 2015, 33, 231–253. [Google Scholar] [CrossRef]
- Kotabe, M.; Srinivasan, S.S.; Aulakh, P.S. Multinationality and marketing capabilities. J. Int. Bus. Stud. 2002, 33, 79–97. [Google Scholar] [CrossRef]
- Krasnikov, A.; Jayachandran, S. The Relative impact of marketing, research-and-development, and operations capabilities on firm performance. J. Mark. 2008, 72, 1–11. [Google Scholar] [CrossRef]
- Nath, P.; Nachiappan, S.; Ramanathan, R. The impact of marketing capability, operations capability and diversification strategy on performance: A resource-based view. Ind. Mark. Manag. 2010, 39, 317–329. [Google Scholar] [CrossRef]
- Achrol, R.S. Evolution of the marketing organization: New forms for turbulent environments. J. Mark. 1991, 55, 77–93. [Google Scholar] [CrossRef]
- Vorhies, D.W.; Orr, L.M.; Bush, V.D. Improving customer-focused marketing capabilities and firm financial performance via marketing exploration and exploitation. J. Acad. Mark. Sci. 2011, 39, 736–756. [Google Scholar] [CrossRef]
- Sawy, O.A.E.; Pavlou, P.A. IT-Enabled business capabilities for turbulent environments. MIS Q. Exec. 2008, 7, 139–150. [Google Scholar]
- Wang, N.; Liang, H.; Zhong, W. Resource structuring or capability building? An empirical study of the business value of information technology. J. Manag. Inf. Syst. 2012, 29, 325–367. [Google Scholar] [CrossRef]
- Ayabakan, S.; Bardhan, I.R.; Zheng, Z.E. A data envelopment analysis approach to estimate IT-enabled production capability. MIS Q. 2017, 41, 189–205. [Google Scholar] [CrossRef]
- Leem, C.S.; Kim, I. An integrated evaluation system based on the continuous improvement model of IS performance. Ind. Manag. Data Syst. 2004, 104, 115–128. [Google Scholar] [CrossRef]
- Johnston, B.H.R.; Vitale, M.R. Creating competitive advantage with interorganizational information systems. MIS Q. 1988, 153–165. [Google Scholar] [CrossRef]
- Langdon, C.S. Designing information systems capabilities to create business value: A theoretical conceptualization of the role of flexibility and integration. J. Database Manag. 2006, 17, 1–18. [Google Scholar] [CrossRef]
- Ravichandran, T.; Lertwongsatien, C. Effect of information systems resources and capabilities on firm performance: A resource-based perspective. J. Manag. Inf. Syst. 2005, 21, 237–276. [Google Scholar] [CrossRef]
- Mclaren, T.S.; Head, M.M.; Yuan, Y.; Chan, Y.E. A multilevel model for measuring fit between a firm’s competitive strategies and information systems capabilities. MIS Q. 2011, 35, 909–929. [Google Scholar] [CrossRef]
- Herrero, I. Different approaches to efficiency analysis. An application to the Spanish trawl fleet operating in Moroccan waters. Eur. J. Oper. Res. 2005, 167, 257–271. [Google Scholar] [CrossRef]
- Barney, J.; Arikan, A.M. The resource-based view: Origins and implications. In Handbook of Strategic Management; Hitt, M.A., Freeman, R.E., Harrison, J.S., Eds.; Blackwell Publishers: Oxford, UK, 2001. [Google Scholar]
- Charnes, A.; Cooper, W.W.; Rhodes, E. Evaluating program and managerial efficiency: An application of data envelopment analysis to program follow through. Manag. Sci. 1981, 27, 668–697. [Google Scholar] [CrossRef]
- Oh, S.C.; Hildreth, A.J. Estimating the technical improvement of energy efficiency in the automotive industry-stochastic and deterministic frontier benchmarking approaches. Energies 2014, 7, 6196–6222. [Google Scholar] [CrossRef]
- Tsekouras, K.; Chatzistamoulou, N.; Kounetas, K. Productive performance, technology heterogeneity and hierarchies: Who to compare with whom. Int. J. Prod. Econ. 2017, 193, 465–478. [Google Scholar] [CrossRef]
- Aldieri, L.; Vinci, C. The role of technology spillovers in the process of water pollution abatement for large international firms. Sustainability 2017, 9, 868. [Google Scholar] [CrossRef]
- Kook, S.H.; Kim, K.H.; Lee, C. Dynamic Technological Diversification and Its Impact on Firms’ Performance: An Empirical Analysis of Korean IT Firms. Sustainbility 2017, 9, 1239. [Google Scholar] [CrossRef]
- Fundación de la Sociedad Estatal de Participaciones Industriales (SEPI). Presentación de la Encuesta de Estrategias Empresariales. Available online: https://www.fundacionsepi.es/investigacion/esee/en/spresentacion.asp (accessed on 23 November 2017).
- Charnes, A.; Cooper, W.W.; Rhodes, E. Measuring the efficiency of decision making units. Eur. J. Oper. Res. 1978, 2, 429–444. [Google Scholar] [CrossRef]
- Banker, R.D.; Charnes, A.; Cooper, W. Some models for estimating technical and scale inefficiencies in data envelopment analysis. Manag. Sci. 1981, 27, 1370–1382. [Google Scholar] [CrossRef]
- Pascoe, S.; Herrero, I. Estimation of a composite fish stock index using data envelopment analysis. Fish. Res. 2004, 69, 91–105. [Google Scholar] [CrossRef]
- Danneels, E. The process of technological competence leveraging. Strateg. Manag. J. 2007, 28, 511–533. [Google Scholar] [CrossRef]
- Vorhies, D.W.; Morgan, N.A. Benchmarking marketing capabilities for sustainable competitive advantage. J. Mark. 2005, 69, 80–94. [Google Scholar] [CrossRef]
- Wedel, M.; Kamakura, W.A. Market Segmentation; International Series in Quantitative Marketing; Springer: Boston, MA, USA, 2000; Volume 8, ISBN 978-1-4613-7104-5. [Google Scholar]
- Morgan, N.A.; Slotegraaf, R.J.; Vorhies, D.W. Linking marketing capabilities with profit growth. Int. J. Res. Mark. 2009, 26, 284–293. [Google Scholar] [CrossRef]
- Josephson, B.W.; Johnson, J.L.; Mariadoss, B.J. Strategic marketing ambidexterity: Antecedents and financial consequences. J. Acad. Mark. Sci. 2016, 44, 539–554. [Google Scholar] [CrossRef]
- Wang, F.; Zhang, X.S.; Ouyang, M. Does advertising create sustained firm value? The capitalization of brand intangible. J. Acad. Mark. Sci. 2009, 37, 130–143. [Google Scholar] [CrossRef]
- Luo, X.; de Jong, P.J. Does advertising spending really work? The intermediate role of analysts in the impact of advertising on firm value. J. Acad. Mark. Sci. 2012, 40, 605–624. [Google Scholar] [CrossRef]
- Fang, E.; Zou, S. Antecedents and consequences of marketing dynamic capabilities in international joint ventures. J. Int. Bus. Stud. 2009, 40, 742–761. [Google Scholar] [CrossRef]
- Morgan-thomas, A. Rethinking technology in the SME context: Affordances, practices and ICTs. Int. Small Bus. J. 2016, 34, 1122–1136. [Google Scholar] [CrossRef]
- Coreynen, W.; Matthyssens, P.; Van Bockhaven, W. Boosting servitization through digitization: Pathways and dynamic resource configurations for manufacturers. Ind. Mark. Manag. 2017, 60, 42–53. [Google Scholar] [CrossRef]
- Ferrero-Ferrero, I.; Fernández-Izquierdo, M. ángeles; Muñoz-Torres, M. J. The effect of environmental, social and governance consistency on economic results. Sustainability 2016, 8, 1005. [Google Scholar] [CrossRef]
- Herrero, I. Agency costs, family ties, and firm efficiency. J. Manag. 2011, 37, 887–904. [Google Scholar] [CrossRef]
- Greene, W. Distinguishing between heterogeneity and inefficiency: Stochastic frontier analysis of the World Health Organization’s panel data on national health care systems. Health Econ. 2004, 13, 959–980. [Google Scholar] [CrossRef] [PubMed]
- Manello, A.; Calabrese, G.G. Firm’s survival, rating and efficiency: new empirical evidence. Ind. Manag. Data Syst. 2017, 117, 1185–1200. [Google Scholar] [CrossRef]
- Zang, J.; Li, Y. Technology analysis & strategic management technology capabilities, marketing capabilities and innovation ambidexterity. Technol. Anal. Strateg. Manag. 2017, 29, 23–37. [Google Scholar] [CrossRef]
- Srinivasan, S.S.; Rangaswamy, A.; Lilien, G.L. Turning adversity into advantage: Does proactive marketing during a recession pay off? Int. J. Res. Mark. 2005, 22, 109–125. [Google Scholar] [CrossRef]
- Caves, D.W.; Christensen, L.R.; Diewert, W.E. The economic theory of index numbers and the measurement of input, output, and productivity. Econometrica 1982, 50, 1393–1415. [Google Scholar] [CrossRef]
- Fare, R.; Grosskopf, S.; Norris, M.; Zhang, Z. Productivity growth, technical progress and efficiency change in Industrialised Countries. Am. Econ. Assoc. 1994, 84, 66–83. [Google Scholar] [CrossRef] [Green Version]
Figure 1.
Evolution of efficiency scores over time.
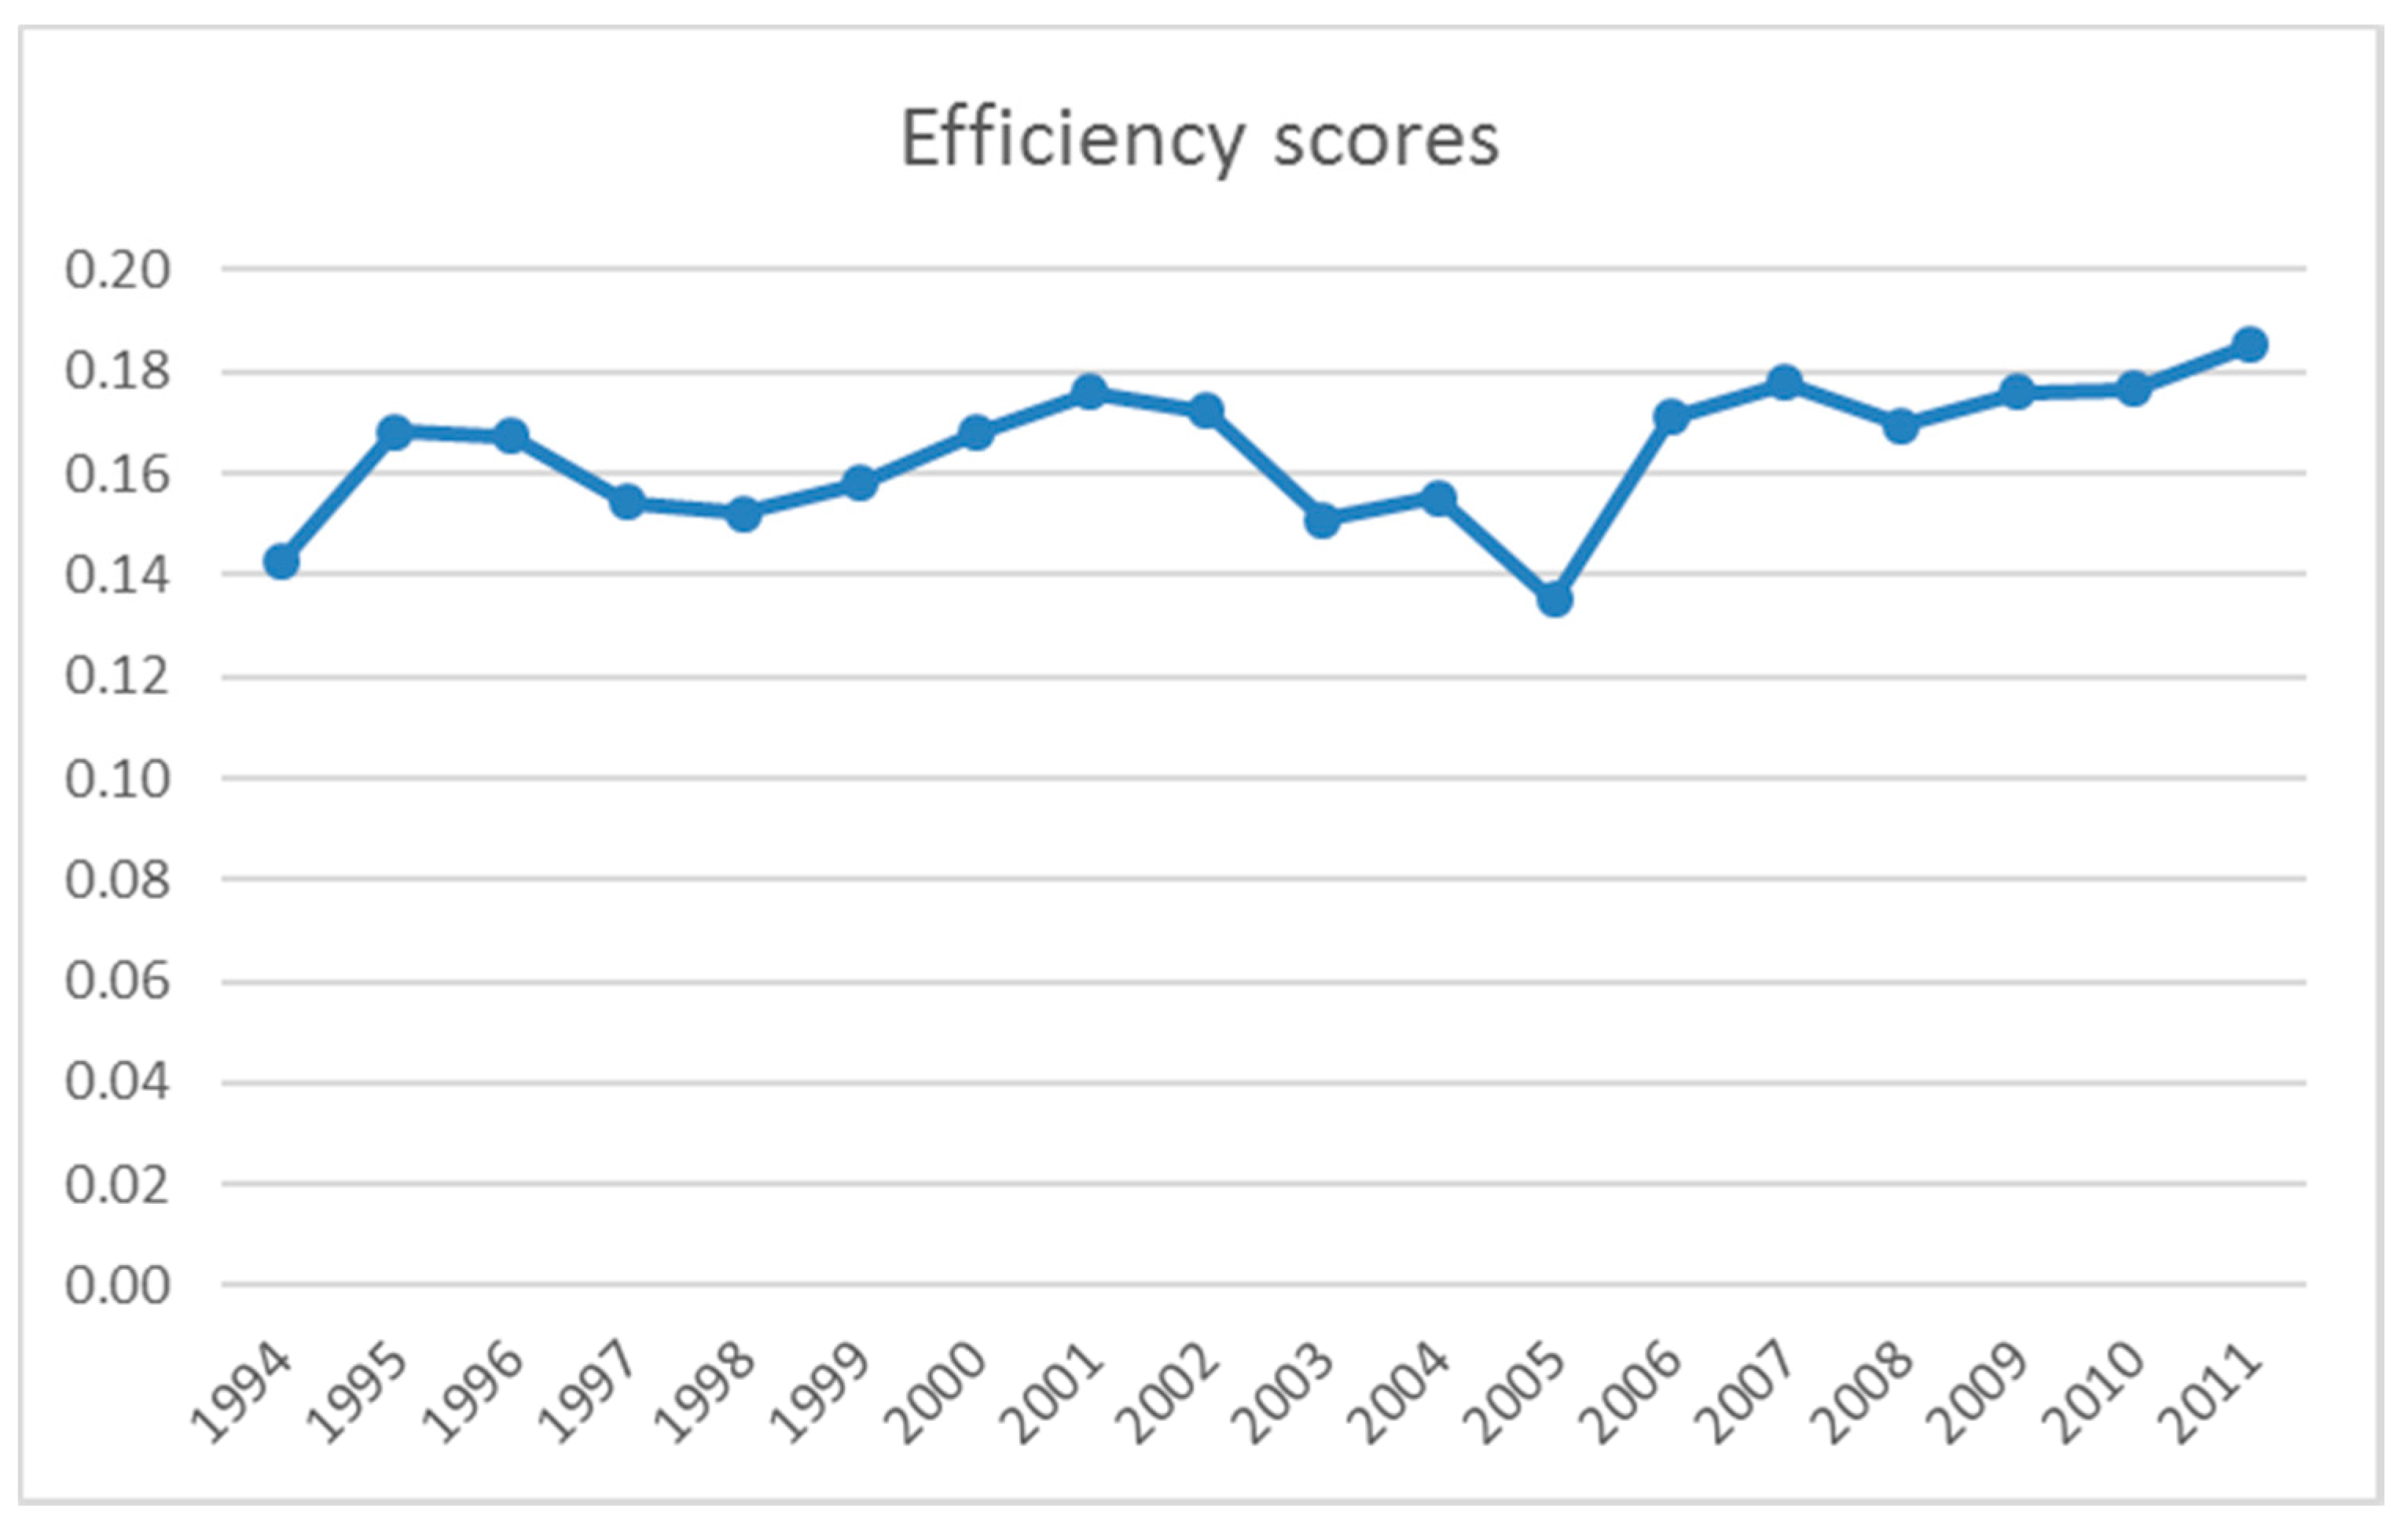
Figure 2.
Evolution of Technical change over time.

Figure 3.
Evolution of Malmquist index over time.
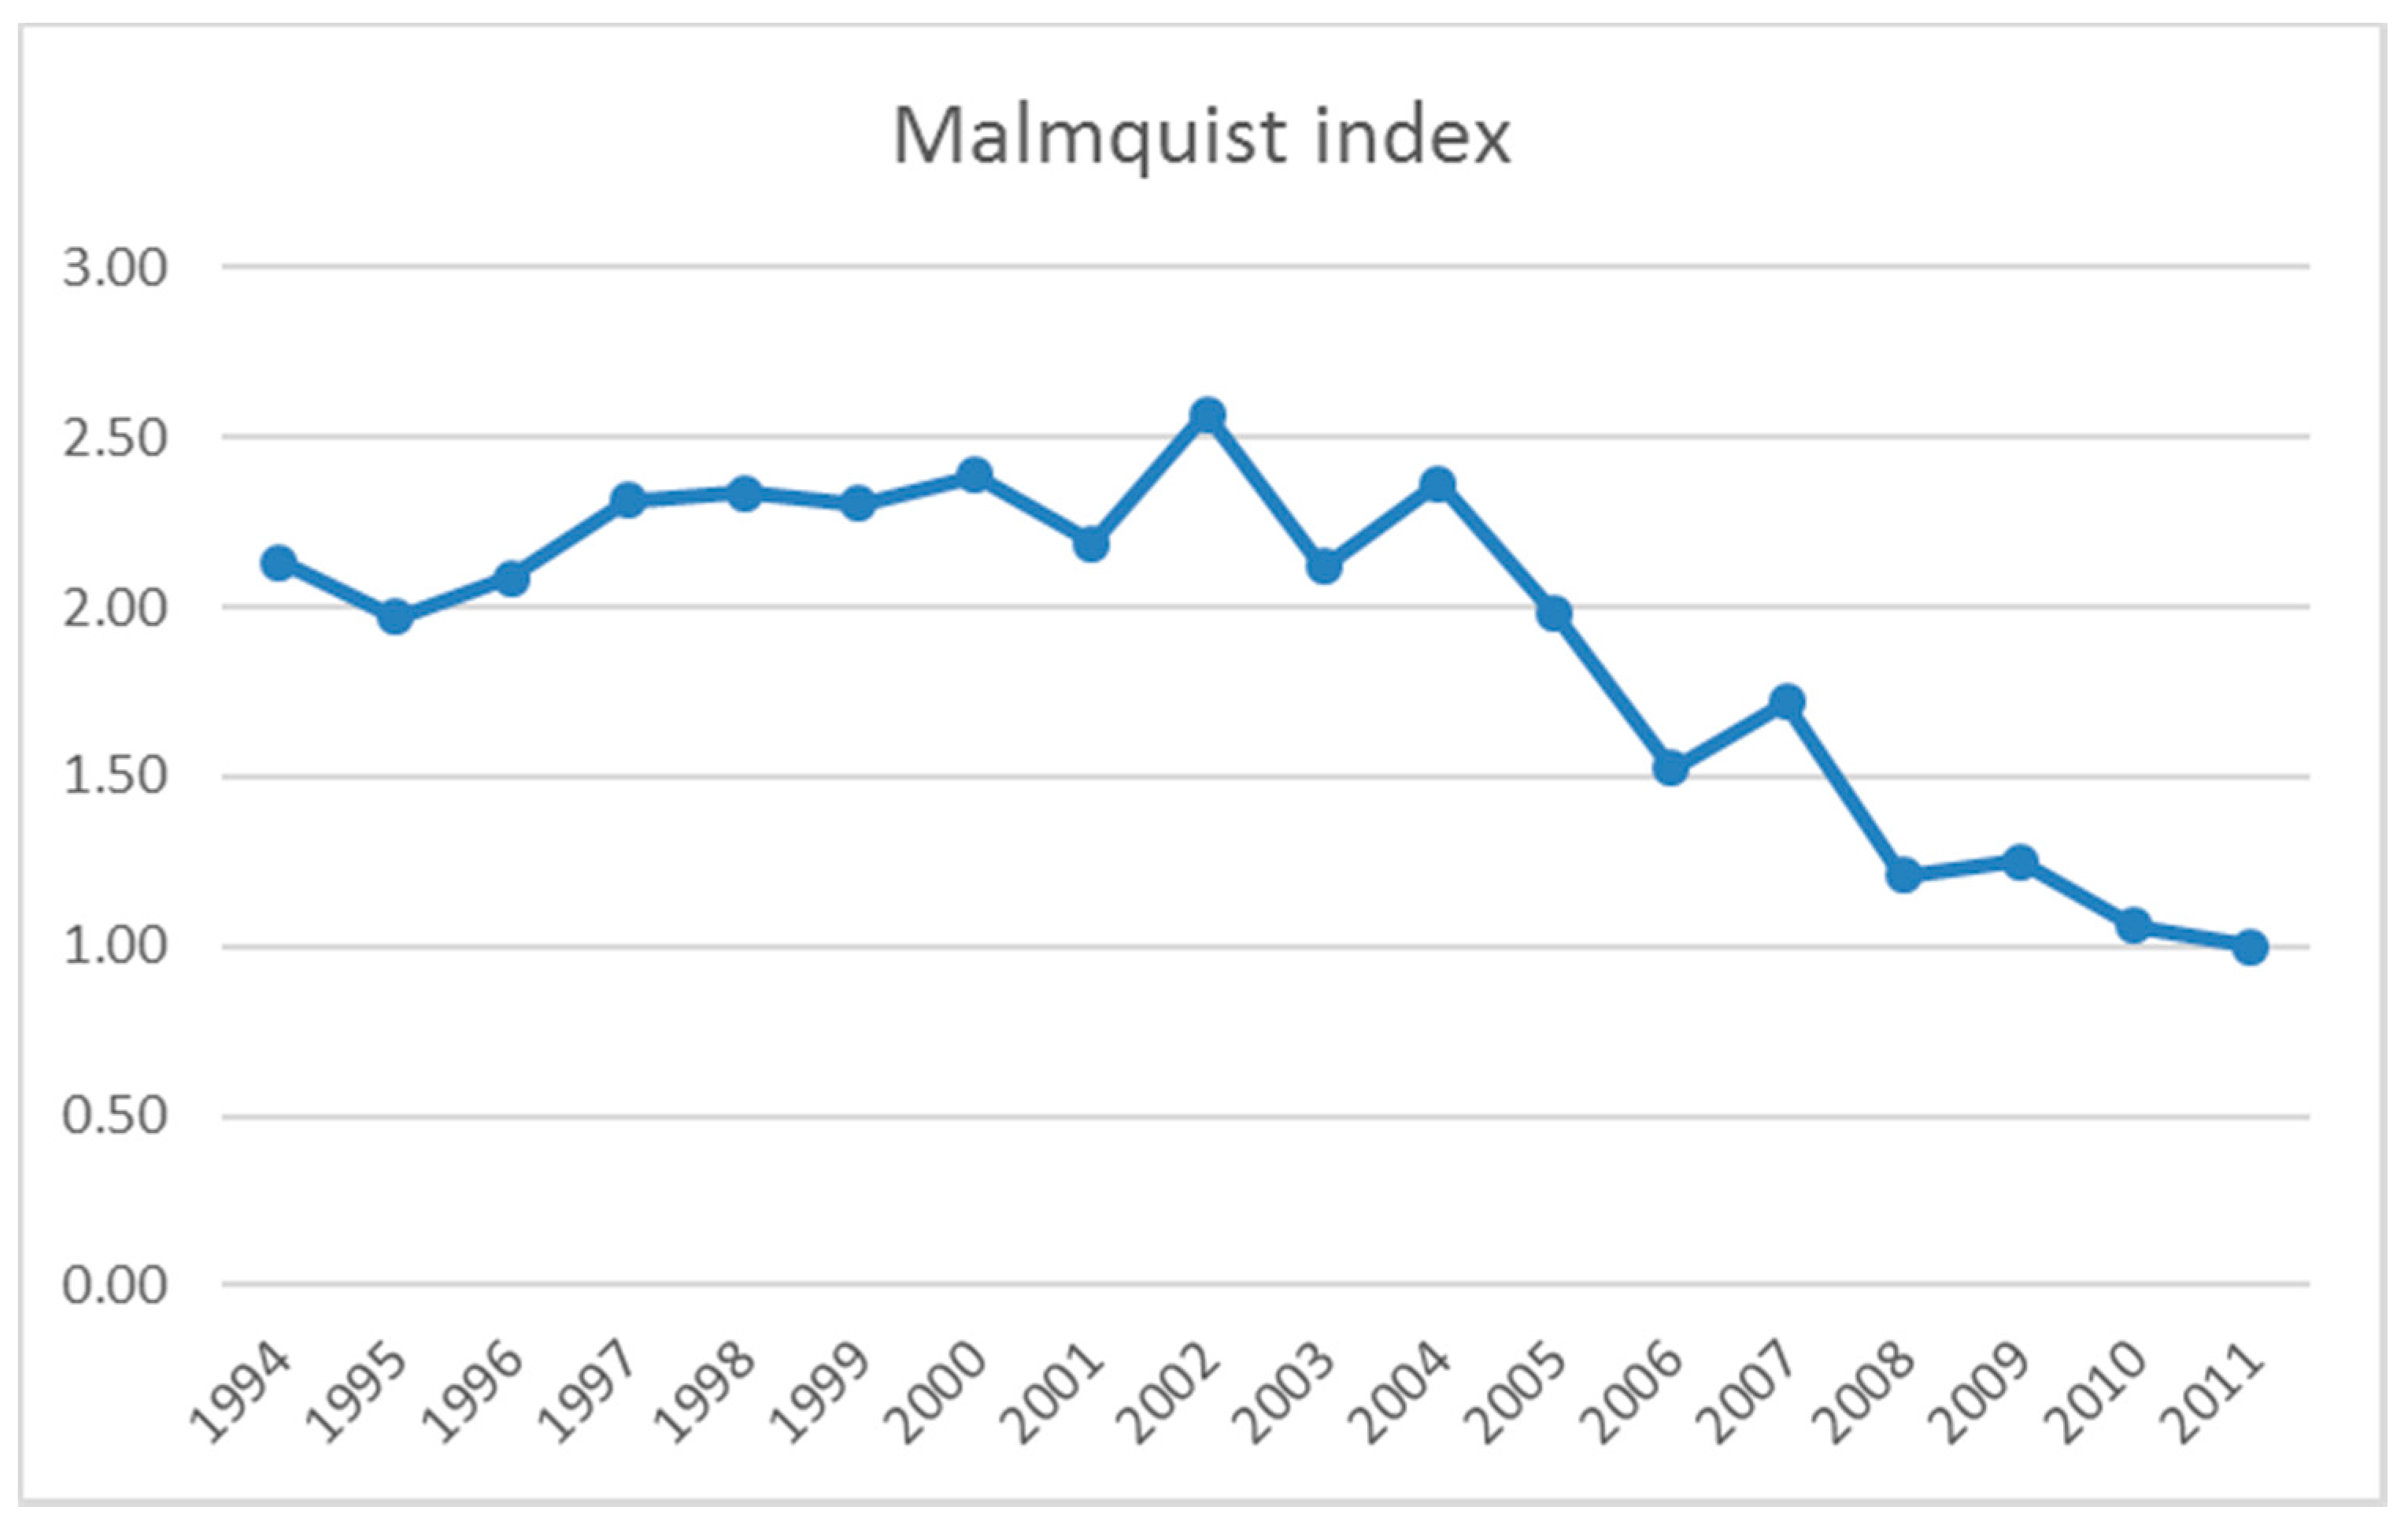

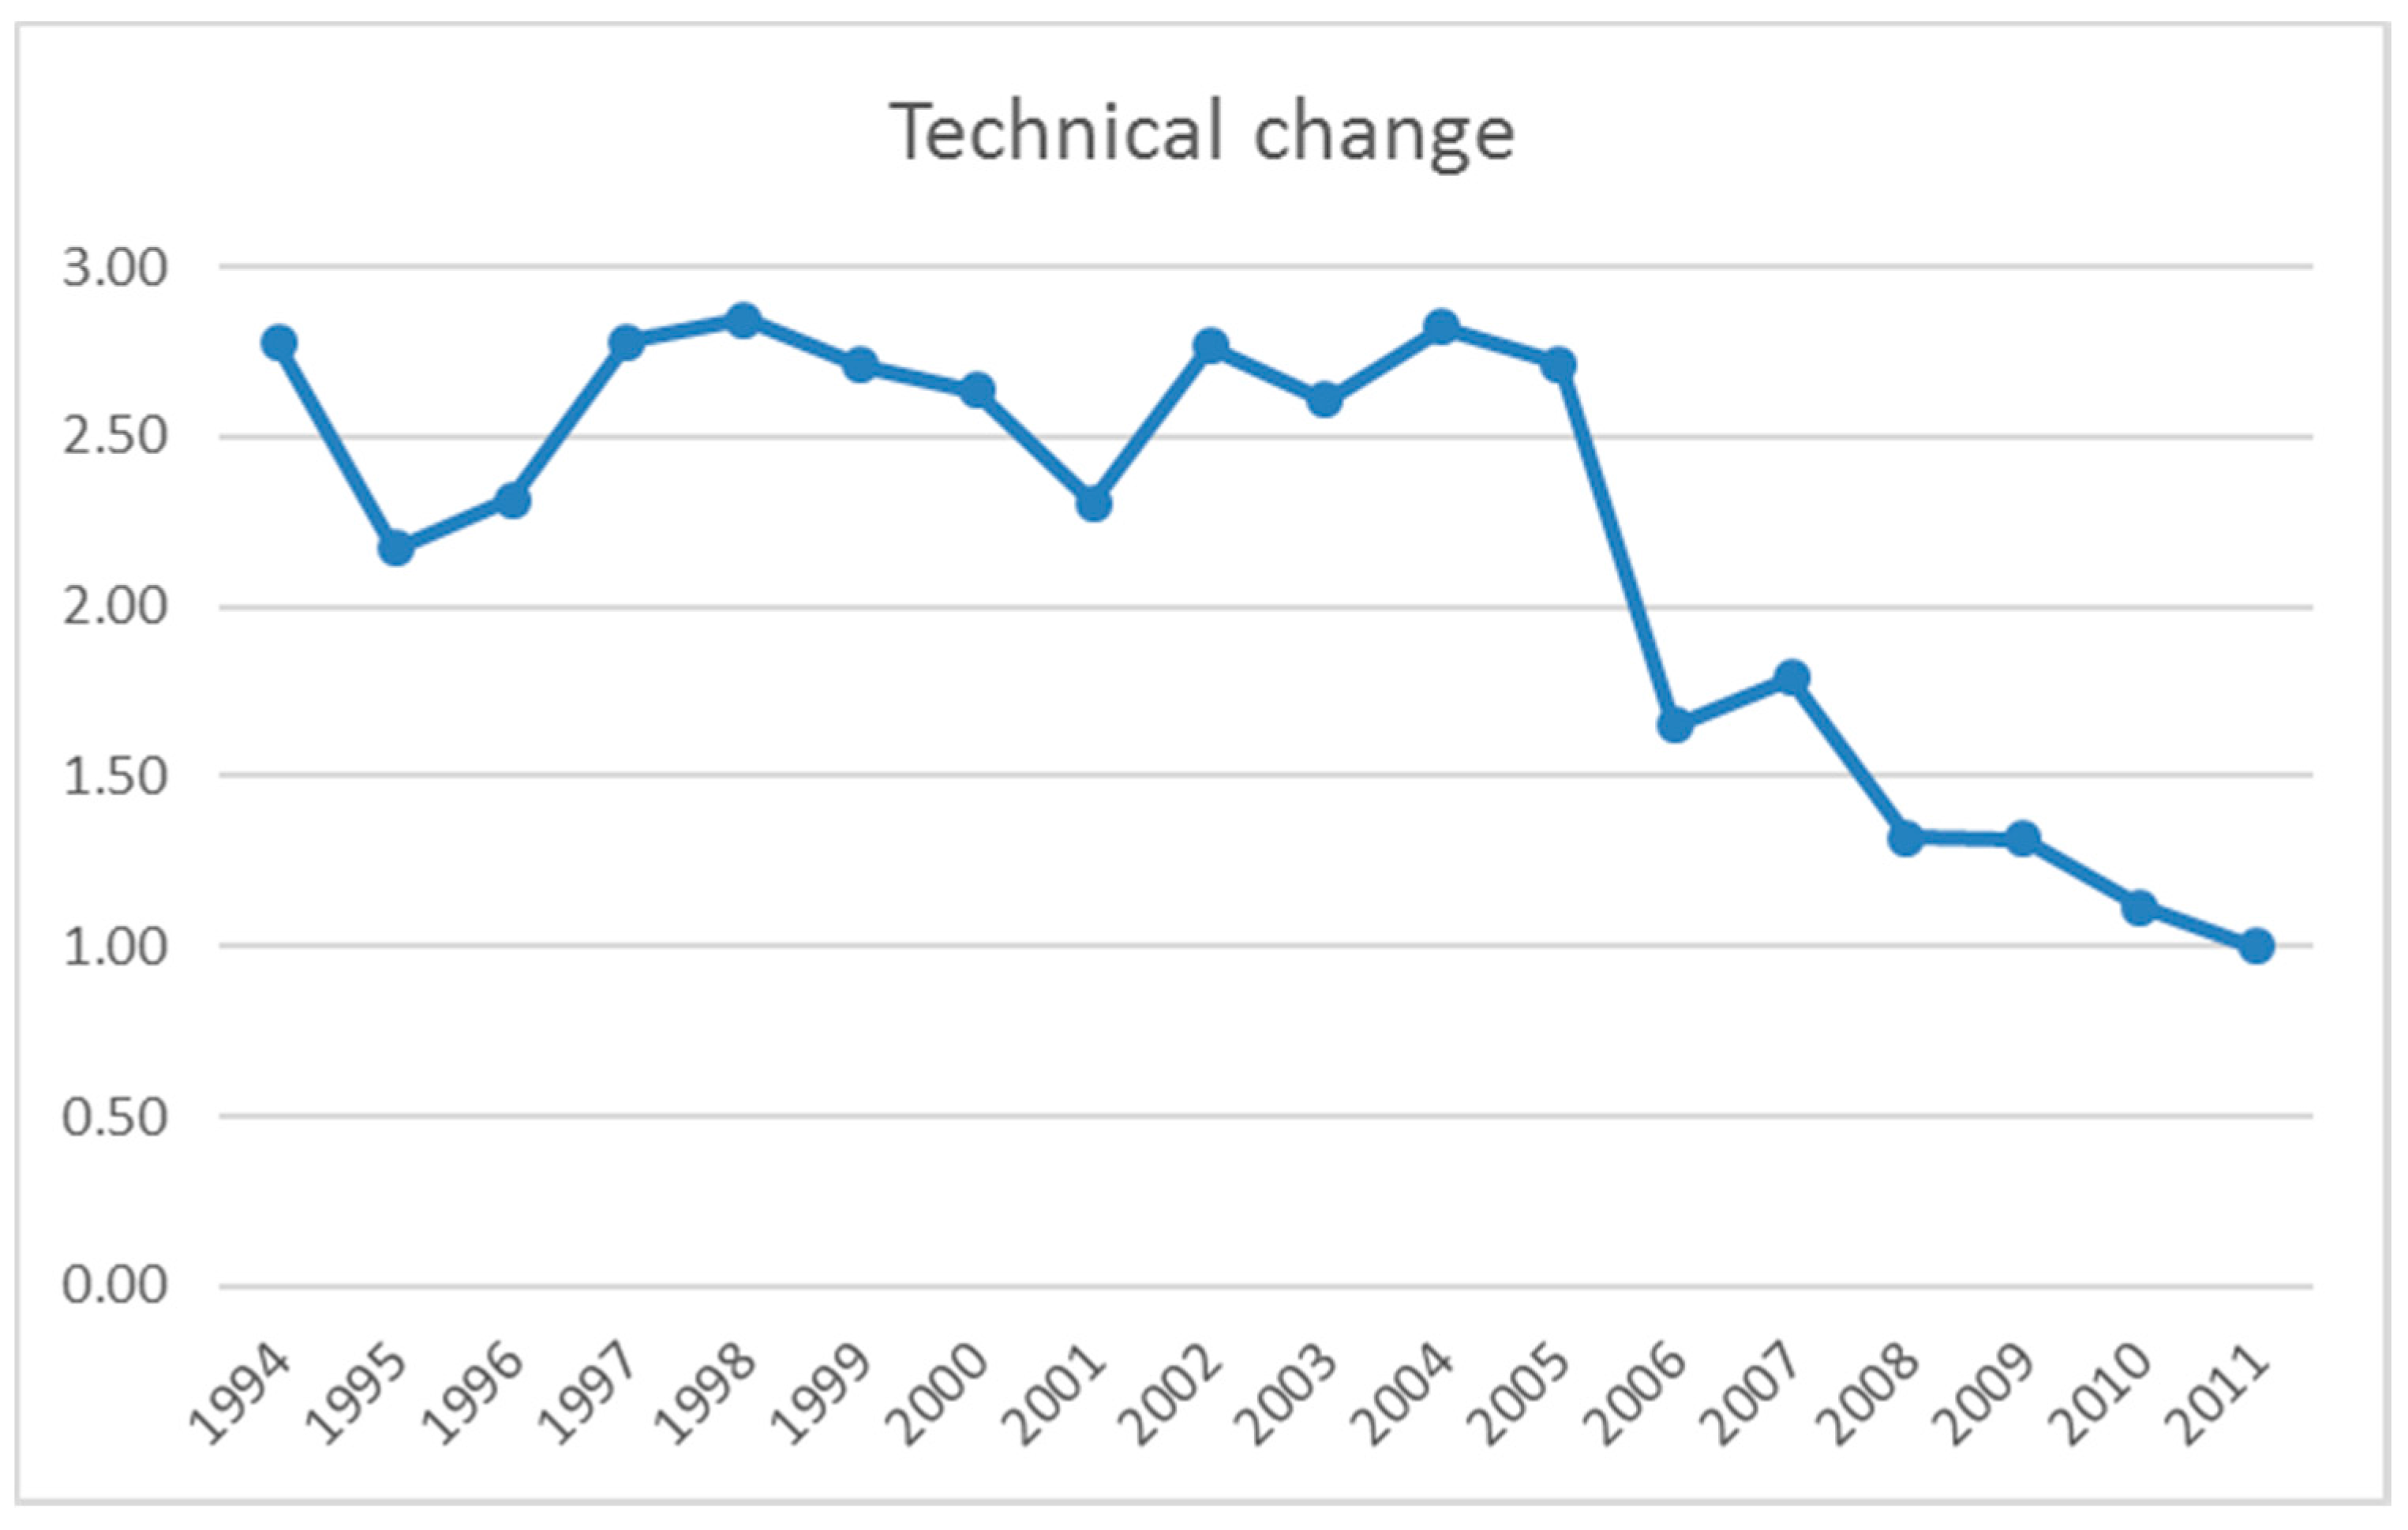
Table 1.
Average values of the variables involved in the efficiency analysis (in million euros) by sector (standard deviation in parenthesis).
Table 1.
Average values of the variables involved in the efficiency analysis (in million euros) by sector (standard deviation in parenthesis).
| Sector 1 | Sector 2 | Sector 3 | Sector 4 | Sector 5 | Sector 6 | Sector 7 | Sector 8 | Sector 9 | |
|---|---|---|---|---|---|---|---|---|---|
| Personal cost | 7.24 | 1.71 | 5.81 | 8.79 | 4.39 | 6.39 | 6.03 | 15.67 | 2.28 |
| (13.15) | (2.69) | (8.25) | (13) | (6.53) | (9.85) | (11.02) | (31.18) | (4.23) | |
| Buys | 37.02 | 3.56 | 17.93 | 26.68 | 12.64 | 20.75 | 16.86 | 73.03 | 4.46 |
| (73.06) | (5.55) | (28.09) | (57.06) | (21.34) | (43.55) | (39.48) | (249.1) | (9.06) | |
| Fixed assets | 21.87 | 1.78 | 18.91 | 18.72 | 8.72 | 20.02 | 6.82 | 27.08 | 3.36 |
| (50.69) | (3.74) | (37.41) | (34.13) | (19.22) | (52.27) | (15.44) | (73.38) | (7.83) | |
| Total sales | 26.74 | 29.88 | 24.13 | 35.08 | 23.89 | 34.02 | 30.61 | 51.8 | 37.65 |
| (57.83) | (69.53) | (40.03) | (83.95) | (48.9) | (70.43) | (57.78) | (173.56) | (77.29) | |
| Firm efficiency | 0.16 | 0.14 | 0.21 | 0.18 | 0.16 | 0.13 | 0.17 | 0.18 | 0.17 |
| (0.29) | (0.27) | (0.31) | (0.3) | (0.27) | (0.25) | (0.27) | (0.3) | (0.29) |
Table 2.
Descriptive statistics of the variables involved in the efficiency analysis (in euros).
| Mean | St Dev | Coefficient of Correlation | |||||
|---|---|---|---|---|---|---|---|
| 1 | 2 | 3 | 4 | 5 | |||
| Personnel cost | 6,541,366 | 13,625,365 | 1 | ||||
| Purchases | 24,275,792 | 86,647,063 | 0.820 ** | 1 | |||
| Fixed assets | 14,731,413 | 41,612,030 | 0.756 ** | 0.651 ** | 1 | ||
| Total sales | 32,686,775 | 80,832,275 | 0.015 | 0.000 | −0.002 | 1 | |
| Firm efficiency | 0.165 | 0.283 | −0.107 ** | −0.076 ** | −0.084 ** | 0.621 ** | 1 |
** Significant at the 1% level.
Table 3.
Evolution of average efficiency, technical change and Malmquist indexes.
| Year | Efficiency | Efficiency Change | Technical Change Index | Malmquist Index |
|---|---|---|---|---|
| 1994 | 0.142 | 0.768 | 2.773 | 2.131 |
| 1995 | 0.168 | 0.908 | 2.169 | 1.971 |
| 1996 | 0.167 | 0.903 | 2.314 | 2.089 |
| 1997 | 0.154 | 0.833 | 2.779 | 2.315 |
| 1998 | 0.152 | 0.822 | 2.844 | 2.336 |
| 1999 | 0.158 | 0.852 | 2.708 | 2.307 |
| 2000 | 0.168 | 0.907 | 2.633 | 2.388 |
| 2001 | 0.176 | 0.949 | 2.305 | 2.189 |
| 2002 | 0.172 | 0.929 | 2.764 | 2.569 |
| 2003 | 0.151 | 0.814 | 2.605 | 2.119 |
| 2004 | 0.155 | 0.838 | 2.819 | 2.363 |
| 2005 | 0.135 | 0.730 | 2.715 | 1.981 |
| 2006 | 0.171 | 0.922 | 1.652 | 1.524 |
| 2007 | 0.178 | 0.960 | 1.792 | 1.720 |
| 2008 | 0.170 | 0.915 | 1.321 | 1.208 |
| 2009 | 0.176 | 0.950 | 1.318 | 1.251 |
| 2010 | 0.176 | 0.952 | 1.114 | 1.061 |
| 2011 | 0.185 | 1.000 | 1.000 | 1.000 |
| Mean | 0.164 | 0.886 | 2.201 | 1.918 |
Table 4.
Descriptive statistics: Continuous and discrete variables.
| Mean | Std. Deviation | Skewness | Kurtosis | |
|---|---|---|---|---|
| Concentration of clients | 39.25 | 26.228 | 0.875 | −0.197 |
| Direct distribution/Sales | 59.90 | 42.214 | −0.385 | −1.604 |
| Advertising/Sales | 1.12 | 2.377 | 5.574 | 41.922 |
| R&D/Sales | 0.58 | 1.962 | 6.799 | 62.530 |
| ITE | 0.03 | 0.321 | 22.594 | 593.007 |
| Number of employees | 98.41 | 116.520 | 1.782 | 3.048 |
Table 5.
Descriptive statistics: nominal variables.
| Industry | Percentage | CAD | Percentage | CPSO | Percentage | Market Dynamism | Percentage |
|---|---|---|---|---|---|---|---|
| 1 | 12.5 | Yes | 36.9 | CPSO (No use) | 12.2 | Expansive | 21.1 |
| 2 | 14.6 | No | 63.1 | CPSO (Own firm) | 26.4 | Stable | 51.0 |
| 3 | 4.1 | CPSO (Partial outsourcing) | 31.7 | Recessive | 27.9 | ||
| 4 | 12.9 | CPSO (Full outsourcing) | 29.7 | ||||
| 5 | 4.5 | ||||||
| 6 | 15.7 | ||||||
| 7 | 15.5 | ||||||
| 8 | 6.7 | ||||||
| 9 | 13.4 |
Table 6.
Latent Class Regression analysis.
| LL | BIC(LL) | AIC(LL) | CAIC(LL) | Npar | Class. Err. | R² | |
|---|---|---|---|---|---|---|---|
| 1-Class Regression | −188.8471 | 458.8391 | 405.6943 | 472.8391 | 14 | 0.0000 | 0.0823 |
| 2-Class Regression | 1086.9606 | −1959.4671 | −2099.9213 | −1922.4671 | 37 | 0.0117 | 0.5651 |
| 3-Class Regression | 1448.4964 | −2549.2294 | −2776.9928 | −2489.2294 | 60 | 0.0324 | 0.6781 |
| 4-Class Regression | 1596.2170 | −2711.3613 | −3026.4341 | −2628.3613 | 83 | 0.0374 | 0.8294 |
| 5-Class Regression | 1650.9507 | −2687.5193 | −3089.9014 | −2581.5193 | 106 | 0.0469 | 0.8640 |
| 6-Class Regression | 1699.4008 | −2651.1101 | −3140.8016 | −2522.1101 | 129 | 0.0699 | 0.8919 |
| 7-Class Regression | 1758.8400 | −2636.6792 | −3213.6799 | −2484.6792 | 152 | 0.0562 | 0.9090 |
Table 7.
The overall model, parameters for testing the hypotheses.
| Predictors | Wald | Wald (=) |
|---|---|---|
| Marketing and R&D | ||
| Client concentration | 4.9187 | 4.8051 |
| Direct Distribution/Sales | 4.2702 | 4.0647 |
| Advertising/Sales | 8.3870 + | 7.2119 + |
| R&D/Sales | 18.3798 * | 17.8690 *** |
| Information Technologies (IT) | ||
| CAD | 13.4579 ** | 9.8252 * |
| CPSO | 22.5757 * | 18.0851 * |
| ITE | 357.0566 *** | 156.5547 * |
| Market Dynamism | 15.1900 + | 13.2427 * |
| Control variables | ||
| Number of employees | 8.626 + | 2.6571 |
| Industry (covariate) | 208.8811 *** | |
+ p < 0.10, * p < 0.05, ** p < 0.01, *** p < 0.001.
Table 8.
Results for each class.
| Class 1 | Class 2 | Class 3 | Class 4 | |
|---|---|---|---|---|
| R2 | 0.0968 | 0.5353 | 0.1809 | 0.3111 |
| Size | 0.4563 | 0.2650 | 0.1923 | 0.0864 |
| Mean Technical Efficiency | 0.0086 | 0.0669 | 0.3954 | 0.9432 |
| Parameters | Parameters | Parameters | Parameters | |
| Intercept | 0.0081 *** | 0.0741 *** | 0.2858 *** | 0.9121 *** |
| R&D and Marketing | ||||
| R&D/Sales | 0.0000 | −0.0049 *** | 0.0422 *** | −0.0092 * |
| Client concentration | 0.0000 | −0.0002 | 0.0010 | 0.0005 |
| Advertising/sales | −0.0001 | −0.0049 *** | −0.0051 | 0.0039 |
| Direct Distribution/sales | 0.0000 | 0.0001 | 0.0006 | 0.0004 |
| IT | ||||
| CAD (Yes) | −0.0012 + | 0.0085 + | −0.0519 * | −0.0114 |
| CPSO (No use) | −0.0021 + | 0.0034 | 0.0808 | −0.0065 |
| CPSO (Own firm) | 0.0008 | 0.0180 ** | −0.0087 | −0.0431 |
| CPSO (Partial outsourcing) | 0.0011 | −0.0020 | −0.0251 | 0.0394 ** |
| CPSO (Full outsourcing) | 0.0002 | −0.0194 *** | −0.0471 | 0.0101 |
| ITE | 0.0139 | 0.1697 *** | 0.0790 | 0.0430 |
| Market dynamism | ||||
| Expansive | −0.0008 | 0.0106 | −0.0106 | −0.0194 |
| Stable | 0.0002 | −0.054 | −0.0795 *** | 0.0078 |
| Recessive | 0.0006 | −0.0052 | 0.0901 *** | 0.0116 |
| Control variables | ||||
| Number of employees | −0.0000 *** | −0.0000 | 0.0003 | −0.0002 |
+ p < 0.10, * p < 0.05, ** p < 0.01, *** p < 0.001.
© 2017 by the authors. Licensee MDPI, Basel, Switzerland. This article is an open access article distributed under the terms and conditions of the Creative Commons Attribution (CC BY) license (http://creativecommons.org/licenses/by/4.0/).
Share and Cite
MDPI and ACS Style
Ramón-Jerónimo, M.A.; Herrero, I. Capturing Firms’ Heterogeneity through Marketing and IT Capabilities in SMEs. Sustainability 2017, 9, 2180. https://doi.org/10.3390/su9122180
AMA Style
Ramón-Jerónimo MA, Herrero I. Capturing Firms’ Heterogeneity through Marketing and IT Capabilities in SMEs. Sustainability. 2017; 9(12):2180. https://doi.org/10.3390/su9122180
Chicago/Turabian StyleRamón-Jerónimo, María A., and Inés Herrero. 2017. "Capturing Firms’ Heterogeneity through Marketing and IT Capabilities in SMEs" Sustainability 9, no. 12: 2180. https://doi.org/10.3390/su9122180
Note that from the first issue of 2016, this journal uses article numbers instead of page numbers. See further details here.