Spatiotemporal Dynamics of Beijing’s Urbanization Efficiency from 2005 to 2014


1
Center for Chinese Agricultural Policy, Institute of Geographic Sciences and Natural Resources Research, Chinese Academy of Sciences, Beijing 100101, China
2
Honours College, Capital Normal University, Beijing 100048, China
3
Geoinformatics Division, Department of Urban Planning and Environment, Royal Institute of Technology-KTH, 10044 Stockholm, Sweden
4
College of Resources and Environment, University of Chinese Academy of Sciences, Beijing 100049, China
5
Collaborative Innovation Centre for Baiyangdian Basin Ecological Protection and Jingjinji Regional Sustainable Development, Hebei University, Baoding 071002, China
*
Author to whom correspondence should be addressed.
Sustainability 2017, 9(12), 2190; https://doi.org/10.3390/su9122190
Submission received: 26 October 2017
/
Revised: 21 November 2017
/
Accepted: 21 November 2017
/
Published: 30 November 2017
(This article belongs to the Special Issue Regional Cooperation for the Sustainable Development and Management in Northeast Asia)
Abstract
:In the context of Beijing’s accelerated economic growth, a high urbanization rate and associated urban problems pose challenges. We collected panel data for the period 2005–2014 to examine the relationship between Beijing’s urbanization efficiency and economic growth rate as well as its spatial patterns of dynamic and static urbanization efficiency. Specifically, we developed a comprehensive index system for assessing Beijing’s economic growth rate and urbanization efficiency at the district (county) level. Economic level was selected as an indicator of the economic growth rate. Economic urbanization and consumption levels were selected as indicators of urbanization efficiency. We applied a sequential Malmquist total factor productivity index to estimate the dynamic urbanization efficiency and economic growth rate at the district/country level from 2005 to 2014. We measured Beijing’s static urbanization efficiency in 2014 using a data envelopment analysis model and assessed its spatiotemporal dynamics and urbanization efficiency pattern using a Getis–Ord General Gi index. The results indicated an overall average increase of 1.07% in the total factor urbanization efficiency (TFUE), with an average value of 0.91, while the total factor economic growth rate (TFEE) remained stable at an average value of 0.979. The low TFUE level evidently continues to significantly constrain TFEE. Both TFUE and TFEE levels in the Capital Function Core (CFC) area were significant, exhibiting high inputs and outputs, while these levels in the Urban Function Development (UFD), City Development Zone (CDZ), and Ecological Conservation Development (ECD) areas were below 1 for most periods, strongly indicating inefficient factor allocation. In view of this spatial pattern, TFUE’s regional spatial distribution appears remarkable, showing a decreasing trend from north to south in Beijing, excluding CFC areas. During the period 2005–2014, the CFC area and northeastern Beijing gradually developed into high urbanization efficiency cluster regions. The dominant factors accounting for the difference in total factor productivity indices between TFUE and TFEE were technical change (TC) and scale efficiency change (SEC), and the main factors driving the regional spatial distribution pattern for urbanization efficiency were TC and technical efficiency change (TEC). Accordingly, local governments should promote TC, SEC, and TEC to improve urbanization levels, with optimal strategies entailing strengthening policy support and encouraging investments in technology in UFD, CDZ, and ECD areas. Within Beijing, Dongcheng, Xicheng, Shijingshan, Mentougou, and Yanqing demonstrated effectively balanced static urbanization efficiency levels in 2014, whereas these levels in the city’s remaining 11 districts were not optimal, with extensive development. County governments should therefore promote efforts to reduce input redundancy and improve pure technical efficiency to maintain sustainable and steady development.
1. Introduction
Urbanization, which represents not just the level of economic development of a country but also a stage of social development, is considered the only route toward modernization [1,2,3]. Following its implementation of a reform and opening-up policy in 1978, China has pursued a strategy of rapid urbanization [2,4]. However, World Bank data indicate that China’s current per capita GDP is close to that of the United States in the 1970s, while its current urbanization level is around 50% [5], lagging behind the level of the United States in the 1970s by 10%.
There is thus an apparent contradiction between China’s high rate of urbanization and its relatively low level of urbanization [6]. In the process of rapid urbanization, Beijing’s floating population increased 12.1 times, which is the main factor accounting for its urbanization rate. Beijing’s urbanization rate is 86.2%, which is slightly lower than that of Shanghai. This pattern of urban sprawl causes a number of problems such as chaotic urban transportation, a deteriorating ecological environment, and the emergence of social problems [3,7] that lead to dysfunctional urban operations and irrational development. Moreover, a low level of urbanization efficiency restricts the level of social welfare and affects the impacts of development.
Charnes et al. [8] used a data envelopment analysis (DEA) model to evaluate the economic efficiency of 28 cities in China, thereby demonstrating that an urban system could be considered as a production system. Abdelfattah et al. [9] subsequently developed DEA model to assess the relative efficiency of 54 developing countries around the world. Morais and Camanho [10] also explored DEA as a means to assess and evaluate the performance of city managers in the promotion of urban quality of life of 206 European cities. The DEA model has grown into a powerful quantitative, analytical tool for evaluating performance, which has been successfully applied in Italian provincial capital cities [11], French provinces [12] and Spanish regions [13].
Because China is the largest developing country in the world, its urbanization efficiency has attracted considerable attention from scientists and policymakers in recent years [14,15,16]. Many scholars have subsequently applied a DEA model to examine urbanization efficiency represented by the total factor productivity (TFP) [17,18] or single factor productivity such as land [19]. They have attempted to achieve advances in areas such as index system establishment and model refinement [8,17], identify influence factors [20], and determine the evolution trend of urbanization efficiency [21]. Because of the availability of data at national or regional scales, empirical studies have mainly entailed a regional focus on, for example, the city clusters of the Yangtze River Delta [3]. Moreover, the relationships between cities and urban agglomeration in different provinces have received scant attention, even though an assessment of these relationships can provide scientific information to support decision makers in proposing effective strategies for promoting coordinated regional development.
The results of a survey conducted by the International Energy Agency in 2010 indicated that urban areas were responsible for 71% of global energy-related carbon dioxide (CO2) emissions and that this percentage was likely to increase with the continuation of the trend of accelerated urbanization [22,23]. Because urbanization has a significant impact on CO2 emissions [24,25,26], there is an urgent need to discuss the measurement and spatial patterns of urbanization efficiency in cities like Beijing. We therefore aimed to measure and identify the spatiotemporal pattern of Beijing’s urbanization efficiency as a test case. To accomplish this aim, we applied a sequential Malmquist TFP index to measure dynamic urbanization efficiency and the economic growth rate at the district/country level in Beijing between 2005 and 2014, and analyzed the spatial patterns and evolution trend of urbanization efficiency. Moreover, we calculated the value of static urbanization efficiency in 2014. This result could provide a scientific basis for sustainable urbanization and assist decision makers in formulating, applying, and evaluating Beijing’s urbanization policies.
2. Study Area
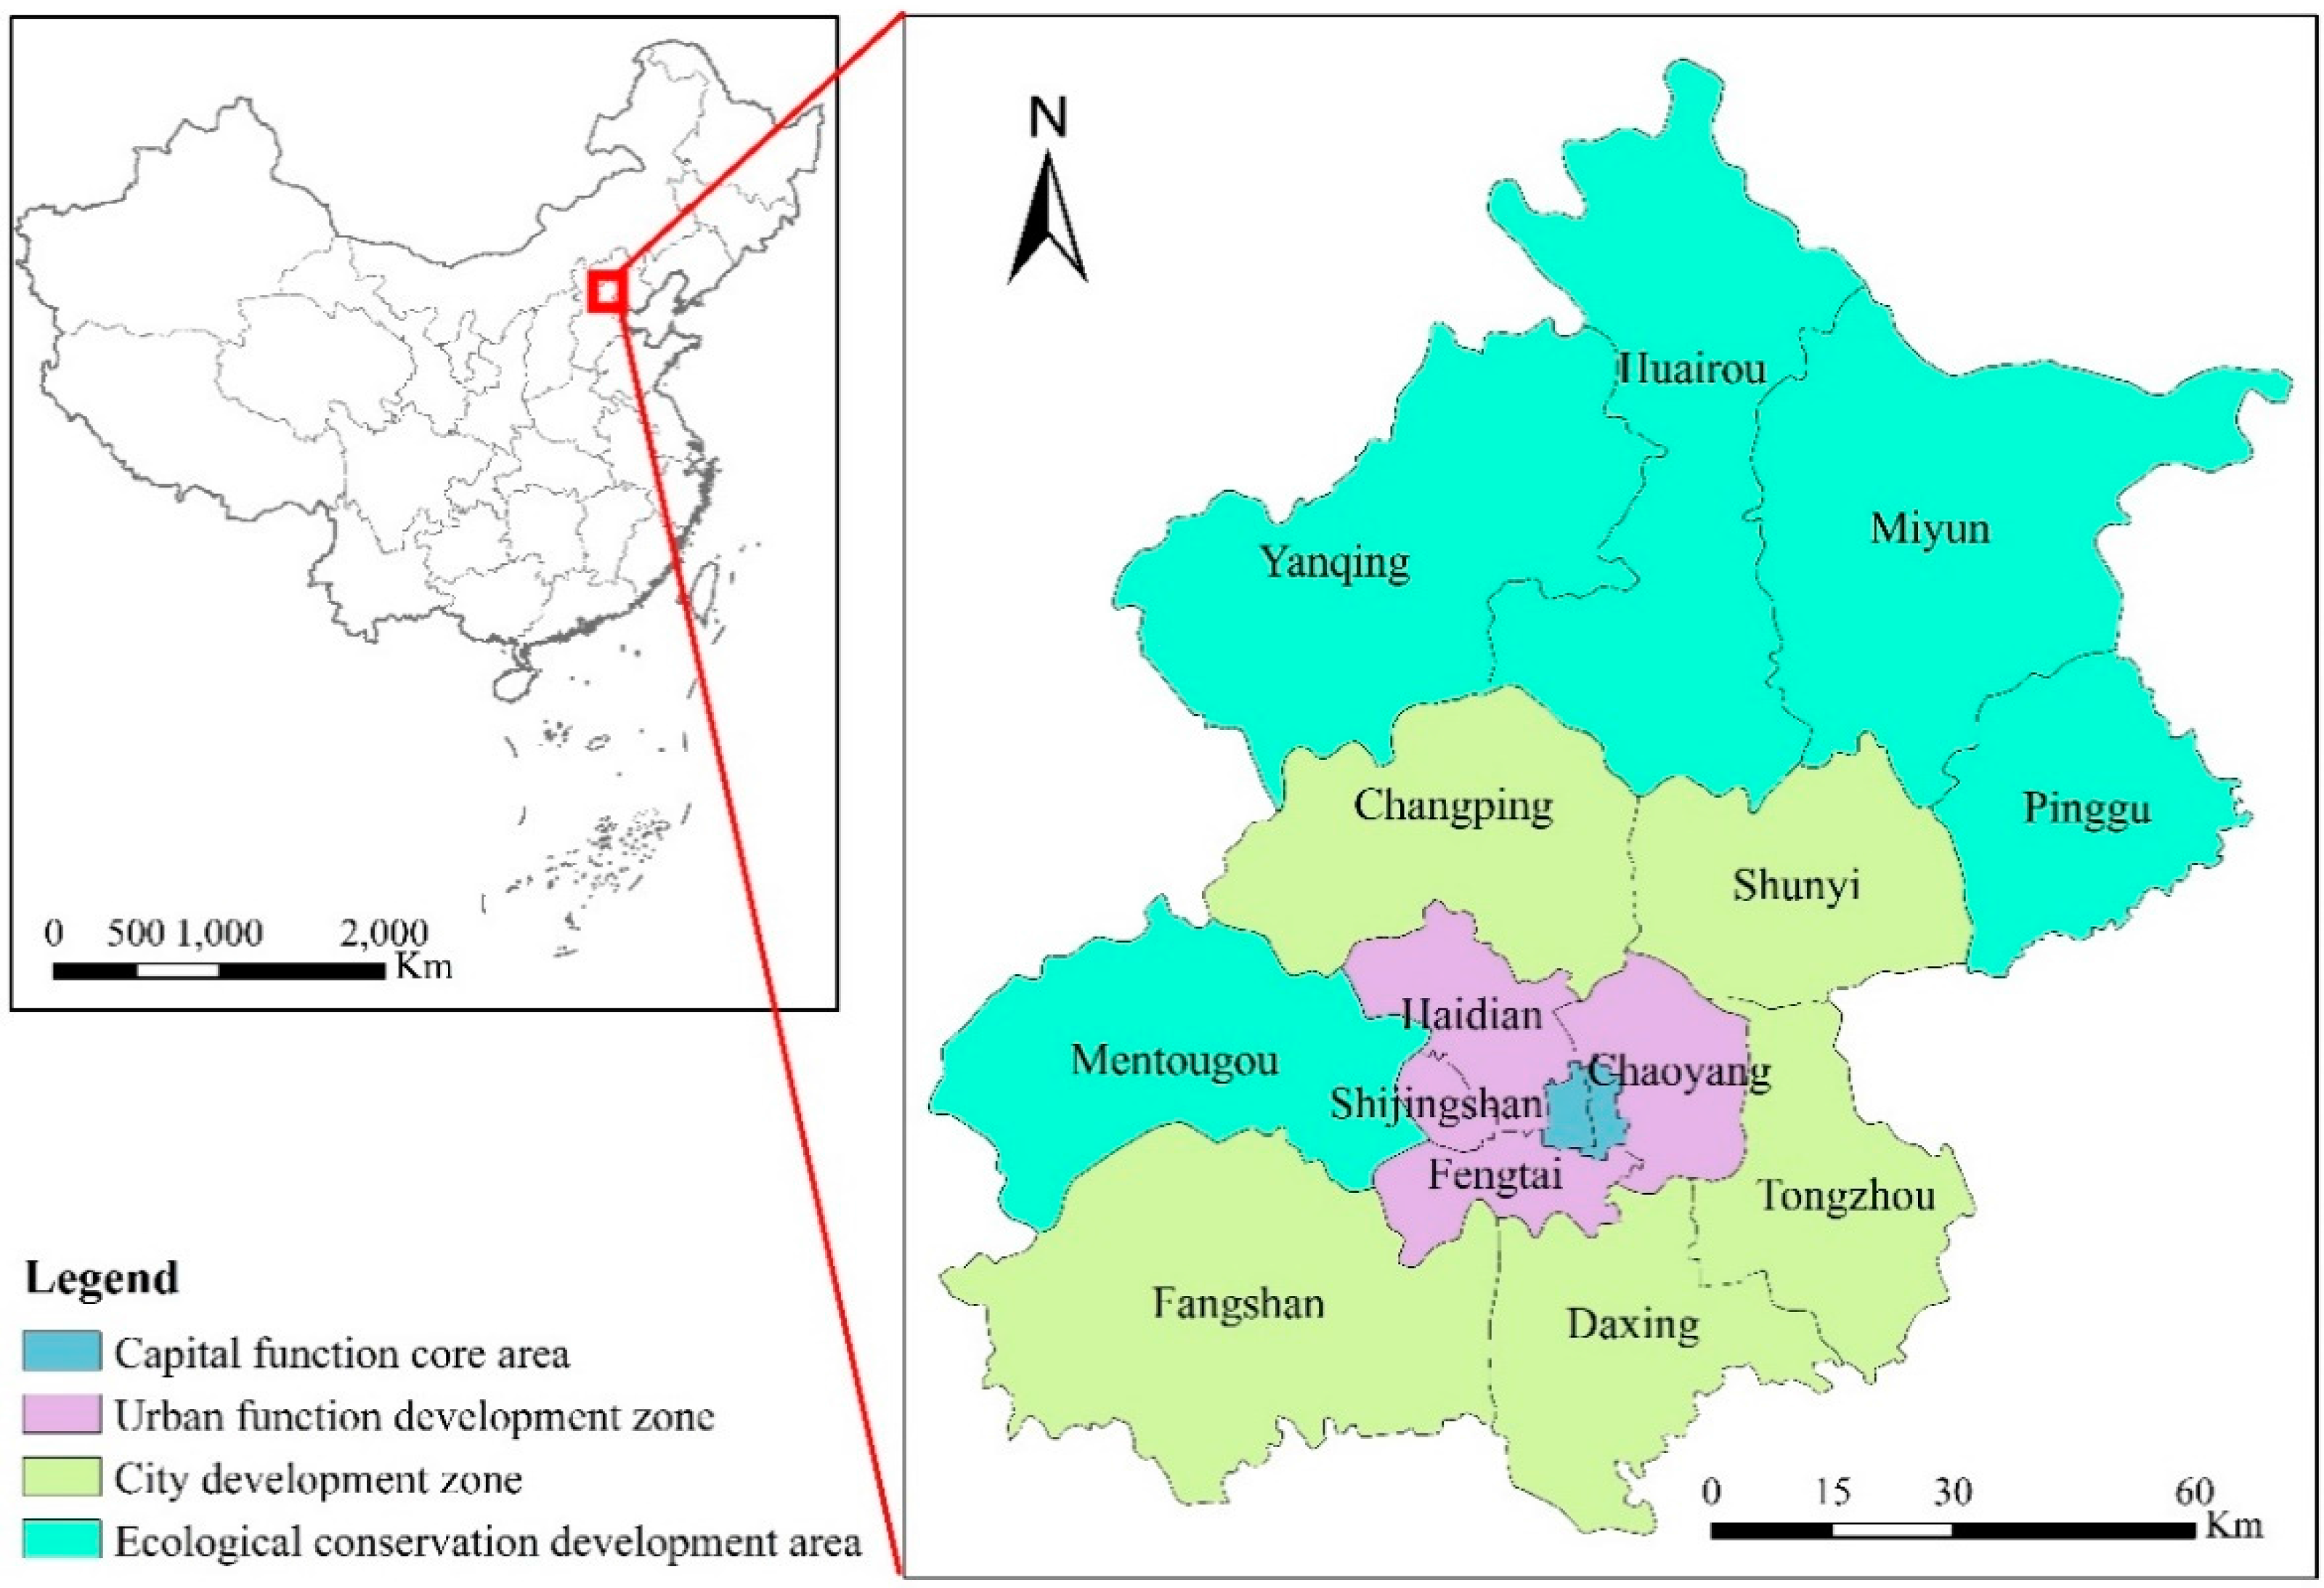
As China’s capital, Beijing is the national political and cultural center and also constitutes a hub for international exchanges and innovations in science and technology. It is situated in the northern part of the North China Plain, at 39°38′ N–40°51′ N and 115°25′ E–117°30′ E, encompassing an area of 16,413.53 km2. The city comprises a total of 16 urban and rural districts [27,28]. It has been divided into the following four major functional areas: the Capital Function Core (CFC) zone comprising the districts of Dongcheng and Xicheng; the Urban Function Development (UFD) zone comprising Haidian, Chaoyang, Shijingshan, and Fengtai districts; the City Development Zone (CDZ) comprising Changping, Shunyi, Tongzhou, Daxing, and Fangshan districts; and the Ecological Conservation Development (ECD) zone comprising Yanqing, Huairou, Miyun, Pinggu, and Mentougou districts. Figure 1 depicts these zones.
During the past 30 years, Beijing has experienced rapid urbanization at a rate that increased from 55.0% in 1978 to 86.3% in 2014. In 2014, its total population reached 21.52 million, and the city’s GDP was 192.48 billion RMB, of which the shares of primary, secondary, and tertiary industries were 0.82%, 19.21% and 79.97%, respectively. Given Beijing’s booming economy that continues to expand along with its growing population and rapid urbanization process, protection of its environment, efficient public service management, and rational resource allocation have become urgent issues. Accordingly, Beijing could serve as a representative case for a study of urbanization efficiency and the economic growth rate based on the application of a DEA-Malmquist model.
3. Data and Methodology
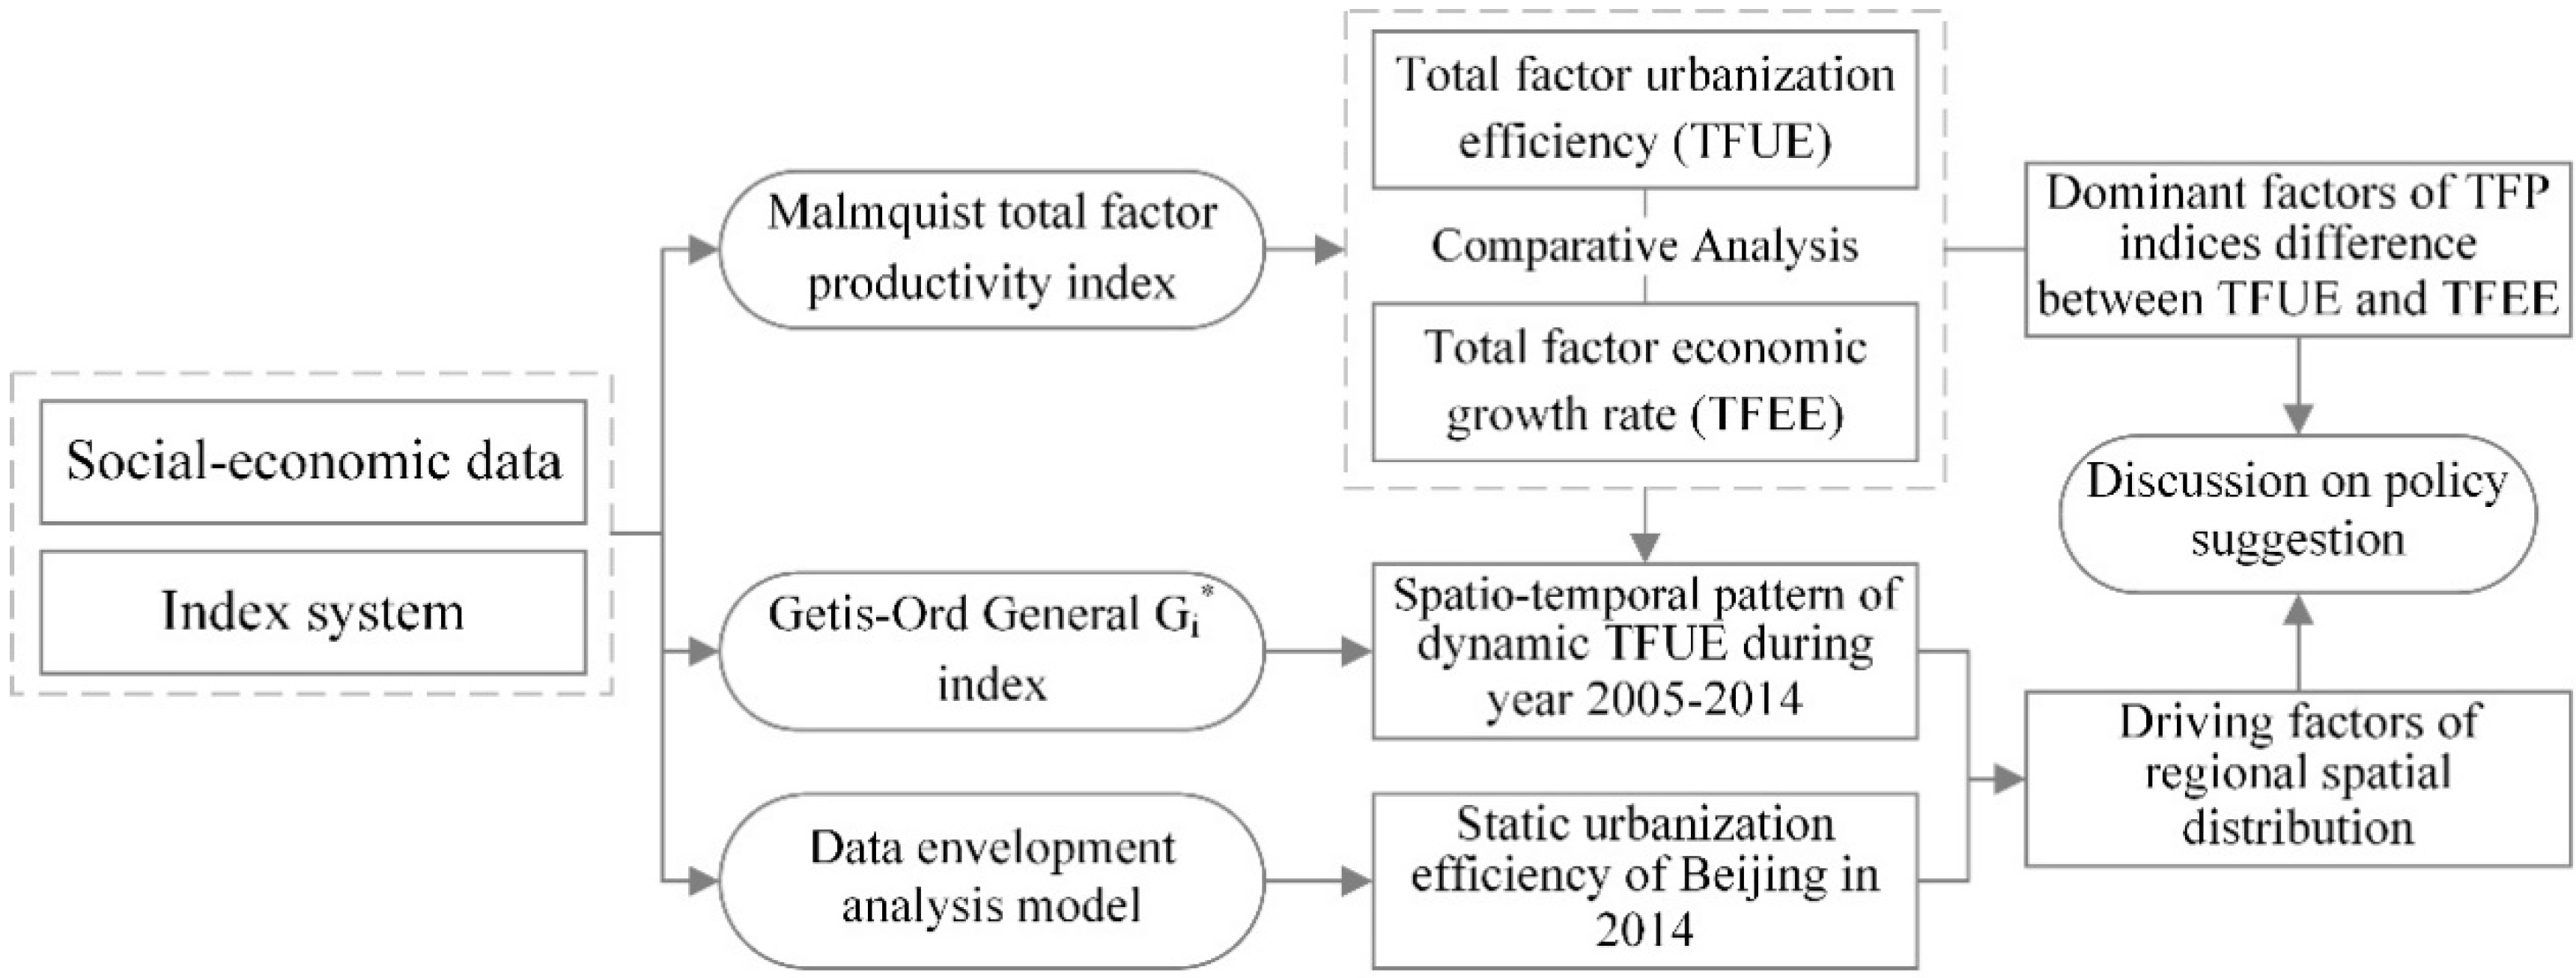
Figure 2 depicts the general framework of this study. We first developed a comprehensive index system for assessing Beijing’s urbanization efficiency and the economic growth rate. Next, we applied the Malmquist TFP index to estimate the total factor urbanization efficiency (TFUE) and the total factor economic growth rate (TFEE). Based on the estimated values of TFUE at the district/country level, we used the Getis–Ord General Gi index to analyze the spatiotemporal pattern of dynamic TFUE during the period 2005–2014. We subsequently applied a DEA model to measure Beijing’s static urbanization efficiency in 2014. As the final step, we identified the dominant factors in the TFP indices explaining differences between TFUE and TFEE and the driving factors of regional spatial distribution. We discussed their implications for developing a scientifically based and sustainable urbanization policy for Beijing.
3.1. Data
We mainly used statistical data for this study. We obtained annual socioeconomic data pertaining to the index of urbanization efficiency and economic growth rate of each administrative area for the period 2005–2014 from the following data sources: the Beijing Statistical Yearbook for the years 2006–2015, the Beijing Regional Statistical Yearbook for the years 2006–2015, and the Beijing Economic and Social Statistical Report for the years 2005–2014 (see Table 1). These statistical reports are published by the Beijing Municipal Bureau of Statistics and the National Bureau of Statistics of China (CBS) survey office in Beijing. Additionally, we obtained some socioeconomic data on all 16 of Beijing’s districts from the Statistical Yearbook published by the Bureau of Statistics.
3.2. Index System
According to U. S. National Library of Medicine, Urbanization is the process whereby a society changes from a rural to an urban way of life. It refers also to the gradual increase in the proportion of people living in urban areas. However, the concept and standard definition of “urbanization” remains a subject of great dispute in China. Because the high urbanization of Beijing is due to rapidly increased floating population, it cannot be simply quantified as the level of urban development relative to the overall population.
Historical experience of modern urbanization development suggests that, at an early stage, the rural economy occupies a predominant position. Agricultural development provides the basic thrust for urban development and the urbanization process. Industrialization subsequently becomes the core factor influencing urbanization. Eventually, a transformation occurs in the development of the urban economy as it shifts from partial advantage to overall ascendance. During an advanced stage of urbanization, cities emerge as economic, technical, cultural, and commercial centers in a country. The propelling thrust for urbanization is now provided by the development of tertiary industry [29].
Based on a basic consideration of concept, identification and historical experience, urbanization creates enormous social, economic and environmental changes, which provide an opportunity for sustainability with the “potential to use resources more efficiently, to create more sustainable land use and to protect the biodiversity of natural ecosystems” [30]. Nevertheless, taking into account the difficulty of obtaining data, we choose the levels of economic urbanization and consumption as the index of the level of urbanization, which is commonly used in other studies [3,4,14].
The evaluation index system used to assess urbanization efficiency and the economic growth rate were derived from studies by Brülhart and Mathys [17]. We selected different forms of capital, i.e., material, human, land, financial, and foreign, as input factors to represent urban economic activities. Economic level was selected as the output factor for the economic growth rate. Levels of economic urbanization and consumption were selected as output factors for urbanization efficiency. Given the requirement of representative, authentic, and easily available index data, we selected the following input and output factors. For our input factors, we selected: the floor space of constructed buildings, as an index of land capital; total investment in fixed assets, as an index of material capital; foreign capital actually used, , as an index of foreign financial; employed persons, as an index of human capital; and financial expenditure, as an index of financial capital. We selected the following output factors: Gross Domestic Product (GDP) per capita, as an index of the economic level; the ratio of secondary industry and tertiary industry compared to the GDP, as an index of the economic urbanization level; and total retail sales of consumer goods, as an index of the consumption level. The index system developed for the study is depicted in Table 2.
3.3. Methodology
3.3.1. DEA Model
The DEA model developed by Charnes, Cooper, and Rhodes (CCR) [31] is a linear programming methodological tool that is used to measure the efficiency of multiple decision-making units when the production process presents a structure entailing multiple inputs and outputs. DEA has been applied within many industries to compare efficiency levels across firms. There are several types of DEA models, with the most basic one being the CCR version developed by Charnes et al. [31] in which efficiency is defined as a ratio of the weighted sum of outputs to the weighted sum of inputs. However, there are other DEA models that address varying returns to scale: constant returns to scale (CRS) and variable returns to scale (VRS). As the DEA-CCR model is a well-established model, we will not provide details about it here.
In our study, we used the DEA-CCR model to analyze the comprehensive efficiency, pure technical efficiency, and scale efficiency of Beijing’s urbanization in 2014. Comprehensive efficiency refers to urbanization efficiency in relation to resource allocation, utilization, and scale concentration. Pure technical efficiency indicates the resource utilization efficiency of input factors. The scale efficiency indicates the efficiency of urban scale concentration.
3.3.2. Malmquist TFP Index
The Malmquist TFP index (MPI) is a formal time-series analytical technique used for comparing the performances of decision-making units over time [32]. MPI indicates whether there is an increase or decrease in efficiency with the progress or regress of frontier technology over time using a framework with multiple inputs and outputs. The DEA-Malmquist index has been used to evaluate growth in productivity within several fields. The MPI is calculated according to the following equation:
where and are the allocation of production inputs and outputs during the time periods t and t + 1, and is the distance function indicating the distance between and the production frontier during time period t. The value of can be calculated using the following equation:
where the distance function is the efficiency function of an input-oriented DEA model, that is, . Therefore, MPI can be presented in the following form:
where MPI is the index of efficiency change from time period t to time period t + 1. It can reflect a change of TFP. This equation can be decomposed into the following equation:
Moreover, the above equation can be decomposed into equations for calculating the technical change (TC) and efficiency change (EC) as follows:
If the TC index value is greater than 1, this indicates positive technical progress from the time period t to time period t + 1, whereas a value that is below 1 indicates negative, that is, lack of technical progress. If the EC index value is greater than 1, this indicates an improvement in efficiency from time period t to time period t + 1, whereas a value that is below 1 indicates a decrease in efficiency. If the MPI index value is greater than 1, this indicates positive MPI growth from time period t to time period t + 1, whereas a value below 1 indicates a decrease in MPI growth or performance relative to the previous year.
Based on the MPI index values, the contribution rates of technical progress, efficiency improvement, resource allocation, resource utilization, and scale concentration on urbanization efficiency and economic growth rate were analyzed, as discussed in the following section.
3.4. Getis–Ord General Index
The General statistic relating to overall spatial association is given as:
where denotes attribute values for feature; is a spatial weight matrix with ones for all links defined as being within distance of a given feature ; n denotes the number of features in the dataset; and indicates that features and cannot be the same [33].
If the value of the General index is greater than 0, this indicates that the urbanization efficiency of features surrounding feature is relatively higher, demonstrating high clustering. Conversely, a value that is below 0 indicates that the urbanization efficiency of features surrounding feature is relatively lower, demonstrating low clustering.
4. Results and Discussion
4.1. Comparison of Beijing’s Urbanization Efficiency and Economic Growth Rate for the Period 2005–2014
TFEE values fluctuated annually, mostly ranging between 0.852 and 1.111. During the decade 2005–2014, they evidenced little annual change, and the average TFEE value was 0.979 for this decade. This result indicates that the economic growth rate remained stable, approximating an effective balance.
TFUE values also fluctuated annually, evidencing a generally positive trend. The TFUE value increased from 0.903 during the period 2005–2006 to 0.906 during the period 2012–2013, with one exceptional period from 2013 to 2014 when the TFUE value was 0.898 (see Figure 3). There was an average overall increase of 1.07%, indicating a continual improvement in urbanization efficiency during the last decade. This result matches that of Zhao [34], which showed a tendency for Beijing’s urbanization level to increase annually between 2005 and 2012. However, during this period, the TFUE values were below 1 with the exception of the period 2011–2012. This result indicates that even though the economy experienced rapid growth between 2005 and 2014, urbanization efficiency was still in a state of low efficiency that would also lead to a loss of efficiency.
The difference between the TFEE and TFUE values was above 0 except for the period 2011–2012, indicating that urbanization efficiency in relation to the economic growth rate was still low, causing a significant lag. Therefore, the imbalance between the economic growth rate and urbanization efficiency was marked. Zhao et al. [34] showed that rapid economic development was one of the most important factors affecting the evolution of urbanization in Beijing. Conversely, Zhao [6] indicated that, as in Western countries, rapid urbanization has greatly contributed to the promotion of economic growth and social wellbeing in Beijing. In our study, TFEE was relatively stable during the study period, and the increase in the TFUE did not depend on the economic growth rate.
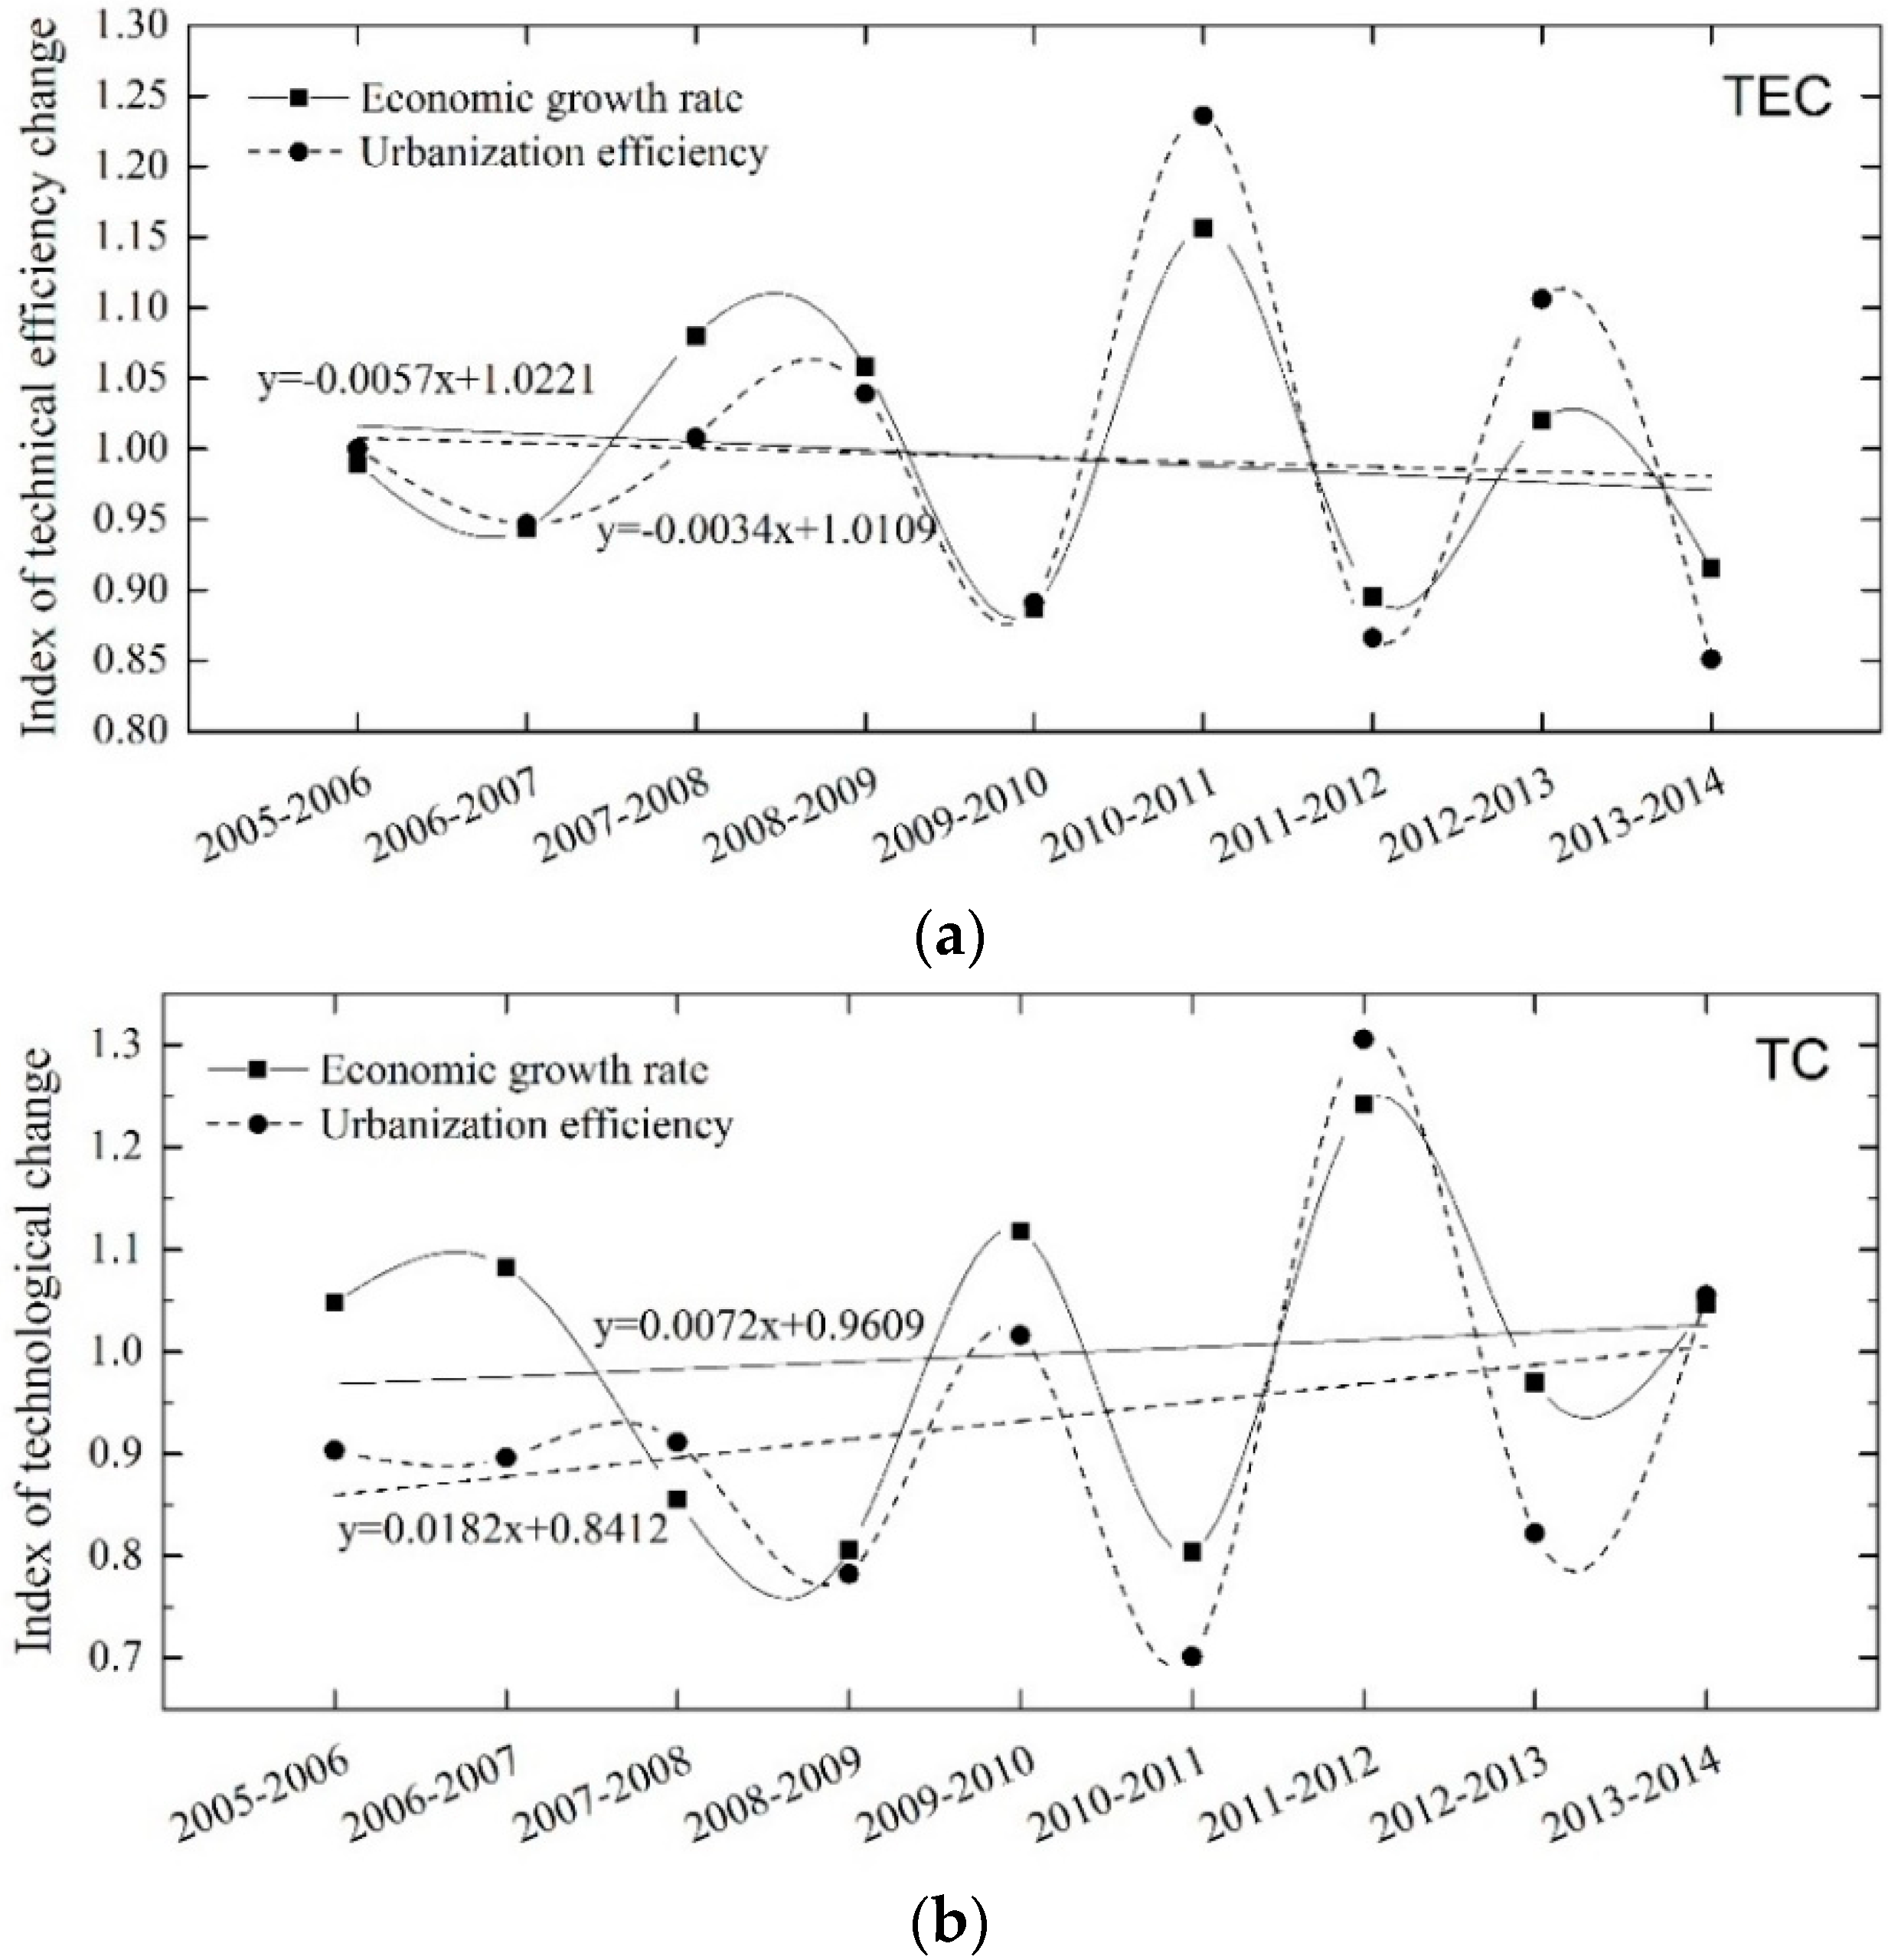
The same decreasing trend was found for the TEC of urbanization efficiency and the economic growth rate (see Figure 4a). The average values of TFUE and TFEE were also the same at 0.9938.
Figure 4c shows that the pure technical efficiency change (PTEC) of urbanization efficiency was comparable to that of the economic growth rate with the exception of the period 2007–2008. However, the PTEC of urbanization efficiency demonstrated a positive tendency, whereas the PTEC of the economic growth rate demonstrated a slightly decreasing trend.
There were only slight differences between the TEC and PTEC, with TC and SEC being the key factors influencing the difference in TFP indices between TFUE and TFEE (see Figure 4b,d). The TC of the economic growth rate was higher than that of the urbanization efficiency with the exception of the periods 2007–2008 and 2011–2012. This indicates that the TC of urbanization efficiency has not been well optimized. The SEC trends of the economic growth rate and urbanization efficiency showed periodic fluctuations in sine and cos waves with rapid decreases of 0.29% and 1.24%, respectively. This result implies decreasing returns to scale of urbanization efficiency in Beijing. Evidently, a pattern of extensive development is inappropriate for Beijing and cannot promote urbanization efficiency in the long term.
The values of TFUE and TFEE in CFC were higher than 1 on the major functional area scale except for the period 2010–2011 (see Table 3). This finding indicates significant levels of urbanization efficiency and economic growth, with high inputs and outputs. The TFEE value was lower than that of the TFUE in the CFC during seven periods, indicating that rapid economic growth could no longer drive urbanization efficiency. The same trend that occurred for the CFC was found for the UFD for four periods from 2007 to 2010 and from 2011 to 2012. Further, the TFUE of the UFD, CDZ, and ECD areas was below 1 for most periods.
In 2005, the State Council approved the re-revised Beijing Urban Master Plan (2004–2020), which was aimed at initiating a strategy for developing a “Center City–New Town–Town (including the key towns and general towns)” structure. In 2011, the municipal government of Beijing proposed a strategy for developing a “Center City–New Town–Small Town–the New Rural Communities” structure [34]. In view of conditions in the UFD, CDZ, and ECD areas, the optimal choice for local governments was to strengthen policy support for a novel development path, differing from that of traditional development, to encourage investments in technology for a fixed asset, and to introduce social capital for advancing urbanization in rural areas. This strategy is expected to promote local economic development, simultaneously enhancing the level of urbanization.
4.2. Spatial Pattern of Total Factor Urbanization Efficiency in Beijing
Beijing’s urbanization efficiency has a remarkable regional spatial distribution, showing a decreasing trend from north to south apart from CFC areas. The average TFUE values were 1.235, 0.887, 0.804, and 0.924 in the CFC, UFD, CDZ, and ECD areas, respectively, and the TFUE values varied from 0.738 to 1.242 (see Table 4). Evidently, the TFUE in the CFC area was very high, whereas this value for other regions of Beijing was just 0.873. In the districts of Yanqing, Huairou, Miyun, and Pinggu in northern Beijing, the average TFUE value was 0.947, which was higher than the TFUE value (0.794) in Fangshan, Daxing, and Tongzhou districts of southern Beijing. The TFUE value for 12 districts was lower than 1, which strongly indicated inefficient factor allocation in these districts.
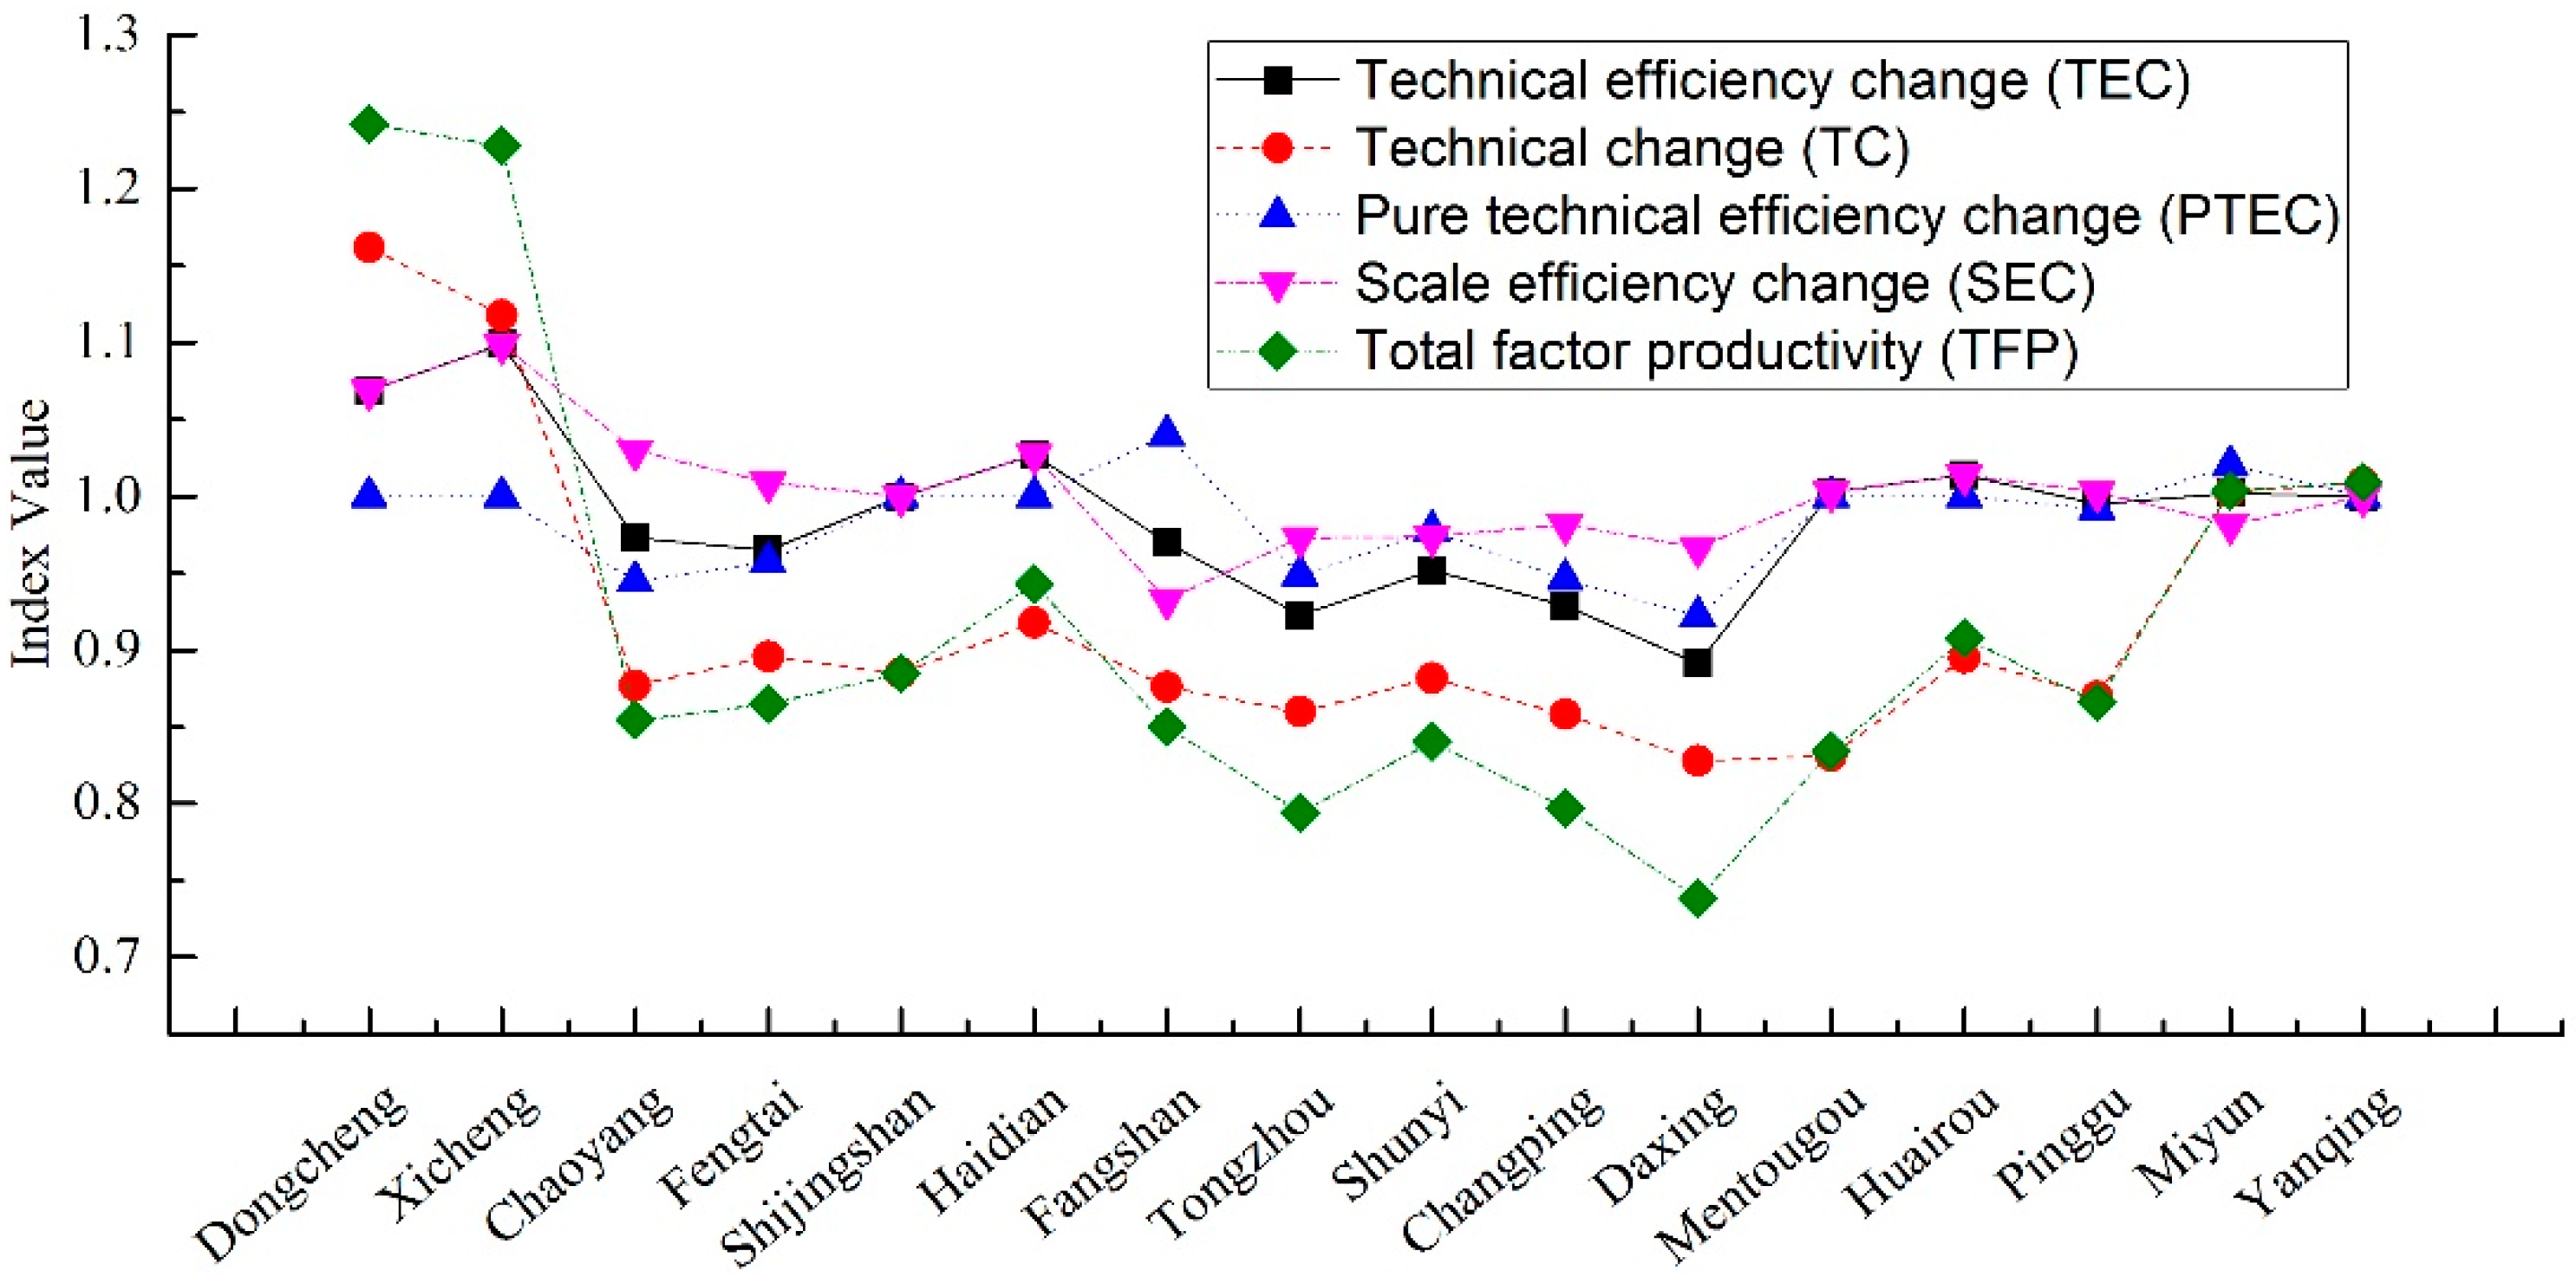
There was little difference in the TEC, PTEC, and SEC values for the Malmquist efficiency decomposition compared with the TC in different parts of Beijing during the period 2005 to 2014. The PTEC and SEC values in the 16 districts of Beijing ranged from 0.922 to 1.040 and from 0.933 to 1.099, respectively. These results suggest that pure technical efficiency and scale efficiency in the 16 districts approached the highest level. TEC values were also relatively similar apart from those for Daxing, Tongzhou, and Shunyi districts of southeastern Beijing. Therefore, TC was the driving factor of TFP that led to a remarkable regional spatial distribution (see Table 4 and Figure 5). In Dongcheng, Xicheng, Miyun, and Yanqing districts, the TC value was higher than 1, whereas with the exception of Haidian District, which had a TC value of 0.918, the TC of the other districts was lower than 0.9. In these latter districts, a lower level of technology was associated with a dramatic decline in urbanization efficiency. This distribution was strongly correlated with the regional spatial distribution of TFP.
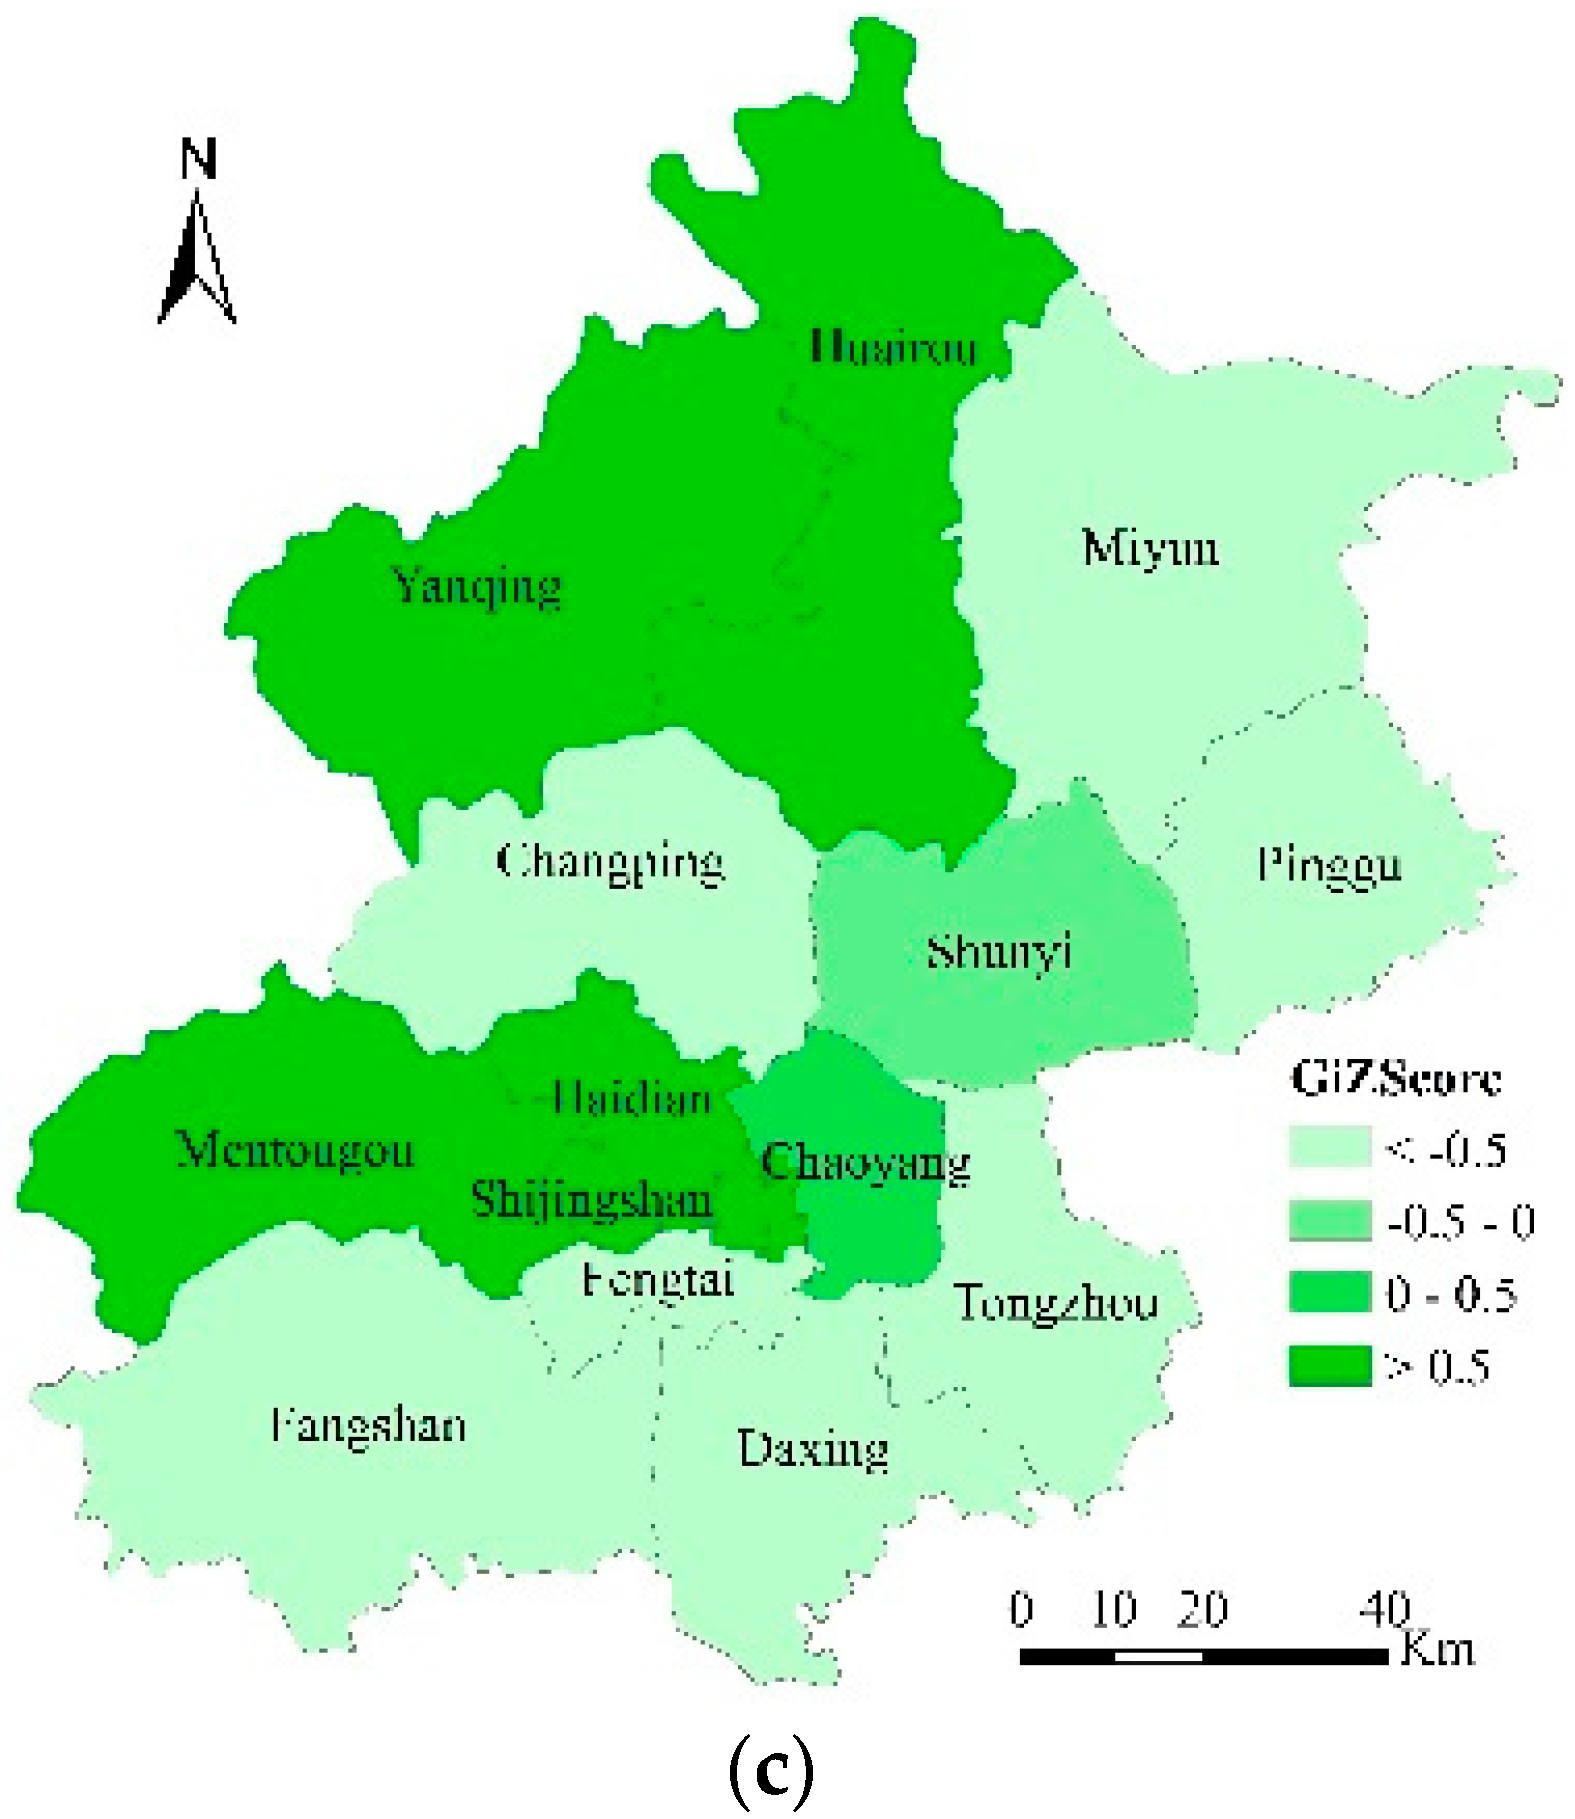
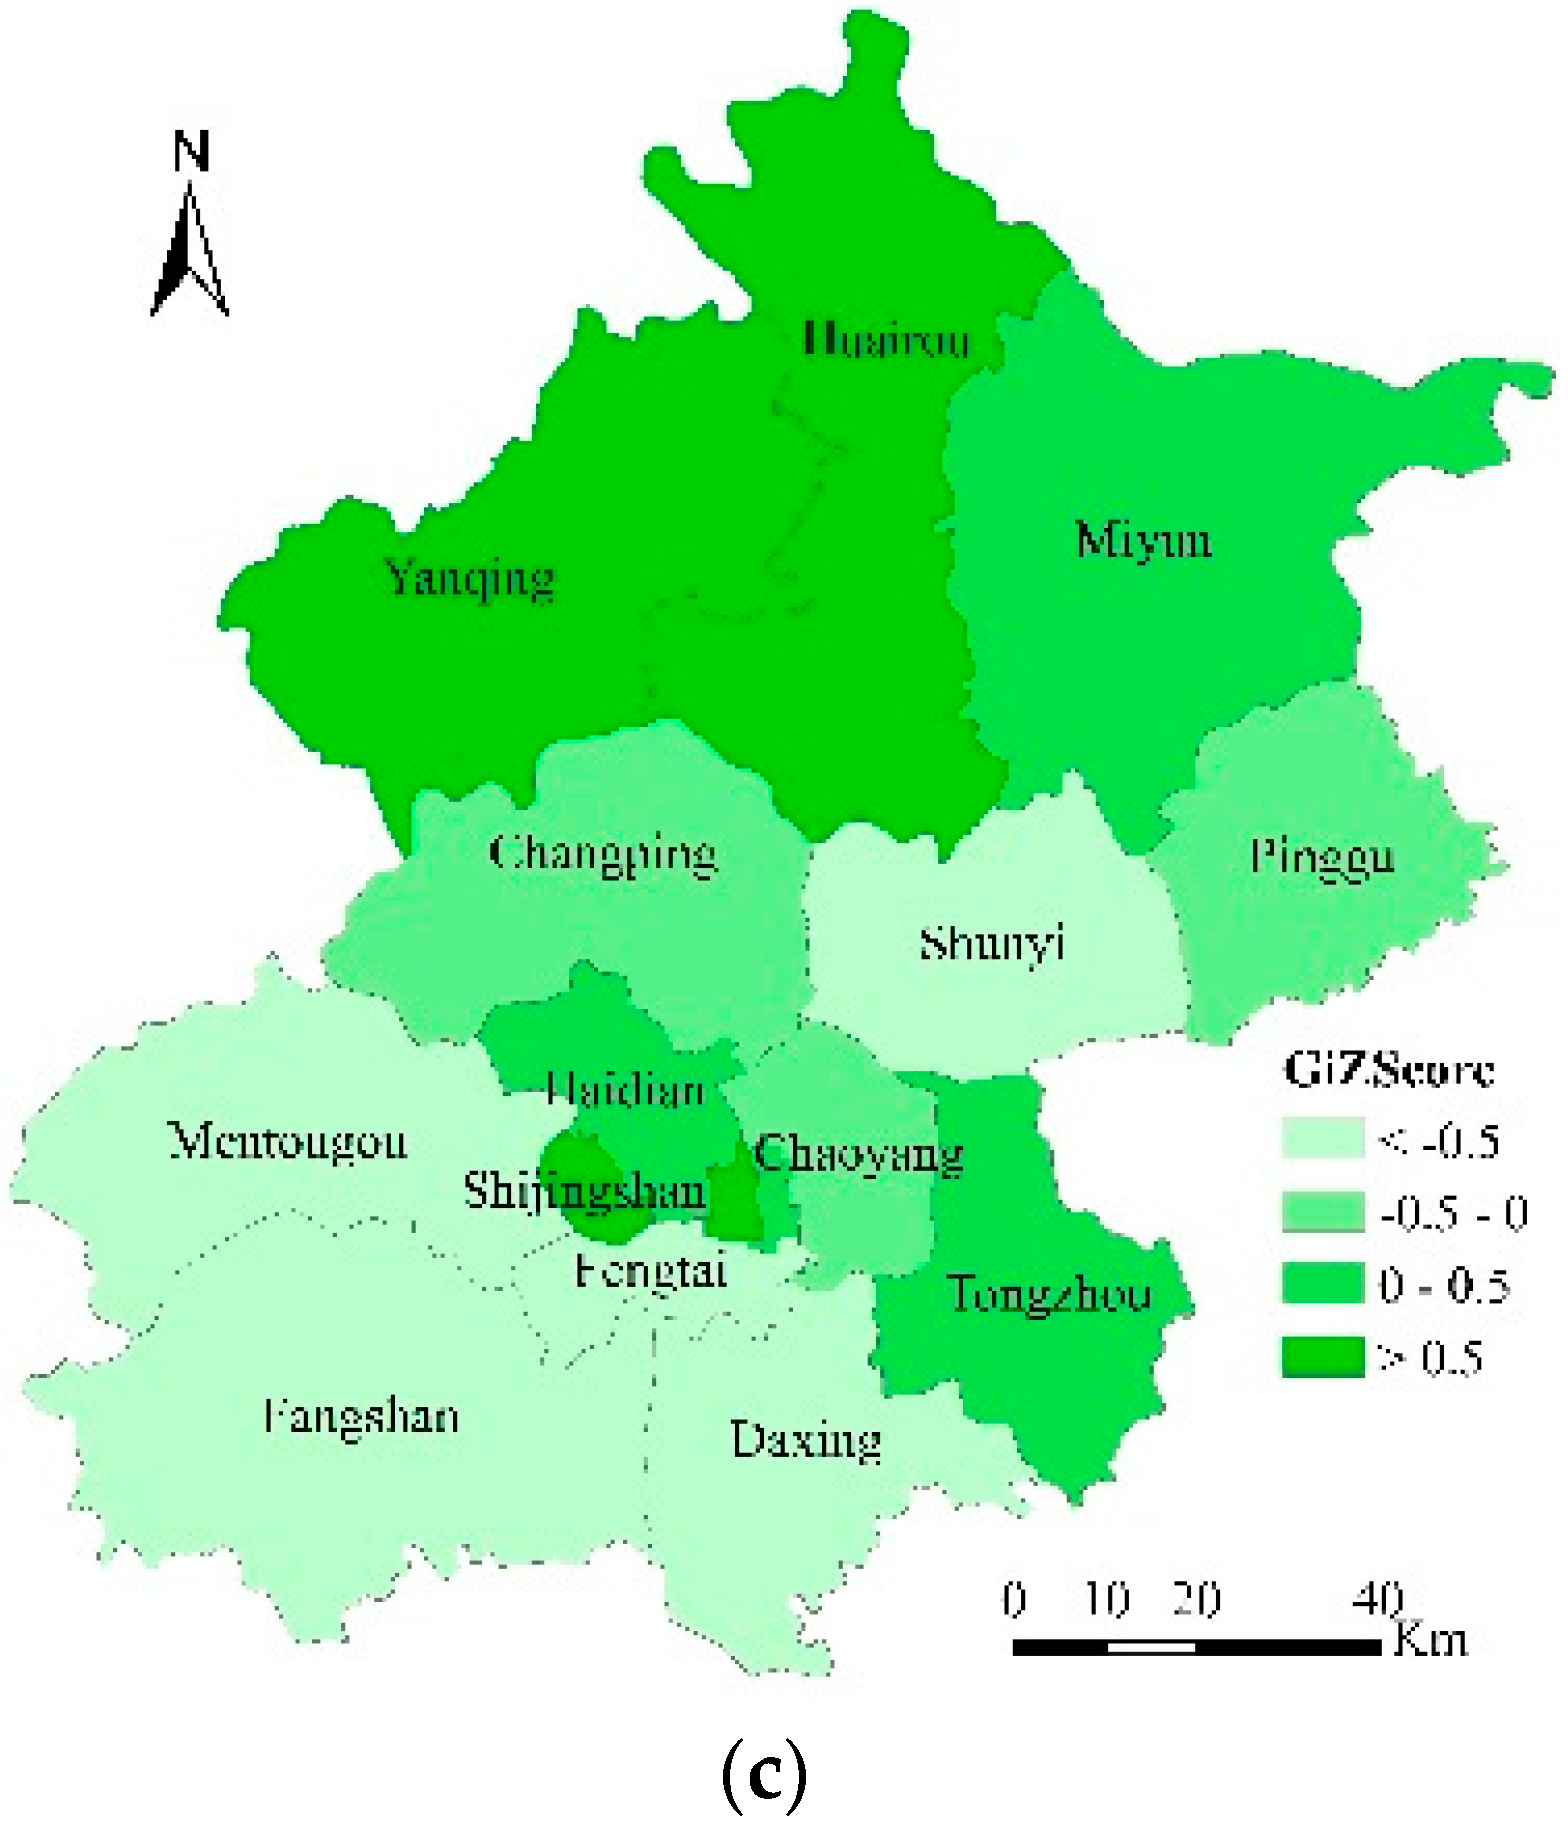
Because urbanization efficiency was evidently imbalanced, neighborhood distances were used for measuring the Getis–Ord General index, which indicates a concentration of high and low values for an entire study area. We selected the following three typical time periods: 2005–2006, 2009–2010, and 2013–2014. TEC, TC, and TFP, which were the mean driving factors for regional spatial distribution discussed above, were measured using the Getis–Ord General index (see Figure 6, Figure 7 and Figure 8).
High value TEC clusters were mainly located in central and northern Beijing (see Figure 6). The CFC area and Mentougou were found to be consistently high value cluster regions, whereas Daxing, Fangshan and Fengtai in southern Beijing, Changping in the central-northern part of Beijing, and Tongzhou in eastern Beijing were consistently low or sub-low value cluster regions during the period 2005–2014. Huairou, Miyun, and Yanqing in northern Beijing also evidenced high value clusters during the periods 2009–2010 and 2013–2014.
Dongcheng, Xicheng, Shijingshan, Haidian, and Mentougou districts in central Beijing were high TC value cluster regions during the periods 2005–2006 and 2009–2010, whereas these districts transformed into low TC value cluster regions during the period 2013–2014. This shift could be related to investments made through several major projects, including the Zhongguancun Science Park in northern Beijing and the Olympic Games Park, which provided further impetus for improving TC [35]. Yang [27] and Zhang [36] found that the urbanized territory dramatically expanded along the 5th Ring Road, initially in a northerly direction during 1990s. After 2009, this expansion also spread to the south. However, the TC distribution in areas surrounding central Beijing, notably Fengtai, Fangshan, Tongzhou, and Changping, and those surrounding northern Beijing, namely Pinggu, Miyun, and Yanqing, showed the opposite pattern of distribution. Moreover, during the period 2005–2014, Daxing, Shunyi, and Huairou districts remained low or sub-low TC value cluster regions.
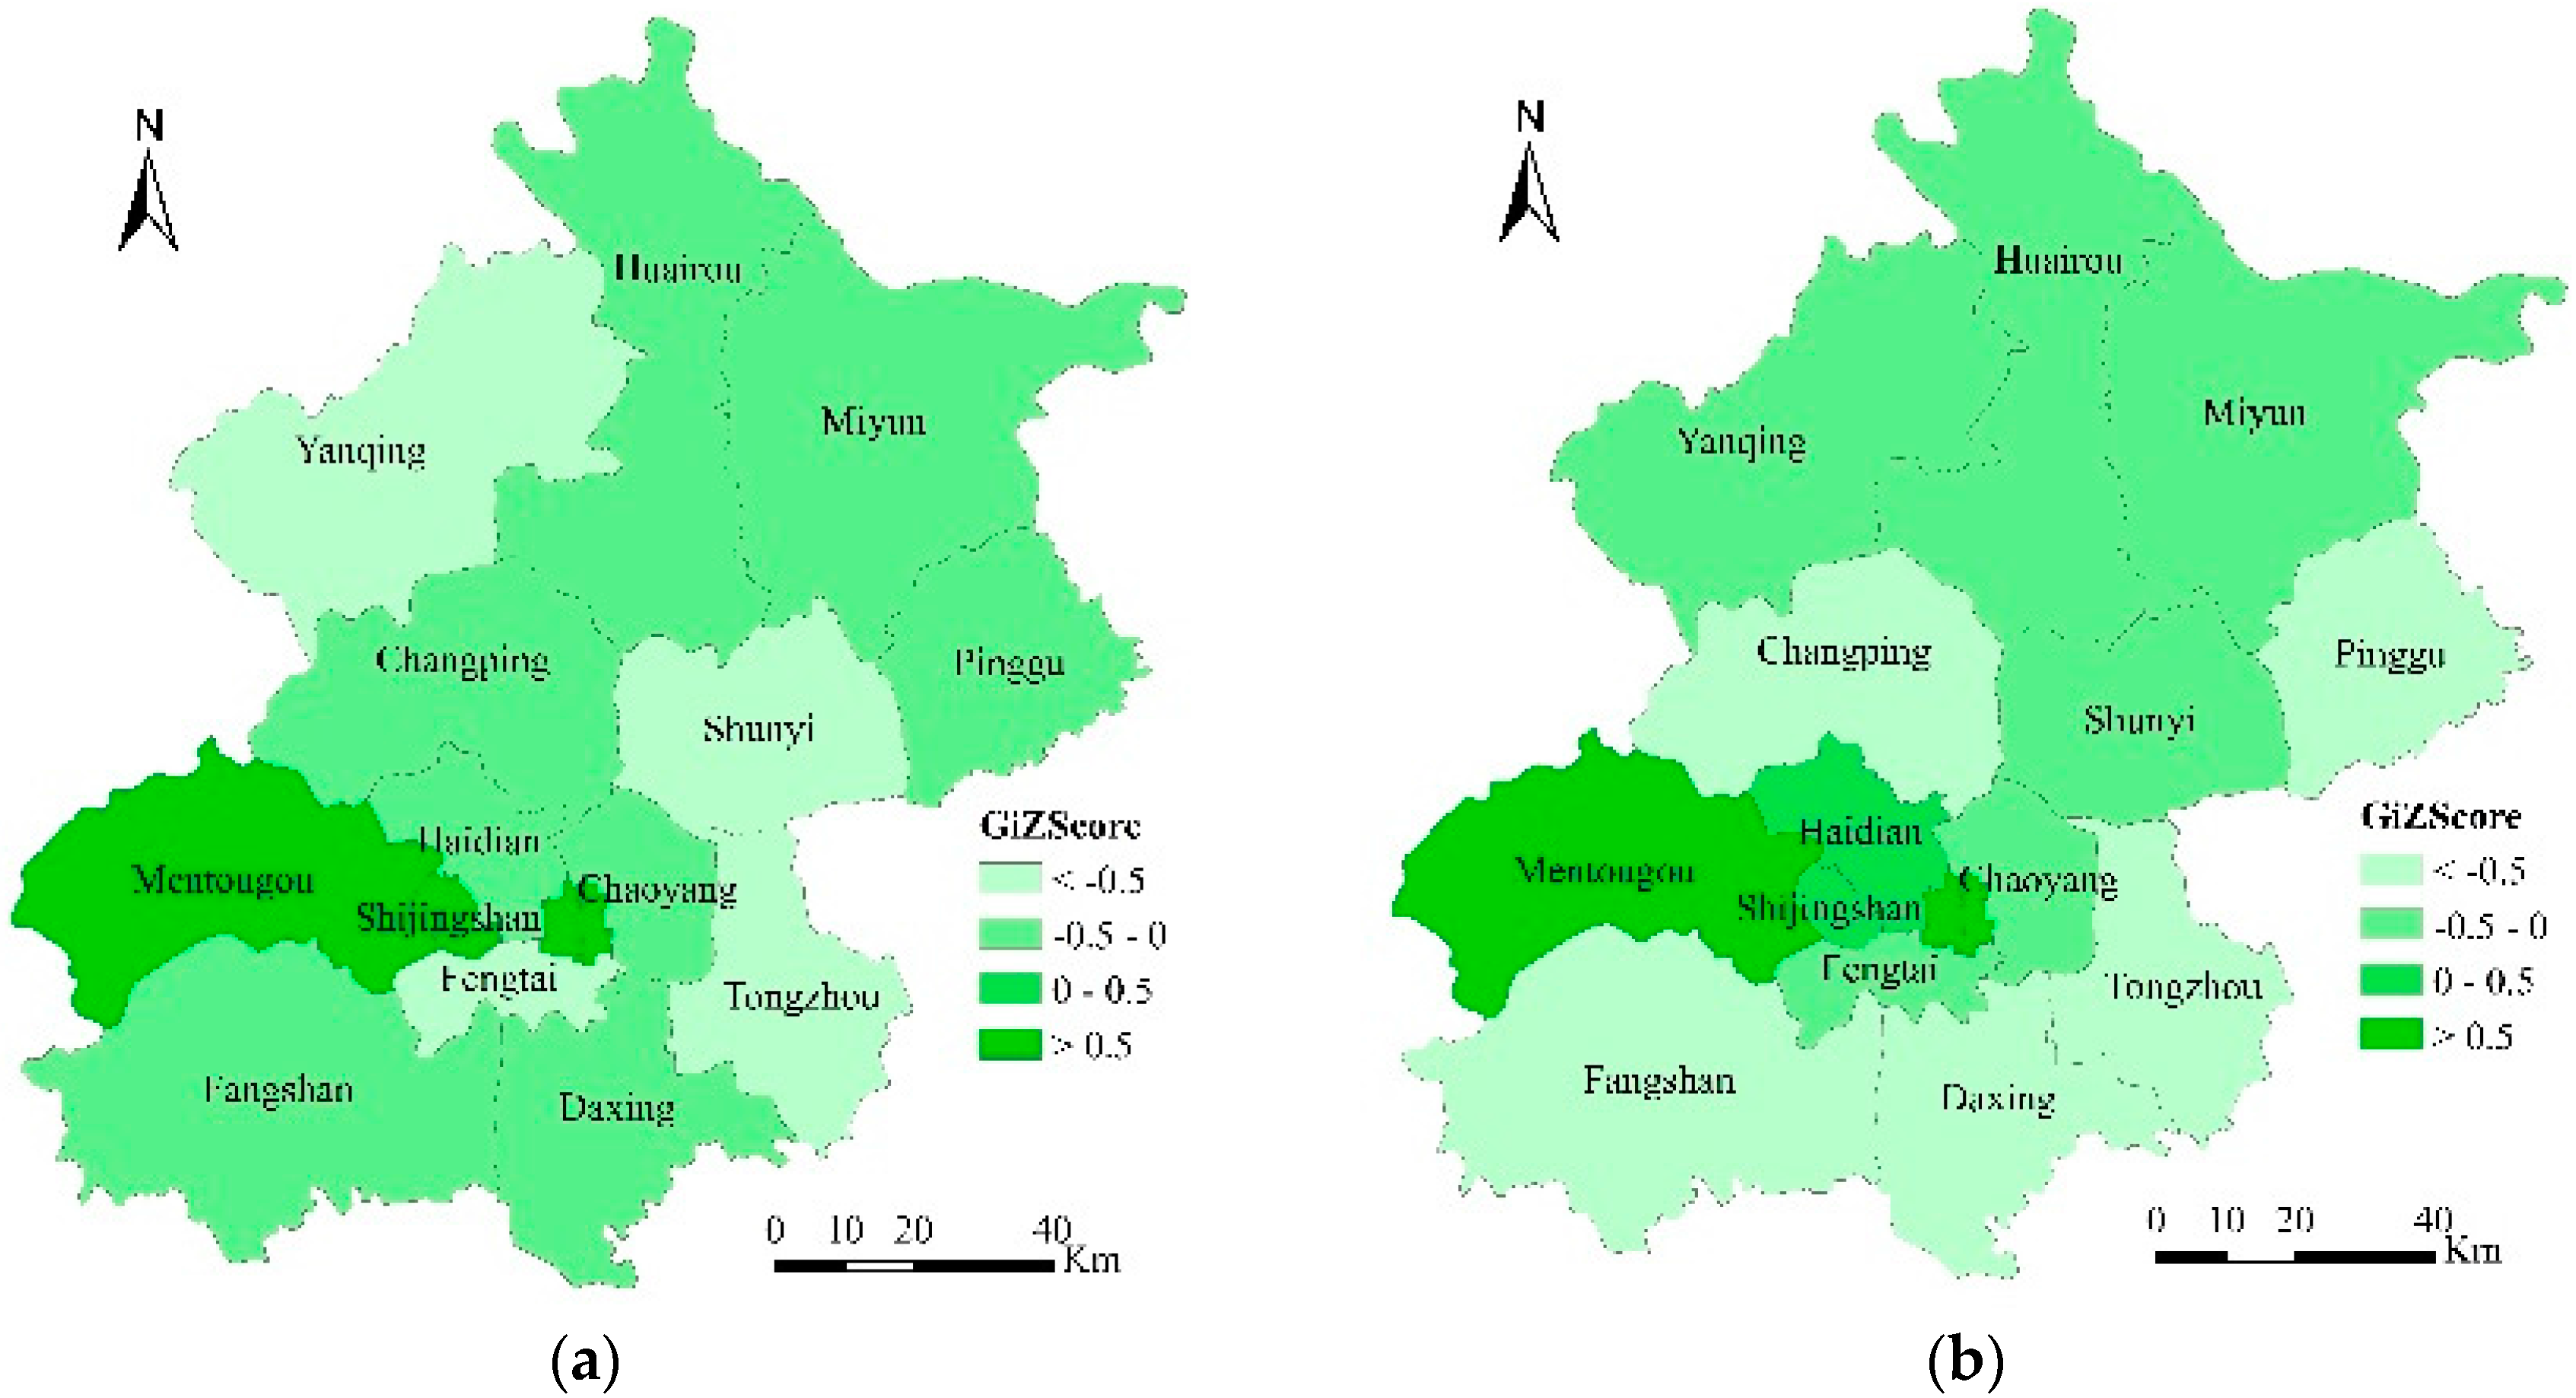
The TFP distribution demonstrating high index values gradually shifted from Mentougou and Shijingshan in western Beijing to Tongzhou, Yanqing, and Huairou in northeastern Beijing. Urban-rural development was, in general, poorly coordinated in Beijing [28,34], so the index values in the CFC area remained high, while low or sub-low TFP values were found in Daxing, Fangshan, and Fengtai in southern Beijing and in Changping, Shunyi, and Pinggu in central-northern Beijing during the period 2005–2014. Therefore, TFP distribution was strongly correlated with TC distribution and was also affected by TEC distribution.
We can conclude that the CFC area and northeastern Beijing are gradually evolving into high urbanization efficiency cluster regions. TC and TEC are the main factors driving the remarkable regional spatial distribution pattern for urbanization efficiency. Hence, the county government in southern Beijing should pay more attention to improving TC and TEC values to enhance urban competitiveness. However, the maintenance of high levels of development in the city is indicative of its ability to calibrate unbalanced regional development where it occurs [34].
4.3. Static Measurement of Beijing’s Urbanization Efficiency in 2014
Based on our DEA-CCR model, we measured the comprehensive efficiency (TEC), PTEC, and SEC of Beijing’s urbanization in 2014. The average values of TEC, PTEC, and SEC for this period were 0.625, 0.717, and 0.837, respectively.
Dongcheng, Xicheng, Shijingshan, Mentougou, and Yanqing demonstrated an effective balance of TEC and SEC, whereas these levels were not optimal in the remaining 11 districts (see Table 5). PTEC was effectively balanced in Huairou as well as in the five districts identified above. The number of districts demonstrating an effective balance relating to PTEC was higher than those with an effective balance of TEC and SEC.
Of the remaining 11 districts, TEC values were below 0.5 in eight districts, with the lowest value (0.219) recorded for Daxing. This finding suggests inefficient factor allocation with 21.9% of optimal level. PTEC values were below 0.5 in five districts, with the lowest value (0.302) recorded for Daxing. There was no SEC value below 0.5, with the lowest value (0.521) being that of Fangshan. These results indicate that PTEC and SEC were not well optimized in most districts in 2014.
PTEC was lower than SEC in Chaoyang, Fengtai, Haidian, Tongzhou, Shunyi, Daxing, and Pinggu, indicating that the urbanization efficiency of these seven districts was driven by scale efficiency. These districts should therefore raise their PTEC levels. Conversely, PTEC values were higher than SEC values in Fangshan, Changping, Huairou, and Miyun, indicating that the urbanization efficiency of these four districts was driven by pure technical efficiency. These districts represented diseconomies of scale.
With the exception of Pinggu, all those districts with an ineffective balance of TEC and SEC evidenced decreasing returns to scale. This finding indicates that input resources exceeded the districts’ capacities. Solely enhancing the scale of investment of elements could adversely affect an increase of urbanization scale efficiency and even halt it completely in the future. Moreover, apart from Pinggu, the other six districts with Chaoyang, Fengtai, Haidian, Tongzhou, Shunyi and Daxing, whose urbanization efficiency is driven by scale efficiency, demonstrated decreasing returns to scale. This extensive development is, however, still unreasonable and does not promote sustainable urbanization efficiency.
Accordingly, we recommend that county governments promote efforts to reduce input redundancy and improve pure technical efficiency to maintain sustainable and steady development.
It is worth noting that the methods and evaluation index system applied in our study area have been used in European regions [17]. In recent studies, Fang et al. [37] and Lobo et al. [38] also used a similar index to study China’s 23 Urban Agglomerations and US cities, respectively. Therefore, the framework of this evaluation index is credible. We only need to modify the index based on our research target, and then it will be applied in other countries.
5. Conclusions
During the period from 2005 to 2014, TFUE demonstrated wavelike rises in a low efficient state, while TFEE remained stable, approximating an effective balance. The increase of TFUE was not dependent on the economic growth rate. Therefore, urbanization efficiency at present remains low and has caused a significant lag in the economic growth rate. TC and SEC were found to be the dominant factors influencing the difference in the TFP indices between TFUE and TFEE. Consequently, local governments should promote changes in technology and scale efficiency to enhance the level of urbanization.
A spatial comparison of urbanization efficiency and the economic growth rate revealed significant levels of both TFUE and TFEE in the CFC area with high inputs and outputs, while these levels in the UFD, CDZ, and ECD areas were below 1 during most of the study periods. This finding strongly indicates inefficient factor allocation. As rapid economic growth can no longer drive urbanization efficiency in the CFC area, the optimal choice for local governments is to strengthen policy support and encourage the investment of technology in the UFD, CDZ, and ECD areas.
Urbanization efficiency evidenced a remarkable regional spatial distribution, showing a decreasing trend from north to south in Beijing, with the exception of CFC areas. During the period 2005–2014, the CFC area and northeastern Beijing gradually developed into high urbanization efficiency cluster regions. The main factors driving the remarkable regional spatial distribution of TFUE were TC and TEC. Consequently, the county government in southern Beijing should pay more attention to improving TC and TEC to enhance urban competitiveness.
In 2014, Dongcheng, Xicheng, Shijingshan, Mentougou, and Yanqing demonstrated an effective balance in relation to static urbanization efficiency, whereas these levels were not optimal in the remaining 11 districts, indicating extensive development. Therefore, we recommend that county governments promote efforts to reduce input redundancy and improve pure technical efficiency to maintain sustainable and steady development.
Acknowledgments
This research was financially supported by Beijing Natural Science Foundation (9172018), and the National Natural Science Foundation of China (Grant Nos. 71774151 and 71533004).
Author Contributions
Wei Qi and Qian Zhang conceptualized and designed the study. Wei Qi and Ying Gao were accountable for conducting research, collecting data, and originating the draft manuscript. Qian Zhang supervised the research and proofread the manuscript. The authors approved the content of this manuscript.
Conflicts of Interest
The authors declare no conflict of interest.
References
- He, C.; Okada, N.; Zhang, Q.; Shi, P.; Zhang, J. Modeling urban expansion scenarios by coupling cellular automata model and system dynamic model in Beijing, China. Appl. Geogr. 2006, 26, 323–345. [Google Scholar] [CrossRef]
- Song, W.; Deng, X. Effects of urbanization-induced cultivated land loss on ecosystem services in the North China Plain. Energies 2015, 8, 5678–5693. [Google Scholar] [CrossRef]
- Wang, S.J.; Ma, H.; Zhao, Y.B. Exploring the relationship between urbanization and the eco-environment—A case study of Beijing–Tianjin–Hebei region. Ecol. Indic. 2014, 45, 171–183. [Google Scholar] [CrossRef]
- Yin, K.; Wang, R.; An, Q.; Yao, L.; Liang, J. Using eco-efficiency as an indicator for sustainable urban development: A case study of Chinese provincial capital cities. Ecol. Indic. 2014, 36, 665–671. [Google Scholar] [CrossRef]
- CBS (National Bureau of Statistics of China). China Statistical Yearbook; Chinese Statistics Press: Beijing, China, 2016.
- Zhao, P. Managing urban growth in a transforming China: Evidence from Beijing. Land Use Policy 2011, 28, 96–109. [Google Scholar] [CrossRef]
- Li, Y.; Li, Y.; Zhou, Y.; Shi, Y.; Zhu, X. Investigation of a coupling model of coordination between urbanization and the environment. J. Environ. Manag. 2012, 98, 127. [Google Scholar] [CrossRef] [PubMed]
- Charnes, A.; Cooper, W.W.; Li, S. Using DEA to evaluate relative efficiencies in the economic performance of Chinese cities. Soc-Econ. Plan. Sci. 1989, 23, 325–344. [Google Scholar] [CrossRef]
- Abdelfattah, B.M.; Ablanedorosas, J.H.; Gemoets, L.A. Developing country efficiency assessment by means of a comprehensive model based on data envelopment analysis. Int. J. Soc. Syst. Sci. 2011, 3, 58–80. [Google Scholar] [CrossRef]
- Morais, P.; Camanho, A.S. Evaluation of performance of European cities with the aim to promote quality of life improvements. Omega 2011, 39, 398–409. [Google Scholar] [CrossRef]
- Storto, C.L. Ecological efficiency based ranking of cities: A combined DEA cross-efficiency and Shannon’s Entropy method. Sustainability 2016, 8, 124. [Google Scholar] [CrossRef]
- Bernard, J.; Cantner, U. French regional performance and variety—A non-parametric frontier approach. In La Methode DEA—Analyse Des Performance; Badillo, P.Y., Paradi, J.C., Eds.; Hermes Science Publications: Paris, France, 1999; pp. 255–273. [Google Scholar]
- Mas, M.; Maudos, J.; Pérez, F.; Uriel, E. Public capital, productive efficiency and convergence in the spanish regions (1964–1993). Rev. Income Wealth 2010, 44, 383–396. [Google Scholar] [CrossRef] [Green Version]
- Chen, Y.; Chen, Z.; Xu, G.; Tian, Z. Built-up land efficiency in urban China: Insights from the General Land Use Plan (2006–2020). Habitat Int. 2016, 51, 31–38. [Google Scholar] [CrossRef]
- He, J.; Wan, Y.; Feng, L.; Ai, J.; Wang, Y. An integrated data envelopment analysis and emergy-based ecological footprint methodology in evaluating sustainable development, a case study of Jiangsu Province, China. Ecol. Indic. 2016, 70, 23–34. [Google Scholar] [CrossRef]
- Liu, Y.; Wang, W.; Li, X.; Zhang, G. Eco-efficiency of urban material metabolism: A case study in Xiamen, China. Int. J. Sustain. Dev. World 2010, 17, 142–148. [Google Scholar] [CrossRef]
- Brülhart, M.; Mathys, N.A. Sectoral agglomeration economies in a panel of European regions. Region. Sci. Urban Econ. 2008, 38, 348–362. [Google Scholar] [CrossRef]
- Chen, S.; Zhang, S. Large-scale land use for construction and energy consumption after the new millennium with their impact on total-factor efficiency change in China’s regional economy. Energies 2014, 7, 1986–2003. [Google Scholar] [CrossRef]
- Halleux, J.M.; Marcinczak, S.; Krabben, E.V.D. The adaptive efficiency of land use planning measured by the control of urban sprawl. The cases of the Netherlands, Belgium and Poland. Land Use Policy 2012, 29, 887–898. [Google Scholar] [CrossRef]
- Yang, W.C.; Lee, Y.M.; Hu, J.L. Urban sustainability assessment of Taiwan based on data envelopment analysis. Renew. Sustain. Energ. Rev. 2016, 61, 341–353. [Google Scholar] [CrossRef]
- Deilmann, C.; Lehmann, I.; Reißmann, D.; Hennersdorf, J. Data envelopment analysis of cities—Investigation of the ecological and economic efficiency of cities using a benchmarking concept from production management. Ecol. Indic. 2016, 67, 798–806. [Google Scholar] [CrossRef]
- Rosenzweig, C.; Solecki, W.; Hammer, S.A.; Mehrotra, S. Cities lead the way in climate change action. Nature 2010, 467, 909–911. [Google Scholar] [CrossRef] [PubMed]
- Iftikhar, Y.; He, W.; Wang, Z. Energy and CO2 emissions efficiency of major economies: A non-parametric analysis. J. Clean. Prod. 2016, 139, 779–787. [Google Scholar] [CrossRef]
- Zanon, B.D.B.; Roeffen, B.; Czapiewska, K.M.; de Graaf-Van Dinther, R.E.; Mooij, P.R. Potential of floating production for delta and coastal cities. J. Clean. Prod. 2017, 151, 10–20. [Google Scholar] [CrossRef]
- Franco, S.; Mandla, V.R.; Rao, K.R.M. Urbanization, energy consumption and emissions in the Indian context A review. Renew. Sustain. Energ. Rev. 2017, 71, 898–907. [Google Scholar] [CrossRef]
- Zhang, N.; Choi, Y. A note on the evolution of directional distance function and its development in energy and environmental studies 1997–2013. Renew. Sustain. Energ. Rev. 2014, 33, 50–59. [Google Scholar] [CrossRef]
- Yang, Z.; Cai, J.; Ottens, H.F.L.; Sliuzas, R. Beijing. Cities 2013, 31, 491–506. [Google Scholar] [CrossRef]
- Zhao, P. Too complex to be managed? New trends in peri-urbanisation and its planning in Beijing. Cities 2013, 30, 68–76. [Google Scholar] [CrossRef]
- Henderson, J.V. Cities and development. J. Regional. Sci. 2010, 50, 515–540. [Google Scholar] [CrossRef] [PubMed]
- Grimm, N.B.; Faeth, S.H.; Golubiewski, N.E.; Redman, C.L.; Wu, J.; Bai, X.; Briggs, J.M. Global change and the ecology of cities. Science 2008, 319, 756–760. [Google Scholar] [CrossRef] [PubMed]
- Charnes, A.; Cooper, W.W.; Rhodes, E. Measuring the efficiency of decision making units. Eur. J. Oper. Res. 1978, 2, 429–444. [Google Scholar] [CrossRef]
- Caves, D.W.; Christensen, L.R.; Diewert, W.E. Multilateral comparisons of output, input, and productivity using superlative index numbers. Econ. J. 1982, 92, 73–86. [Google Scholar] [CrossRef]
- Getis, A.; Ord, J.K. The Analysis of Spatial Association by Use of Distance Statistics; Springer: Berlin/Heidelberg, Germany, 2010; pp. 127–145. [Google Scholar]
- Zhao, J.; Chai, L. A novel approach for urbanization level evaluation based on information entropy principle: A case of Beijing. Physica A 2015, 430, 114–125. [Google Scholar] [CrossRef]
- Qi, W.; Deng, X.; Chu, X.; Zhao, C.; Zhang, F. Emergy analysis on urban metabolism by counties in Beijing. Phys. Chem. Earth Parts A/B/C 2017. [Google Scholar] [CrossRef]
- Zhang, L.; Zhao, S.X. City branding and the Olympic effect: A case study of Beijing. Cities 2009, 26, 245–254. [Google Scholar] [CrossRef]
- Fang, C.L.; Guan, X.L.; Lu, S.S.; Min, Z.; Yu, D. Input–Output efficiency of urban agglomerations in China: An application of data envelopment analysis (DEA). Urban Stud. 2013, 50, 2766–2790. [Google Scholar] [CrossRef]
- Lobo, J.; Bettencourt, L.M.A.; Strumsky, D.; West, G.B. Urban scaling and the production function for cities. PLoS ONE 2013, 8, e58407. [Google Scholar] [CrossRef] [PubMed]
Figure 1.
Location of Beijing and its administrative zones.

Figure 2.
General framework of the study.

Figure 3.
Dynamic trend of the total factor urbanization efficiency (TFUE) and total factor economic growth rate (TFEE).
Figure 3.
Dynamic trend of the total factor urbanization efficiency (TFUE) and total factor economic growth rate (TFEE).
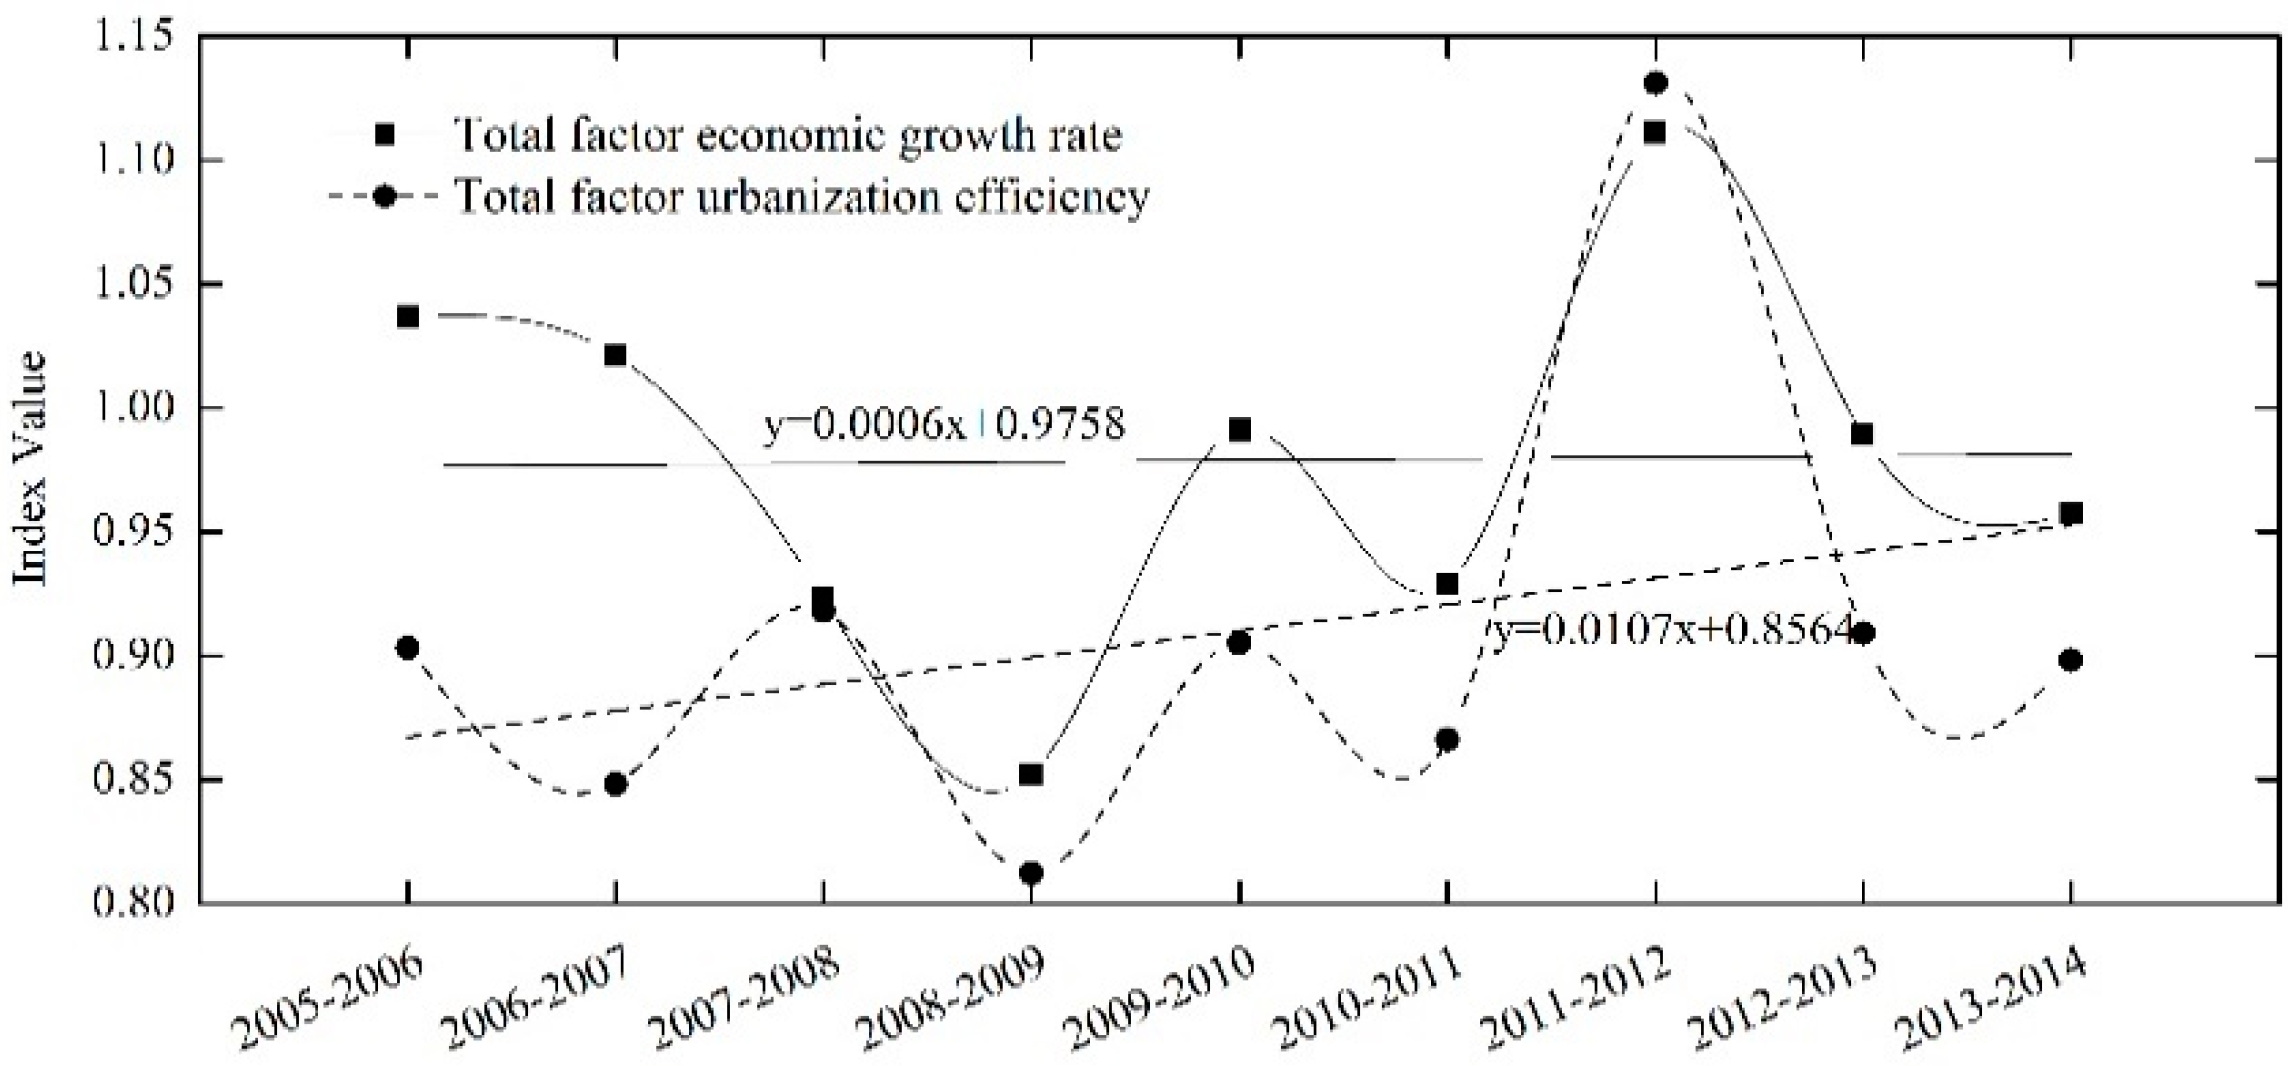
Figure 4.
TEC (a); TC (b); PTEC (c); and SEC (d) trends for urbanization efficiency and the economic growth rate.
Figure 4.
TEC (a); TC (b); PTEC (c); and SEC (d) trends for urbanization efficiency and the economic growth rate.

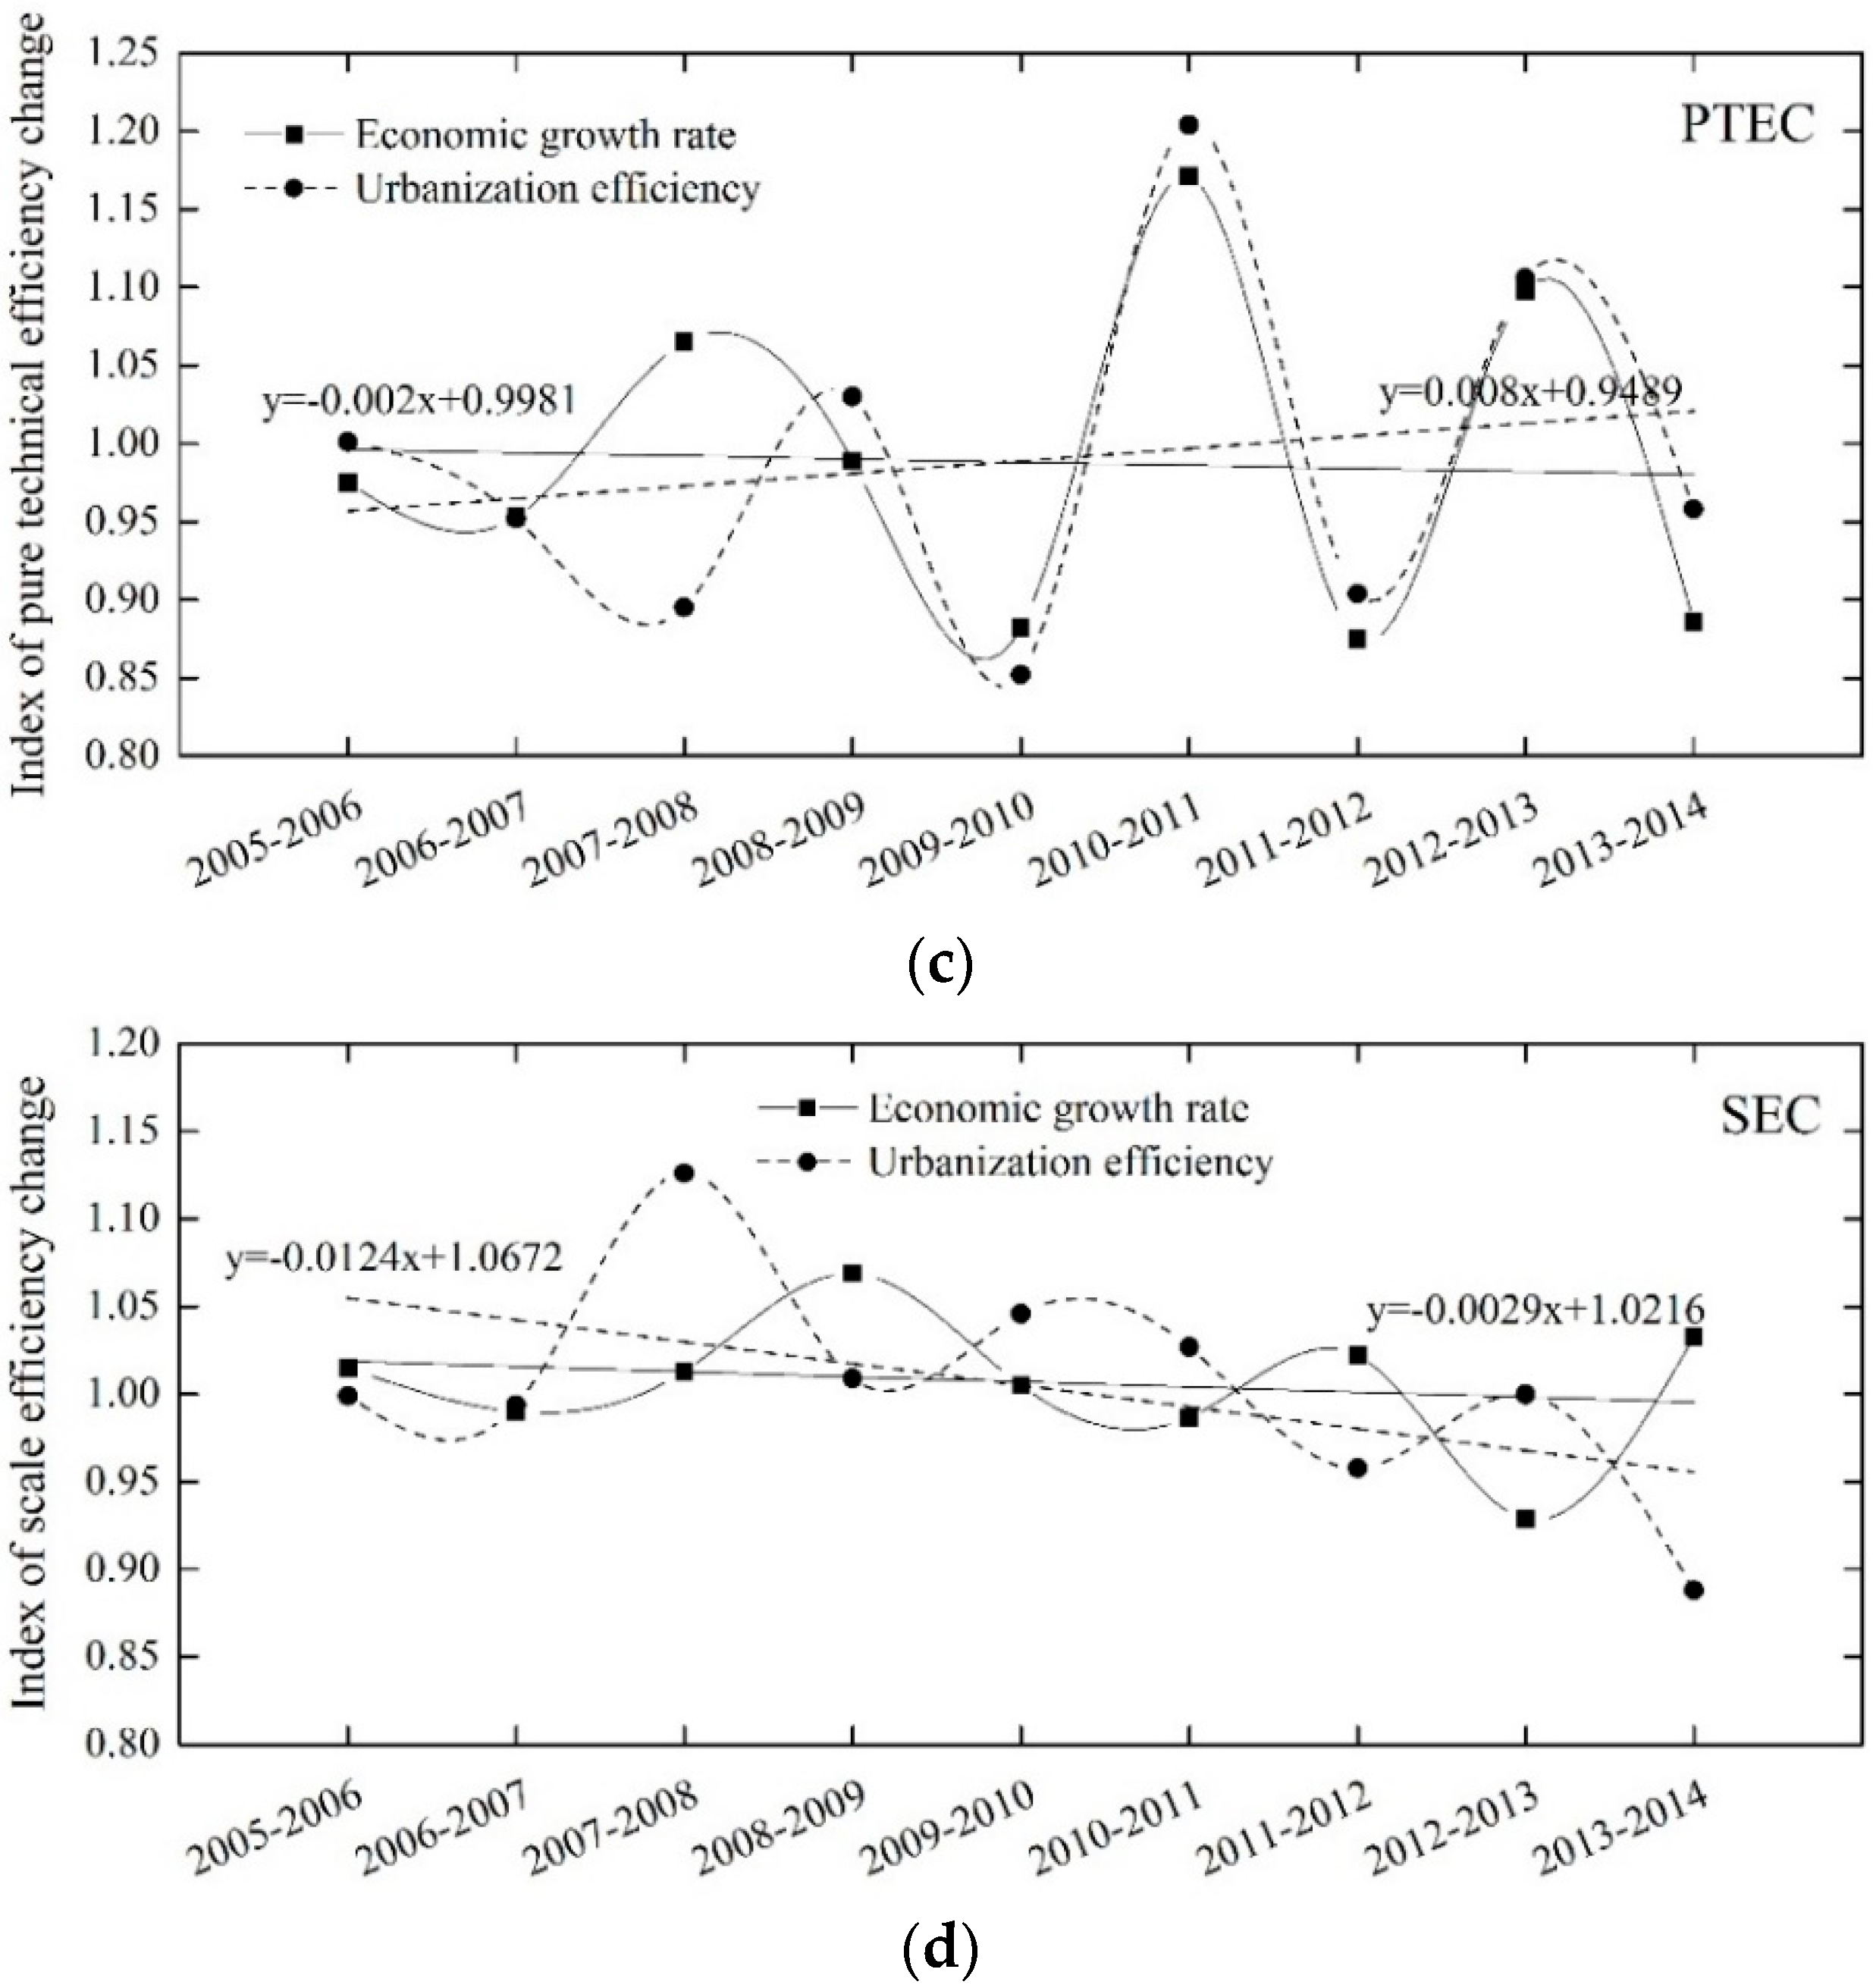
Figure 5.
Malmquist efficiency index and decomposition of the 16 districts in Beijing for the period 2005–2014.
Figure 5.
Malmquist efficiency index and decomposition of the 16 districts in Beijing for the period 2005–2014.

Figure 6.
The spatial pattern of the index of TEC during the period 2005–2014: (a) 2005–2006; (b) 2009–2010; and (c) 2013–2014.
Figure 6.
The spatial pattern of the index of TEC during the period 2005–2014: (a) 2005–2006; (b) 2009–2010; and (c) 2013–2014.
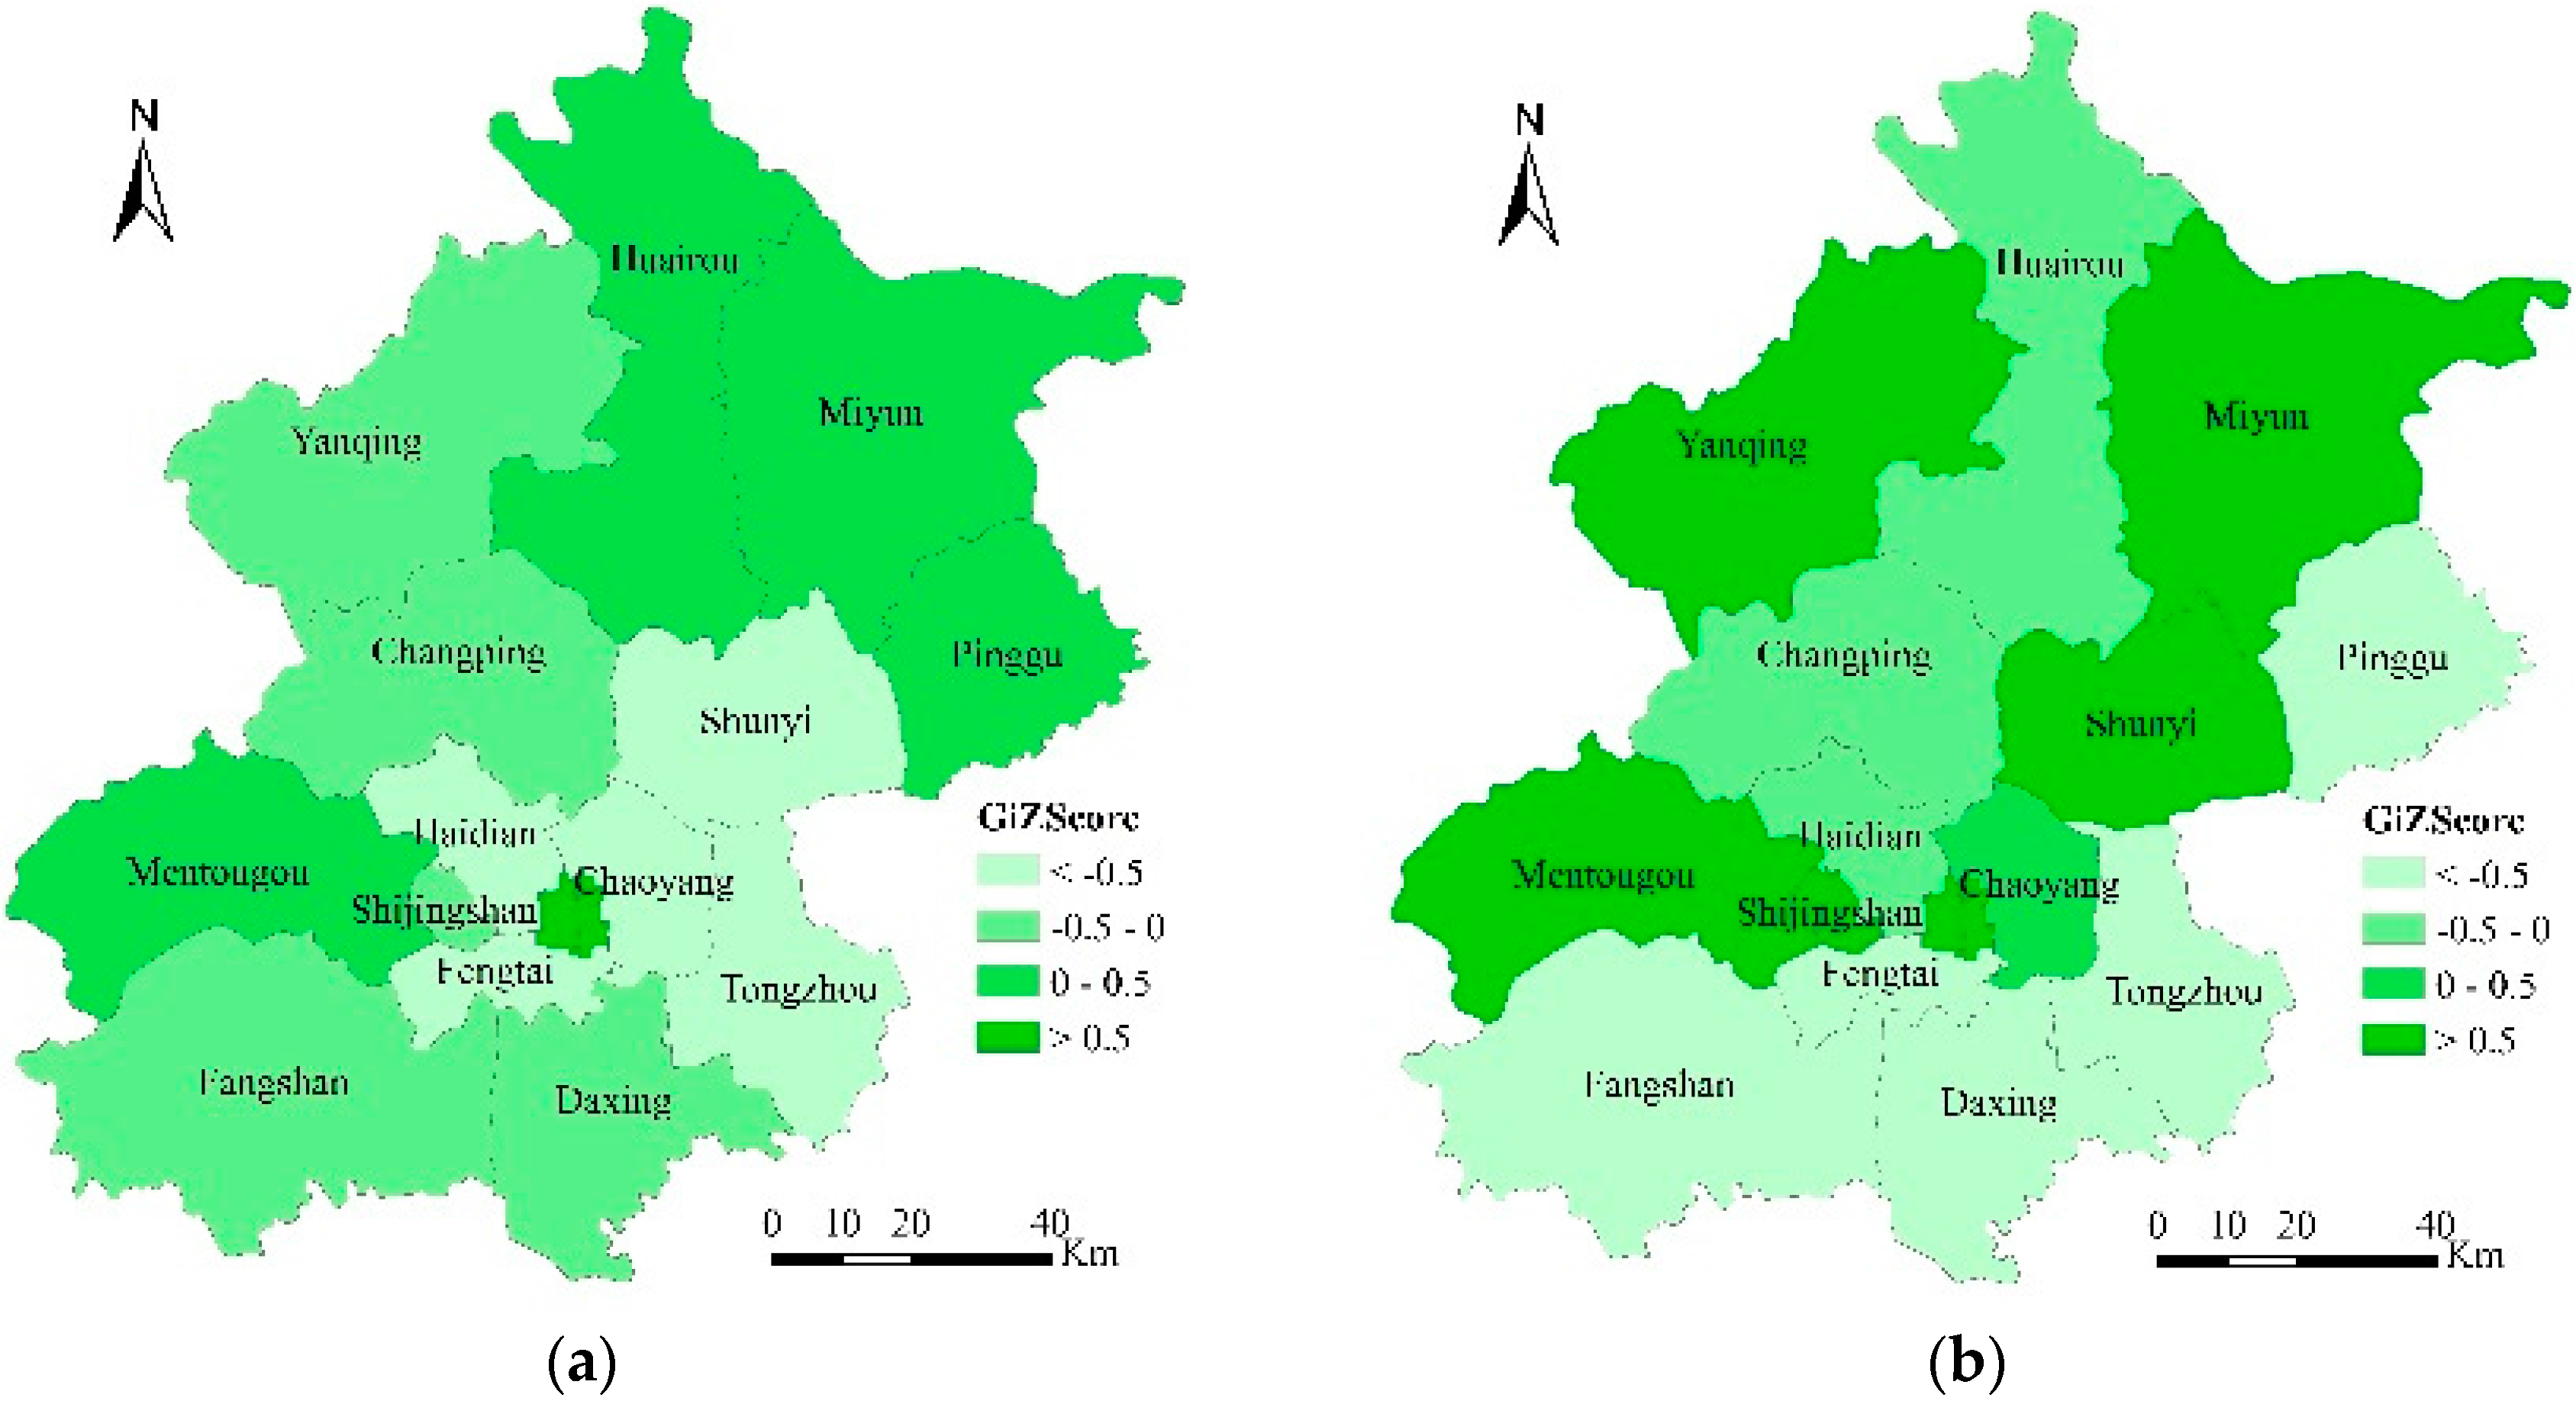

Figure 7.
Spatial pattern of the index of TC during the period 2005–2014: (a) 2005–2006; (b) 2009–2010; and (c) 2013–2014.
Figure 7.
Spatial pattern of the index of TC during the period 2005–2014: (a) 2005–2006; (b) 2009–2010; and (c) 2013–2014.
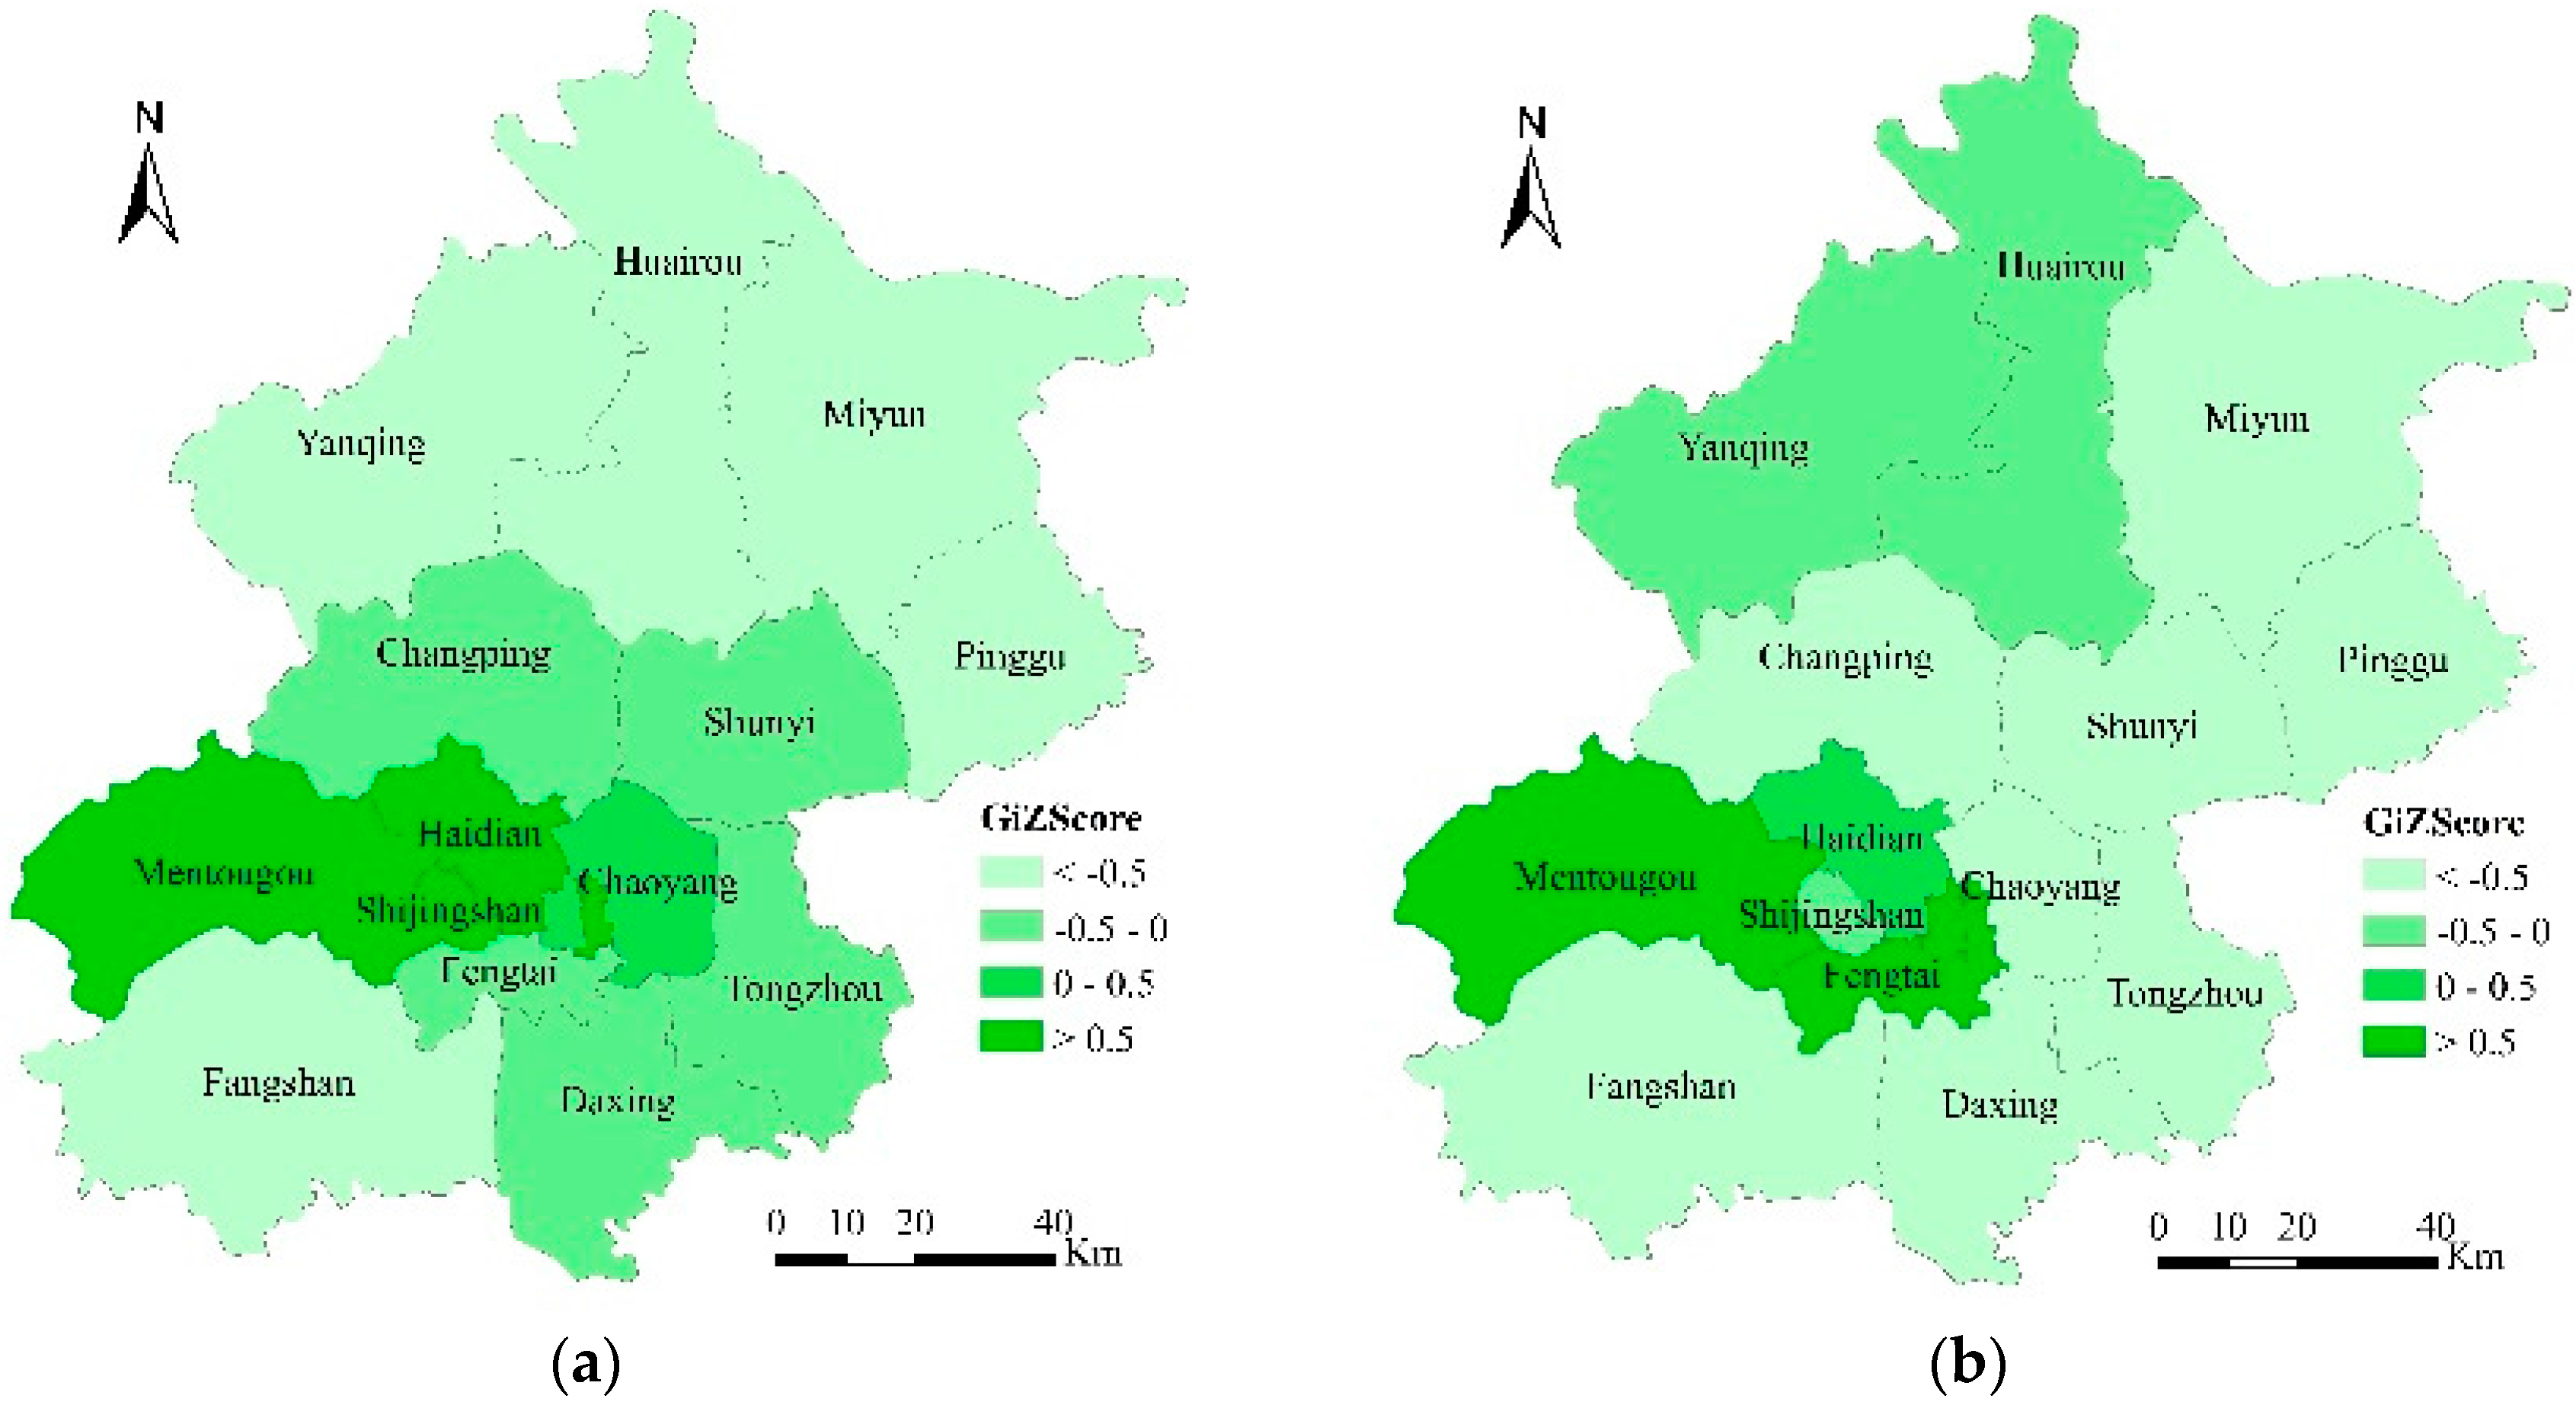
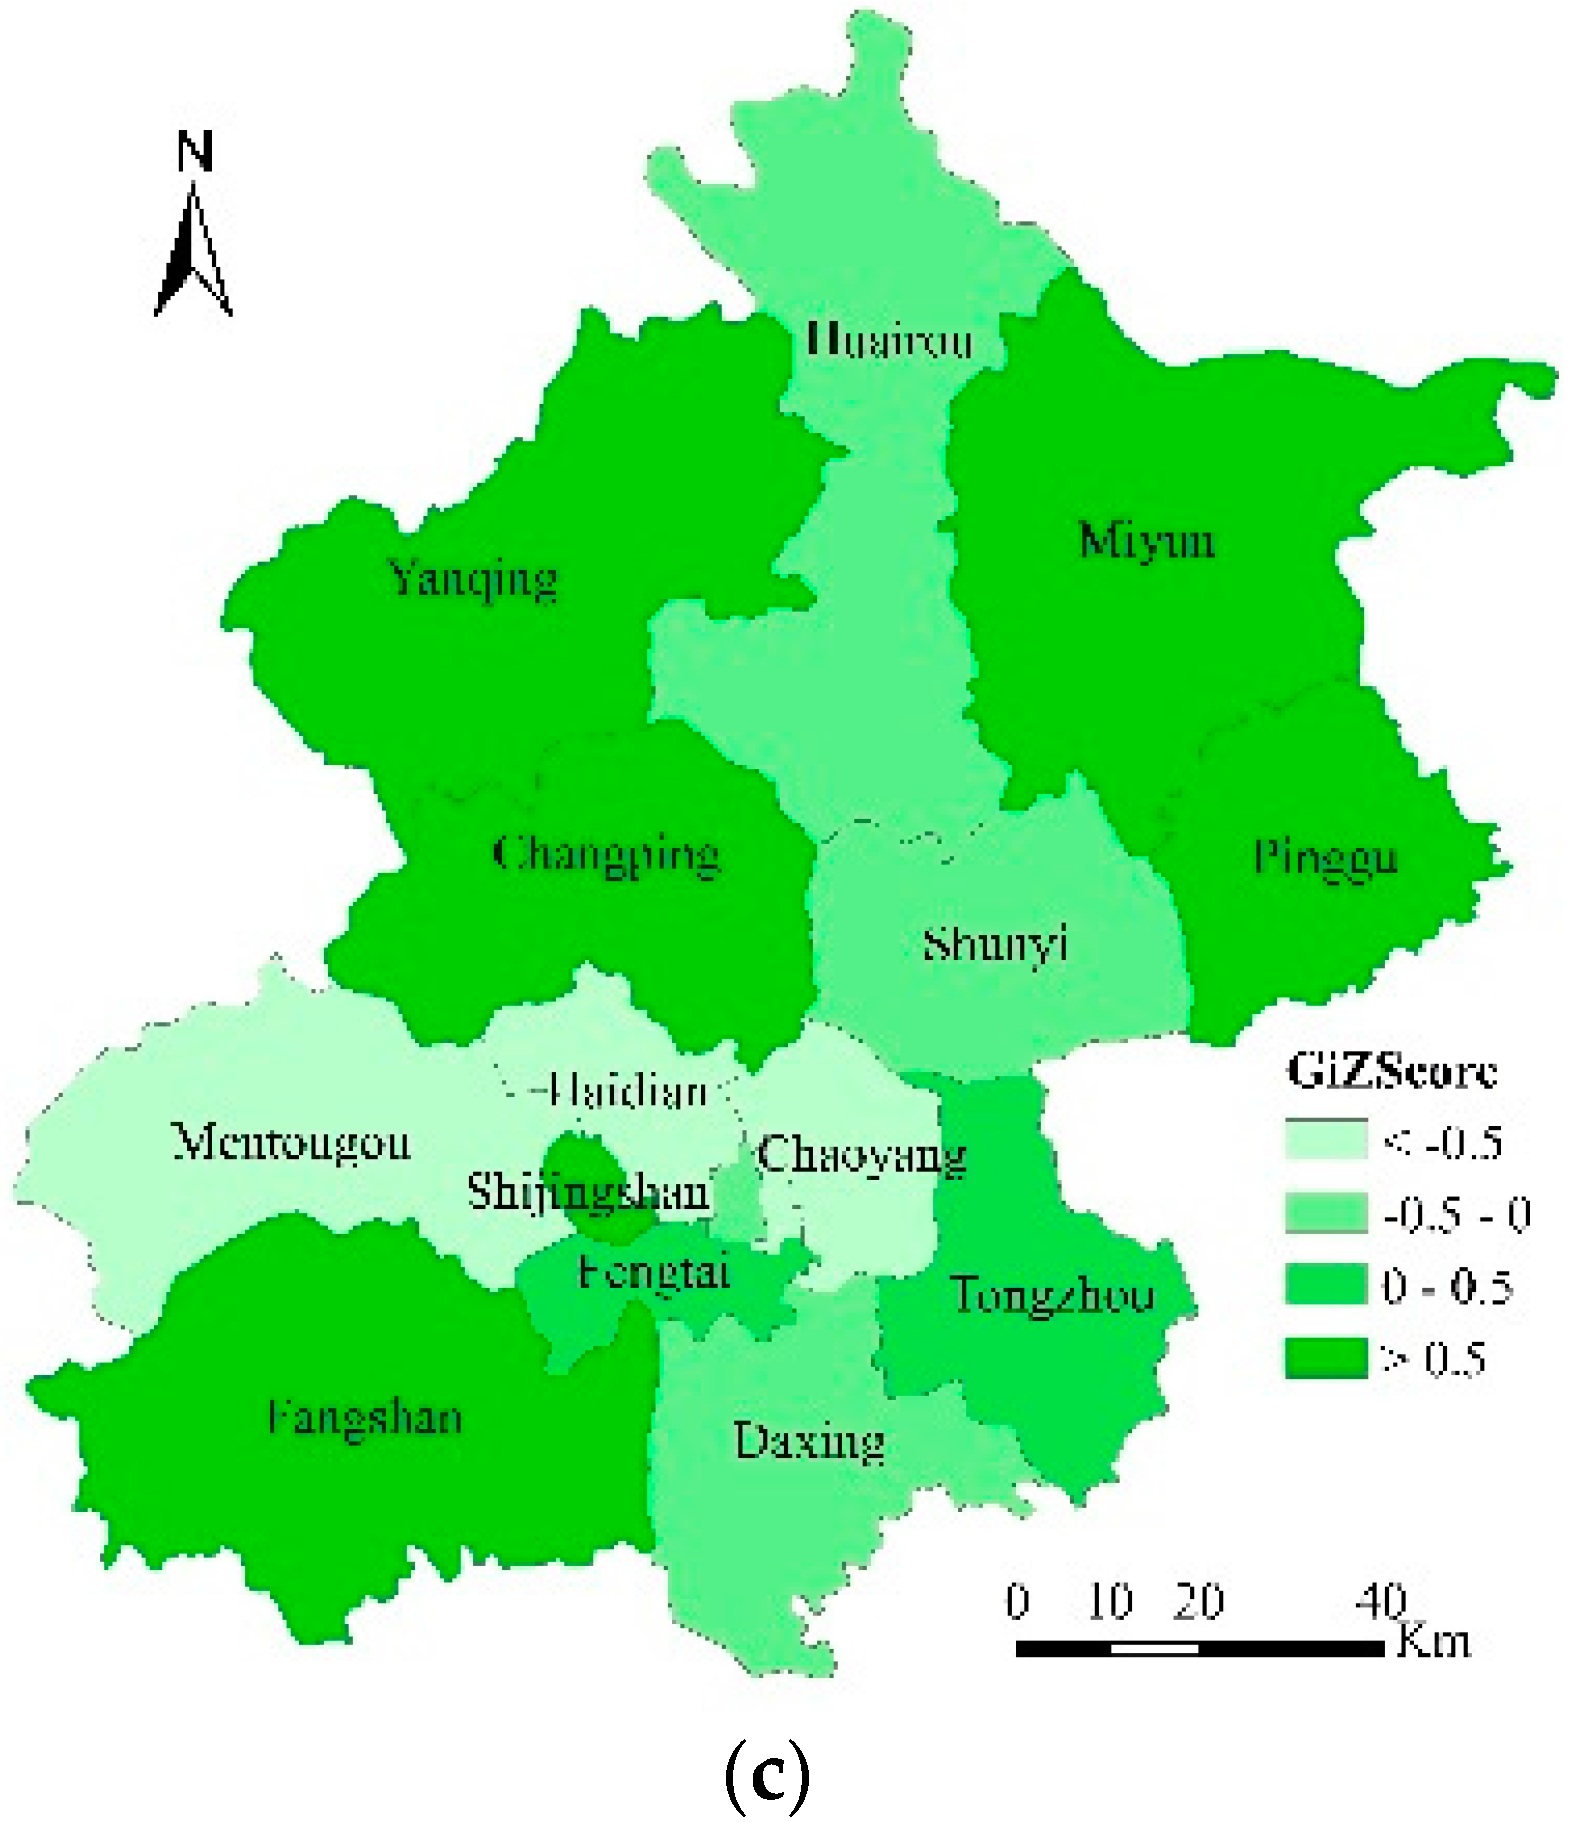
Figure 8.
Spatial pattern of the index of TFP during the period 2005–2014: (a) 2005–2006; (b) 2009–2010; and (c) 2013–2014.
Figure 8.
Spatial pattern of the index of TFP during the period 2005–2014: (a) 2005–2006; (b) 2009–2010; and (c) 2013–2014.


Table 1.
Descriptive statistics used in this study.
| Factor | Mean | Standard Deviation (SD) | SD/Mean | Maximum | Minimum |
|---|---|---|---|---|---|
| Floor space of constructed buildings (104 km2) | 251.797 | 20.008 | 0.079 | 1426.800 | 18.400 |
| Total investment in fixed assets (108 yuan) | 306.920 | 22.206 | 0.072 | 1235.441 | 16.700 |
| Foreign capital actually used (1010 USD) | 382.749 | 53.210 | 0.139 | 3900.110 | 0.820 |
| Employed persons (104 persons) | 39.158 | 3.106 | 0.079 | 164.415 | 3.983 |
| Financial expenditure (108 yuan) | 131.733 | 8.770 | 0.067 | 593.370 | 17.055 |
| Gross domestic product per capita (103 yuan/person) | 55.130 | 3.545 | 0.064 | 234.430 | 13.796 |
| Ratio of secondary industry and tertiary industry compared to gross domestic product (%) | 95.271 | 0.379 | 0.004 | 102.387 | 82.155 |
| Total retail sales of consumer goods (108 yuan) | 357.667 | 36.594 | 0.102 | 2377.633 | 12.844 |
Table 2.
Evaluation index system for assessing the economic growth rate and urbanization efficiency of Beijing.
Table 2.
Evaluation index system for assessing the economic growth rate and urbanization efficiency of Beijing.
| Type of Index | Index Constitution | Description of Input/Output Factors |
|---|---|---|
| Input factors | Floor space of constructed buildings | Land capital |
| Total investment in fixed assets | Material capital | |
| Foreign capital actually used | Foreign financial | |
| Employed persons | Human capital | |
| Financial expenditure | Financial capital | |
| Output factor for the economic growth rate | Gross domestic product per capita | Economic level |
| Output factor for urbanization efficiency | Ratio of secondary industry and tertiary industry compared to gross domestic product | Economic urbanization level |
| Total retail sales of consumer goods | Consumption level |
Table 3.
TFUE and TFEE in Beijing during the period 2005–2014.
| Period | Capital Function Core (CFC) | Urban Function Development (UFD) | City Development Zone (CDZ) | Ecological Conservation Development Area (ECD) | ||||
|---|---|---|---|---|---|---|---|---|
| TFEE | TFUE | TFEE | TFUE | TFEE | TFUE | TFEE | TFUE | |
| 2005–2006 | 1.386 | 1.424 | 0.931 | 0.864 | 1.004 | 0.820 | 1.071 | 0.887 |
| 2006–2007 | 1.111 | 1.146 | 0.896 | 0.798 | 0.938 | 0.664 | 1.240 | 1.050 |
| 2007–2008 | 1.002 | 1.118 | 0.952 | 1.008 | 1.070 | 0.983 | 0.811 | 0.796 |
| 2008–2009 | 1.137 | 1.188 | 0.821 | 0.887 | 0.760 | 0.636 | 0.928 | 0.874 |
| 2009–2010 | 1.407 | 1.789 | 0.926 | 0.942 | 0.826 | 0.676 | 1.156 | 0.938 |
| 2010–2011 | 0.967 | 0.921 | 1.083 | 0.936 | 1.114 | 1.089 | 0.788 | 0.768 |
| 2011–2012 | 1.298 | 1.420 | 0.870 | 0.910 | 0.918 | 0.891 | 1.798 | 1.861 |
| 2012–2013 | 1.213 | 1.376 | 0.889 | 0.865 | 0.952 | 0.833 | 1.088 | 0.912 |
| 2013–2014 | 1.087 | 1.048 | 0.916 | 0.913 | 0.930 | 0.813 | 1.032 | 0.969 |
Table 4.
Malmquist TFP index and decomposition of 16 districts in Beijing for the period 2005–2014.
| District | Technical Efficiency Change (TEC) | Technical Change (TC) | Pure Technical Efficiency Change (PTEC) | Scale Efficiency Change (SEC) | Total Factor Productivity (TFP) |
|---|---|---|---|---|---|
| Dongcheng | 1.069 | 1.162 | 1.000 | 1.069 | 1.242 |
| Xicheng | 1.099 | 1.118 | 1.000 | 1.099 | 1.228 |
| Chaoyang | 0.973 | 0.877 | 0.945 | 1.030 | 0.854 |
| Fengtai | 0.965 | 0.896 | 0.957 | 1.009 | 0.865 |
| Shijingshan | 1.000 | 0.885 | 1.000 | 1.000 | 0.885 |
| Haidian | 1.027 | 0.918 | 1.000 | 1.027 | 0.943 |
| Fangshan | 0.970 | 0.876 | 1.040 | 0.933 | 0.850 |
| Tongzhou | 0.923 | 0.860 | 0.949 | 0.973 | 0.794 |
| Shunyi | 0.952 | 0.882 | 0.978 | 0.974 | 0.840 |
| Changping | 0.929 | 0.858 | 0.946 | 0.982 | 0.797 |
| Daxing | 0.891 | 0.828 | 0.922 | 0.967 | 0.738 |
| Mentougou | 1.003 | 0.831 | 1.000 | 1.003 | 0.834 |
| Huairou | 1.014 | 0.895 | 1.000 | 1.014 | 0.908 |
| Pinggu | 0.995 | 0.870 | 0.992 | 1.003 | 0.866 |
| Miyun | 1.002 | 1.003 | 1.020 | 0.982 | 1.004 |
| Yanqing | 1.000 | 1.009 | 1.000 | 1.000 | 1.009 |
| Mean | 0.987 | 0.918 | 0.984 | 1.003 | 0.906 |
Table 5.
Static urbanization efficiency of 16 districts in Beijing in 2014.
| District | Comprehensive Efficiency (TEC) | Pure Technical Efficiency (PTEC) | Scale Efficiency (SEC) | Returns to Scale |
|---|---|---|---|---|
| Dongcheng | 1.000 | 1.000 | 1.000 | - |
| Xicheng | 1.000 | 1.000 | 1.000 | - |
| Chaoyang | 0.249 | 0.308 | 0.808 | drs * |
| Fengtai | 0.382 | 0.551 | 0.693 | drs |
| Shijingshan | 1.000 | 1.000 | 1.000 | - |
| Haidian | 0.300 | 0.391 | 0.767 | drs |
| Fangshan | 0.447 | 0.858 | 0.521 | drs |
| Tongzhou | 0.315 | 0.410 | 0.767 | drs |
| Shunyi | 0.342 | 0.439 | 0.778 | drs |
| Changping | 0.344 | 0.598 | 0.575 | drs |
| Daxing | 0.219 | 0.302 | 0.726 | drs |
| Mentougou | 1.000 | 1.000 | 1.000 | - |
| Huairou | 0.950 | 1.000 | 0.950 | drs |
| Pinggu | 0.756 | 0.764 | 0.990 | irs ** |
| Miyun | 0.696 | 0.846 | 0.822 | drs |
| Yanqing | 1.000 | 1.000 | 1.000 | - |
| Mean | 0.625 | 0.717 | 0.837 | - |
* drs is short for decreasing returns to scale; ** irs is short for increasing returns to scale.
© 2017 by the authors. Licensee MDPI, Basel, Switzerland. This article is an open access article distributed under the terms and conditions of the Creative Commons Attribution (CC BY) license (http://creativecommons.org/licenses/by/4.0/).
Share and Cite
MDPI and ACS Style
Qi, W.; Gao, Y.; Zhang, Q. Spatiotemporal Dynamics of Beijing’s Urbanization Efficiency from 2005 to 2014. Sustainability 2017, 9, 2190. https://doi.org/10.3390/su9122190
AMA Style
Qi W, Gao Y, Zhang Q. Spatiotemporal Dynamics of Beijing’s Urbanization Efficiency from 2005 to 2014. Sustainability. 2017; 9(12):2190. https://doi.org/10.3390/su9122190
Chicago/Turabian StyleQi, Wei, Ying Gao, and Qian Zhang. 2017. "Spatiotemporal Dynamics of Beijing’s Urbanization Efficiency from 2005 to 2014" Sustainability 9, no. 12: 2190. https://doi.org/10.3390/su9122190
Note that from the first issue of 2016, this journal uses article numbers instead of page numbers. See further details here.