Eco-Innovation Indices as Tools for Measuring Eco-Innovation


1
Graduate School of International Agricultural Technology, Institutes of Green Bio Science and Technology, Seoul National University, 1447, Pyeongchang-daero, Daehwa, Pyeongchang, Gangwon 25354, Korea
2
Institute for Sustainable Resources, University College London, Central House, 14 Upper Woburn Place, London WC1H 0NN, UK
3
Department of Forest Sciences, Seoul National University, 1 Gwanak-ro Gwanak-gu, Seoul 08826, Korea
4
ASEM SMEs Eco-Innovation Center, E-2FL, Pangyo Innovalley 255, Pangyo-ro, Bundang-gu, Seongnam-si, Gyeonggi-do 13486, Korea
*
Author to whom correspondence should be addressed.
Sustainability 2017, 9(12), 2206; https://doi.org/10.3390/su9122206
Submission received: 1 September 2017
/
Revised: 23 November 2017
/
Accepted: 23 November 2017
/
Published: 29 November 2017
(This article belongs to the Section Economic and Business Aspects of Sustainability)
Abstract
:Measuring eco-innovation helps us understand the overall trends and raises awareness in society. Measuring eco-innovation at the national level and making comparisons across countries may allow us to benchmark performance and foster policy learning. This paper assesses two indices developed in two different regions: The ASEM Eco-Innovation Index (ASEI) by the ASEM SMEs Eco-Innovation Center, based in Republic of Korea; and the Eco-Innovation Scoreboard (Eco-IS) developed by the Eco-Innovation Observatory, based in the European Union. This paper aims to examine and compare the features of both and attempts to obtain insights on their strengths and weaknesses. Towards this aim, our paper assesses those scoreboards against four criteria stemming from innovation analysis: (1) relevance of areas and stakeholders covered; (2) ability to indicate changes; (3) directions towards common goals; and (4) ability to facilitate further changes. We conclude both are promising, despite data shortages, and have great potential to contribute towards the sustainable development goals (SDGs), particularly with regard to the SDGs on sustainable industrialization and sustainable consumption and production. In comparison, the ASEI covers more countries than the Eco-IS. However, the ASEI has limitations on measuring indicators due to limited data availability in Asian countries. The Eco-IS is closely linked with the regional and national policies for eco-innovation in Europe, while the ASEI’s impact appears more limited, as of now. In conclusion, the research results give insights into key areas, goals and applications of eco-innovation indices, and can help upgrading eco-innovation indices. This research helps interpret the scores of two indices better and facilitate application of the scores in the multiple ways. It is expected that this research contributes to developing and modifying a global eco-innovation index and enhancing the ability of these indices to facilitate eco-innovation strategies at national levels and across relevant actors.
1. Introduction
The concept of eco-innovation has emerged as a global approach for fostering sustainable development for all societies. Eco-innovation can be defined as “all efforts from relevant actors that introduce, develop, and apply new ideas, behaviours, products and processes and contribute to reducing environmental burdens or ecologically specified sustainability targets” [1]. Eco-innovation plays a key role in promoting and implementing green growth because it promotes all forms of innovation that reduce environmental impacts and strengthens resilience to environmental pressures [2]. It is also decisive in efforts towards resource efficiency and a circular economy.
Emphasizing eco-innovation as a means for achieving sustainable development requires information on the performance of main actors, in particular, countries. Such a macro-level scope is in line with research on national innovation systems, outlined below. Measuring country performance of eco-innovation has started via indices or scoreboards, which come with indicators and scores and help come up with benchmarks across countries. Policy and innovation actors can thus learn about diagnosing different areas of eco-innovation, monitoring trends and directions, and drawing lessons about the strengths and weaknesses across countries. Therefore, such attempts go beyond measuring and facilitate communication on eco-innovation for public and private actors alike.
The study on eco-innovation began around the year 2000, and the number of publications rapidly increased after 2009 [3]. Research on eco-innovation can be classified into four areas: (1) definition and concepts of eco-innovation [1,4,5]; (2) types of eco-innovation [6,7,8]; (3) policies and governance of eco-innovation [2,9,10,11,12,13]; and (4) measuring eco-innovation [3,14,15,16,17]. This paper belongs to the fourth research area. The process of eco-innovation was measured with the categories of input, output, and impact through the survey and data set [14]. Eco-innovation implementation was measured with three categories of organization, process and product through the survey at the firm level [17]. The previous research mostly focused on fields and framework of eco-innovation measures. Few research reviewed the developed tools for measuring eco-innovation and application of the results. Within the context, this research attempts to extend the scope and scale of eco-innovation research. It aims to examine and compare the features of two main eco-innovation indices developed to measure and compare national performances of eco-innovation. It attempts to gain insights into the strengths and weakness of the ASEM Eco-Innovation Index (ASEI), developed by ASEM (Asia-Europe Meeting) SMEs Eco-Innovation Center (ASEIC), based in the Republic of Korea; and the Eco-Innovation Scoreboard (Eco-IS), developed by Eco-Innovation Observatory (EIO), based in the European Union. Based on literature, we have developed four criteria: (1) relevance of covering areas and stakeholders; (2) ability to indicate changes; (3) directions towards common goals; and (4) ability to facilitate further changes. Finally, the paper draws conclusions on strengths and weaknesses and lessons learned with the aim of modifying eco-innovation indices and facilitating communication on eco-innovation strategies at the national level and across relevant actors.
2. Theoretical Background
2.1. Concept of Eco-Innovation
Recognizing limitations imposed by the state of technology and social organization on the environment’s ability to meet present and future needs, the concept of sustainable development emerged as a global goal in the late 1980s [18]. Sustainable development is “a process of change in which the exploitation of resources, the direction of investments, the orientation of technological development, and institutional change are all in harmony and enhance both current and future potential to meet human needs and aspirations [18]”. To achieve sustainable development, various efforts were attempted by multiple actors. In particular, the roles of business and industry were emphasized in reducing impacts on resource use and the environment through more efficient production processes, preventive strategies, and cleaner production technologies and procedures [19]. Sustainability requires innovation performances including the implementation of a new or significantly improved product (goods or services), or process, a new marketing method, or a new organizational method in business practices, workplace organization or external production [6] (p. 46). In practice, sustainability and innovation performance by the firms has the positive and significant correlation [20]. Recognizing bidirectional impact between sustainability and innovation, eco-innovation can be defined as “all efforts from relevant actors that introduce, develop, and apply new ideas, behaviors, products and processes and contribute to reducing environmental burdens or ecologically specified sustainability targets [1].” Incremental innovations such as green products and eco-efficiency improvement is the dominant form of eco-innovation in industry [21,22]. The eco-innovation performances can used in assessing eco-innovation at the country level. The national status of eco-innovation indicates country’s competitiveness including eco-efficiency and infrastructure. Therefore, endeavors to eco-innovation towards sustainability contribute to enhancing national competitiveness [23].
2.2. Measuring Eco-Innovation
With the emerging importance of eco-innovation since the late 1990s, several scholars have paid attention to measuring it [14,15,16,17]. Measuring eco-innovation enables us to assess the progress of the components of eco-innovation. In practice, it helps policy makers to understand the overall trend of eco-innovation and its drivers and barriers, and to design effective policies and framework conditions for eco-innovation [16]. It contributes to raising awareness of eco-innovation in the society and is especially encouraging for companies to increase their eco-innovation efforts.
Eco-innovation can be measured directly and indirectly [15]. Kemp and Pearson [14] classified measurements into four types to quantify technological changes, considering the process of eco-innovation: input measures, intermediate output measures, direct output measures and indirect impact measures. Input measures include research and development (R&D) expenditures, R&D personnel and innovation expenditures. Intermediate output measures consist of patents, scientific publication and citations. Direct output measures include data on new product sales, based on product and trade information databases. Indirect impact measures are derived from aggregate data, including resource efficiency and productivity. Indirect impact can be measured with company information about innovation and eco-innovation performance, obtained from the specially designed surveys.
To create a measurable index, it is important to conceptually understand the specific details of eco-innovation. Based on the studies completed so far, the types of innovation that need to be included when measuring eco-innovation are as follows: product innovation, process innovation, marketing innovation, organizational innovation, material flow innovation and social innovation [6,7]. Although a study from the OECD [6] only considered product innovation, process innovation, marketing innovation and organizational innovation as the major types of eco-Innovation, EIO [7] stressed the significance of material flow innovation and social innovation. Thus, these two types of innovation are included in the list of truly important types of eco-innovation. As its scope has extended, Eco-innovation started to catch the various environments around companies and interactions between stakeholders. This signifies that the material flows are also considered with the economic activities, both in their physical and socio-economic dimensions. In particular, the commodity price increases since the year 2000 have driven attempts to increase resource efficiency and to enhance raw material security at the industry and country levels, which requires indicators based on material flow analysis [24].
Eco-innovation is not a one-way-process with inputs generating outputs, but a complex process that covers regulations, surrounding environments and personnel, all of which have influences on the eco-innovation. Dissemination and market development differs significantly and is uneven. Thus, establishing an appropriate framework is essential for capturing and measuring the dynamic nature of eco-innovation.
Eco-innovation can be measured at different levels: sectoral, firm, national, regional and international. National indicators can provide a framework for collecting and reporting within nations and for reporting national data to international bodies and other nations [25]. Measuring eco-innovation at the national level informs which countries are the global leaders. In particular, measuring eco-innovation policies as supporting environments for eco-innovation provides us information on which countries are leaders, followers, loungers or laggards [2]. Among 17 Asian countries, Japan, Singapore, the Republic of Korea and China emerged as leaders. Thailand, Indonesia, Malaysia and the Philippines follow the trend of eco-innovation policies. Pakistan, Vietnam, India, Mongolia, and Bangladesh are loungers that slowly catch up to eco-innovation approaches. Myanmar, Lao PDR, Brunei Darussalam and Cambodia are laggards in eco-innovation. This research results based on the number of eco-innovation policy instruments can support understanding the scores of eco-innovation index in Asian countries.
2.3. Indicators
Indicators simplify, clarify and make aggregated information available to decision makers and the public [26] (p. 3). They can help measure and calibrate progress toward social, environmental and economic goals, such as sustainable development. Indicators provide information in a simpler, more readily understood form than complex statistics or other kinds of primary data derived from monitoring and data analysis, and imply a model or set of assumptions that relates indicators to more complex phenomena [25] (p. 1). They often indicate changes towards a desired direction and the speed of change. Environmental indicators play a role as a useful tool in highlighting environmental conditions and trends for policy purposes and help policy-makers see larger patterns of what is happening and determine appropriate actions [27].
Several scholars pointed out the characteristics of indicators. Hollander [28] (p. 3) identified nine of the most common criteria for selecting indicators: (1) validity; (2) relevance; (3) consistency and reliability; (4) measurability; (5) clarity; (6) comprehensiveness; (7) cost-effectiveness; (8) comparability; and (9) attractiveness to the media. Phillips [29] (p. 20) added that a successful indicator should: (1) be appropriate to its political, institutional, jurisdictional, or other context; (2) be meaningful and useful to stakeholders; (3) use affordable, relevant, and accessible data sources; (4) clearly state and accurately reflect its intent; (5) result from close collaborations with stakeholders during the selection, application and review process; (6) connect and be consistent with well-articulated vision statements and goals; and (7) cause a government to take action. Hommond et al. [25] illustrated three characteristics of successful indicators. Indicators must be: (1) useful to their intended audience; (2) pertinent to policy concerns; and (3) highly aggregated.
In developing environmental indicators, there are two approaches: data-driven and theory-driven [27]. In the data-driven approach, data availability is the central criterion for indicator development. In the theory-driven approach, selection of indicators is based on a theoretical framework and data availability is regarded as only one of the reasons involved. In practice, both approaches are often combined.
Several indicators which measure environmental performance have been developed, including the Global Cleantech Innovation Index, by the Cleantech andWorld Wildlife Fund for Nature [30,31,32,33]; the Environmental Performance Index, by the Yale Center for Environmental Law & Center for International Earth Science Information Network [31,34]; and the Green Growth Indicator, by the OECD [35,36]. The indicators include some outcomes of eco-innovation, such as government’s policy, green technology capacity, investment level and social recognition. However, the indicators do not capture eco-innovation well enough to benchmark countries’ performance. There is a specific scope for further efforts to measuring eco-innovation, as the following section describes.
2.4. Linking Indicators Back to Theories on Innovation Systems and Transitions
Research has long recognized the importance of innovation systems, rather than focusing on single activities. They focus on firms, technologies and financing, as well as on relevant institutions for which the national level is thought of as quite relevant. Following Richard Nelson [37], many attempts now analyze market conditions for production factors (e.g., availability of energy) and products; they assess the research and education systems and their interlinkages with innovations, as well as macro-economics and communication issues, such as environmental awareness and the role of media. Figure 1 represents a national innovation system as a determinant for countries’ economic performance, and how it is, in turn, shaped by a range of nationally-specific structural factors [38].
In line with such consensus, the literature on transition management [39,40,41] focuses on the emergence and dissemination of innovations, seen as developing niche markets first, which may—under certain conditions—move forward to changing existing regimes (e.g., in energy markets) and onto the wider changes (called “landscape changes”). Their research underpins recent broader findings, from Acemoglu et al. [42] and Mazzucato [43], highlighting the directionality of technical changes, e.g., towards sustainability or not, and the “entrepreneurial” role states might be able to play.
What follows from such findings for indices and scoreboards is a scope beyond traditional innovation indicators like patents. The findings address the entire chain of innovation activities from research and development into niches and—eventually—mass market development overcoming the manifold constraints. They highlight the role of governance and policies. Indeed, the result needs to be a compromise reflecting the need for a limited set of indicators, rather than an exhaustive list, and limited data availabilities. However, it is likely that there is no ideal balance between all those aspects, and, thus, our analysis carefully reflects these limitations at the end of our article.
3. Eco-Innovation Indices
3.1. ASEM Eco-Innovation Index
The ASEI has been developed and modified since 2012 by ASEIC, which was established in 2011 as a result of the endorsement accepted by the ASEM member countries at the 8th ASEM Summit in 2010 and is based in Republic of Korea. ASEIC has annually assessed eco-innovation phenomena across ASEM member countries using the ASEI. The current members of ASEM consist of 31 countries from Europe and 20 countries from Asia (Table 1).
The ASEI was developed based on the input/output framework of eco-innovation [3]. It is composed of 20 indicators divided into four components: “Eco-innovation Capacity”, “Eco-innovation Supporting Environment”, “Eco-innovation Activity” and “Eco-innovation Performance” (Table 2). Eco-innovation Capacity includes five indicators triggering eco-innovation in a country, the personnel concerned, social components, innovation abilities and capacity presented in existing research: Nation’s Economic Competitiveness, Nation’s General Innovation Capacity, Green Technology R&D Institution Capacity, Green Technology possessed/acquired Enterprises and Awareness of Sustainability Management. Eco-innovation Supporting Environment includes four indicators representing government’s institutional support and enabling environment for eco-innovation, company responses toward regulations and supports and mutual relationships in innovation: Government’s R&D expenditure in Green Industry, Implementation of Environmental Regulations, Maturity of Investment Setting for Green Technology Industry and Investment Scale of Green Technology SMEs. Eco-innovation Activity includes five indicators representing degree of advancement and implementation of eco-innovation in corporations and usage of eco-resources in the overall economy: Commercialization Level of Green Technology, Enterprises’ Participation on Environmental Management System, Economic Influence of Leading Environmentally Responsive Enterprises, and Green Patents and Activeness of Renewable Energy Utilization. Eco-innovation Performance includes six indicators representing outcomes of eco-innovation activities in economic, social and environmental area: Level of Environmental Impact on Society, CO2 Emission Intensity, Nation’s Energy Sustainability Level, Water Consumption Intensity, Jobs in Green Technology Industry and Green Industry Market Size. The 20 indicators were originally selected from previous research and measured depending on published sources (Appendix A). Twelve among the 20 indicators were eventually used for the 2016 ASEI, depending on data availability: three indicators for “capacity”, one indicator for “Supporting Environment”, three indicators for “activity” and five indicators for “performance”.
In the process of measuring indicators for cases with a missing value ratio below 5%, the statistical method was applied to replace the missing values. To do this, an expectation-maximization (EM) algorithm based on likelihood-based procedures was applied in the study. Multiple imputations (MI) were used to estimate missing values. The same weight was applied to 12 factors, based on a suggestion by [6,7] for measuring factors. To make the values comparable, all extracted values were transposed to standardized values using Min-Max methodology [3]. The 12 indicators are measured with different sources (Appendix A). Detail information on the process of measuring the indicators is included in Supplementary Materials and References [3,44,45].
3.2. Eco-Innovation Scoreboard (ECO-IS)
The EIO, established in 2009, is an initiative financed by the European Commission’s Directorate-General for the Environment, from the Competitiveness and Innovation Framework Programme, working to observe the types, degrees and impacts of eco-innovation in the European Union. The EIO developed the Eco-IS in 2010 as a tool to assess and illustrate eco-innovation performance across the EU member states. As of 2015, the Eco-IS presented the eco-innovation of 28 member states of the European Union. The scoreboard consists of 16 indicators grouped into five components: eco-innovation inputs, eco-innovation activities, eco-innovation outputs, resource efficiency outcomes and socio-economic outcomes (Table 3). Eco-innovation input includes three indicators triggering eco-innovation in a country, research, personnel concerned and investment: a governments’ environmental and energy R&D appropriations and outlays, total R&D personnel and researchers and total value of green early stage investments. Eco-innovation activities includes three indicators representing firm’s innovative activities for reducing material input and energy input per unit output and for creating environmental management system: firms having implemented innovation activities aiming at a reduction of material input per unit output, firms having implemented innovation activities aiming at a reduction of energy input per unit output and ISO 14001 registered organizations. Eco-innovation Outputs includes three indicators representing degree of advancement and implementation of eco-innovation in corporations and communication by scientists and media: eco-innovation related patents, eco-innovation related academic publications and eco-innovation related media coverage. Resource Efficiency Outcomes includes four indicators representing outcomes of eco-innovation activities in the environmental area with the focus on productivity and intensity: material productivity, water productivity, energy productivity, and greenhouse gas emissions intensity. Socio-Economic Outcomes includes three indicators relating to eco-industries: exports of products from eco-industries, employment in eco-industries and turnover in eco-industries.
According to a technical note from the Eco-IS [46] (p. 4), country-specific figures of the single indicator are weighted with the share of population to calculate an EU average which corrects for the bias of smaller member states. Therefore, the EU average of a sub-indicator presents the weighted mean of all country-specific data of the EU member states. The EU average of indicators that display absolute numbers is built directly, by summing up the underlying data.
Unlike the ASEI, missing data are not replaced by estimations. Countries for which data are not available do not get a result for the respective indicator. The score of the index in each of the five components is calculated by the unweighted mean of the underlying indicators. Consequently, each indicator has the same weighting in the five components. The overall scoreboard of an EU Member State is calculated by the unweighted mean of the 16 sub-indicators, to avoid bias by components of the scoreboard which consist of only a few indicators. The Eco-IS are measured with different data sources (Appendix B). Detail information on the process of measuring the indicators is included in Supplementary Materials and Reference [46].
4. Method
To analyze two eco-innovation indices, the ASEI and Eco-IS, we developed an analysis framework. Considering technical characteristics of indicators [25,28,29], scope and future-orientation of indicators, the following four criteria were selected: (1) relevance of covering areas and stakeholders; (2) ability to indicate changes; (3) directions towards common goals; and (4) ability to facilitate further changes (Table 4). Four analysis criteria were based on innovation and sustainability studies [23,47] and indicator studies including requirements and roles of indicators [28,48]. Detail explanation of analysis criteria are found in Section 4.1, Section 4.2, Section 4.3 and Section 4.4. The strengths and weakness of the two indices is analyzed with the above four foci.
4.1. Relevance of Covering Areas and Stakeholders
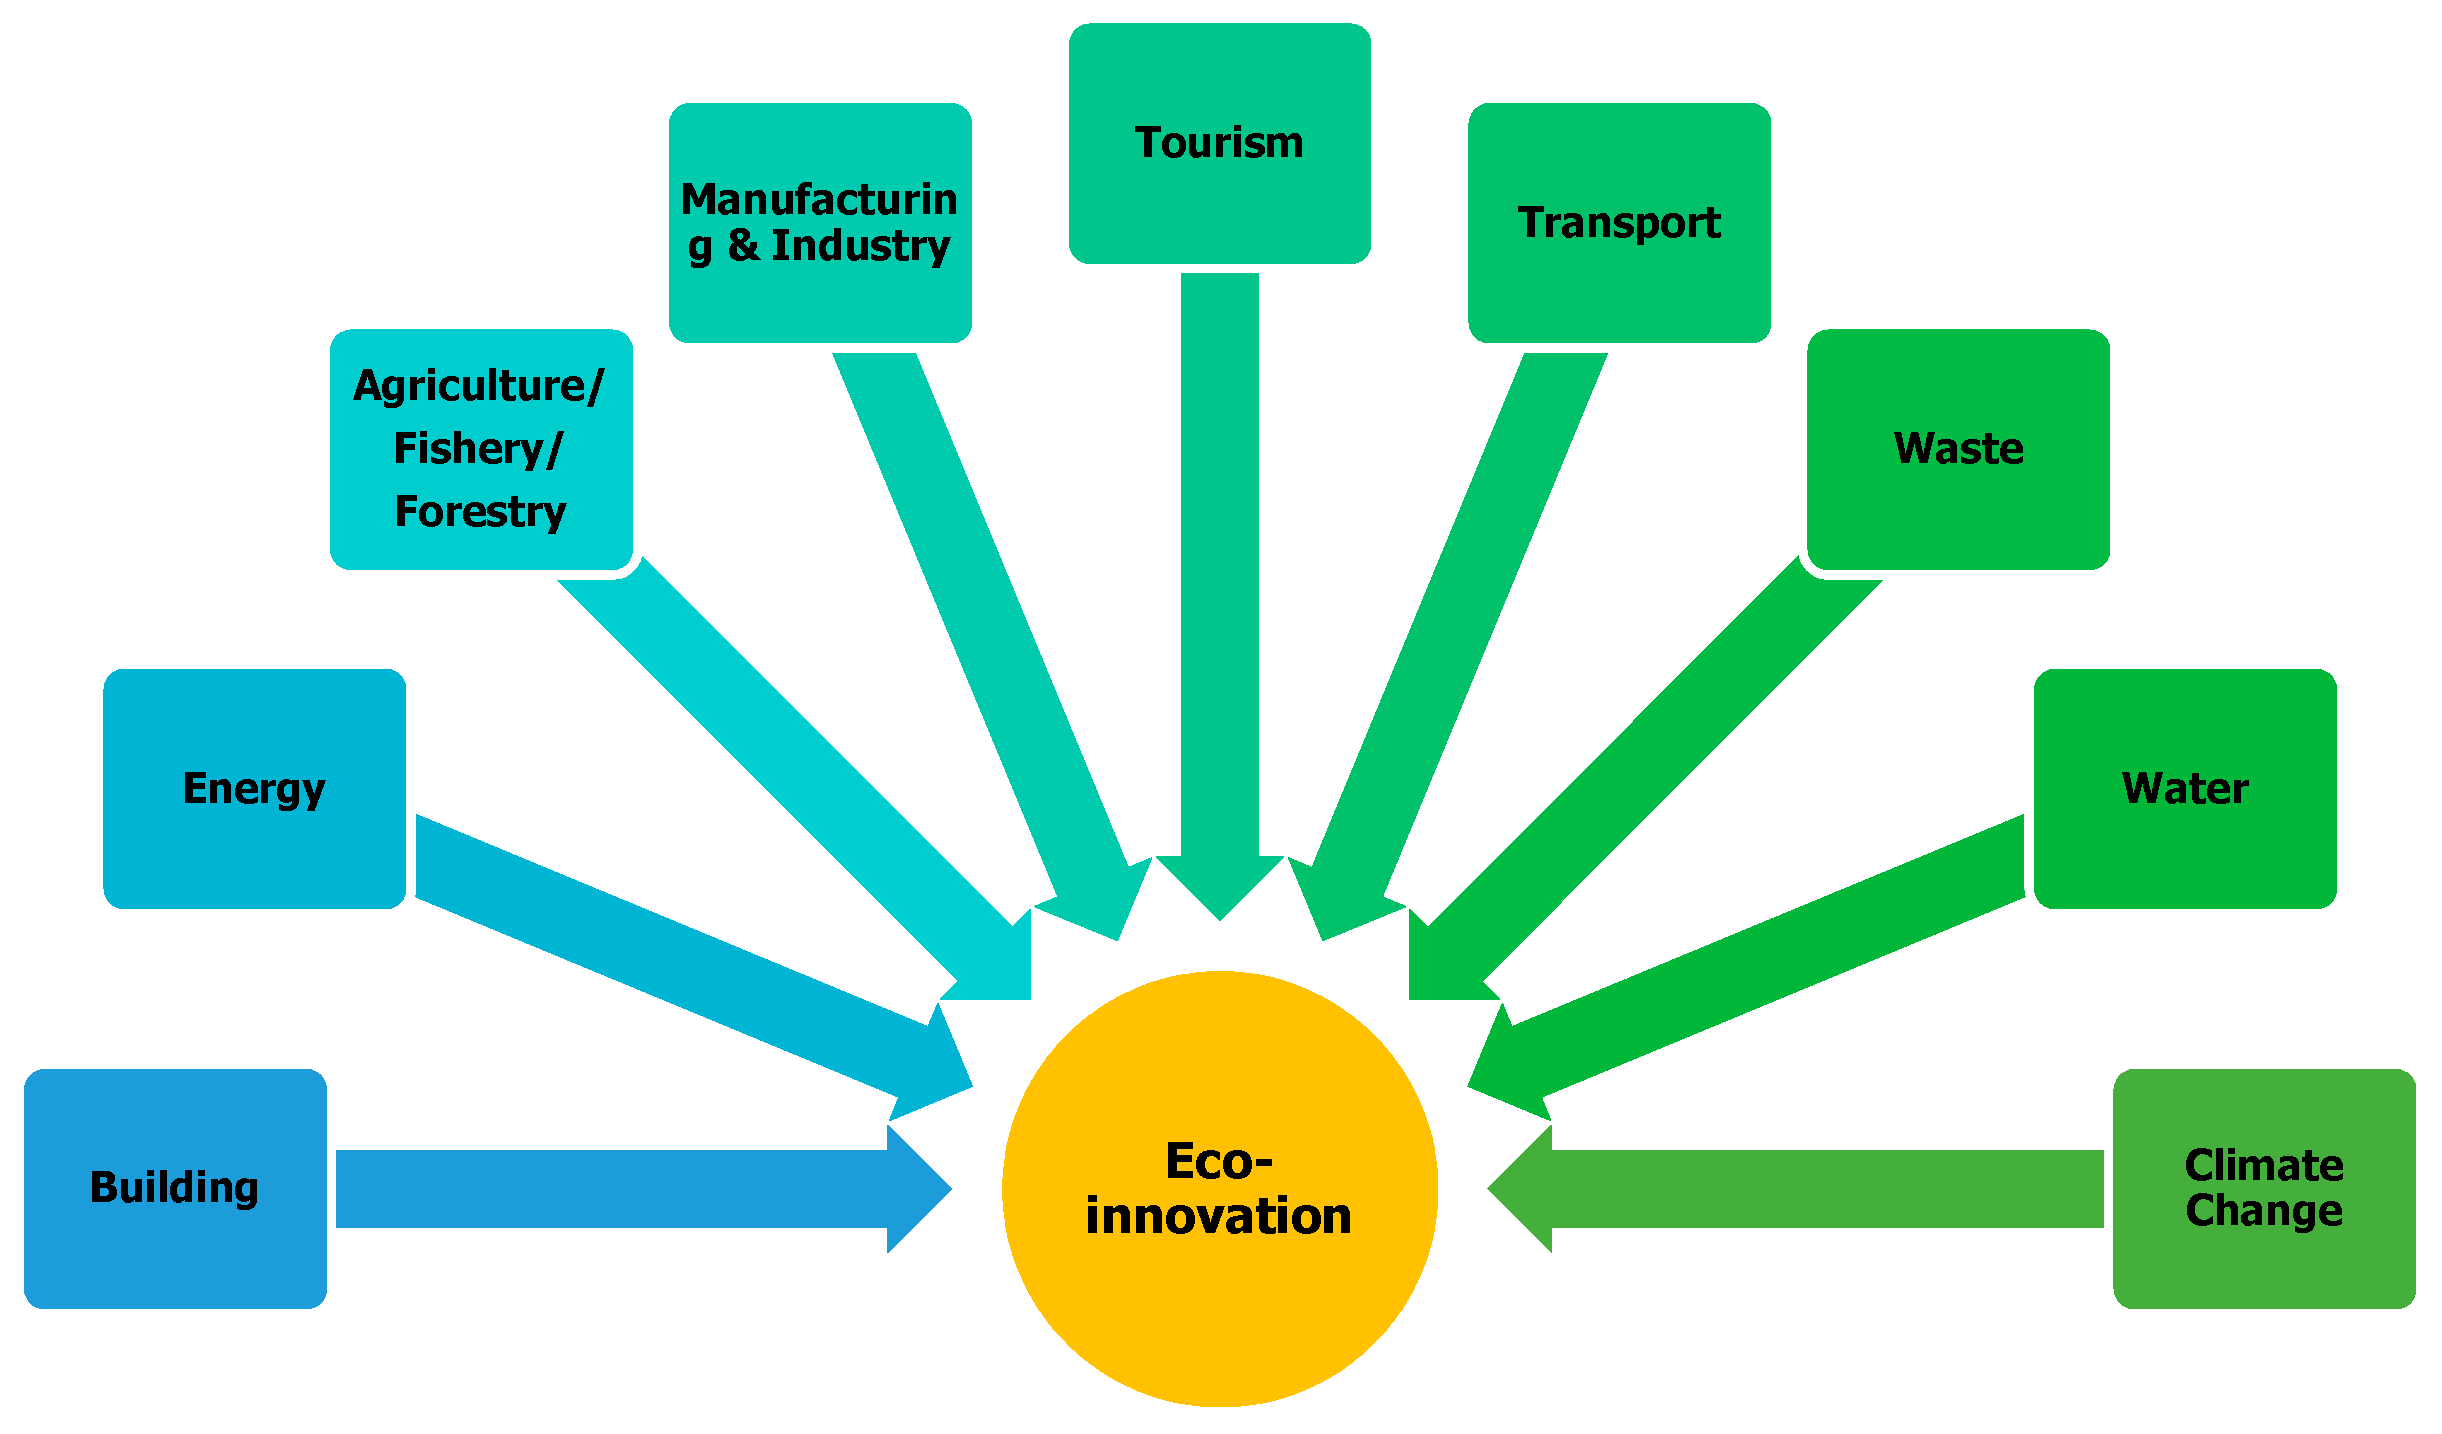
The index should present priority issues of eco-innovation appropriately [28]. We analyze to what extent the index covers relevant issues of eco-innovation. As relevant issues of eco-innovation, nine sectors of green economy [49] are considered: building, energy, agriculture/fishery/forestry, manufacturing and industry, tourism, transport, waste, water, and climate change (Figure 2). We firmly believe these sectors are also well in line with the Sustainable Development Goals.
Stakeholder theory by Freeman [50], is a major theoretical framework for the need to cover relevant stakeholders, by focusing on the importance of a firm’s relationships with critical stakeholders that may lead to better performance, as organizations that integrate business and societal considerations create value for their stakeholders. Various stakeholders, including governments, enterprises, investors, NGOs, etc., exist in the field of eco-innovation. The index can be meaningful and useful to multiple stakeholders [29]. It is also important to address actors outside the usual suspicious ones and go beyond eco-industries. The role of the government is crucial for implementing and diffusing eco-innovation at the national level. Governments can develop a national system that enables the production of eco-friendly goods and services. Governments can establish and implement policy instruments for eco-innovation, such as environmental regulations, financial schemes, and programs for supporting R&D and fostering eco-markets [2]. Business and industry play a crucial role in reducing impacts on resource use and the environment, through more efficient production processes, preventive strategies, and cleaner production technologies and procedures. Citizens as consumers have demands on eco-products, and may become involved in innovation activities. Consumer behavior contributes to building green markets. NGOs set the environmental issues in the society and collaborate with other actors to create sustainable life. Investors can influence eco-innovation through green investment [52]. Therefore, the eco-innovation index can be used by multiple stakeholders. It also provides useful information for stakeholders to encourage further action. In this study, we analyze how the ASEI and Eco-IS cover the above multiple areas of eco-innovation and eco-innovation activities of various stakeholders.
4.2. Ability to Indicate Changes
The index should present changes of phenomena in the given area. Here, the focus on general characteristics of indicators, validity, reliability, measurability, comprehensiveness, cost-effectiveness, comparability and accessibility of data is considered (Table 5). Validity means that data is well-grounded and accurately depicts a real situation of eco-innovation. It can be evaluated by a way to build a logical structure of index and to collect and handle data. Consistency and reliability can be judged if indicators can be reliable for a period of time; in particular, transparency and quality of data are significant. Measurability of indices will be assessed if data can be obtained for a community, especially at a nation level; it is related to defining indicators and clarifying measurement tools. Comprehensiveness can be judged by covering parts of eco-innovation. Cost-effectiveness can be assessed through calculating the costs. In this research cost-effectiveness of data collection is measured; for example, free data by international organizations has high cost-effectiveness of data collection. However, it will be more relevant in the future to come to grips with the cost-effectiveness of measures addressing regulatory or compliance costs and abatement costs of eco-innovation. Comparability requires a number of countries to be covered by similar indicators. Looking beyond countries, comparability may also cover regions or cities, industrial sectors and value chain. Accessibility of data means affordable and open-access data is preferable. In this study, it is analyzed how well the ASEI and Eco-IS meet the above characteristics of indicators, shown in Table 5.
4.3. Directions towards Common Goals
The index can have an orientation towards common goals. The index should clearly state and accurately reflect its intent and be consistent with well-articulated vision statements and goals [29]. Indicators can inform, via time series, the direction of changes, and thus, if the activities come closer to common goals. Eco-innovation is regarded as a means to achieve sustainable development. Therefore, in principle, an eco-innovation index should be connected with sustainable development. Here, it will be measured how the index is connected with sustainable development goals (SDGs). On 25 September 2015, the United Nations General Assembly formally adopted the universal, integrated and transformative 2030 Agenda for Sustainable Development, along with a set of 17 Sustainable Development Goals (Table 6) and 169 associated targets [51]. SDGs address the multiple interlinked global challenges of eradicating poverty, ensuring environmental sustainability, achieving economic equity, ensuring gender equality, tackling climate change, building resilience, managing equitable distribution of natural resources, realizing human rights, and reducing inequality between and within populations. SDGs include eco-innovation sectors which were mentioned at the Section 4.1. With the field of eco-innovation, sustainable management of natural resources management includes renewable energy production and management (Goal 7 Affordable and Clean Energy), water management (Goal 14 Life below Water) and land use management (Goal 15 Life on Land). In the process of production, development and implementation of green technology can contribute to achieving Goal 9 Industry, Innovation and Infrastructure [53] (p. 17). Establishing sustainable consumption and production patterns (Goal 12) is the common aim of eco-innovation [2,53]. In this study, it is analyzed how the ASEI and Eco-IS can be linked with SDGs as common goals. The linkage between the covering areas and eco-innovation performances of the two indices and agendas of SDGs is interpreted.
4.4. Ability to Facilitate Further Changes
The index presents the situation of eco-innovation at the national level. The value of the index can influence decision-making in the field of eco-innovation. Considering for applicability of the index [48], eco-innovation index could assess the status of eco-innovation performance, identify areas for improvement as needed, facilitate comparison of countries’ eco-innovation performance over time and motivate eco-innovation activities. Eco-innovation index using relative taxonomy has the possibility to analyze and stimulate changes of target countries in the field of sustainable development [55]. The eco-innovation index as a communication tool for environmental reporting influences public awareness of eco-innovation. It is necessary to interpret how the index is unambiguous and understandable to diverse audiences [29]. In practice, the index can be used in establishing and implementing eco-innovation strategies by governments, enterprises and investors. The index can become a part of scenarios and modelling, ideally co-produced with stakeholders. In this study, we analyze how the ASEI and Eco-IS have the potential to facilitate further changes towards sustainability-oriented innovation [47] including intentional changes of products, processes and creation of social and environmental value in addition to economic returns changes, through checking evidence of application of indices in practice.
5. Analysis Results of Eco-Innovation Indices
5.1. ASEI
5.1.1. Relevance of Covering Areas and Stakeholders
The ASEI was developed to measure eco-innovation at the country level. It informs the national state related to eco-innovation in 51 ASEM member countries, covering both Europe and Asia. The ASEI measures four components: capacity, supporting environment, activity and performance. The components cover a complex process of eco-innovation, including input, output and impact of eco-innovation.
In general, the ASEI uses overarching indicators covering various sectors within a country. In particular, as a composite index, economic competitiveness (1.1) and general innovation capacity (1.2) indicate eco-innovation capacity. Green patent (3.4) and green market (4.6) present eco-innovation activities and performance across sectors. In addition, the ASEI presents eco-innovation in the specific sectors. It includes indicators regarding the specific issues of eco-innovation, such as climate change, water and energy. CO2 emission density (4.2) and green industry market size (4.6), regarding low carbon goods and services, are related to the sector of climate change. The two indicators present the energy sector with activeness of renewable energy utilization (3.5) and a country’s energy sustainability level (4.3). Water consumption density (4.4) indicates eco-innovation performance. Eight indicators in the ASEI use the term “green technology (Indicators 1.3, 1.4, 2.1, 2.3, 2.4 and 3.1)” and “green industry (Indicators 4.5 and 4.6)”. The indicators of green technology and green industry present capacity, support environment and performance of eco-innovation.
The ASEI has indicators covering performances by different stakeholders, including government, industries and society. Some indicators present governmental capacities and policies, including Nation’s Economic Competitiveness (1.1), Nation’s General Innovation Capacity (1.2), Governmental Expenditure on Green R&D (2.1) and Implementation of Environmental Regulations (2.2). Other indicators from the ASEI present eco-innovation supporting environment and activities by enterprises such as the Commercialization Level of Green Technology Firms (3.1), Environmental Management (3.2), Economic Influence of Leading Environmentally Responsive Firms (3.3), and Green Patents (3.4). Finally, other indicators are related to performance by investors, including investment setting for green technology industry (2.3) and investment scale towards green technology SMEs (2.4). Therefore, the ASEI covers performances by different stakeholders and sets green technology and green industry as high priority issues.
5.1.2. Ability to Indicate Changes
The ASEI implies a country level status on eco-innovation, based on an analytical framework of eco-innovation [3]. The indicators have a clear definition of measuring factors, measuring elements and measuring procedures, so data can be properly collected. The index adopted composite indicators which would cost much if measured. Most ASEI indicators are measured with free data, available to the public, offered by international organizations, such as the International Energy Agency, the OECD and the World Economic Forum. However, 6 indicators are established using data from Cleantech. The data from Cleantech has some limitations: accessibility (the data covers only EU member countries), cost-effectiveness (the subscription costs USD 10,000 per annum) and comparability (the measurement of indicators is inconsistent). To maintain the indicators, an alternative data source is required. Moreover, due to absence of data for some countries, the statistical method (EM algorithm) was applied to replace the missing values. Therefore, the scores could not present a real situation of eco-innovation.
As mentioned above, to measure indicators regularly in all target countries, it is necessary to build an efficient system that collects the indicators’ data covering Asian countries in a timely manner.
The index’s pursuit is to present a general situation of eco-innovation of a country, by combining sub-categories measuring each development procedure of eco-innovation. In addition, without in-depth research on validity, it is not guaranteed whether the index reflects the general situation properly. Therefore, conducting national case studies in the future may help interpret the eco-innovation situation. National reports on eco-innovation in Vietnam [56], the Republic of Korea [57], Myanmar [58], Japan [59], Singapore [60] and Thailand [61], published by the ASEIC, support interpretation of the ASEI scores of those countries considering national contexts and instruments for eco-innovation policies.
5.1.3. Directions towards Common Goals
The ASEI indicators are logically related to SDGs (Table 7). Seven indicators, among all the ASEI indicators, are created to measure capacity, supporting environment, activity and performance of green technology and green industry: Indicator 1.3 Green Technology R&D Institution Capacity, Indicator 1.4 Green Technology possessed/acquired Enterprises, Indicator 2.1 Government’s R&D expenditure in Green Industry, Indicator 2.3 Maturity of Investment Setting for Green Technology Industry, Indicator 2.4 Investment Scale of Green Technology SMEs, Indicator 3.1 Commercialization Level of Green Technology and Indicator 4.5 Jobs in Green Technology Industry. Eco-innovation is closely related to the development and use of environmental or green technologies as well as the concepts of eco-efficiency and green industry [62]. Green technology that reduces environmental burdens can facilitate sustainable and resilient infrastructure development in a society and enterprise. It creates and develops new and more sustainable industries by preventing or reducing negative impacts or optimizing the use of natural resources. Therefore, green technology and green industry, on which the ASEI focuses, can contribute to building resilient infrastructure, promoting inclusive and sustainable industrialization and fostering innovation (Goal 9 Industry and Infrastructure). Consequently, green technology and green industry facilitate a sustainable production process through increasing material efficiency and enable sustainable consumption through creating eco-markets (Goal 12 Sustainable Consumption and Production).
Eco-innovation is used in conjunction with eco-efficiency [3]. The ASEI component of eco-innovation performances is measured by focusing on resource use efficiency, including Indicator 4.2 CO2 Emission Intensity, Indicator 4.3 Nation’s Energy sustainability level and Indicator 4.4 Water Consumption Intensity. Therefore, these indicators are related to Goal 13 Climate Action, Goal 7 Clean Energy and Goal 6 Clean Water. In the future, material flow analysis based indicators can be developed, e.g., carbon footprint and water footprint.
Eco-innovation pursues green growth to prevent further environmental risks and to find new opportunities [63]. The ASEI’s component of eco-innovation capacity includes a nation’s economic competitiveness (Indicator 1.1) from the 2015–2016 Global Competitiveness Index and general innovation capacity (Indicator 1.2) from the 2015 Global Innovation Index. Economic competitiveness and innovation capacity can indicate a possibility for promoting sustained, inclusive and sustainable economic growth (Goal 8). Jobs in green technology industry (Indicator 4.5) and green industry market size (Indicator 4.6), as indicators of eco-innovation performance, present the status of employment related to the Goal 8 Good Jobs and Economic Growth. In conclusion, the ASEI is closely linked with Goal 8 Good Jobs and Economic Growth, Goal 9 Sustainable Industrialization, and Goal 12 Sustainable Consumption and Production.
5.1.4. Ability to Facilitate Further Changes
The ASEI provides information on the status of national eco-innovation. It can play a role as a basic source with numeric values for understanding the status of national eco-innovation in the target countries (in Asia and Europe). Dividing the index into the sub-categories can give useful implications to policy makers on what they should do for facilitating eco-innovation. The index is attractive, as it gives country-specific scores for ASEM member countries, which can show countries’ competitiveness on recently highlighted environmental issues at the country level. For example, Japan, Denmark, Switzerland and Finland have relatively high scores compared to other countries in the “Supporting Environment” category (Table 8) which includes Indicator 2.2 Implementation of Environmental Regulation. By comparing the scores, policy makers can benchmark environmental regulations implemented in the leader countries as an instrument to facilitate eco-innovation.
The ASEI measures eco-innovation activities by enterprises such as commercialization level of green technology enterprises (Indicator 3.1), environmental management by enterprises (Indicator 3.2), economic influence of leading environmentally responsive firms (Indicator 3.3), and green patents (Indicator 3.4). Therefore, the ASEI can stimulate industrial activities towards sustainability-oriented innovation. In addition, the ASEI has contributed to increasing the awareness of eco-innovation at the national and international society level. Based on the ASEI scores, eco-innovation issues and policies have been discussed at several global forums, such as the Asia-Europe Environment forum, in Brussels; the 2015 ASEM Global Eco-Innovation Forum, in Seoul; and the 2016 CLMV (Cambodia, Laos, Myanmar and Vietnam) workshops on the implementation of SDGs, in Hanoi. However, it is difficult to find a practical implication of the ASEI to establish and implement eco-innovation strategies in target countries. Although the ASEI was developed by ASEIC within the context of ASEM, few opportunities were created for sharing the knowledge from the ASEI in the ASEM community. For target countries to use the results of the ASEI, it is necessary to extend communication on the scores and their interpretation of the ASEI across the ASEM member countries.
5.2. Eco-Innovation Scoreboard (Eco-IS)
5.2.1. Relevance of Covering Areas and Stakeholders
The Eco-IS illustrates the overall status and performances of eco-innovation in EU countries, and rank and group regarding the overall eco-innovation performances in key areas, including investments, company performance and economic and environmental outcomes [64] (p. viii). The Eco-IS measures five components: eco-innovation inputs, eco-innovation activities, eco-innovation outputs, resource efficiency outcomes and socio-economic outcomes. The components cover material flow innovation, process eco-innovation, product eco-innovation, organizational eco-innovation, marketing eco-innovation and social eco-innovation [65] (pp. 67–69).
In principle, the Eco-IS covers multiple sectors in eco-innovation, including indicators in the specific fields to assess environmental outcomes, such as water productivity (Indicator 4.2), energy productivity (Indicator 4.3) and GHG emissions intensity (Indicator 4.4). Eco-innovation is closely related to resource efficiency. Many Eco-IS indicators connect resource efficiency by focusing on productivity and intensity at the components of Eco-innovation Activities, Eco-innovation Outputs and Environmental Outcomes. For example, eco-innovation related academic publications (Indicator 3.2) include English keywords in the title or abstract, such as eco-innovation, energy efficient/efficiency, material efficient/efficiency, resource efficient/efficiency, energy productivity, material productivity and resource productivity [46] (p. 10).
The Eco-IS has indicators covering activities by main stakeholders, including government, industries and society. Expenditure on environmental and energy R&D (Indicator 1.1) presents governmental policy. Many indicators from the Eco-IS present eco-innovation activities and socio-economic outcomes by enterprises, such as reduction of material input (Indicator 2.1), reduction of energy input (Indicator 2.2), ISO 14001 registered organizations (Indicator 2.3), exports of products from eco-industries (Indicator 5.1), employment in eco-industries (Indicator 5.2) and revenue in eco-industries (Indicator 5.3). Total value of green early stage investment (Indicator 1.3) is related to performance by investors.
The Eco-IS indicators include the specific sectors of climate change, water and energy in the component of Environmental Outcomes. The component of Socio-economic Outcomes uses the term “eco-industries”, including Indicators 5.1, 5.2 and 5.3. Environmental industry or eco-industry is defined as “activities which produce goods and services to measure, prevent, limit, minimize or correct environmental damage to water, air and soil, as well as problems related to waste, noise and ecosystems” [6] (p. 9). This includes cleaner technologies, products and services that reduce environmental risk and minimize pollution, and resource use [66].
5.2.2. Ability to Indicate Changes
The Eco-IS implies a country-level status on eco-innovation, based on the theoretical framework of eco-innovation [7]. Several reports by the [64,67] indicate the Eco-IS’s theory-based structure. The indicators have a clear definition of measuring factors, measuring elements and measuring procedures, so data can be properly collected [46]. Half of the Eco-IS indicators are measured with the statistical data of EUROSTAT, the statistical office of the European Union. A framework for collecting data from EUROSTAT was designed in the process of developing the Eco-IS. Therefore, measuring the Eco-IS depends on the stable database of EUROSTAT, which covers EU countries. The rest of the Eco-IS indicators are measured with open data from international organizations, such as Scopus, Patstat and the Water Footprint Network. National case reports of EU countries inform national contexts of eco-innovation and, consequently, help to interpret the scores of the Eco-IS in each country.
5.2.3. Directions towards Common Goals
The Eco-IS is connected with SDGs (Table 9). The component of Socio-economic Outcomes focuses on “eco-industries”, including Indicator 5.1 Export of Products from Eco-industries, Indicator 5.2 Employment in Eco-industries and Indicator 5.3 Turnover in Eco-industries. Eco-industries can contribute to building resilient infrastructure, promoting inclusive and sustainable industrialization and fostering innovation (Goal 9 Industry and Infrastructure). They promote sustainable economic growth and productive employment (Goal 8 Good Jobs and Economic Growth).
The Eco-IS focuses on the resource-use aspect of eco-innovation. Resource efficiency is a core element in eco-innovation [3]. The component of Eco-innovation activities is measured by focusing on reducing resource use, including Indicator 2.1 Reduction of Material Input and 2.2 Reduction of Energy Input. It facilitates sustainable industrialization (Goal 9 Industry and Infrastructure) and sustainable production process through increasing material efficiency and enables sustainable consumption through providing eco-products (Goal 12 Sustainable Consumption and Production). The component of Environmental Outcomes measures increasing productivity and using resources more effectively, including Indicator 4.1 Material Productivity, Indicator 4.2 Water Productivity, Indicator 4.3 Energy Productivity, and Indicator 4.4 GHG Emissions Intensity. The Indicators are related to Goal 13 Climate Action, Goal 7 Clean Energy and Goal 6 Clean Water. In conclusion, the Eco-IS is closely linked with Goal 8 Good Jobs and Economic Growth, Goal 9 Sustainable Industrialization and Goal 12 Sustainable Consumption and Production.
5.2.4. Ability to Facilitate Further Changes
The Eco-IS illustrates eco-innovation performances of countries and industries over time with the focus on resource efficiency. It indicates how well individual member states perform in different dimensions of eco-innovation, compared to the EU average, and presents their strength and weakness. No country performed well across all categories [64]. Since 2010, the Eco-IS has been measured annually and the country scores announced by annual reports on the EIO’s internet homepage (Figure 3). Consequently, the measured scores of the respective indicators can be compared and present the changes over time.
The scores of Eco-IS enables comparison of countries’ eco-innovation. Using Eco-IS, EU countries can be clustered into three groups; eco-innovation leaders, average eco-innovation performers and countries catching up in eco-innovation [69]. The clusters help understand the status of eco-innovation in EU countries and can be applied for designing national and European policy measures for facilitating eco-innovation.
The Eco-IS was created and has been used within the European policies for eco-innovation. It is being referred to as political information for the EU Eco-innovation Action Plan (EcoAP), which is important progress for Europe’s ability to promote general Eco-Innovative processes, products and services other than green technology [70]. The EcoAP includes monitoring and reviewing eco-innovation measures and actions taken by member states with the Eco-IS [71] (p. 16). Therefore, the Eco-IS is interlinked with regional and national eco-innovation policies in Europe.
Additionally, the Eco-IS helps to raise awareness about eco-innovation in national and international societies. The aggregated index and the country rankings of the Eco-IS are frequently cited by the media [67].
6. Discussion
The ASEI and Eco-IS have some strengths and weakness (Table 10). When comparing the ASEI and Eco-IS, there are some similarities and differences worth noting. For similarities, firstly, the ASEI and Eco-IS illustrate the overall status and performances of eco-innovation at the national level by using the systematic approach. They present conditions of the national innovation and technology innovation systems. They provide scores with multiple layers, including the overall indices (one aggregated layer), indices from main components (second layer) and the single indicators in each component (third layer). They are based on the model of eco-innovation, including input, output and impact of eco-innovation [14]. They consist of theory-driven indicators [27] and these indicators were developed with an understanding of recent theories, including the determinants and process of eco-innovation. One of the implications is to look at innovations in a wider perspective that includes the dissemination and market development of more sustainable trajectories.
Second, two indices include proxy indicators that use data regarding green technology and green industries, due to a general lack of data on eco-innovation across sectors [67] (p. 20). Both focus on the resource-use aspect of eco-innovation [65,70]. Despite such a broad approach, the more traditional indicators of green industry and eco-industry play a pivotal role in the performance and impacts of eco-innovation. They contribute to job creation and the realization of environmental policy targets, such as reduction of greenhouse gases, share of renewable energy and energy efficiency savings [72] (p. 22). Consequently, two indices, including indicators on green industry and eco-industry, have great potential to contribute towards the SDGs: in particular, Goal 9 Sustainable Industrialization and Goal 12 Sustainable Consumption and Production. Both indices try to capture the balance between the more traditional green industry, relevant efforts by others, and the overall outcomes for the economies.
Third, two indices have orientation towards sustainability. They are connected with SDGs as common goals. Focusing on resource efficiency, most indicators of two indices are related to sustainable industrialization (Goal 9 Industry and Infrastructure) and sustainable process of production and consumption (Goal 12 Sustainable Consumption and Production).
Fourth, two indices contribute to sharing knowledge on eco-innovation and raising awareness on eco-innovation. Annually, the scores of the ASEI and Eco-IS are announced by annual reports and are informed by global forums. Country reports of eco-innovation support the understanding of the scores of the two indices. The EIO reports include more multiple interpretations of the scores than the ASEIC reports.
Fifth, two indices present the overall status of eco-innovation across sectors, while they offer little information on sectoral eco-innovation. Although indicators about the sector of climate change, water resources and energy are included within the ASEI’s component of Eco-innovation Performances and the Eco-IS’s component of Eco-innovation Outcomes, other major sectors of eco-innovation are excluded, such as the sector of agriculture and forestry.
To sum up, the above four similarities are strengths of the ASEI and Eco-IS, and the last similarity appears to be a current weakness of both the ASEI and Eco-IS. Recently, the European Commission started to fund a project called RECREATE, focusing on climate action, resource efficiency and raw materials. The project includes development of a Green Horizons Scoreboard for assessing EU member states’ performance in several sectors of innovation system, such as agriculture and soil sciences, bio-economy, climate adaption, critical raw materials, energy efficiency, environmental governance, fossil fuel efficiency, material efficiency, renewable energy, waste and recycling, and water and waste water [73]. The Green Horizons Scoreboard might provide more information on socio-technical eco-innovation systems or sectoral eco-innovation performances, which the Eco-IS does not present.
In regard to differences, the scope of the countries covered differs across the two indices. The ASEI covers both Asian and European countries, while the Eco-IS covers only EU countries; the ASEI covers all the EU countries in the Eco-IS. Many environmental indicators inform the country profiles from developed countries, including OECD countries, due to lack of data from developing countries. However, the ASEI informs the status of eco-innovation in Asia’s developing countries.
Second, data availability of the two indices is different. The ASEI has the limitation of measuring all indicators due to data availability. Currently, eight indicators are not measured because of lack of data from Asian developing countries. This is a huge weakness of the ASEI. However, the Eco-IS is based on the stable database from EUROSTAT, which provides proper data to assess the Eco-IS. The EIO has been able to define and collect the data necessary for measuring eco-innovation using the EU network, a powerful strength of the Eco-IS. Asia has no regional level database. To complete measuring the ASEI, it is necessary for Asian countries to create a database based on ASEM.
Third, calculation methods of the two indices are different. The ASEI uses rescaling Min-Max method. Min-Max normalized indicators have an identical range of values between 0 (laggard) and 100 (leader) by subtracting the minimum value and dividing by the range of the indicator values. Min-Max normalization could widen the range of indicators lying within a small interval, increasing the effect on the composite indicator more than the z-score transformation [6]. On the other hand, the Eco-IS uses distance to a reference which measures the relative position of a given indicator vis-à-vis a reference point. This could be a target to be reached in a given time frame. Standardized indicators higher than 100 indicate countries with above-average performance. While two indices show relative positions based on criteria, Eco-IS defines the target (average) to be reached through the distance to a reference method. Whereas ASEI indicates the relative distance to the best player through the Min-Max method. In principle, the scores of ASEI and Eco-IS (Table 11) cannot be compared directly. However, we can compare the score ranks of target countries. There is no big difference of the ranks of EU countries between ASEI and Eco-IS except Belgium, Greece and Italy. In the cases of Greece and Italy, the ranks of ASEI are even lower than Eco-IS. Both countries have extremely low scores for two indicators of ASEI, Indicator 2.2 Implementation of Environmental Regulations and Indicator 3.5 Activeness of Renewable Energy Utilization [45] (pp. 253–254).
Fourth, the Eco-IS is closely linked with the regional and national policies for eco-innovation from the European Commission, such as the Eco-Innovation Action Plan (EcoAP), while the ASEI was not directly applied to national policies for eco-innovation in ASEM countries. The scores are used to understand the relative performance and environment of eco-innovation. The Eco-IS was developed as a part of the European Commission’s eco-innovation policies. It seeks to stimulate the establishment and implementation of national strategies—although one would need to assess how strong these links are in reality, especially at the level of member states. Compared to the Eco-IS, the ASEI has not done such a facilitation yet and could start support for creating national roadmaps for eco-innovation in ASEM countries. More opportunities for sharing the results of the ASEI with ASEM countries are necessary. More country reports and thematic reports, including the ASEI’s scores and their interpretation, should be published to extend communication on ASEI at the global level.
7. Conclusions
Eco-innovation indices help to understand eco-innovation patterns in countries over time, and the two indices considered here, the ASEI and Eco-IS, are pioneering such efforts for Asia and Europe. Given that both indices were developed in quite different regions, the amount of similarities is striking and seems to indicate a common understanding on national eco-innovation systems that should be seen as encouraging by policy makers. This research examined two indices as tools for measuring eco-innovation with four criteria: (1) relevance of covering areas and stakeholders; (2) ability to indicate changes; (3) directions towards common goals; and (4) ability to facilitate further changes. The two indices offer information on the relative level of national eco-innovation to relevant stakeholder including policy-makers, R & I managers, enterprises and analysts. Both illustrate activities and performances of green technology as a relevant area of eco-innovation. They are expected to contribute towards the SDGs as common goas, in particular Goal 9 Sustainable Industrialization and Goal 12 Sustainable Consumption and Production. In doing so, the two indices can help bringing eco-innovation into the SDG debates and vice versa. The following are needed: (a) more communication with users; and (b) a better link from such indices to foresight processes, scenarios and modelling. Such attempts would need to be done by research, but the results and the processes themselves would be relevant for all innovation actors and policy makers interested in seeing how their areas and countries can come closer to delivering SDGs or similar sustainability goals.
The section above also highlights some differences and weaknesses. Thus, what should we expect from such endeavors in the future? Would the improved data and more sophisticated indicators help to shape the eco-innovation performance? With all caution, the authors of this paper would expect such an impact. Policy makers and other innovation actors can draw lessons from comparing country performance and tracking distinct innovation systems over time. According to the scores of the indices, target countries can be grouped into eco-innovation leaders, followers and countries catching up [74] or eco-innovation leaders, followers, loungers and laggards [2]. The scores of the indices have been used for diagnosing the relative level of national eco-innovation in Romania [74], the Republic of Korea [57], Vietnam [53] and other countries. Therefore, the two indices offer information of the relative level of national eco-innovation to multiple stakeholders.
Developed indices are meaningful when the scores of eco-innovation indices are used by public and private actors. It is necessary to transfer information about eco-innovation indices and encourage their application. Between Asia and Europe, international cooperation projects for eco-innovation in developing countries were established and implemented, such as the European Commission’s SWITCH-Asia program, launched to promote sustainable products, processes, services and consumption patterns in Asia [2]. The scores from the ASEI can be used to design such international cooperation projects. Through active communication activities, including workshops and forums, application of eco-innovation indices can be recommended to the global society.
In practice, the ASEI has a weakness of data availability from Asian countries. To measure the ASEI completely and continuously, Asian countries must create an accessible and comparable database of eco-innovation. For the next stage, it is necessary to not only modify the indicators of ASEI and Eco-IS, but also expand the application of the two indices into more sectors and more countries through communication with relevant innovation actors and users. Again, the two indices’ two scores can be utilized for future work on scenarios and modelling, helping to achieve policy-relevant purposes. One important area of data improvement concerns issues of a circular economy, broader manufacturing data, and integration of food and water. There is a clear need for better and more reliable data on relevant eco-innovation activities in those areas, that should ideally be collected regularly and across countries.
There are several limitations in terms of scope and method of this research. The selected indices cover Asia and Europe. North and South American and African countries were excluded in measuring eco-innovation. In further research, the abovementioned countries should be included as target countries. This research applied comparative analysis with qualitative approach. Few quantitative information for comparing two indices were offered. Statistical analysis of interpreting the scores of indicators can be conducted in the future. Despite the limitations, this research contributes to extending the scope and scale of eco-innovation studies. Through reviewing eco-innovation indices, this research gives insights into the concentrated areas, the oriented common goals and application of eco-innovation indices. The research results can play a role as a stepping stone for upgrading eco-innovation indices as the next stage of developing indices which are the main topic of previous research on eco-innovation. It is expected that this research will help interpret the scores of two indices better and facilitate application of the scores in the multiple ways.
It is, however, a long way down to see those indices having a comparable impact to the World Economic Forum’s Global Competitiveness Index. A key to improving the impact of such indices is to strengthen their support base and have more pro-active attempts for reaching out to stakeholders and getting their insights into scoreboards. Much needs to be done to unleash the potential of such scoreboards for real processes of eco-innovation. The next generation should not only have better data and systematic outreach efforts, but also tackle all G20 countries and have separate chapters on main disruptive eco-innovations, such as e-mobility and others. Lining up with the SDGs, as suggested above, will also require addressing more countries and scoping eco-innovation that will especially benefit the livelihoods of the world’s poor. After all, there is still a long way to go, and we hope our article will stimulate the debate about a future world-wide knowledge hub on eco-innovation.
Acknowledgments
This paper was supported by the 2016 research grant of ASEM SMEs Eco-Innovation Center, which is located in the Republic of Korea (Project Title: International Collaborative Research on ASEM Eco-Innovation Index). We thank for valuable comments to the draft manuscript Michal Miedzinski, Will McDowall and Nino Jordan from Institute for Sustainable Resources, University College London in United Kingdom.
Author Contributions
The manuscript was written by Mi Sun Park. Raimund Bleischwitz, Ki Joo Han, and Eun Kyung Jang. Ji Hyung Joo contributed to designing the study and interpreting the results. All authors have read and approved the final manuscript.
Conflicts of Interest
The authors declare no conflict of interest.
Appendix A

Table A1.
Data source of ASEI [45] (p. 4).
Table A1.
Data source of ASEI [45] (p. 4).
| Component | Indicators | Obtained Data | Data Source (Year) | Measuring Element |
|---|---|---|---|---|
| 1. Eco-innovation Capacity | 1.1 Nation’s Economic Competitiveness | Global Competitiveness Index (GCI) | World Economic Forum (2015) | Composite Index |
| 1.2 Nation’s General Innovation Capacity | Global Innovation Index (GII) | INSEAD (2015) | Composite Index | |
| 1.3 Green Technology R&D Institution Capacity | Cleantech | Cleantech group data | Number of green technology R&D institutions, centers and university | |
| 1.4 Green Technology possessed/acquired Enterprises | Cleantech | Cleantech group data | Number of green technology possessed firms | |
| 1.5 Awareness of Sustainability Management | UN Global Compact (UNGC) Business Sector participants | UNGC (2015) | Number of participating enterprise | |
| 2. Eco-innovation Supporting Environment | 2.1 Government’s R&D expenditure in Green Industry | OECD Statics | OECD (2013) | Size of expenditure |
| 2.2 Implementation of Environmental Regulations | WEF Executive Opinion Survey | World Economic Forum (2015) | Composite Index | |
| 2.3 Maturity of Investment Setting for Green Technology Industry | Cleantech | Cleantech group data | Value of investment towards green technology firms | |
| 2.4 Investment Scale of Green Technology SMEs | Cleantech | Cleantech group data | Number of venture capitals and deals made towards green technology SMEs | |
| 3. Eco-innovation Activities | 3.1 Commercialization Level of Green Technology | Cleantech | Cleantech group data | Number of companies with green technology widely commercialized |
| 3.2 Enterprises’ Participation on Environmental Management System | ISO 14001 environmental certificates | IMF (2014) | Number of participating enterprise | |
| 3.3 Economic Influence of Leading Environmentally Responsive Enterprises | World’s Greenest Companies | Trucost by Newsweek (2015) | Amount of annual sales | |
| 3.4 Green Patents | OECD Environmental technology patent statistics | OECD (2014) | Number of patent | |
| 3.5 Activeness of Renewable Energy Utilization | IEA (International Energy Agency) | IEA (2015) | Measures the contribution of renewable to total primary energy supply | |
| 4. Eco-innovation Performance | 4.1 Level of Environmental Impact on Society | EPI (Environmental Performance index) | EPI (2015) | Composite Index |
| 4.2 CO2 Emission Intensity | Key World Energy Statistics | International Energy Agency (2015) | Amount of Carbon dioxide generated | |
| 4.3 Country’s Energy Sustainability Level | ESI (Energy Sustainability Index) | World Energy Council (2015) | Composite Index | |
| 4.4 Water Consumption Intensity | IMD (International Institute for Management Development) World Competitiveness Yearbook | IMD World Competitiveness Yearbook (2014) | Water withdrawal for each 1,000 USD of GDP in cubic meter | |
| 4.5 Jobs in Green Technology Industry | Cleantech | Cleantech group data | Number of employees | |
| 4.6 Green Industry Market Size | UK BIS (The UK Department for Business Innovation and Skills) | LCEGS (Low Carbon and Environmental Goods and Services) Country Market Size (2011–2012) | Green Industry total sales |
Appendix B
Table A2.
Data source of Eco-IS [46] (p. 3).
Table A2.
Data source of Eco-IS [46] (p. 3).
| Component | Indicators | Obtained Data | Data Source (Year) |
|---|---|---|---|
| 1. Eco-innovation inputs | 1.1 Governments environmental and energy R&D appropriations and outlays | EUROSTAT (2014) | Governments budget appropriations and outlays (percent of GDP) |
| 1.2 Total R&D personnel and researchers | EUROSTAT (2014) | Number of R&D personnel and researchers (percent of total employment) | |
| 1.3 Total value of green early stage investments | Cleantech (2012–2015) | Total value of investments (USD/capita) | |
| 2. Eco-innovation activities | 2.1 Firms having implemented innovation activities aiming at a reduction of material input per unit output | EUROSTAT (2008) | Number of firms having implemented innovation activities for material efficient (percent of total firms) |
| 2.2 Firms having implemented innovation activities aiming at a reduction of energy input per unit output | EUROSTAT (2008) | Number of firms having implemented innovation activities for energy efficiency (percent of total firms) | |
| 2.3 ISO 14001 registered organizations | ISO Survey of Certifications (2014) | Number of ISO 14001 registered organizations (per mln population) | |
| 3. Eco-innovation outputs | 3.1 Eco-innovation related patents | Patstat (2012) | Number of patents (per mln population) |
| 3.2 Eco-innovation related academic publications | Scopus (2014) | Number of publications (per mln population) | |
| 3.3 Eco-innovation related media coverage | Meltwater (2015) | per number of electronic media | |
| 4. Environmental outcomes | 4.1 Material productivity | EUROSTAT (2007) | Direct material productivity (GDP/Domestic material Consumption) |
| 4.2 Water productivity | Water Footprint Network (1996–2005) | GDP/Water footprint | |
| 4.3 Energy Productivity | EUROSTAT (2013) | Energy productivity (GDP/gross inland energy consumption)) | |
| 4.4 GHG emissions intensity | EEA (2013) | CO2e/GDP | |
| 5. Socio-economic outcomes | 5.1 Exports of products from eco-industries | EUROSTAT (2014) | Percent of total exports |
| 5.2 Employment in eco-industries and circular economy | Orbis (2014) | Percent of total employment across all companies | |
| 5.3 Revenue in eco-industries and circular economy | Orbis (2014) | Percent of total revenue across all companies |
References
- Rennings, K. Redefining innovation—Eco-innovation research and the contribution from ecological economics. Ecol. Econ. 2000, 32, 319–332. [Google Scholar] [CrossRef]
- Jang, E.K.; Park, M.S.; Roh, T.W.; Han, K.J. Policy instruments for eco-innovation in Asian countries. Sustainability 2015, 7, 12586–12614. [Google Scholar] [CrossRef]
- Jo, J.H.; Roh, T.W.; Kim, S.; Youn, Y.C.; Park, M.S.; Han, K.J.; Jang, E.K. Eco-Innovation for sustainability: Evidence from 49 countries in Asia and Europe. Sustainability 2015, 7, 16820–16835. [Google Scholar] [CrossRef]
- Hellström, T. Dimensions of environmentally sustainable innovation: The structure of eco-innovation concepts. Sustain. Dev. 2007, 15, 148–159. [Google Scholar] [CrossRef]
- Karakaya, E.; Hidalgo, A.; Nuur, C. Diffusion of eco-innovations: A review. Renew. Sustain. Energy Rev. 2014, 33, 392–399. [Google Scholar] [CrossRef]
- OECD; Eurostat. Oslo Manual: Guidelines for Collecting and Interpreting Innovation Data, 3rd ed.; OECD: Paris, France, 2005. [Google Scholar]
- EIO. Methodological Report; Eco-Innovation Observatory, 2012. Available online: http://www.un-documents.net/wced-ocf.htm (accessed on 28 November 2017).
- Levidow, L.; Lindgaard-Jørgensen, P.; Nilsson, Å.; Skenhall, S.A.; Assimacopoulos, D. Process eco-innovation: Assessing meso-level eco-efficiency in industrial water-service systems. J. Clean. Prod. 2016, 110, 54–65. [Google Scholar] [CrossRef]
- Bleischwitz, R.; Bahn-Walkowiak, B.; Irrek, W.; Schepelmann, P.; Schmidt-Bleek, F.; Giljum, S.; Lutter, S.; Bohunovski, L.; Hinterberger, F.; Hawkins, E.; et al. Eco-Innvoation-Putting the EU on the Path to a Resource and Energy Efficient Economy; Wuppertal Institute: Wuppertal, Germany, 2009. [Google Scholar]
- Leitner, A.; Wehrmeyer, W.; France, C. The impact of regulation and policy on radical eco-innovation: The need for a new understanding. Manag. Res. Rev. 2010, 33, 1022–1041. [Google Scholar] [CrossRef]
- Del Río, P.; Carrillo-Hermosilla, J.; Könnölä, T. Policy Strategies to Promote Eco-Innovation. J. Ind. Ecol. 2010, 14, 541–557. [Google Scholar] [CrossRef]
- Horbach, J.; Rammer, C.; Rennings, K. Determinants of eco-innovations by type of environmental impact—The role of regulatory push/pull, technology push and market pull. Ecol. Econ. 2012, 78, 112–122. [Google Scholar] [CrossRef]
- Ganapathy, S.P.; Natarajan, J.; Gunasekaran, A.; Subramanian, N. Influence of eco-innovation on Indian manufacturing sector sustainable performance. Int. J. Sustain. Dev. World Ecol. 2014, 21, 198–209. [Google Scholar] [CrossRef]
- Kemp, R.; Pearson, P. Final Report MEI Project about Measuring Eco-Innovation; UM Merit: Maastricht, The Netherlands, 2007. [Google Scholar]
- Huppes, G.; Kleijn, R.; Huele, R.; Ekins, P.; Shaw, B.; Esders, M.; Schaltegger, S. Measuring Eco-Innovation: Framework and Typology of Indicators Based on Causal Chains; Final Report of the ECODRIVE Project; CML, University of Leiden: Leiden, The Netherlands, 2008. [Google Scholar]
- Arundel, A.; Kemp, R. Measuring Eco-Innovation; UNU-MERIT: Maastricht, The Netherlands, 2009. [Google Scholar]
- Cheng, C.C.; Shiu, E.C. Validation of a proposed instrument for measuring eco-innovation: An implementation perspective. Technovation 2012, 32, 329–344. [Google Scholar] [CrossRef]
- World Commission on Environment and Development (WCED). Report of the World Commision on Environement and Development: Our Common Future. 1987. Available online: http://www.un-documents.net/wced-ocf.htm (accessed on 28 November 2017).
- Adede, A.O. An Overview of Past Lessons and Future Challenges; Codification Division, Office of Legal Affairs, United Nations Secretariat: New York, NY, USA, 1992; Volume 22. [Google Scholar]
- Behnam, S.; Cagliano, R. Be sustainable to be innovative: An analysis of their mutual reinforcement. Sustainability 2017, 9, 17. [Google Scholar] [CrossRef]
- OECD. The Future of Eco-Innovation: The Role of Business Models in Green Transformation; OECD: Paris, France, 2012. [Google Scholar]
- Taddeo, R.; Simboli, A.; Ioppolo, G.; Morgante, A. Industrial symbiosis, networking and innovation: The potential role of innovation poles. Sustainability 2017, 9, 169. [Google Scholar] [CrossRef]
- Fonseca, L.M.; Lima, V.M. Countries three wise men: Sustainability, Innovation, and Competitiveness. J. Ind. Eng. Manag. 2015, 8, 1288–1302. [Google Scholar] [CrossRef]
- Bringezu, S.; Bleischwitz, R. Sustainable Resource Management. Trends, Visions and Policies for Europe and the World; Greenleaf: Sheffield, UK, 2009. [Google Scholar]
- Hammond, A. Environmental Indicators: A Systematic Approach to Measuring and Reporting on Environmental Policy Performance in the Context of Sustainable Development; World Resource Institute: New York, NY, USA, 1995. [Google Scholar]
- United Nations. Indicators of Sustainable Development: Guidelines and Methodologies; United Nations: New York, NY, USA, 2007. [Google Scholar]
- Niemeijer, D. Developing indicators for environmental policy: Data-driven and theory-driven approaches examined by example. Environ. Sci. Policy 2002, 5, 91–103. [Google Scholar] [CrossRef]
- Hollander, J. Measuring Community: Using Sustainability Indicators in Devens, Massachusetts. Plan. Casebook 2002, 39, 1–7. [Google Scholar]
- Phillips, R. Community Indicators; The American Planning Association: Chicago, IL, USA, 2003. [Google Scholar]
- Parad, M.; Henningsson, S.; Currás, T.A.; Youngman, R. The Global Cleantech Innovation Index 2014; Cleantech Group: San Francisco, CA, USA; Washington, DC, USA, 2014. [Google Scholar]
- Tamanini, J.; Bassi, A.; Hoffman, C.; Valenciano, J. Global Green Economy Index: Measuring National Performance in the Green Economy; United Nations: Washington, DC, USA, 2014. [Google Scholar]
- Bossink, B.A. Demonstration projects for diffusion of clean technological innovation: A review. Clean Technol. Environ. Policy 2015, 17, 1409–1427. [Google Scholar] [CrossRef]
- Zelenakova, M.; Vilcekova, S.; Zvijakova, L. Green Technologies and Innovation. In Proceedings of the SBE16 Dubai, Dubai, UAE, 17–19 January 2016. [Google Scholar]
- Malik, O.A.; Hsu, A.; Johnson, L.A.; de Sherbinin, A. A global indicator of wastewater treatment to inform the Sustainable Development Goals (SDGs). Environ. Sci. Policy 2015, 48, 172–185. [Google Scholar] [CrossRef]
- Statistics Korea. Korea’s Green Growth (Based on OECD Green Growth Indicators); Statistics Korea: Daejeon, Korea, 2012.
- GGKP. Moving towards a Common Approach on Green Growth Indicators; A Green Growth Knowledge Platform Scoping Paper; GGKP: Geneva, Switzerland, 2013. [Google Scholar]
- Nelson, R.R. National Innovation Systems: A Comparative Analysis; Oxford University Press: Oxford, UK, 1993. [Google Scholar]
- OECD. Managing National Innovation Systems; OECD: Paris, France, 1999. [Google Scholar]
- Geels, F.W.; Schot, J. Typology of sociotechnical transition pathways. Res. Policy 2007, 36, 399–417. [Google Scholar] [CrossRef]
- Kemp, R.; Djik, M. Analytical Framework of Drivers and Barriers to Resource Efficiency. Deliver-Able 1.1 of WP 1 “Why Have Resources Been Used Inefficiently” of the Policy Options for a Resource-Efficient Economy (POLFREE) Project; UCL: London, UK, 2013. [Google Scholar]
- Bleischwitz, R. Corporate Governance of Sustainability. A Co-Evolutionary View on Resource Management; Bleischwitz, R., Ed.; Edward Elgar Publisher: Cheltenham, UK; Northampton, MA, USA, 2007. [Google Scholar]
- Acemoglu, B.D.; Aghion, P.; Bursztyn, L.; Hemous, D. The Environment and Directed Technical Change. Am. Econ. Rev. 2012, 102, 131–166. [Google Scholar] [CrossRef] [PubMed]
- Mazzucato, M. The Entrepreneurial State: Debunking Public vs. Private Sector Myths; Anthem Press: New York, NY, USA, 2015. [Google Scholar]
- Park, M.; Bleischwitz, R.; Han, K.; Jang, E.; Joo, J. Comparing Eco-Innovation Indices: ASEM Eco-Innovation Index & Eco-Innovation Scoreboard; ASEIC and University College London: Seongnam, Korea; London, UK, 2016. [Google Scholar]
- Park, M.; Han, K.; Jang, E.; Choi, W.; Joo, J. ASEM Eco-Innovation Index 2016; ASEIC: Seongnam, Korea, 2016. [Google Scholar]
- Giljum, S.; Lieber, M. The Eco-Innovation Scoreboard: 2014 and 2015 Versions Technical Note. 2016. Available online: https://ec.europa.eu/environment/ecoap/sites/ecoap_stayconnected/files/eco-innovation_scoreboard_2014_and_2015_technical_note_final.pdf (accessed on 28 November 2017).
- Adams, R.; Jeanrenaud, S.; Bessant, J.; Denyer, D.; Overy, P. Sustainability oriented innovation: A systematic review. Int. J. Manag. Rev. 2016, 18, 180–205. [Google Scholar] [CrossRef] [Green Version]
- Jasch, C. Environmental performance evaluation and indicators. J. Clean. Prod. 2000, 8, 79–88. [Google Scholar] [CrossRef]
- UNEP. Towards a Green Economy: Pathways to Sustainable Development and Poverty Eradication; UNEP: Nairobi, Kenya, 2011. [Google Scholar]
- Freeman, R.E. Strategic Management: A Stakeholder Approach; Pitman: Boston, MA, USA, 1984. [Google Scholar]
- Willis, K. Viewpoint: International development planning and the Sustainable Development Goals (SDGs). Int. Dev. Plan. Rev. 2016, 38. [Google Scholar] [CrossRef]
- Inderst, G.; Kaminker, Ch.; Stewart, F. Defining and Measuring Green Investments: Implications for Institutional Investors “Asset Allocations” OECD Working Papers on Finance. Insurance and Private Pensions; OECD Publishing: Paris, France, 2012. [Google Scholar]
- Park, M.; Thắng, N.T.; Jang, E.; Joo, J. Eco-Innovation and Sustainable Consumption and Production in Vietnam; Hanns Seidel Foundation and ASEM SMEs Eco-Innovation Center: Hanoi, Vietnam; Seongnam, Korea, 2017. [Google Scholar]
- United Nations. Transforming Our World: The 2030 Agenda for Sustainable Development; United Nations: New York, NY, USA, 2015. [Google Scholar]
- Szopik-Depczyńska, K.; Cheba, K.; Bąk, I.; Kiba-Janiak, M.; Saniuk, S.; Dembińska, I.; Ioppolo, G. The application of relative taxonomy to the study of disproportions in the area of sustainable development of the European Union. Land Use Policy 2017, 68, 481–491. [Google Scholar] [CrossRef]
- Jang, E.; Park, M.; Han, K.; Tan, S.B. ASEM Eco-Innovation Index 2015 Country Report: Vietnam; ASEIC: Seongnam, Korea, 2015. [Google Scholar]
- Jang, E.; Park, M.; Han, K. ASEM Eco-Innovation Index 2015 Country Report: Republic of Korea; ASEIC: Seongnam, Korea, 2015. [Google Scholar]
- Jang, E.; Park, M.; Han, K. ASEM Eco-Innovation Index 2015 Country Report: Myanmar; ASEIC: Seongnam, Korea, 2015. [Google Scholar]
- Jang, E.; Takahashi, T.; Park, M.; Han, K. ASEM Eco-Innovation Index 2015 Country Report: Japan; ASEIC: Seongnam, Korea, 2015. [Google Scholar]
- Choi, W.; de Moran, F.; Han, K.; Park, M.; Jang, E.; Joo, J. ASEM Eco-Innovation Index 2015 Country Report: Singapore; ASEIC: Seongnam, Korea, 2016. [Google Scholar]
- Han, K.; Boonyananth, S.; Choi, W.; Bunyagidj, C.; Park, M.; Jang, E.; Joo, J. ASEM Eco-Innovation Index 2015 Country Report: Thailand; ASEIC: Seongnam, Korea, 2016. [Google Scholar]
- Sarkar, A.N. Promotion of eco-innovation to leverage sustainable development of eco-industry and green growth. Int. J. Ecol. Dev. 2013, 25, 71–104. [Google Scholar]
- OECD. Better Policies to Support Eco-Innovation; OECD Studies on Environmental Innovation; OECD Publishing: Paris, France, 2011. [Google Scholar]
- EIO. The Eco-Innovation Challenge: Pathways to a Resource-Efficient Europe; Eco Innovation Observatory, 2011. Available online: http://www.eco-innovation.eu/index.php?option=com_content&view=article&id=279&Itemid=38 (accessed on 28 November 2017).
- EIO. Eco—Innovation Observatory Methodological Report; Eco Innovation Observatory. 2010. Available online: http://www.eco-innovation.eu/ (accessed on 28 November 2017).
- European Commission. Eco-Industry, Its Size, Employment, Perspectives and Barriers to Growth in an Enlarged EU; European Commission: Brussels, Belgium, 2006. [Google Scholar]
- EIO. Europe in Transition. Paving the Way to a Green Economy through Eco-Innovation. 2013. Available online: http://www.eco-innovation.eu/index.php?option=com_content&view=article&id=279&Itemid=38 (accessed on 28 November 2017).
- European Commission The Eco-Innovation Scoreboard and the Eco-Innovation Index. Available online: https://ec.europa.eu/environment/ecoap/indicators/index_en (accessed on 28 November 2017).
- Gilijum, S.; Lieber, M.; Doranova, A. EU Eco-Innovation Index 2016. 2017. Available online: https://ec.europa.eu/environment/ecoap/sites/ecoap_stayconnected/files/eio_brief_eco-innovation_index_2016_final.pdf (accessed on 28 November 2017).
- ASEIC. 2014 ASEM Eco-Innovation Index; ASEIC: Seoungnam, Korea, 2014. [Google Scholar]
- European Commission. Innovation for a Sustainable Future—The Eco-Innovation Action Plan (Eco-AP); European Commission: Brussels, Belgium, 2011. [Google Scholar]
- Bilsen, V.; Rademaekers, K. Study on the Competitiveness of the EU Eco-Industry. Within the Framework Contract of Sectoral Competitiveness Studies—ENTR/06/054; Final Report—Part 1; ECORYS: Rotterdam, The Netherlands, 2009. [Google Scholar]
- Jordan, N.; Bleischwitz, R.; van Ewijk, S.; Fahnestock, J.B.; Singerland, S. Interim Progress Report No. 1 on the RECREATE Green Horizons Scoreboard. 2015. Available online: http://www.recreate-net.eu/dweb/results/d48-first-interim-report-green-horizons-scoreboard-and-indicators (accessed on 28 November 2017).
- Paraschiv, D.M.; Langă, E.L.; Olaru, C. Exploring Eco-innovation Trends in the European Construction Sector. Focus on Romania. Rom. Econ. J. 2011, 14, 69–89. [Google Scholar]
Figure 1.
Actors and linkages in National Innovation Systems [38].
Figure 1.
Actors and linkages in National Innovation Systems [38].
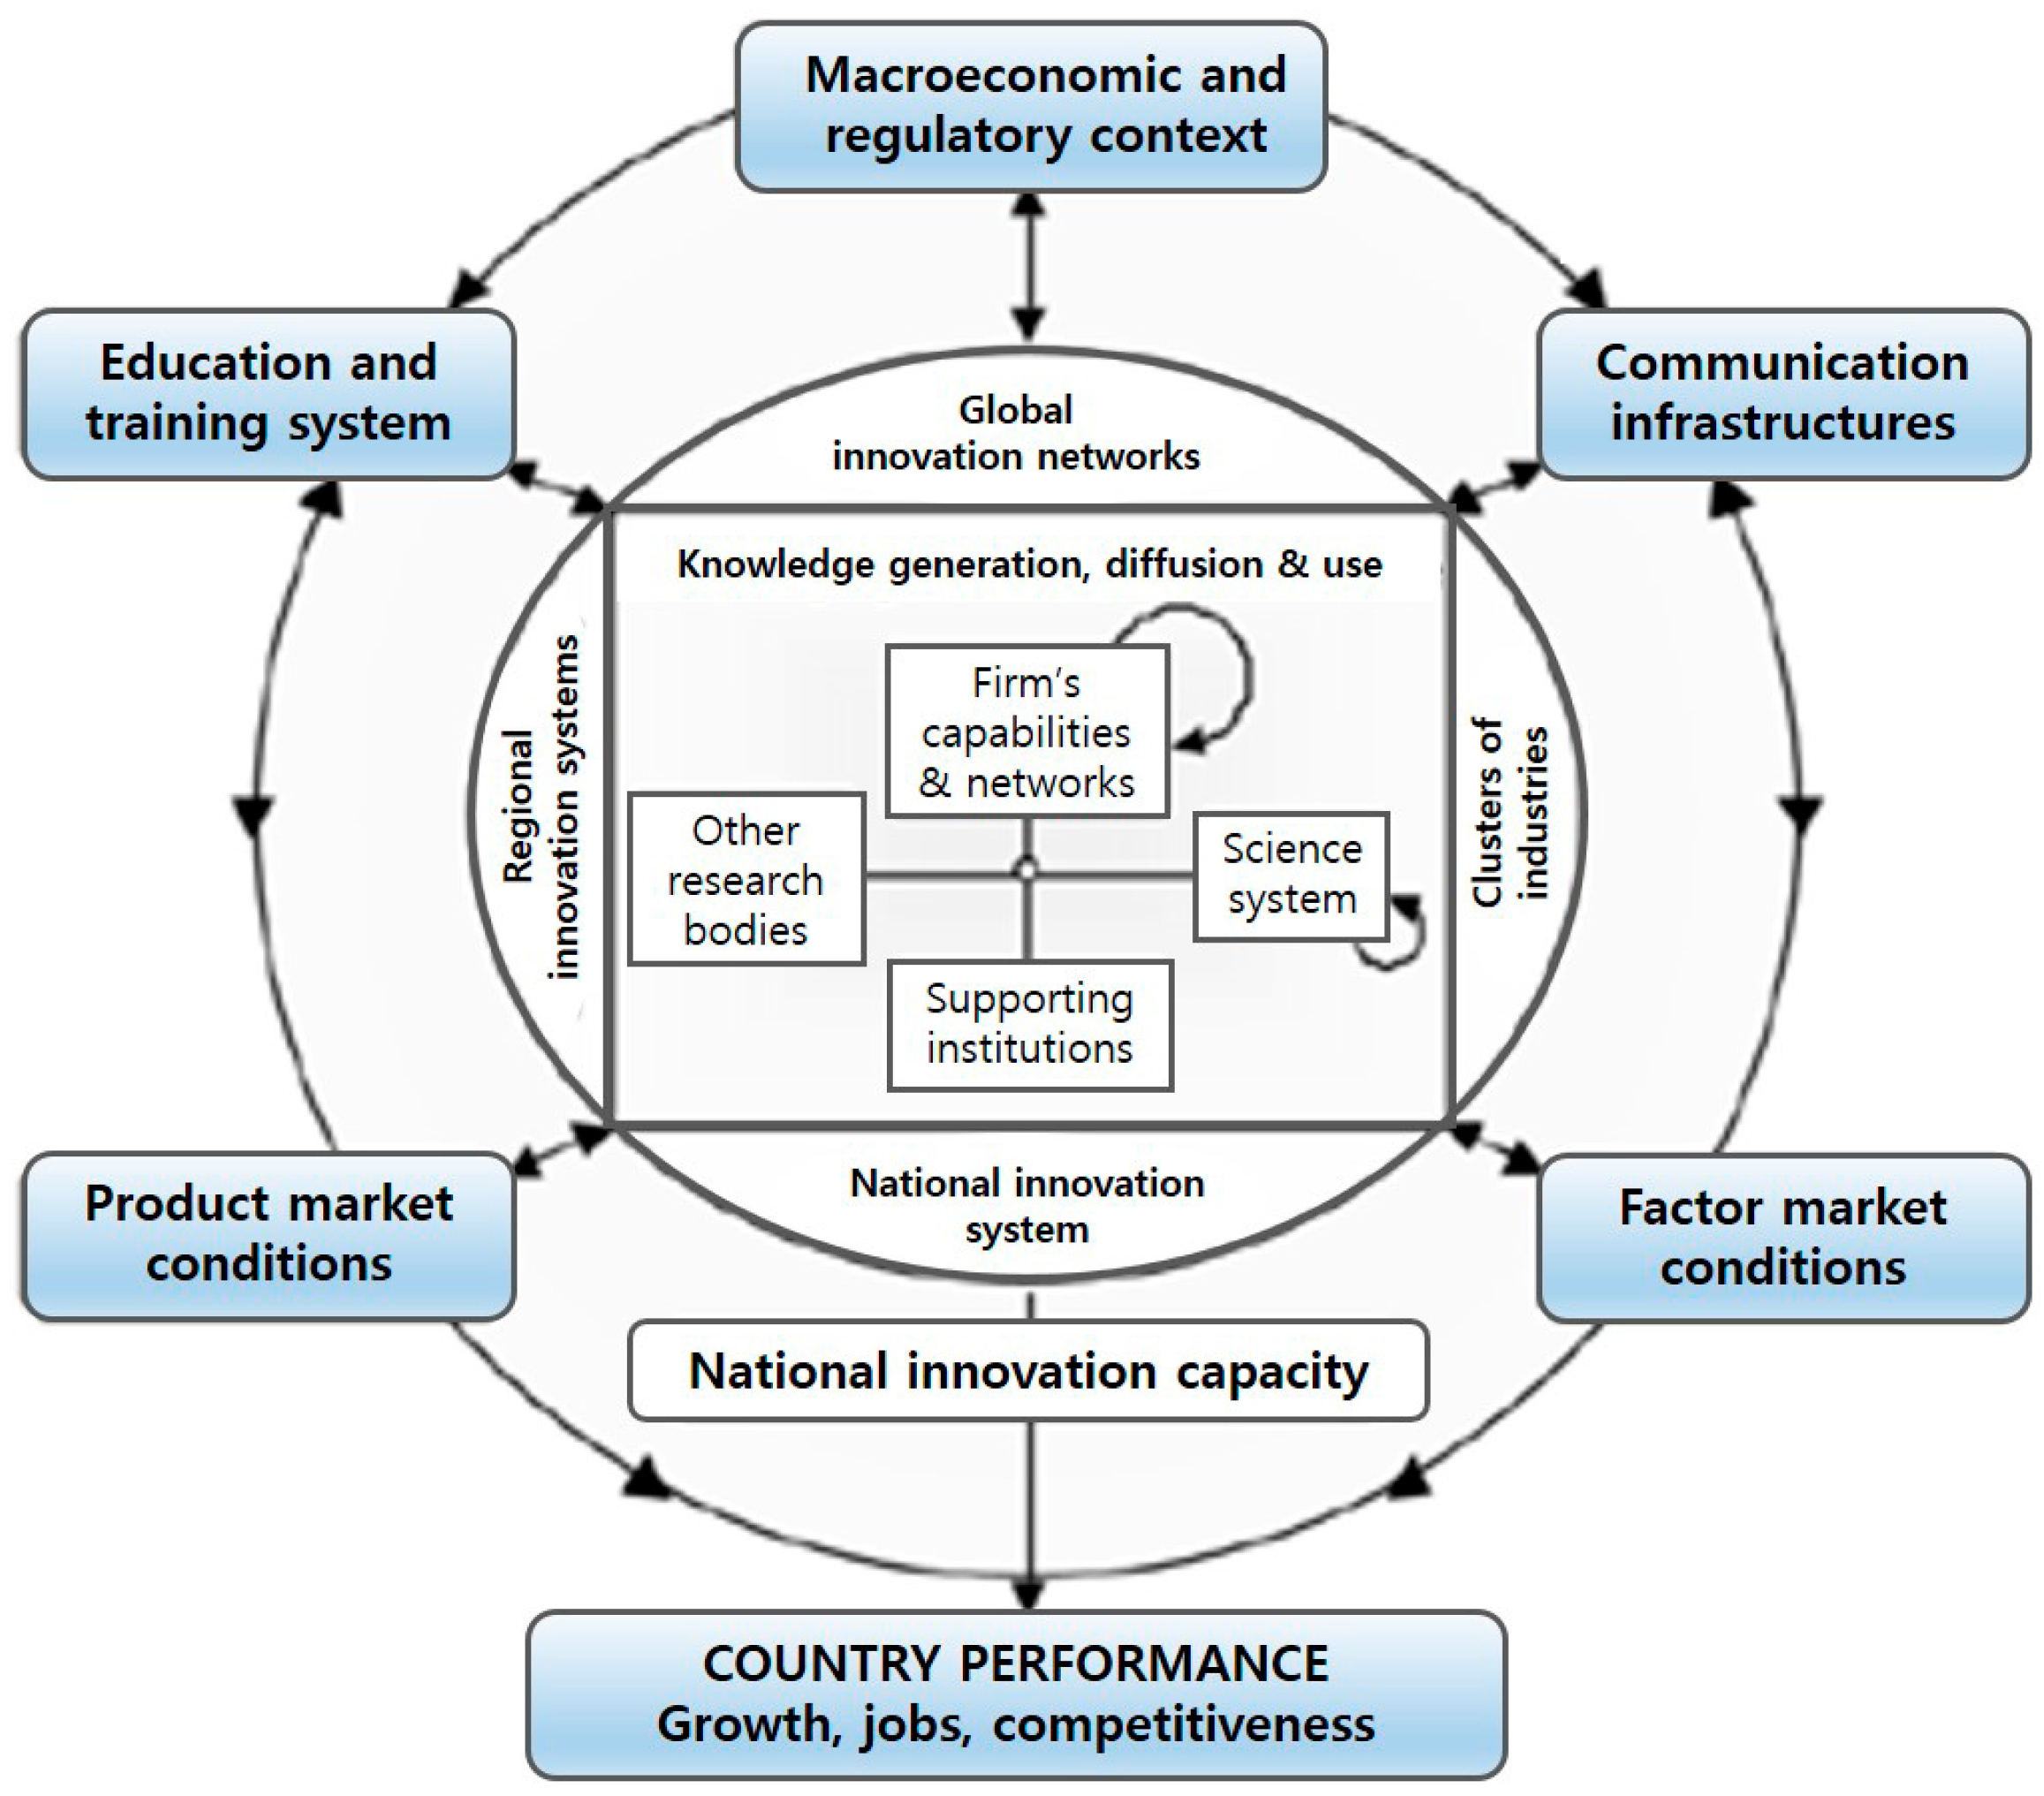
Figure 2.
Sectors of eco-innovation [44] (p. 16).
Figure 2.
Sectors of eco-innovation [44] (p. 16).

Figure 3.
The scores of Eco-IS 2016 [68].
Figure 3.
The scores of Eco-IS 2016 [68].
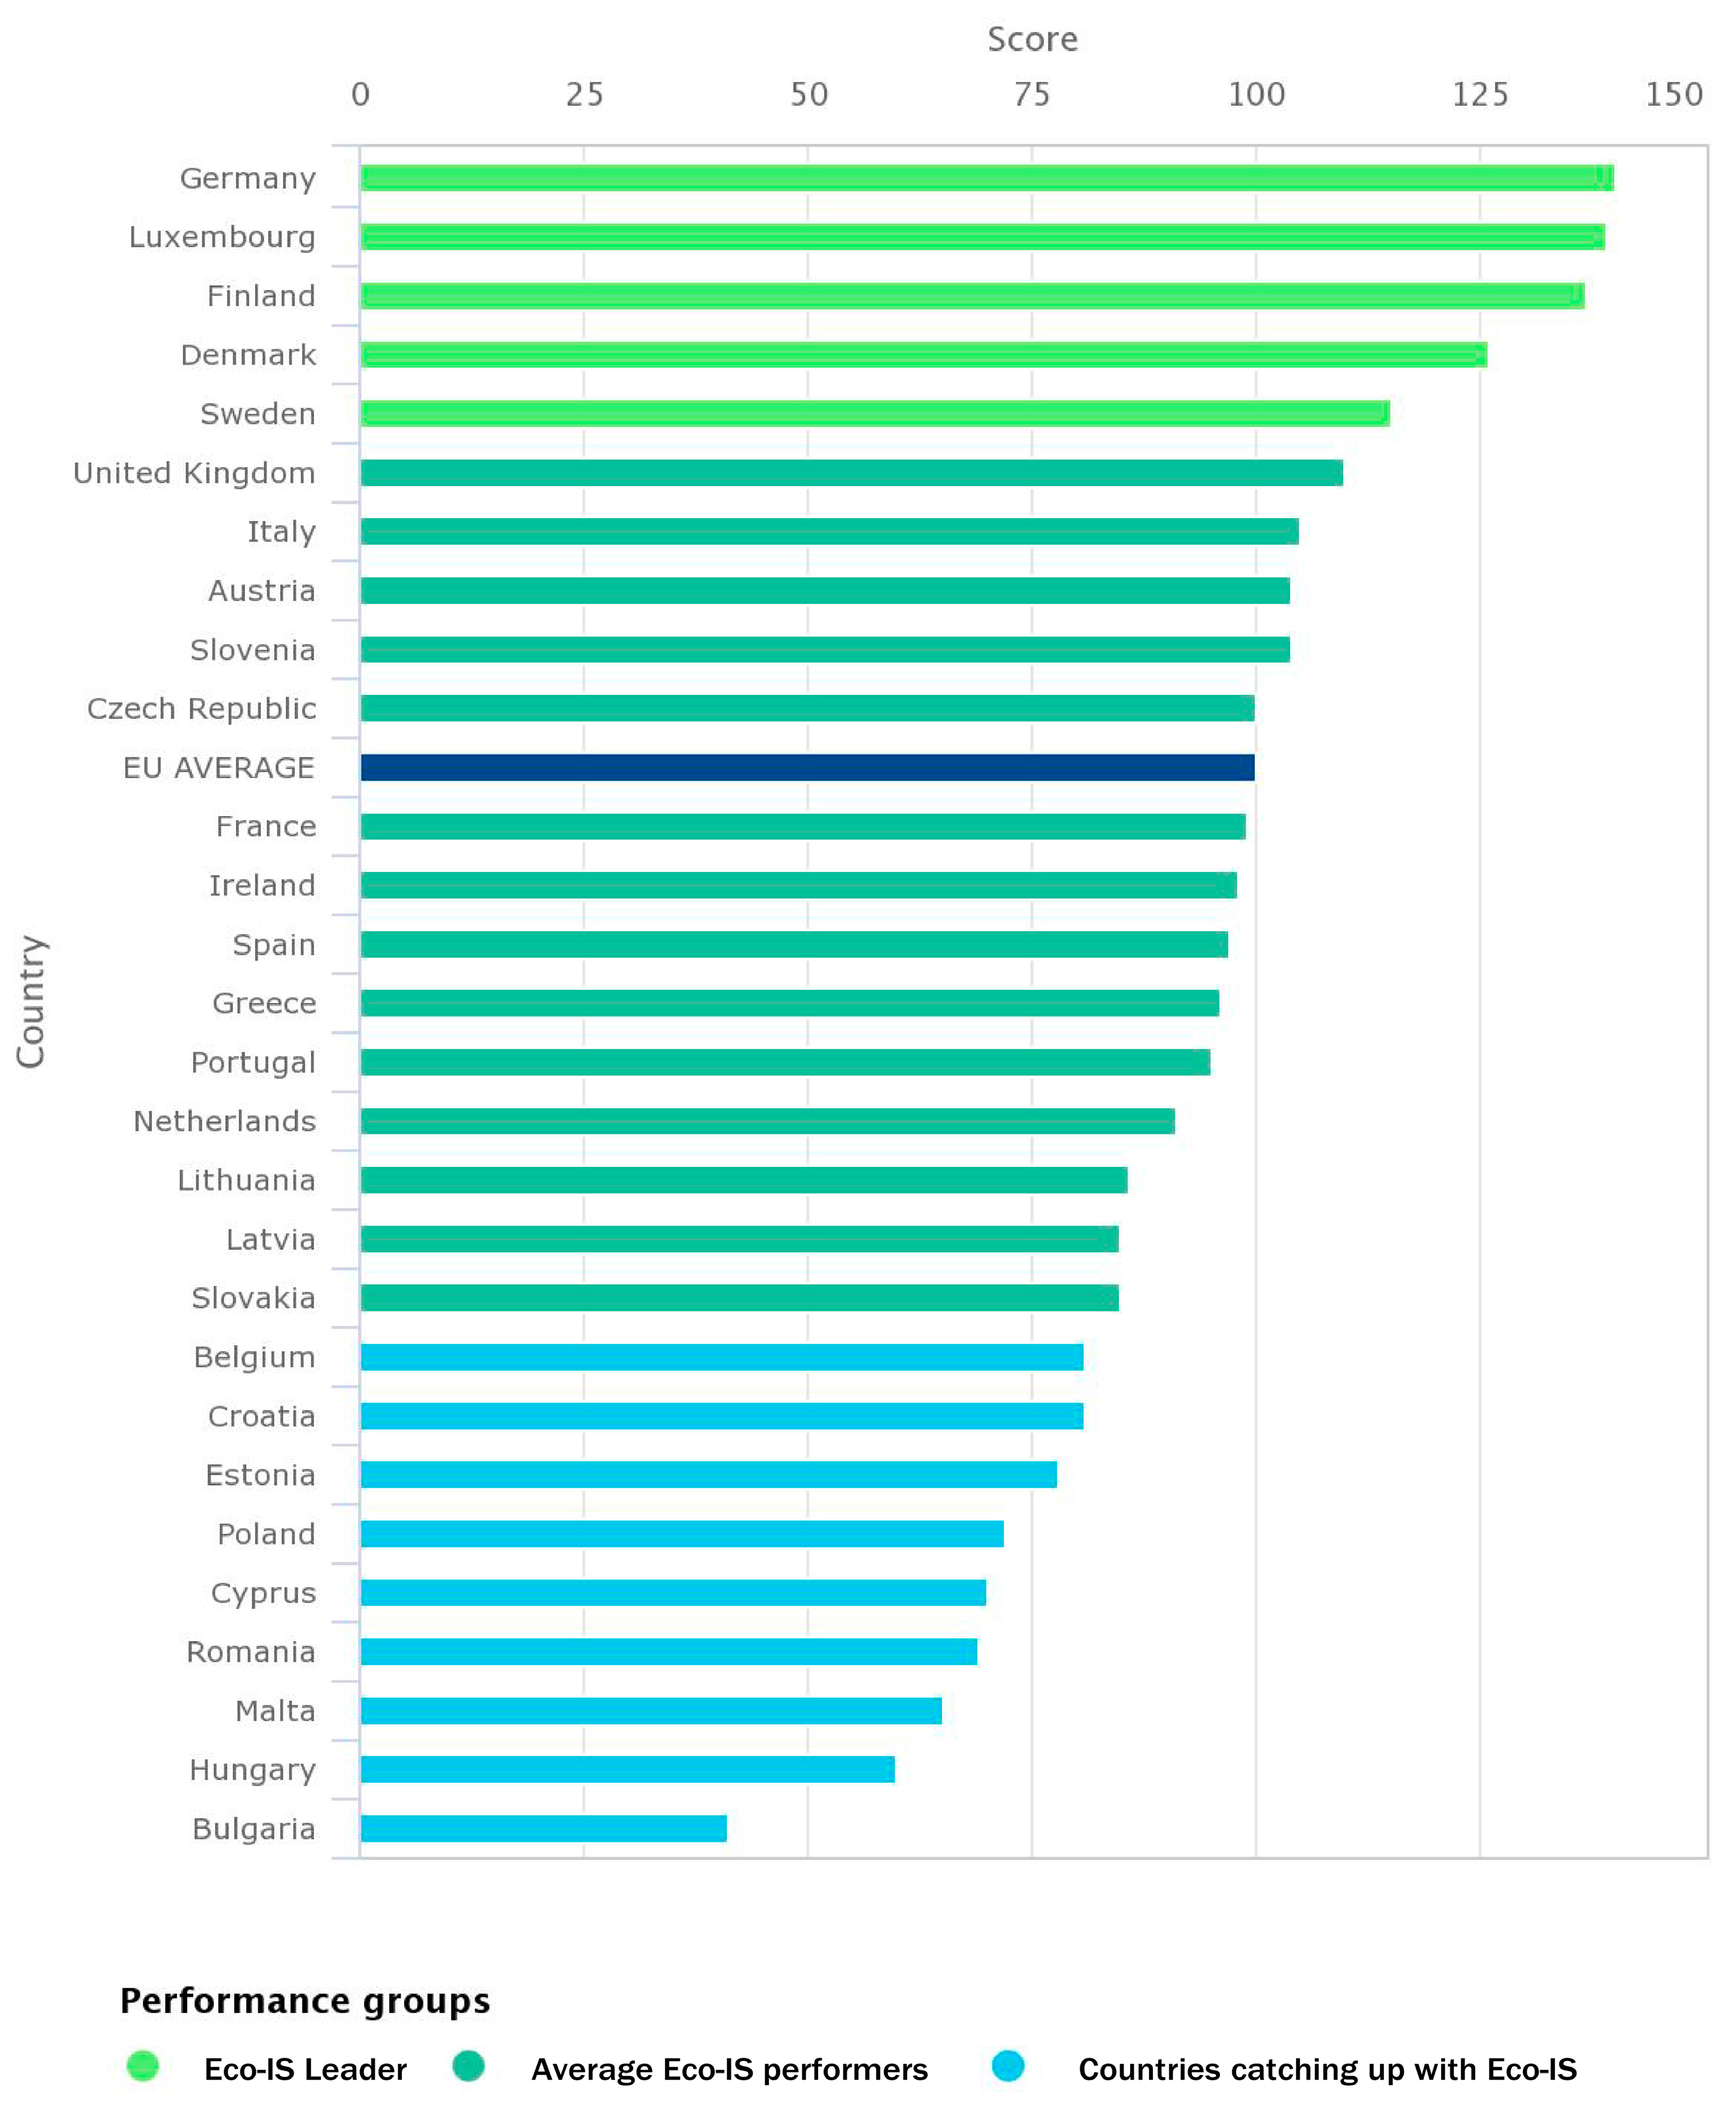
Table 1.
ASEM member countries.
| Europe (31) | Asia (20) |
|---|---|
| Austria, Belgium, Bulgaria, Croatia, Cyprus, Czech Republic, Denmark, Estonia, Finland, France, Germany, Greece, Hungary, Ireland, Italy, Latvia, Lithuania, Luxembourg, Malta, Netherlands, Norway, Poland, Portugal, Romania, Russian Federation, Slovakia, Slovenia, Spain, Sweden, Switzerland, UK | Australia, Bangladesh, Brunei Darussalam, Cambodia, China, India, Indonesia, Japan, Kazakhstan, Republic of Korea, Lao PDR, Malaysia, Mongolia, Myanmar, New Zealand, Pakistan, Philippines, Singapore, Thailand, Vietnam |
Table 2.
Components and indicators of ASEM Eco-innovation Index.
| Component | Indicator |
|---|---|
| 1. Eco-innovation Capacity | 1.1. Nation’s Economic Competitiveness |
| 1.2. Nation’s General Innovation Capacity | |
| 1.3. Green Technology R&D Institution Capacity | |
| 1.4. Green Technology possessed/acquired Enterprises | |
| 1.5. Awareness of Sustainability Management | |
| 2. Eco-innovation Supporting Environment | 2.1. Government’s R&D expenditure in Green Industry |
| 2.2. Implementation of Environmental Regulations | |
| 2.3. Maturity of Investment Setting for Green Technology Industry | |
| 2.4. Investment Scale of Green Technology SMEs | |
| 3. Eco-innovation Activities | 3.1. Commercialization Level of Green Technology |
| 3.2. Enterprises’ Participation on Environmental Management System | |
| 3.3. Economic Influence of Leading Environmentally Responsive Enterprises | |
| 3.4. Green Patents | |
| 3.5. Activeness of Renewable Energy Utilization | |
| 4. Eco-innovation Performances | 4.1. Level of Environmental Impact on Society |
| 4.2. CO2 Emission Intensity | |
| 4.3. Nation’s Energy sustainability level | |
| 4.4. Water Consumption Intensity | |
| 4.5. Jobs in Green Technology Industry | |
| 4.6. Green Industry Market Size |
Note: Indicators in the blue cells were measured in 2015 and 2016.
Table 3.
Components and indicators of eco-innovation scoreboard.
| Component | Indicator |
|---|---|
| 1. Eco-innovation inputs | 1.1 Governments environmental and energy R&D appropriations and outlays |
| 1.2 Total R&D personnel and researchers | |
| 1.3 Total value of green early stage investments | |
| 2. Eco-innovation activities | 2.1 Firms having implemented innovation activities aiming at a reduction of material input per unit output |
| 2.2 Firms having implemented innovation activities aiming at a reduction of energy input per unit output | |
| 2.3 ISO 14001 registered organizations | |
| 3. Eco-innovation outputs | 3.1 Eco-innovation related patents |
| 3.2 Eco-innovation related academic publications | |
| 3.3 Eco-innovation related media coverage | |
| 4. Environmental outcomes | 4.1 Material productivity |
| 4.2 Water productivity | |
| 4.3 Energy Productivity | |
| 4.4 GHG emissions intensity | |
| 5. Socio-economic outcomes | 5.1 Exports of products from eco-industries |
| 5.2 Employment in eco-industries | |
| 5.3 Turnover in eco-industries |
Table 4.
Four criteria for analyzing eco-innovation indices.
| Analysis Criteria | Description | Theoretical Background |
|---|---|---|
| Relevance of covering areas and stakeholders | Appropriateness of priority issues, consideration of stakeholders | Green economy [49] Stakeholders [50] |
| Ability to indicate changes | Validity, consistency, reliability, measurability, cost-effectiveness | Technical characteristics of indicators [28] |
| Directions towards common goals | Linkage with well-articulated visions and social, environmental and economic goals | Sustainable Development Goals [51] |
| Ability to facilitate further changes | Encouragement to governmental action and enterprises’ strategies | Roles of indicators [48] Sustainability-oriented innovation [47] |
| Category | Meaning | Key Question of Analysis |
|---|---|---|
| Validity | Data are well-grounded and accurately depict a real situation | How are indices constructed logically? How do indices depict a real situation? |
| Consistency and reliability | Indicators can be researched reliably over a period of time | Are data transparent? Does data have good quality? |
| Measurability | Data can be obtained for a community | Can data be obtained at the national level? |
| Comprehensiveness | Indicators represent relevant parts of an issue and reduce the need for excessive number of indicators | How do indices cover the multiple areas of eco-innovation? |
| Cost-effectiveness | Data collection is not overly expensive | How much costs are necessary for collecting data? |
| Comparability | Indicators are sufficiently general so that they can be compared with other communities | Are indices comparable across countries? |
| Accessibility | Indicators use affordable, relevant, and accessible data sources | Are data accessible for measuring indicators? |
Table 6.
Sustainable development goals [54].
Table 6.
Sustainable development goals [54].
| Goal No. | Content |
|---|---|
| Goal 1 | End poverty in all its forms everywhere |
| Goal 2 | End hunger, achieve food security and improved nutrition and promote sustainable agriculture |
| Goal 3 | Ensure healthy lives and promote well-being for all at all ages |
| Goal 4 | Ensure inclusive and equitable quality education and promote lifelong learning opportunities for all |
| Goal 5 | Achieve gender equality and empower all women and girls |
| Goal 6 | Ensure availability and sustainable management of water and sanitation for all |
| Goal 7 | Ensure access to affordable, reliable, sustainable and modern energy for all |
| Goal 8 | Promote sustained, inclusive and sustainable economic growth, full and productive employment and decent work for all |
| Goal 9 | Build resilient infrastructure, promote inclusive and sustainable industrialization and foster innovation |
| Goal 10 | Reduce inequality within and among countries |
| Goal 11 | Make cities and human settlements inclusive, safe, resilient and sustainable |
| Goal 12 | Ensure sustainable consumption and production patterns |
| Goal 13 | Take urgent action to combat climate change and its impacts |
| Goal 14 | Conserve and sustainably use the oceans, seas and marine resources for sustainable development |
| Goal 15 | Protect, restore and promote sustainable use of terrestrial ecosystems, sustainably mange forests, combat desertification, and halt and reverse land degradation and halt biodiversity loss |
| Goal 16 | Promote peaceful and inclusive societies for sustainable development, provide access to justice for all and build effective, accountable and inclusive institutions at all levels |
| Goal 17 | Strengthen the means of implementation and revitalize the global partnership for sustainable development |
Table 7.
ASEI indicators and SDGs.
| Component | Indicator | SDGs |
|---|---|---|
| 1. Eco-Innovation Capacity | 1.1. Nation’s Economic Competitiveness | G. 8 Good jobs and economic growth G. 12 Sustainable consumption and production |
| 1.2. Nation’s General Innovation Capacity | G. 8 Good jobs and economic growth G. 12 Sustainable consumption and production | |
| 1.3. Green Technology R&D Institution Capacity | G. 9 Industry and infrastructure | |
| 1.4. Green Technology possessed/acquired Enterprises | G. 9 Industry and infrastructure | |
| 1.5. Awareness of Sustainability Management | G. 12 Sustainable consumption and production | |
| 2. Eco-Innovation Supporting Environment | 2.1. Government’s R&D expenditure in Green Industry | G. 9 Industry and infrastructure G. 12 Sustainable consumption and production |
| 2.2. Implementation of Environmental Regulations | G. 16 Peace, justice and strong institutions | |
| 2.3. Maturity of Investment Setting for Green Technology Industry | G. 9 Industry and infrastructure | |
| 2.4. Investment Scale of Green Technology SMEs | G. 9 Industry and infrastructure | |
| 3. Eco-Innovation Activities | 3.1. Commercialization Level of Green Technology | G. 12 Sustainable consumption and production |
| 3.2. Enterprises’ Participation on Environmental Management System | G. 12 Sustainable consumption and production | |
| 3.3. Economic Influence of Leading Environmentally Responsive Enterprises | G. 9 Industry and infrastructure | |
| 3.4. Green Patents | G. 12 Sustainable consumption and production | |
| 3.5. Activeness of Renewable Energy Utilization | G. 7 Clean energy | |
| 4. Eco-Innovation Performances | 4.1. Level of Environmental Impact on Society | G. 3 Good health G. 12 Sustainable consumption and production |
| 4.2. CO2 Emission Intensity | G. 13 Climate action | |
| 4.3. Nation’s Energy sustainability level | G. 7 Clean energy | |
| 4.4. Water Consumption Intensity | G. 6 Clean water | |
| 4.5. Jobs in Green Technology Industry | G. 8 Good jobs and economic growth G. 9 Industry and infrastructure | |
| 4.6. Green Industry Market Size | G. 8 Good jobs and economic growth G. 9 Industry and infrastructure |
Note: Indicators in the blue cells were measured in 2015 and 2016.
Table 8.
ASEI 2016 [45].
Table 8.
ASEI 2016 [45].
| Nations | Capacity | Supporting Environment | Activity | Performance | Total |
|---|---|---|---|---|---|
| New Zealand | 61.88 | 87.69 | 30.74 | 68.55 | 62.21 |
| Lao PDR | 17.40 | 21.79 | 11.23 | 19.61 | 17.51 |
| Malaysia | 63.23 | 70.77 | 15.01 | 62.18 | 52.80 |
| Mongolia | 31.41 | 4.10 | 1.88 | 22.54 | 14.98 |
| Myanmar | 24.72 | 0.00 | 33.38 | 30.58 | 22.17 |
| Bangladesh | 27.48 | 16.41 | 12.94 | 26.63 | 20.86 |
| Vietnam | 46.04 | 18.21 | 18.77 | 34.24 | 29.31 |
| Brunei | 33.58 | 53.59 | 0.00 | 42.21 | 32.34 |
| Singapore | 79.51 | 89.74 | 7.48 | 66.95 | 60.92 |
| India | 48.15 | 37.69 | 13.79 | 32.55 | 33.05 |
| Indonesia | 45.61 | 39.49 | 19.24 | 52.42 | 39.19 |
| Japan | 78.51 | 94.36 | 19.53 | 71.27 | 65.92 |
| China | 67.40 | 35.64 | 30.99 | 55.00 | 47.26 |
| Kazakhstan | 38.16 | 39.49 | 0.98 | 43.34 | 30.49 |
| Cambodia | 21.29 | 18.46 | 32.91 | 28.19 | 25.21 |
| Thailand | 48.12 | 28.97 | 13.66 | 43.01 | 33.44 |
| Pakistan | 25.82 | 14.87 | 18.79 | 31.17 | 22.66 |
| Philippines | 43.81 | 41.54 | 23.55 | 42.30 | 37.80 |
| Korea | 72.73 | 46.41 | 20.11 | 52.22 | 47.87 |
| Australia | 71.67 | 80.00 | 23.67 | 65.16 | 60.13 |
| Greece | 43.34 | 35.13 | 20.30 | 59.68 | 39.61 |
| Netherlands | 79.76 | 86.92 | 21.97 | 65.73 | 63.60 |
| Norway | 72.66 | 88.46 | 44.02 | 76.57 | 70.43 |
| Denmark | 79.14 | 100.00 | 33.87 | 72.63 | 71.41 |
| Germany | 82.27 | 95.38 | 22.76 | 71.08 | 67.87 |
| Latvia | 46.30 | 62.05 | 39.96 | 66.00 | 53.58 |
| Russia Federation | 48.69 | 27.18 | 24.15 | 52.67 | 38.17 |
| Romania | 42.85 | 33.85 | 53.88 | 57.68 | 47.07 |
| Luxembourg | 67.17 | 90.51 | 23.71 | 64.66 | 61.51 |
| Lithuania | 52.37 | 62.31 | 50.96 | 67.00 | 58.16 |
| Malta | 43.11 | 57.69 | 5.59 | 58.74 | 41.28 |
| Belgium | 67.05 | 87.69 | 14.49 | 64.05 | 58.32 |
| Bulgaria | 49.95 | 25.13 | 42.88 | 48.42 | 41.59 |
| Sweden | 81.96 | 87.95 | 35.94 | 78.41 | 71.06 |
| Switzerland | 88.68 | 98.97 | 30.27 | 75.02 | 73.24 |
| Spain | 70.67 | 52.05 | 37.75 | 74.37 | 58.71 |
| Slovakia | 40.20 | 53.59 | 39.37 | 64.65 | 49.45 |
| Slovenia | 49.21 | 66.67 | 45.44 | 64.47 | 56.45 |
| Ireland | 65.41 | 72.31 | 16.56 | 69.71 | 56.00 |
| Estonia | 50.71 | 74.87 | 40.09 | 44.86 | 52.63 |
| United Kingdom | 84.51 | 76.92 | 24.06 | 79.08 | 66.14 |
| Austria | 67.12 | 94.87 | 38.61 | 70.31 | 67.73 |
| Italy | 58.94 | 43.08 | 36.64 | 67.56 | 51.55 |
| Czech Republic | 55.07 | 64.87 | 60.01 | 57.90 | 59.46 |
| Croatia | 44.33 | 48.46 | 47.96 | 64.11 | 51.21 |
| Cyprus | 42.55 | 56.41 | 6.15 | 59.05 | 41.04 |
| Portugal | 54.51 | 71.03 | 29.20 | 67.20 | 55.48 |
| Poland | 51.78 | 50.26 | 30.15 | 56.49 | 47.17 |
| France | 79.76 | 67.95 | 22.86 | 77.09 | 61.92 |
| Finland | 74.78 | 98.97 | 39.50 | 70.36 | 70.90 |
| Hungary | 43.16 | 47.95 | 42.14 | 64.05 | 49.33 |
Table 9.
Eco-IS indicators and SDGs.
| Component | Indicator | SDGs |
|---|---|---|
| 1. Eco-innovation inputs | 1.1 Governments environmental and energy R&D appropriations and outlays | G. 8 Good jobs and economic growth G. 9 Industry and infrastructure |
| 1.2 Total R&D personnel and researchers | G. 8 Good jobs and economic growth | |
| 1.3 Total value of green early stage investments | G. 9 Industry and infrastructure | |
| 2. Eco-innovation activities | 2.1 Firms having implemented innovation activities aiming at a reduction of material input per unit output | G. 9 Industry and infrastructure G. 12 Sustainable consumption and production |
| 2.2 Firms having implemented innovation activities aiming at a reduction of energy input per unit output | G. 7 Clean energy G. 9 Industry and infrastructure G. 12 Sustainable consumption and production | |
| 2.3 ISO 14001 registered organizations | G. 9 Industry and infrastructure G. 12 Sustainable consumption and production | |
| 3. Eco-innovation outputs | 3.1 Eco-innovation related patents | G. 9 Industry and infrastructure G. 12 Sustainable consumption and production |
| 3.2 Eco-innovation related academic publications | G. 9 Industry and infrastructure | |
| 3.3 Eco-innovation related media coverage | G. 9 Industry and infrastructure | |
| 4. Environmental outcomes | 4.1 Material productivity | G. 9 Industry and infrastructure G. 12 Sustainable consumption and production |
| 4.2 Water productivity | G. 6 Clean water | |
| 4.3 Energy Productivity | G. 7 Clean energy G. 9 Industry and infrastructure | |
| 4.4 GHG emissions intensity | G. 13 Climate action | |
| 5. Socio-economic outcomes | 5.1 Exports of products from eco-industries | G. 9 Industry and infrastructure |
| 5.2 Employment in eco-industries | G. 8 Good jobs and economic growth G. 9 Industry and infrastructure | |
| 5.3 Turnover in eco-industries | G. 9 Industry and infrastructure |
Table 10.
Strength and weakness of ASEI and Eco-IS.
| Index | Criteria | Strength | Weakness |
|---|---|---|---|
| ASEI | Relevance of covering areas and stakeholders |
|
|
| Ability to indicate changes |
|
| |
| Directions towards common goals |
|
| |
| Ability to facilitate further changes |
|
| |
| Eco-IS | Relevance of covering areas and stakeholders |
|
|
| Ability to indicate changes |
|
| |
| Directions towards common goals |
|
| |
| Ability to facilitate further changes |
|
|
| Country | Eco-IS Score | ASEI Score | Eco-IS Rank | ASEI Rank |
|---|---|---|---|---|
| Bulgaria | 41 | 41.59 | 28 | 25 |
| Hungary | 60 | 49.33 | 27 | 22 |
| Malta | 65 | 41.28 | 26 | 26 |
| Romania | 69 | 47.07 | 25 | 24 |
| Cyprus | 70 | 41.04 | 24 | 27 |
| Poland | 72 | 47.17 | 23 | 23 |
| Estonia | 78 | 52.64 | 22 | 19 |
| Belgium | 81 | 58.32 | 21 | 12 |
| Croatia | 81 | 51.21 | 20 | 21 |
| Slovakia | 85 | 56.45 | 19 | 14 |
| Latvia | 85 | 53.58 | 18 | 18 |
| Lithuania | 86 | 58.16 | 17 | 13 |
| Netherlands | 91 | 63.60 | 16 | 7 |
| Portugal | 95 | 55.48 | 15 | 17 |
| Greece | 96 | 39.61 | 14 | 28 |
| Spain | 97 | 58.71 | 13 | 11 |
| Ireland | 98 | 56.00 | 12 | 16 |
| France | 99 | 61.92 | 11 | 8 |
| Czech Republic | 100 | 59.46 | 10 | 10 |
| Slovenia | 104 | 56.45 | 8 | 14 |
| Austria | 104 | 67.73 | 8 | 5 |
| Italy | 105 | 51.56 | 7 | 20 |
| United Kingdom | 110 | 66.14 | 6 | 6 |
| Sweden | 115 | 71.06 | 5 | 2 |
| Denmark | 126 | 71.41 | 4 | 1 |
| Finland | 137 | 70.90 | 3 | 3 |
| Luxembourg | 139 | 61.52 | 2 | 9 |
| Germany | 140 | 67.87 | 1 | 4 |
© 2017 by the authors. Licensee MDPI, Basel, Switzerland. This article is an open access article distributed under the terms and conditions of the Creative Commons Attribution (CC BY) license (http://creativecommons.org/licenses/by/4.0/).
Share and Cite
MDPI and ACS Style
Park, M.S.; Bleischwitz, R.; Han, K.J.; Jang, E.K.; Joo, J.H. Eco-Innovation Indices as Tools for Measuring Eco-Innovation. Sustainability 2017, 9, 2206. https://doi.org/10.3390/su9122206
AMA Style
Park MS, Bleischwitz R, Han KJ, Jang EK, Joo JH. Eco-Innovation Indices as Tools for Measuring Eco-Innovation. Sustainability. 2017; 9(12):2206. https://doi.org/10.3390/su9122206
Chicago/Turabian StylePark, Mi Sun, Raimund Bleischwitz, Ki Joo Han, Eun Kyung Jang, and Ji Hyung Joo. 2017. "Eco-Innovation Indices as Tools for Measuring Eco-Innovation" Sustainability 9, no. 12: 2206. https://doi.org/10.3390/su9122206
Note that from the first issue of 2016, this journal uses article numbers instead of page numbers. See further details here.