Climate Changes and Their Impact on Agricultural Market Systems: Examples from Nepal


1
Centre for Development and Environment, University of Bern, Hallerstrasse 10, 3012 Bern, Switzerland
2
HELVETAS Swiss Intercooperation, Jhamshikhel, Dhobi Ghat, Lalitpur, GPO Box 688, Kathmandu 44600, Nepal
3
HELVETAS Swiss Intercooperation, Av. Julius Nyerere No. 1213, Maputo, Mozambique
4
HELVETAS Swiss Intercooperation, Weinbergstrasse 24, 8001 Zürich Switzerland
*
Author to whom correspondence should be addressed.
Sustainability 2017, 9(12), 2207; https://doi.org/10.3390/su9122207
Submission received: 21 October 2017
/
Revised: 22 November 2017
/
Accepted: 24 November 2017
/
Published: 29 November 2017
(This article belongs to the Section Sustainable Urban and Rural Development)
Abstract
:Global climate models foresee changes in temperature and precipitation regimes that shift regional climate zones and influence the viability of agricultural market systems. Understanding the influence of climate change on the different sub-sectors and functions of a market system is crucial to increasing the systems’ climate resilience and to ensuring the long-term viability of the sectors. Our research applies a new approach to climate change analysis to better understand the influence of climate change on each step of an agricultural market system—on its core (processing units, storage facilities and sales) and support functions (sapling supply, research, insurance and agricultural policy). We use spatial climate analyses to investigate current and projected changes in climate for different regions in Nepal. We then analyse the risks and vulnerabilities of the sub-sectors banana, charcoal, coffee, macadamia, orange, vegetables and walnut. Our results show that temperatures and precipitation levels will change differently depending on the climatic regions, and that climate change elicits different responses from the market functions both between and within each of the different sub-sectors. We conclude that climate-related interventions in market systems must account for each different market function’s specific response and exposure to climate change, in order to select adaptation measures that ensure long-term climate resilience.
1. Introduction
In recent decades, the climate has been observed to change and these changes have led to shifts in precipitation regimes and to changes in temperatures [1]. A variety of numerical models representing the physical processes in the atmosphere, ocean, cryosphere and land surface simulate the response of the global climate systems to increasing greenhouse gas concentrations and forecast how the climate is expected to change until 2050 and 2070 [1]. A recent study using a non-homogenous Markov model shows that the best atmospheric predictor variables are mean sea level pressure, temperatures at 1000 hPa, meridional and zonal winds at 850 hPa and precipitation at the latitude of 20°N to 80°N and longitude of 80°W to 60°E [2]. Wilby and Dawson [3] suggest that a focus on physically meaningful quantities, such as wind speeds, wave heights, phenological and hazard metrics, could improve our understanding of downscaled models. These forecasts yield reliable estimates of extreme temperatures, seasonal precipitation totals and areal and inter-site precipitation behaviour, yet data sparse regions in Africa, Asia and South America are under-represented [3].
Nepal is one of the more vulnerable countries and is likely to be severely impacted by climate change [4,5,6,7]. Maximum temperatures have been increasing since 1960 and precipitation has been decreasing during the summer monsoon period in combination with a shift in its onset [8,9,10,11,12]. By 2050, the mean annual temperature is projected to show an overall increase, while projected precipitation data indicate an increase in volume and intensity of rainfall in the monsoon (June–August) and post-monsoon (September–November) seasons, as well as a decrease in winter precipitation [10]. Changes in micro and macro climates lead to more extreme events, such as droughts and floods, and to changes in seasonal weather patterns [13]. These are increasingly affecting agricultural systems and livelihoods in the Hindu Kush Himalayan region, where poverty is widespread [14,15,16]. Agriculture is a major source of income: over 75% of Nepal’s population depends upon agriculture for both self-sufficiency and for cash crops [17]. Past studies investigated the influence of climate change on agriculture in Nepal, concluding that, while certain crop yields are predicted to decline under the projected climate changes, others can be expected to thrive by 2050 [18,19,20,21,22].
Climate change has an impact on market systems that typically involve the provision and sale of goods and services in formal and informal markets [23] (pp. 779–810). The effects and impact of climate change depend strongly on the market system and the regional context [24]. Out of all market systems, natural resource-based market systems, especially agricultural systems and thereby food security, are highly vulnerable to the different impacts of climate change ([23] (pp. 273–313); [25,26,27,28,29]).
Yet extreme events are not influencing solely the production of the agricultural sector: they are also increasingly affecting other sectors such as manufacturing or transportation, which leads to broad implications for the socio-economic systems [30,31,32,33,34]. At present, most research studies focus on the impact of climate change upon production sites of agricultural goods. There is limited research investigating the effects of climate change on the other steps of the agricultural market systems, including on its core functions such as processing units, storage facilities, or sales, and on support functions like sapling supply, research, insurance and agricultural policy. Our research in Nepal using the HELVETAS Swiss Intercooperation [35] analysis methodology provides insight into the impact of climate change on these sectors.
The aim of this research is, therefore, to add to the understanding on how climate change influences the agricultural market system using the example of chosen sub-sectors in Nepal and based on the methodology developed by HELVETAS Swiss Intercooperation [35]. The publication is structured in two analyses. First, we assess the current and projected climate changes for five climatically diverse regions. The regions are chosen according to the sub-sectors that are assessed in the second analysis, namely the sub-sectors of banana, charcoal, coffee, macadamia, orange, riverbed vegetables and walnut. The second analysis follows an eight-step approach, assessing the climate risks and vulnerabilities in agricultural market systems for each of the sub-sectors. This new approach has been developed by HELVETAS Swiss Intercooperation to better understand the impacts climate has on the different sub-sectors and to identify the most climate-resilient sub-sectors. The methodology includes an assessment of the current and potential hazards, which will be verified using the results of the first analysis. Then the impact of the hazards on the market functions is analysed. We conclude with suggestions on potential adaptation options for each of the sub-sectors and recommendations on their integration.
2. Materials and Methods
2.1. Study Area
Nepal lies in the Himalayas on the Asian subcontinent and covers an area of 147,181 km2 and an elevation range from 70 m in the south to 8848 m at the peak of Mount Everest in the northeast. Its climate is correspondingly diverse, dividing the country into six major climate zones: the tropical zone (below 1000 m), the subtropical zone (1000–2000 m), the temperate zone (2000–3000 m), the subalpine zone (3000–4000 m), the alpine zone (4000–5000 m), and the nival zone (above 5000 m), where there is no human habitation or agricultural use. The study was conducted in 14 districts of Nepal using the example of following sub-sectors: banana, charcoal, coffee, macadamia, oranges, riverbed vegetables and walnut (Figure 1). To assess the current climate and predicted changes, we grouped the districts into seven regions: the Northwest, Southwest, Central and Southeast and the districts Baitadi, Nuwakot and Sindhuli individually investigated due to their different climatic setting.
2.2. Climate and Geospatial Datasets
We followed the approach of Barrueto et al. [21] to analyse both the current and future climatic conditions of Nepal. The current climate analysis uses the bioclimatic variables from the WorldClim dataset, Version 1.4, developed by Hijmans et al. [36] (Appendix A). To derive the climate in the future, we worked with the four emission scenarios, called representative concentration pathways (RCPs) [1,37,38,39,40,41]: RCP2.6, a scenario with slightly increased greenhouse gas emissions; RCP4.5 and RCP6.0, two intermediate scenarios; and RCP8.5, a scenario representing very high greenhouse gas emissions. The RCPs cover an average for the years 2041–2060 and represent a short- to medium-term time frame. Zomer et al. [42,43] interpolated and derived the four datasets for the Himalayan region. The administrative boundaries we used belong to the regional database system of the Government of Nepal [44]. All geospatial analyses were performed using the Environmental System Research Institute’s (ESRI) Geographic Information System (GIS) environment.
We chose climate regions representing the average climate for the different sub-sectors. We analysed the following variables: the annual mean temperature (Tmean), the maximum temperature of the warmest month (Tmax), the minimum temperature of the coldest month (Tmin) and the annual precipitation (Prec). For each variable, we calculated the current and future extent under each of the four climatic scenarios.
2.3. Risk and Vulnerability Assessment of Market Systems
Market systems are defined by the Springfield Centre as “the multi-player, multi-function arrangement comprising three main sets of functions (core, rules and supporting) undertaken by different players (private sector, government, representative organizations, civil society, etc.) through which exchange takes place, develops, adapts and grows. A construct through which both conventionally-defined markets and basic services can be viewed” [45]. For this publication, we define risk as determined by the combination or overlapping of hazard, exposure and vulnerability [46]. Furthermore, hazard describes the potential occurrence of a natural or human-induced physical event that may cause loss of any sort, exposure refers to the presence of people, livelihoods, infrastructure or other social, cultural and economic assets that could be affected adversely, and vulnerability is understood as the predisposition to be adversely affected.
We followed the approach to climate risk and vulnerability assessment of market systems, which combines the adaptation process [47] using different risk assessment tools [48,49,50] and the market systems development project cycle [45] as suggested by HELVETAS Swiss Intercooperation [35]. This combination leads to an 8-step approach with two modules (Figure 2): Module A assesses the risks and vulnerabilities of sub-sectors and prioritizes them at the design and planning stage. Module B identifies and implements adaptation and disaster risk management measures to be incorporated in the general operations and activities of the most suitable market actors.
Module A, Step 1 aims at mapping core functions and market system structure and to understand its operation and dynamics [45]. Step 2 identifies current and future hazards for the selected sub-sectors using an adapted disaster classification [51]. These are further ranked according to their priority. The most outstanding hazards are further analysed according to their frequency, intensity, trend, and impact and coping strategies [49]. In Step 3, the potential impact of the hazards on each function of the market system is assessed [35]. In Step 4, the most climate-resilient sub-sectors are defined using a scoring matrix. Step 5 begins in Module B, where relevant measures to adapt towards climate change and managing disaster risks are identified and the best options are selected based on a set of criteria and an analysis of the market system (Step 6) [52]. For Step 7, an agreement on roles and responsibilities is reached and measures are planned and later implemented based on a matrix proposed by the Springfield Centre [45]. In the last step, Step 8, the process is monitored, and the results are measured leading to an increased climate resilience in the chosen sub-sectors. These two last steps are not included in our publication as they are the implementation of the previous Steps and are beyond the scope of this study (see Conclusions and recommendations).
The information for the analyses is based upon on a combination of primary information gathered through participatory methods such as focus group discussions with a variety of market actors, field observations in production areas and processing facilities, and discussions with expert team, and secondary information gathered through desk-based research [35].
2.4. Limitations of the Date Set
The topography of Nepal ranges from flat land to mountainous regions that are cut through with deep valleys. The WorldClim dataset’s resolution of 1000 m is not able to reflect the surface accurately, especially in regions with steep slopes and narrow valleys, nor does it represent microclimatic situations [21]. Despite these limitations, the WorldClim dataset is the best-developed dataset available for Nepal [20,42,43,53,54]. Moreover, a study by Glotter et al. [55] showed that, once a correction is applied, the results of general circulation models and regional climate models are indistinguishable in all four scenarios. This suggests that, when developing impact assessments, the benefits that are generated by dynamically downscaling raw, general-circulation models may not be sufficient to justify the computational demand. The team of Jang et al. [56] came to a similar conclusion, stating that precipitation and wind can be well-described at resolutions of 3 km and 9 km, respectively. In contrast, simulation grids of 27 km and 81 km are insufficient for watershed studies.
For the risk and vulnerability assessments, the analysis of the market-related information depends on the opinions and perspectives of different value chain actors and might be subject to error: the simple fact that participants are interviewed and may participate with expectations for support in the future and offer information which does not fully reflect the natural situation.
3. Results and Discussion
3.1. Climate Change: Observed and Projected across Nepal
The analysis of the different climatic parameters shows that the Northwest is expected to experience the biggest changes in temperature under the RCP8.5: Tmin +3.1 °C, Tmean +3.1 °C and Tmax +2.9 °C (Table 1).
The region with the least change in RCP8.5 is the Southeast: Tmin +2.5 °C, Tmean +2.3 °C and Tmax +2.1 °C (Figure 3). Over all the selected regions, Tmin is expected to increase on average 2.8 °C, Tmean 2.7 °C and Tmax 2.5 °C in RCP8.5. In the other scenarios, the changes are expected to be slightly lower. The largest changes in precipitation are under RCP8.5, in which precipitation will increase most in the Southwest (+246 mm), while the Northwest will gain +80 mm. On average for RCP8.5, the regions will annually receive +166 mm more precipitation.
The calculated temperature changes for 2050 agree with McSweeney et al. [10] and forecast the largest changes in the west of Nepal. However, our analysis also shows that the changes must be viewed in more detail: temperature changes are expected to be larger in the mid-hills (Baitadi) and mountainous areas (Northwest) than in the Tarai (Southwest). Our data also agree with the general increase of annual precipitation [10,57] and we can show that the increase is largest in the Central and Southwest. Yet our data does not reflect detailed information about monthly precipitation patterns, such as the onset of the monsoon, its patterns for individual months and the forecasted changes, as is found in a study for the Koshi river basin by Bharati et al. [58], who show that the maximum precipitation is higher during the monsoon and post-monsoon and lower during winter in RCP4.5 and even more pronounced for RCP6.0.
3.2. Risk and Vulnerability Assessment of Market Systems
3.2.1. Analysed Sub-Sectors
HELVETAS Swiss Intercooperation has engaged in all sub-sectors that were assessed and has closely engaged with the market actors along the entire value chain. Coffee has been a focus since the early 2000s when it was decided to take a sector approach and to promote coffee throughout the value chain. The earlier engagement was particularly around production, while processing and marketing gained importance over time. Banana was initially promoted amongst landless and land-poor farmers in far-western Tarai districts, but has recently taken on a sector approach with facilitation support to all actors, particularly nurseries. The most recent additions are macadamia and walnut, which were included based on recent developments in these sectors and the possibilities for internal and export niche markets. Oranges, particularly along the newly opened Dhulikhel–Sindhuli highway, are an interesting crop for commercialization, but have encountered several production and marketing problems; fruit flies have destroyed large production volumes in recent years. Riverbed farming is supporting landless and land-poor people to gain access to wastelands along rivers and increased productivity of these sandbanks for income generation. The production of charcoal from forest waste and invasive species has shown to be a viable market including the processing and promotion of different charcoal-based products.
3.2.2. Current and Potential Hazards
Based on an adapted disaster classification from the Integrated Research on Disaster Risk (IRDR) [51], it is evident that most of the actors of the value chains we assessed have observed meteorological, climatological and biological disasters, with riverbed farming also exposed to hydrological disasters (Table 2).
Temperature: Farmers observed increasing temperature since their childhood and particularly in recent years. Many of these observations are based on plants and animals which was also reported by SSMP [59], Sujakhu et al. [60] and Barrueto et al. [61]. These changes are expected to have an impact on the productivity of the different crops and their geographic distribution. From the experience of the banana farmers, banana grows at temperatures between 10°C and 40°C. Above 40 °C, the crop needs more irrigation, leaves dry and trees fruit less. This has a direct impact on productivity and increases the cost of production due to increased post-harvest losses for both producers and trader-farmers. At the same time, banana production may become possible at new, higher elevations. An altitudinal shift has been observed in several crops, e.g., coffee and oranges. In the case of coffee, it has become evident that earlier recommendations of growing coffee in an altitudinal belt between 800 and 1600 m in Nepal may not be valid anymore [53]. Currently, many coffee farmers have reported issues of green bean quality decrease at lower altitudes due to increased temperatures and lack of available water [35]. Orange farmers reported a new situation, where oranges at the altitude of 900 m are of low quality and shrivel up, while orange trees now thrive and fruit in higher altitudes at about 1400 m. Farmers have realized that oranges flower and ripen earlier, which has a negative impact on the productivity and the taste. Orange farmers in Sindhuli realized problems with oranges in lower altitudes—as mentioned above—and initiated farm-based research on alternative crops; they successfully started growing pomegranate and obtained good experience as a result.
The observed temperature changes agree with the results from our analyses. These observations show the tendency for temperatures to increase over the whole year, while the temperature is projected to increase in all the four climate scenarios (see Section 3.1).
Fog: Episodes of fog occur annually during the winter months, particularly in the plains of the Tarai. However, prolonged fog episodes seem to have increased in the last 20 years, based on the observations of charcoal producers. This agrees with other studies, where farmers from the Kapilvastua district (west of our study area) indicate that winter fog remains for several days longer than the past [62]. For charcoal producers, increased fog periods mean slower drying of the biomass and increased difficulties in charring, both resulting in less charcoal per vessel. Interestingly, the lack of fog in some far-western Tarai districts in the winter of 2016, on the other hand, caused increased diurnal temperature variation. This caused leaves that were freshly sprouted during the day to freeze during the night to the extent that many banana farmers thought that there was a major bacterial problem; many farmers immediately cut their plants in fear of having contracted the feared panama disease. In this context, the newly- established insurance supported them in getting at least some of their costs recovered. Other farmers, who did not cut their plants, observed later fruiting with a delay of about 20 days.
Precipitation: Water availability was indicated as an issue manifesting itself through decreasing precipitation, lowering water tables and more frequent droughts. Most of the farmers indicated having observed decreasing precipitation since their childhood. This is partly in contrast with researchers’ measured data. Different studies, such as that by Karki et al. [63], do show a decrease in precipitation over the central and eastern mid-hills. The same decrease in annual precipitation in the central mid-hills in the Nuwakot district is depicted by Poudel and Duex [64], who show that 73.2% of springs decreased and 12.2% dried up over the past 10 years. However, for the Koshi river basin in the southeast of Nepal, an overall increase in precipitation has been measured from 1975–2010 [65]. No rain in the dry season in 2015/16 caused fewer oranges on the trees in most of the orchards. The farmers further blamed the lack of rain in the cold period for an increased occurrence of pests.
Overall, precipitation has been observed to decrease over all our study regions. However, annual precipitation is predicted to increase by 4 to 8% (up to 120 mm more per year) by the year 2050 with an increase in monsoon and post-monsoon precipitation and a decrease in winter precipitation (see Section 3.1). This might be explained by the warmer climate in the recent years, which leads to more evaporation and increases the need for irrigation in the agricultural areas and therefore the need for water.
Wind storms: Many actors report an increase in the number of wind storms and a change in the timing of wind events. Wind storms occur every year and about 1 to 2 major storms have the potential to damage horticultural plantations. Already, banana farmers have seen a temporal shift of wind storms from March/April/May to July/August/September, which coincides with the main fruiting time. This shift renders plants more exposed and more likely to snap because of the higher fruit weight at that time. The changing wind patterns also affect production of charcoal from invasive species and forest weeds: the combination of increased wind storms and dry conditions particularly worry the actors in the charcoal market as it affects the timing of charcoal production due to increased forest fire risks, which in turn also reduce the raw material availability. In the case of walnut trees, timings seem to have changed from October/November/December to spring in April/May at the flowering and fruiting stages now. Hail storms have also been reported to have increased, both in terms of the number of events, and in terms of hailstone size. Scientific studies suggest that there is a correlation between climate change and the frequency and severity of extreme weather events which can lead to more hail storm activity, and hence, more damage [66].
Biological disasters: Biological disasters are dominated by fungal diseases and insect infestations. Coffee and oranges are both battling with their respective insect pests, i.e., white stem borer and fruit flies, respectively. In the earlier case, it was shown that drought and dry conditions facilitate white stem borer attacks [35]. It is reported that, particularly in lower elevations, the pests spread more quickly due to dry conditions.
3.2.3. Impact on Market Functions
The main market functions that are affected by climate risks are production and input supply. Table 3 summarizes the different market functions in general and how they are affected by different climate risks. For input supply, it is mainly the supply of seed or seedlings (or, in case of charcoal, the collection of biomass) that is altered; however, processing and post-harvesting have been shown to be impacted as well, e.g., in the case of coffee, different nuts and oranges. The trend towards poorly managed storage facilities and increasingly frequent problems of inconsistent quality is an issue that must be tackled in all these markets. Directly related to increasing temperatures and humidity are expected increases in fungal disease occurrence. Management practices need to be adapted to the new conditions, e.g., coffee processing will need to adapt to a shorter fermentation period because of increased temperatures, and charcoal will require faster charring because of more rapid drying of the biomass-the drier the biomass, the more ash produced in the charring process. As charcoal is used for heating purposes as well, the market of the products is affected and requires the identification of new marketing strategies and opportunities. As bananas are generally not eaten during the cold season due to the populations’ belief that they cause sore throats, a shift in production seasons will directly affect sales; new marketing strategies and processing methods will need to be evaluated.
As Table 3 summarises, each function of a market system is impacted differently depending on the sub-sector and climatic region in which it is found. In agricultural value chains, the production of goods in general is exposed to a higher number of climate-related risks compared to the other steps of a value chain.
4. Conclusions and Recommendations
Our spatial analysis of the current and projected weather data shows that the nature of the changes expected varies for each of the geographical locations. Temperature, for example, is expected to change more strongly in the Northwest compared to the Southeast, while precipitation is expected to increase more in the Central and Southwest compared to the Northwest.
The market system analysis also shows that the perceived and measured climate changes differ depending on the sub-sectors and regions. The sub-sector analysis further shows that, even if the sub-sectors are in the same climatic region, the climate impacts and hazards differ for each market sector and crop, as the value chain of each sub-sector has its own optimal requirements for success. Changes in climatic conditions may also cause negative impacts at one location while they are positive at other locations. This calls for policy action to ensure farmers are able to adapt to new crops that are best-suited to their region.
Different options were identified for the different market sectors to adapt to the changes that have already been observed and those that are still to be expected (Table 4). These options are, or should be, integrated in the different actors’ business plans to ensure the future viability of the sector.
The majority of people that we interviewed (producers and cooperative representatives and governmental representatives), already report effects of climate change on the different sub-sectors; the market and its actors are already adapting. In order to make changes in management practices at the field level systemic, it is important to work with extension systems and to enable them to react to the foreseen changes. New knowledge is required for this purpose and the rural advisory service needs to be equipped with new extension material. Traditional knowledge alone does not suffice. We therefore strongly recommend that, for interventions related to climate change in market systems, each step of the sub-sectors is carefully assessed, bearing in mind the different climatic regions and local variations. The precise methods would involve Steps 7 and 8 of the HELVETAS Swiss Intercooperation model (see above) and would involve all actors ranging across the agricultural market in Nepal. In a next step, we recommend applying the guideline to other regions and contexts especially in vulnerable countries where many communities are highly dependent on climate-sensitive sectors. By understanding how climate change impacts and will impact sub-sectors, preventative and pro-active measures can be chosen aiming at an increased climate resilience of vulnerable communities.
Acknowledgments
The authors thank HELVETAS Swiss Intercooperation Nepal and the Centre for Development and Environment of the University of Bern, Switzerland, for the funding and academic guidance.
Author Contributions
Barrueto executed the climatic analysis of the different regions in Nepal. Clot and Merz have had the lead in the conceptual development of the applied methodology in the second analysis with the support of Barrueto. Merz and Barrueto have applied the methodology in Nepal and gathered and analysed the results. Barrueto with the support of Merz has written the paper while Hammer advised the structure and overall content of this paper including revisions.
Conflicts of Interest
The authors declare no conflict of interest. The founding sponsors had no role in the design of the study; in the collection, analyses, or interpretation of data; in the writing of the manuscript, and in the decision to publish the results.
Appendix A

Table A1.
Description of climate and geospatial datasets.
| Description | Abbreviation | Source |
|---|---|---|
| WorldClim Version 1.4, bioclimatic variables: | Hijmans et al., 2005 | |
| Tmean | |
| Tmax | |
| Tmin | |
| Prec | |
| Coupled Model Intercomparison Project Phase 5 (CMIP-5) Earth System Models (n = 63) for 2035–2065 | ||
| RCP2.6 | |
| RCP4.5 | Zomer et al., 2014 |
| RCP6.0 | Zomer et al., 2015 |
| RCP8.5 | |
| Administrative boundaries | GoN 1988 |
References
- International Panel on Climate Change (IPCC). Climate Change 2014: Synthesis Report; Contribution of Working Groups I, II and III to the Fifth Assessment Report of the Intergovernmental Panel on Climate Change; IPCC: Geneva, Switzerland, 2014; ISBN 978-9-29-169143-2. [Google Scholar]
- Cioffi, F.; Conticello, F.; Lall, U.; Marotta, L.; Telesca, V. Large scale climate and rainfall seasonality in a Mediterranean Area: Insights from a non-homogenous Markov model applied to the Agro-Pontino plain. Hydrol. Process. 2015, 31, 668–686. [Google Scholar] [CrossRef]
- Wilby, R.L.; Dawson, C.W. The Statistical DownScaling Model: Insights from one decade of application. Int. J. Climatol. 2013, 33, 1707–1719. [Google Scholar] [CrossRef]
- Wheeler, D. Quantifying Vulnerability to Climate Change: Implications for Adaptation Assistance; Center for Global Development: Washington, DC, USA, 2001. [Google Scholar] [CrossRef]
- Kreft, S.; Eckstein, D.; Dorsch, L.; Fischer, L. Global Climate Risk Index 2016: Who Suffers Most from Extreme Weather Events? Weather-Related Loss Events in 2014 and 1995–2014. Briefing Paper. 2015. Available online: https://germanwatch.org/fr/download/13503.pdf (accessed on 21 August 2017).
- Kreft, S.; Eckstein, D.; Melchior, I. Global Climate Risk Index 2017: Who Suffers Most from Extreme Weather Events? Weather-Related Loss Events in 2015 and 1996–2015. Briefing Paper. 2016. Available online: http://germanwatch.org/en/download/16411.pdf (accessed on 21 August 2017).
- ND-GAIN [Notre Dame Global Adaptation Index]. Global Adaptation Index: Nepal. 2017. Available online: http://index.gain.org/country/nepal (accessed on 21 August 2017).
- Shrestha, A.B.; Wake, C.P.; Majewska, P.A.; Dib, J.E. Maximum Temperature Trends in the Himalaya and Its Vicinity: An Analysis Based on Temperature Records from Nepal for the Period 1971–1994. J. Clim. 1999, 12, 2775–2786. [Google Scholar] [CrossRef]
- Bhutiyani, M.R.; Kale, V.S.; Pawar, N.J. Climate change and the precipitation variations in the northwestern Himalaya: 1866–2006. Int. J. Climatol. 2010, 30, 535–548. [Google Scholar] [CrossRef]
- McSweeney, C.; Lizcano, G.; New, M.; Lu, X. The UNDP climate change country profiles: Improving the accessibility of observed and projected climate information for studies of climate change in developing countries. Bull. Am. Meteorol. Soc. 2010, 91, 157–166. [Google Scholar] [CrossRef]
- Bollasina, M.A.; Ming, Y.; Ramaswamy, V. Anthropogenic Aerosols and the Weakening of the South Asian Summer Monsoon. Science 2012, 334, 502–505. [Google Scholar] [CrossRef] [PubMed]
- Turner, A.G.; Annamalai, H. Climate change and the South Asian summer monsoon. Nat. Clim. Chang. 2012, 2, 587–595. [Google Scholar] [CrossRef]
- Singh, D.; Tsiang, M.; Rajaratnam, B.; Diffenbaugh, N.S. Observed changes in extreme wet and dry spells during the South Asian summer monsoon season. Nat. Clim. Chang. 2014, 4, 456–461. [Google Scholar] [CrossRef]
- Pokhrel, D.M.; Pandey, B. Climate Change Adaptation: Strategic Vision in Agriculture. J. Agric. Environ. 2011, 12, 104–112. [Google Scholar] [CrossRef]
- Karki, R.; Gurung, A. An Overview of Climate Change and Its Impact on Agriculture: A Review from Least Developing Country, Nepal. Int. J. Ecosyst. 2012, 2, 19–24. [Google Scholar] [CrossRef]
- Su, Y.; Lu, J.; Manandhar, S.; Ahmad, A.; Xu, J. Policy and Institutions in Adaptation to Climate Change. Case Study on Tree Crop Diversity in China, Nepal, and Pakistan. ICIMOD Working Paper 2013/3; International Centre for Integrated Mountain Development: Kathmandu, Nepal, 2013. [Google Scholar]
- Central Bureau of Statistics (CBS). National Population and Housing Census 2011: General and Social Characteristics Tables; National Report; CBS: Kathmandu, Nepal, 2012. [Google Scholar]
- Maharjan, K.L.; Joshi, N.P. Effect of Climate Variables on Yield of Major Food-Crops in Nepal: A Time-Series Analysis. Clim. Chang. Agric. Rural Livelihood 2013, 127–137. [Google Scholar] [CrossRef] [Green Version]
- Poudel, S.; Kotani, K. Climatic impacts on crop yield and its variability in Nepal: Do they vary across seasons and altitudes? Clim. Chang. 2013, 116, 327–355. [Google Scholar] [CrossRef]
- Ranjitkar, S.; Sujakhu, N.M.; Merz, J.; Kindt, R.; Xu, J.; Matin, M.A.; Ali, M.; Zomer, R.J. Suitability Analysis and Projected Climate Change Impact on Banana and Coffee Production Zones in Nepal. PLoS ONE 2016, 11, 18. [Google Scholar] [CrossRef] [PubMed]
- Barrueto, A.K.; Merz, J.; Hodel, E.; Eckert, S. The suitability of Macadamia and Juglans for cultivation in Nepal: An assessment based on spatial probability modelling using climate scenarios and in situ data. Reg. Environ. Chang. 2017. [Google Scholar] [CrossRef]
- Malla, G. Climate Change and Its Impact on Nepalese Agriculture. J. Agric. Environ. 2008, 9, 62–71. [Google Scholar] [CrossRef]
- International Panel on Climate Change (IPCC). Climate Change 2007: Impacts, Adaptation and Vulnerability; Contribution of Working Group II to the Fourth Assessment Report of the Intergovernmental Panel on Climate Change; Cambridge University Press: Cambridge, UK, 2007; p. 976. ISBN 978-0-52-170597-4. [Google Scholar]
- Mendelsohn, R.; Morrison, W.; Schlesinger, M.E.; Andronova, N.G. Country-Specific Market Impacts of Climate Change. Clim. Chang. 2000, 45, 553–569. [Google Scholar] [CrossRef]
- Lobell, D.B.; Burke, M.B.; Tebaldi, C.; Mastrandrea, M.D.; Falcon, W.P.; Naylor, R.L. Prioritizing Climate Adaptation Needs for Food Security in 2030. Science 2008, 319, 607–610. [Google Scholar] [CrossRef] [PubMed]
- Hertel, T.W.; Rosch, S.D. Climate change, agriculture, and poverty. Appl. Econ. Perspect. Policy 2010, 32, 355–385. [Google Scholar] [CrossRef]
- Avnery, S.; Mauzerall, D.L.; Liu, J.; Horowitz, L.W. Global crop yield reductions due to surface ozone exposure: 1. Year 2000 crop production losses and economic damage. Atmos. Environ. 2011, 45, 2284–2296. [Google Scholar] [CrossRef]
- Vermeulen, S.J.; Campbell, B.M.; Ingram, J.S.I. Climate Change and Food Systems. Annu. Rev. Environ. Resour. 2012, 37, 195–222. [Google Scholar] [CrossRef]
- Tai, A.P.K.; Val Martin, M.; Heald, C.L. Threat to future global food security from climate change and ozone air pollution. Nat. Clim. Chang. 2014, 4, 817–821. [Google Scholar] [CrossRef]
- Berkhout, F.; Hertin, J.; Jordan, A. Socio-economic futures in climate change impact assessment: Using scenarios as ‘learning machines’. Glob. Environ. Chang. 2002, 12, 83–95. [Google Scholar] [CrossRef]
- Koetse, M.J.; Rietveld, P. The impact of climate change and weather on transport: An overview of empirical findings. Transp. Res. Part D 2009, 14, 205–211. [Google Scholar] [CrossRef]
- Winn, M.I.; Kirchgeorg, M.; Griffiths, A.; Linnenluecke, M.K.; Günther, E. Impacts from climate change on organizations: A conceptual foundation. Bus. Strategy Environ. 2011, 20, 157–173. [Google Scholar] [CrossRef]
- Qiao, Y.; Dawson, A.R.; Parry, T.; Flintsch, G.W. Evaluating the effects of climate change on road maintenance intervention strategies and Life-Cycle Costs. Transp. Res. Part D 2015, 41, 492–503. [Google Scholar] [CrossRef]
- Picketts, I.M.; Andrey, J.; Matthews, L.; Déry, S.J.; Tighe, S. Climate change adaptation strategies for transportation infrastructure in Prince George, Canada. Reg. Environ. Chang. 2016, 16, 1109–1120. [Google Scholar] [CrossRef]
- Helvetas Swiss Intercooperation. Guideline—Assessing Climate Risks and Vulnerabilities in Market Systems; Helvetas Swiss Intercooperation: Zurich, Switzerland, 2017. [Google Scholar]
- Hijmans, R.J.; Cameron, S.E.; Parra, J.L.; Jones, P.G.; Jarvis, A. Very high resolution interpolated climate surfaces for global land areas. Int. J. Climatol. 2005, 25, 1965–1978. [Google Scholar] [CrossRef]
- Van Vuuren, D.P.; Edmonds, J.; Kainuma, M.; Riahi, K.; Thomson, A.; Hibbard, K.; Hurtt, G.C.; Kram, T.; Krey, V.; Lamarque, J.F.; et al. The representative concentration pathways: An overview. Clim. Chang. 2011, 109, 5–31. [Google Scholar] [CrossRef]
- Van Vuuren, D.P.; Stehfest, E.; Elzen, M.G.; Kram, T.; Vliet, J.; Deetman, S.; Isaac, M.; Goldewijk, K.K.; Hof, A.; Beltran, A.M.; et al. RCP2.6: Exploring the possibility to keep global mean temperature increase below 2 °C. Clim. Chang. 2011, 109, 95–116. [Google Scholar] [CrossRef]
- Masui, T.; Matsumoto, K.; Hijioka, Y.; Kinoshita, T.; Nozawa, T.; Ishiwatari, S.; Kato, E.; Shukla, P.R.; Yamagata, Y.; Kainuma, M. An emission pathway for stabilization at 6 Wm-2 radiative forcing. Clim. Chang. 2011, 109, 59–76. [Google Scholar] [CrossRef]
- Thomson, A.M.; Calvin, K.V.; Smith, S.J.; Kyle, G.P.; Volke, A.; Patel, P.; Delgado-Arias, S.; Bond-Lamberty, B.; Wise, M.A.; Clarke, L.E.; et al. RCP4.5: A pathway for stabilization of radiative forcing by 2100. Clim. Chang. 2011, 109, 77–94. [Google Scholar] [CrossRef]
- Riahi, K.; Rao, S.; Krey, V.; Cho, C.; Chirkov, V.; Fischer, G.; Kindermann, G.; Nakicenovic, N.; Rafaj, P. RCP 8.5-A scenario of comparatively high greenhouse gas emissions. Clim. Chang. 2011, 109, 33–57. [Google Scholar] [CrossRef]
- Zomer, R.J.; Trabucco, A.; Wang, M.; Lang, R.; Chen, H.; Metzger, M.J.; Smajgl, A.; Beckschäfer, P.; Xu, J. Environmental stratification to model climate change impacts on biodiversity and rubber production in Xishuangbanna, Yunnan, China. Biol. Conserv. 2014, 170, 264–273. [Google Scholar] [CrossRef]
- Zomer, R.J.; Xu, J.; Wang, M.; Trabucco, A.; Li, Z. Projected impact of climate change on the effectiveness of the existing protected area network for biodiversity conservation within Yunnan Province, China. Biol. Conserv. 2015, 184, 335–345. [Google Scholar] [CrossRef]
- Government of Nepal (GoN). Administrative Boundaries; Government of Nepal, Ministry of Land Reform and Management, Department of Survey: Kathmandu, Nepal, 1988.
- The Springfield Centre. The Operational Guide for the Making Markets Work for the Poor (M4P) Approach, 2nd ed.; Swiss Agency for Development and Cooperation (SDC): Bern, Switzerland; UK Department for International Development (DFID): London, UK, 2014; p. 57. [Google Scholar]
- International Panel on Climate Change (IPCC). Managing the Risks of Extreme Events and Disasters to Advance Climate Change Adaptation. A Special Report of Working Groups I and II of the Intergovernmental Panel on Climate Change; Cambridge University Press: Cambridge, UK; New York, NY, USA, 2012; p. 582. ISBN 978-1-10-702506-6. [Google Scholar]
- Organisation for Economic Cooperation and Development (OECD). Integrating Climate Change Adaptation into Development Co-Operation: Policy Guidance; OECD: Paris, France, 2009. [Google Scholar] [CrossRef]
- Swiss Agency for Development and Cooperation (SDC). A Synthesis of the Making Market Work for the Poor (M4P) Approach; SDC: Bern, Switzerland, 2008. [Google Scholar]
- The International Institute for Sustainable Development (IISD); International Union for Conservation of Nature (IUCN); Stockholm Environment Institute (SEI); HELVETAS Swiss Intercooperation. CRiSTAL User’s Manual Version 5, Community-Based Risk Screening Tool—Adaptation and Livelihoods; IISD: Winnipeg, MB, Canada, 2012. [Google Scholar]
- United Nations Environment Programme (UNEP). PROVIA Guidance on Assessing Vulnerability, Impacts and Adaptation to Climate Change; Consultation Document; United Nations Environment Programme: Nairobi, Kenya, 2013; ISBN 978-9-28-073335-8. [Google Scholar]
- Integrated Research on Disaster Risk (IRDR). Peril Classification and Hazard Glossary. IRDR Data Publication 1; Integrated Research on Disaster Risk: Beijing, China, 2014. [Google Scholar]
- Swiss Agency for Development and Cooperation (SDC). CEDRIG—Climate, Environment and Disaster Risk Reduction Integration Guidance; SDC: Bern, Switzerland, 2012. [Google Scholar]
- Ranjitkar, S.; Sujakhu, N.; Budhamagar, K.; Rimal, S.; Xu, J.; Merz, J.; Zomer, R.J. Projected Climate Change Impacts on Climatic Suitability and Geographical Distribution of Banana and Coffee Plantations in Nepal; World Agroforestry Center (ICRAF): Nairobi, Kenya, 2015. [Google Scholar] [CrossRef]
- Taylor, K.E.; Stouffer, R.J.; Meehl, G.A. An Overview of CMIP5 and the Experiment Design. Bull. Am. Meteorol. Soc. 2012, 93, 485–498. [Google Scholar] [CrossRef]
- Glotter, M.; Elliott, J.; McInerney, D.; Best, N.; Forster, I.; Moyer, E.J. Evaluating the utility of dynamical downscaling in agricultural impacts projections. Proc. Natl. Acad. Sci. USA 2014, 111, 8776–8781. [Google Scholar] [CrossRef] [PubMed]
- Jang, S.; Kavvas, M.L.; Ishida, K.; Trinh, T.; Ohara, N.; Kure, S.; Chen, Z.Q.; Anderson, M.L.; Matanga, G.; Carr, K.J. A Performance Evaluation of Dynamical Downscaling of Precipitation over Northern California. Sustainability 2017, 9, 1457. [Google Scholar] [CrossRef]
- Sigdel, M.; Ma, Y. Evaluation of future precipitation scenario using statistical downscaling model over humid, subhumid, and arid region of Nepal—A case Study. Theor. Appl. Climatol. 2017, 123, 453–460. [Google Scholar] [CrossRef]
- Bharati, L.; Gurung, P.; Maharajan, L.; Bhattarai, U. Past and future variability in the hydrological regime of the Koshi Basin, Nepal. Hydrol. Sci. J. 2016, 61, 79–93. [Google Scholar] [CrossRef]
- Sustainable Soil Management Programme (SSMP). Climate Change in the Mid Hills of Nepal—Fact or Fiction? … From a farmer’s Perspective; SSMP: Kathmandu, Nepal, 2010. [Google Scholar]
- Sujakhu, N.M.; Ranjitkar, S.; Niraula, R.R.; Pokharel, B.K.; Schmidt-Vogt, D.; Xu, J. Farmers’ Perceptions of and Adaptations to Changing Climate in the Melamchi Valley of Nepal. Mt. Res. Dev. 2015, 36, 15–30. [Google Scholar] [CrossRef]
- Barrueto, A.K.; Merz, J.; Kohler, T.; Hammer, T. What prompts agricultural innovation in rural Nepal: A study using the example of macadamia and walnut trees as novel cash crops. Sustainability 2017, in press. [Google Scholar] [CrossRef]
- ActionAid. Climate Change Impacts and Adaptation Strategies by Poor and Excluded Communities in Western Nepal: A Comprehensive Study of Banganga River Basin: Arghakhanchi and Kapilvastu, Nepal; National Disaster Risk-Reduction Centre: Kathmandu, Nepal, 2007. [Google Scholar]
- Karki, R.; Ul Hasson, S.; Schickhoff, U.; Scholten, T.; Böhner, J. Rising Precipitation Extremes across Nepal. Climate 2017, 5, 25. [Google Scholar] [CrossRef]
- Poudel, D.D.; Duex, T.W. Vanishing Springs in Nepalese Mountains: Assessment of Water Sources, Farmers’ Perceptions, and Climate Change Adaptation. Mt. Res. Dev. 2017, 37, 35–46. [Google Scholar] [CrossRef]
- Shrestha, A.B.; Bajracharya, S.R.; Sharma, A.R.; Duo, C.; Kulkarni, A. Observed trends and changes in daily temperature and precipitation extremes over the Koshi river basin 1975–2010. Int. J. Climatol. 2016, 37, 1066–1083. [Google Scholar] [CrossRef]
- International Panel on Climate Change (IPCC). Climate Change 2014: Impacts, Adaptation, and Vulnerability. Part A: Global and Sectoral Aspects; Contribution of Working Group II to the Fifth Assessment Report of the Intergovernmental Panel on Climate Change; Cambridge University Press: Cambridge, UK; New York, NY, USA, 2014; p. 1131. ISBN 978-1-10-705807-1. [Google Scholar]
Figure 1.
Overview of sub-sectors, climate regions and elevations and zones.
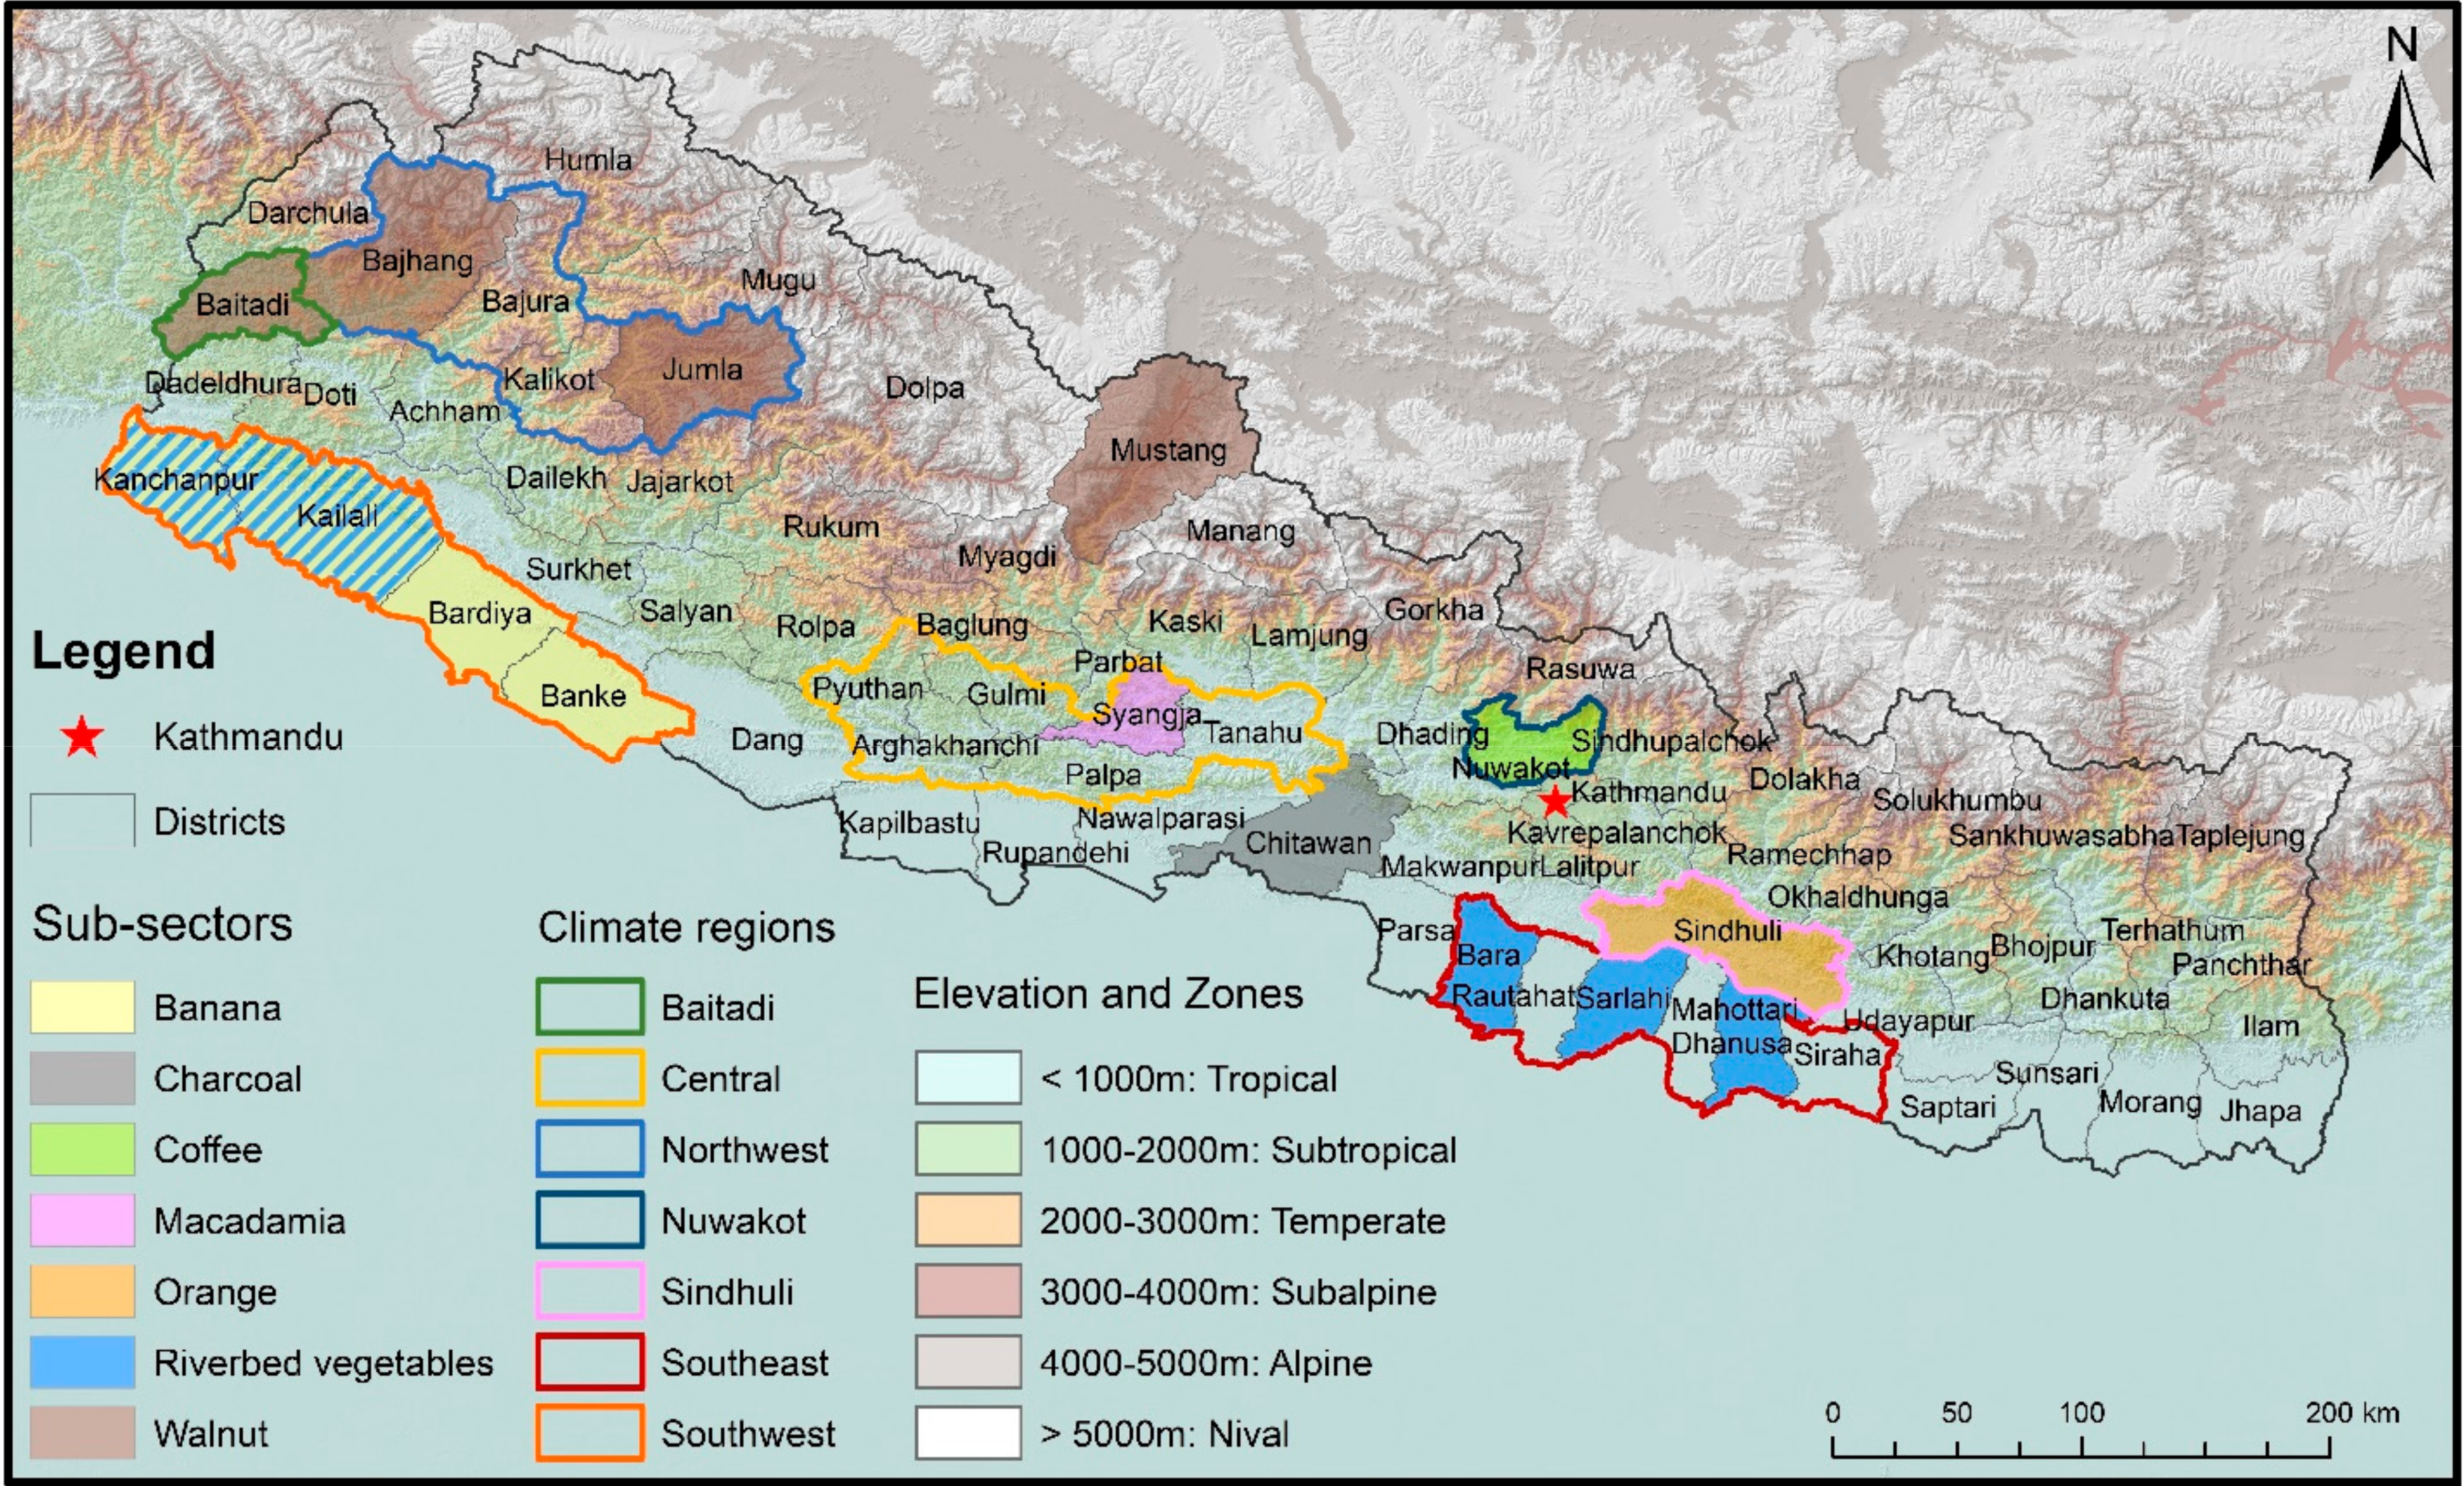
Figure 2.
8-step approach towards climate risk resilient sub-sectors [35].
Figure 2.
8-step approach towards climate risk resilient sub-sectors [35].
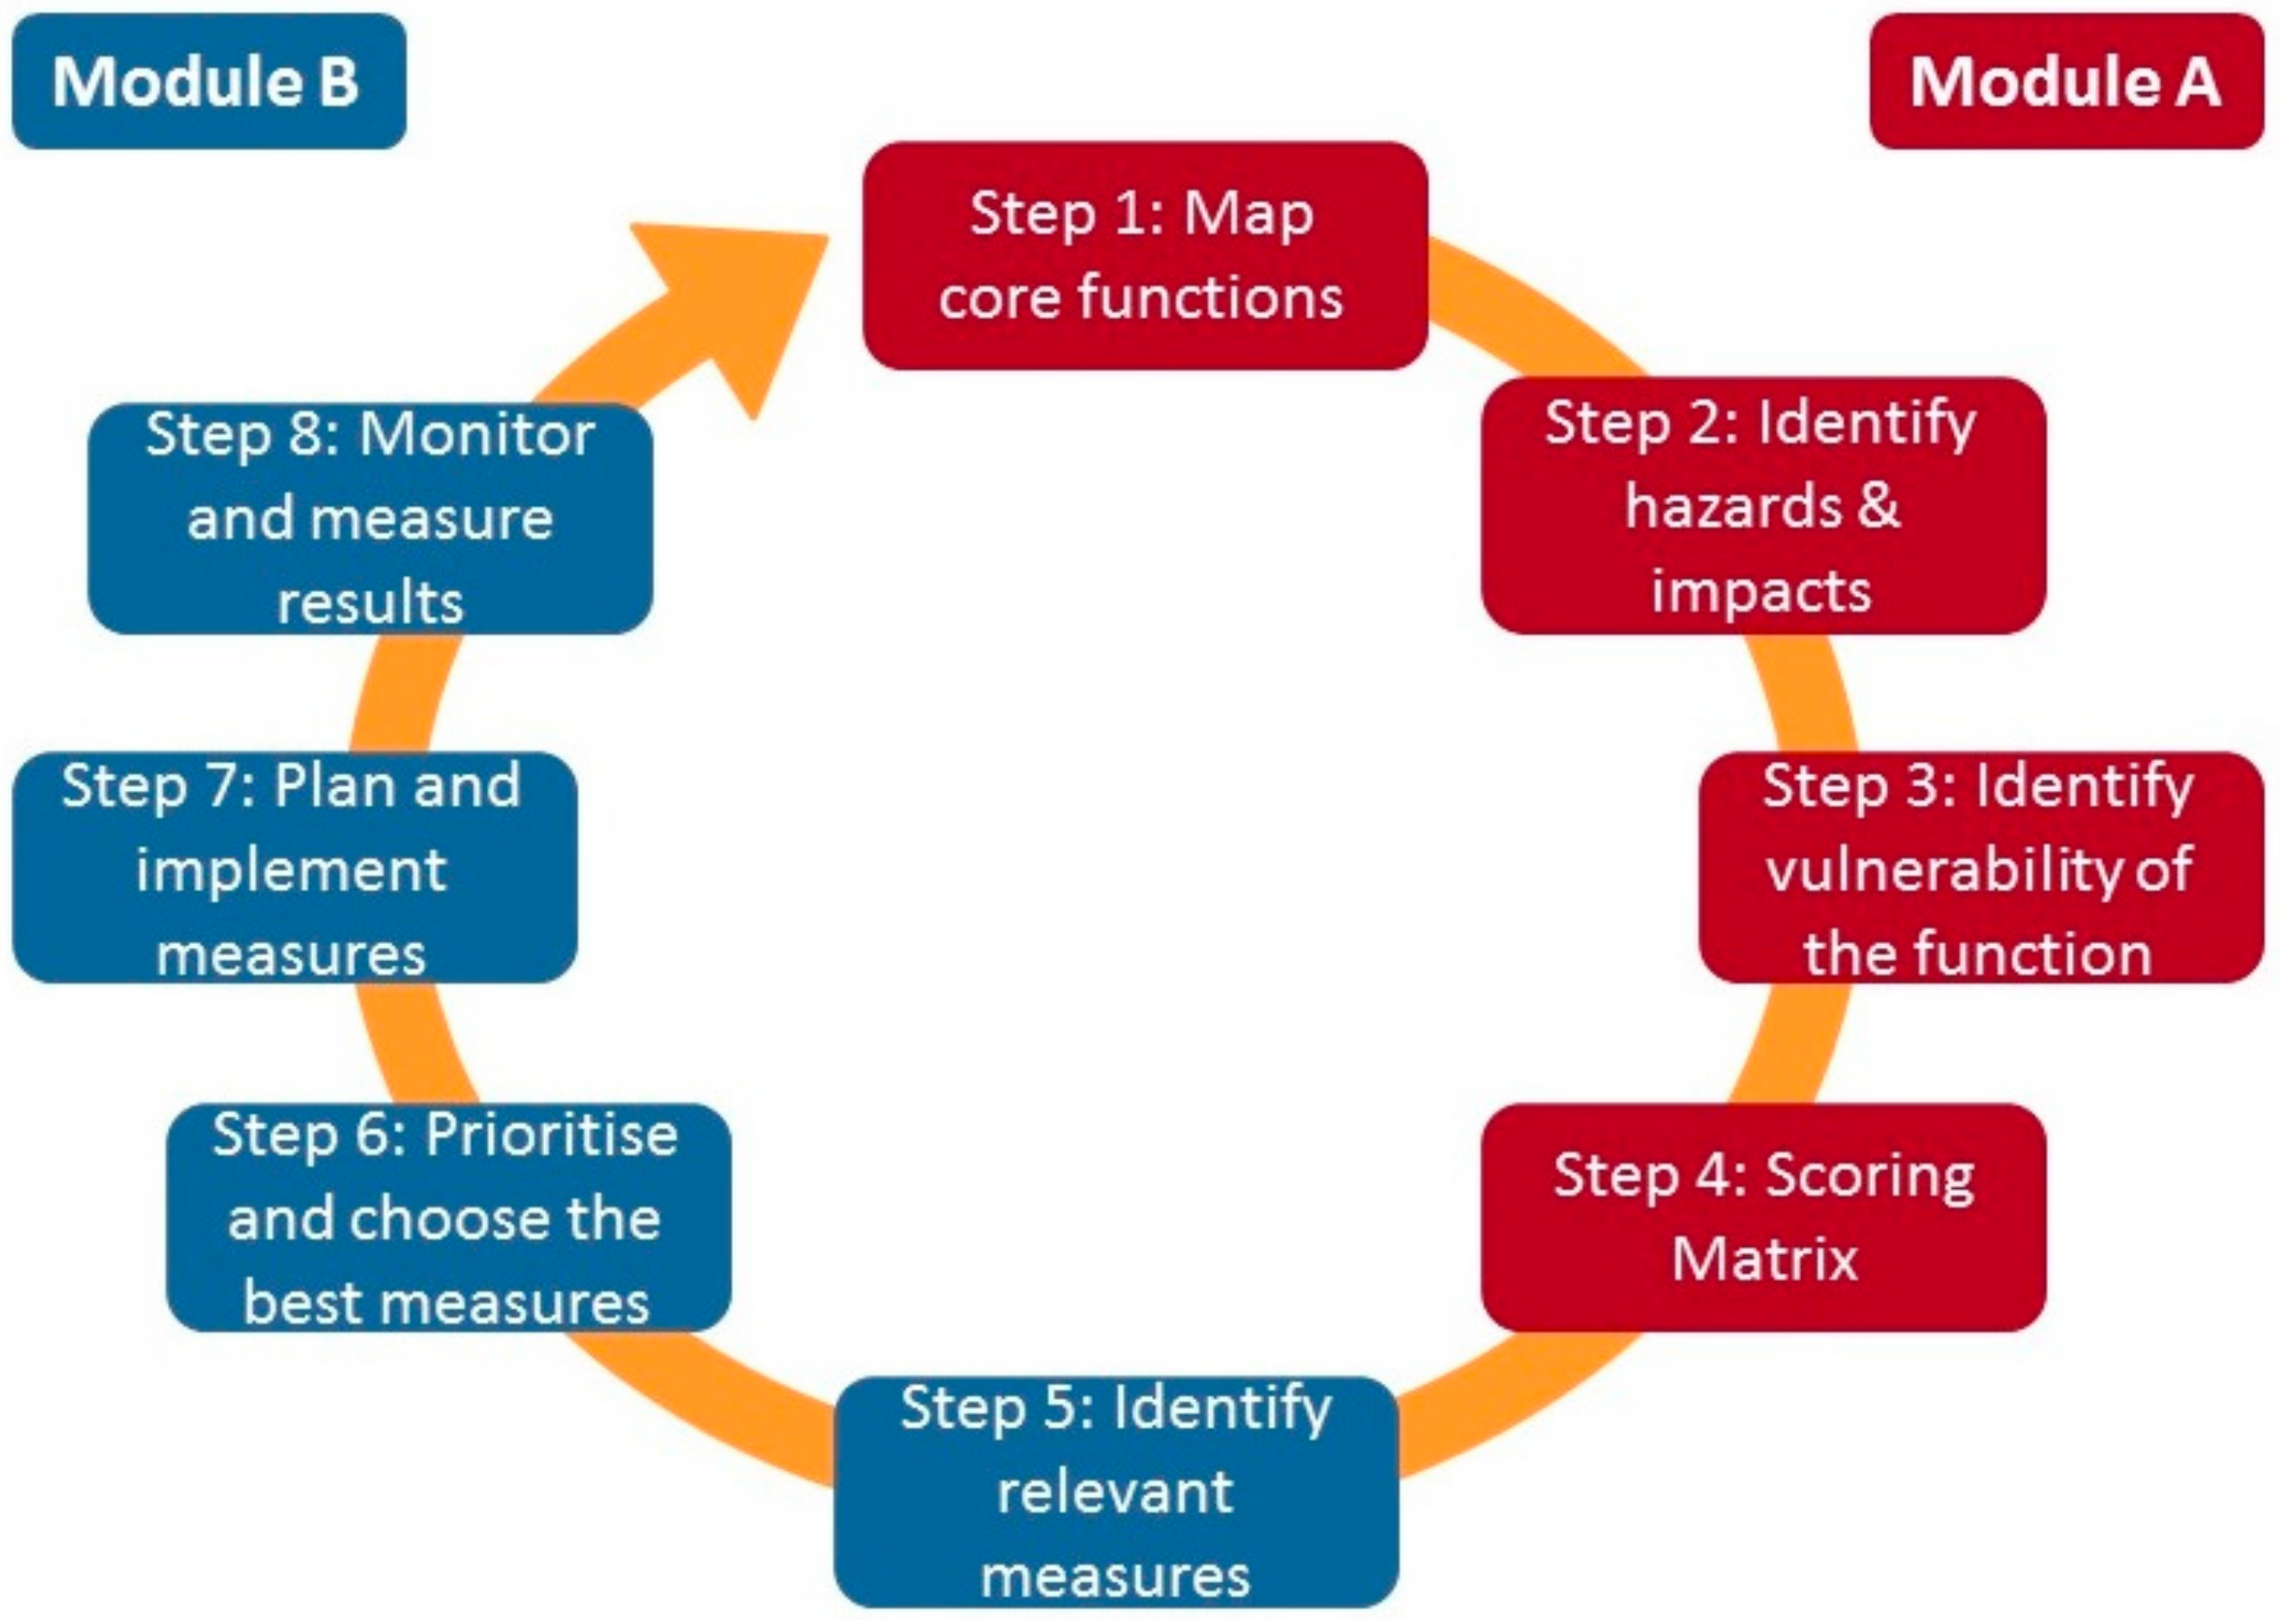
Figure 3.
Depicted changes of climate and precipitation (input Table 1).
Figure 3.
Depicted changes of climate and precipitation (input Table 1).
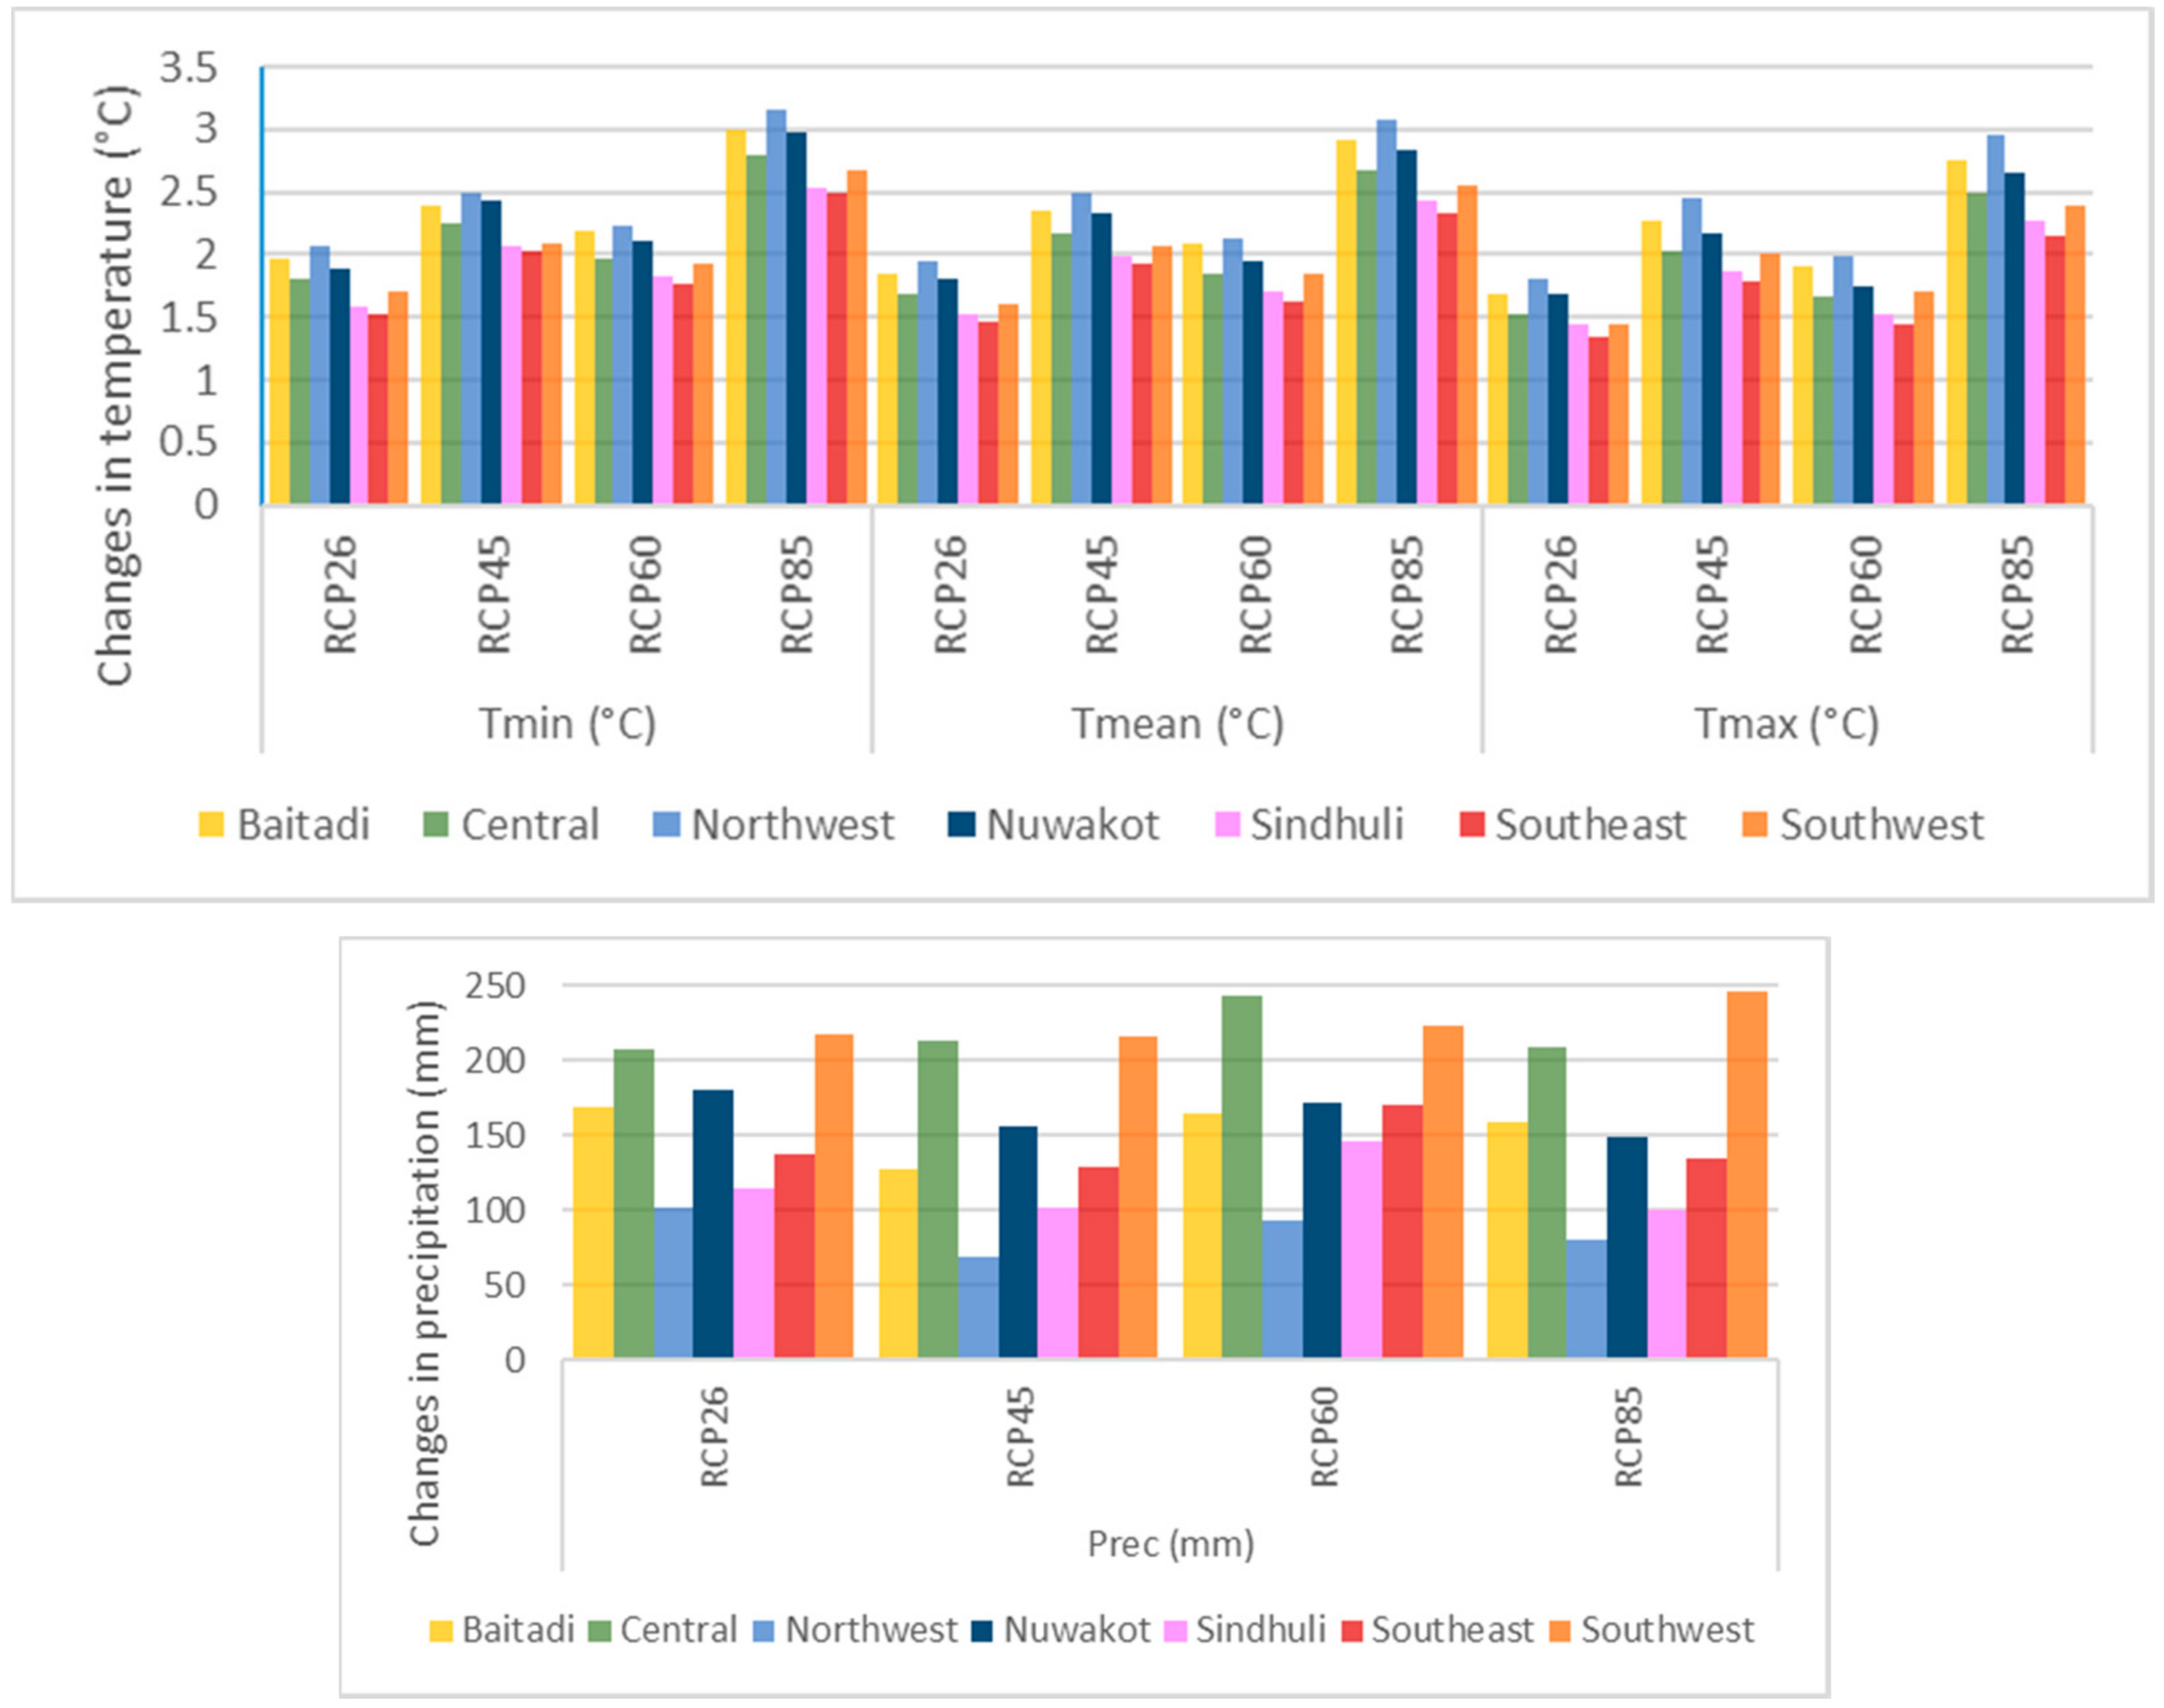
Table 1.
Current and projected temperature and precipitation in the selected geographical regions.
| Tmin (°C) | Tmean (°C) | Tmax (°C) | Prec (mm) | |||||||||||||||||
|---|---|---|---|---|---|---|---|---|---|---|---|---|---|---|---|---|---|---|---|---|
| 2000 | RCP2.6 | RCP4.5 | RCP6.0 | RCP8.5 | 2000 | RCP2.6 | RCP4.5 | RCP6.0 | RCP8.5 | 2000 | RCP2.6 | RCP4.5 | RCP6.0 | RCP8.5 | 2000 | RCP2.6 | RCP4.5 | RCP6.0 | RCP8.5 | |
| Baitadi | 12.0 | 13.9 | 14.4 | 14.2 | 15.0 | 17.3 | 19.1 | 19.6 | 19.3 | 20.2 | 22.6 | 24.3 | 24.8 | 24.5 | 25.3 | 1550 | 1719 | 1677 | 1715 | 1709 |
| Central | 14.0 | 15.8 | 16.2 | 15.9 | 16.8 | 19.6 | 21.3 | 21.7 | 21.4 | 22.2 | 25.2 | 26.7 | 27.3 | 26.9 | 27.7 | 1931 | 2138 | 2144 | 2173 | 2140 |
| Northwest | 3.5 | 5.5 | 6.0 | 5.7 | 6.6 | 8.6 | 10.6 | 11.1 | 10.8 | 11.7 | 13.9 | 15.7 | 16.3 | 15.8 | 16.8 | 962 | 1063 | 1030 | 1054 | 1041 |
| Nuwakot | 12.2 | 14.1 | 14.7 | 14.3 | 15.2 | 17.8 | 19.6 | 20.1 | 19.7 | 20.6 | 23.3 | 25.0 | 25.5 | 25.1 | 26.0 | 1818 | 1998 | 1974 | 1989 | 1966 |
| Sindhuli | 15.4 | 17.0 | 17.5 | 17.2 | 18.0 | 21.0 | 22.5 | 23.0 | 22.7 | 23.4 | 26.6 | 28.1 | 28.5 | 28.2 | 28.9 | 1472 | 1587 | 1573 | 1617 | 1573 |
| Southeast | 18.4 | 19.9 | 20.4 | 20.1 | 20.8 | 24.1 | 25.6 | 26.1 | 25.8 | 26.5 | 30.0 | 31.3 | 31.8 | 31.4 | 32.1 | 1543 | 1680 | 1672 | 1713 | 1678 |
| Southwest | 17.6 | 19.3 | 19.7 | 19.5 | 20.3 | 23.6 | 25.2 | 25.7 | 25.4 | 26.2 | 29.7 | 31.1 | 31.7 | 31.4 | 32.1 | 1603 | 1821 | 1820 | 1827 | 1849 |
Table 2.
Perceived disasters in different sectors.
| Disaster | Banana | Charcoal | Coffee | Macadamia | Orange | Riverbed Vegetables | Walnut | ||
|---|---|---|---|---|---|---|---|---|---|
| Meteorological | Changing temperature | Increase | X | X | X | X | X | ||
| Diurnal variation | X | ||||||||
| Seasonal variation | X | X | X | ||||||
| Changing precipitation | Decrease | X | X | X | X | ||||
| Seasonal variation | X | ||||||||
| Changing humidity | Increase | X | |||||||
| Storm | Hail | X | X | X | |||||
| Wind | X | X | X | X | X | ||||
| Hydrological | Flood | X | |||||||
| Climatological | Drought | X | X | X | X | X | |||
| Wildfire | Forest fire | X | |||||||
| Biological | Epidemic | Viral disease | X | ||||||
| Fungal disease | X | X | X | X | |||||
| Insect infestation | X | X | X | X | X | ||||
Table 3.
Market functions and climate risks (− negative influence, + positive influence on the product).
Table 3.
Market functions and climate risks (− negative influence, + positive influence on the product).
| Market Functions | Climate Risk Impact | Relevant Climate Risks | Remarks on Impacts | |
|---|---|---|---|---|
| Core | Production | Overall mostly reduced productivity (−) | Temporal shift of wind storms | Changing yields per plant (−/+) |
| Increased losses from post-harvest losses and damage (−) | Less rainfall and water table reduced | Increased mortality of plants (−) | ||
| Crop production possible in new locations (at higher elevations) (+) | Increasing diurnal variation | Lower quality (−) | ||
| Changing seasonal temperature | Increased cost of production due to cost of insurance, need for irrigation and losses (−) | |||
| Increasing temperature | Production zones moving to new areas, particularly altitudinal shifts, conflict with natural vegetation (+/−) | |||
| Processing | Changes in processing timing (+/−) | Changes in fog pattern | Changes in productivity and quality (+/−) | |
| Increased temperature | ||||
| Changes in process management practices (+/−) | Risk of fire | |||
| Trading/ storage | Increased post-harvest and storage losses (-) | Changing seasonal temperature (heat) | Financial losses by traders and retailers (+/−) | |
| Increased humidity | ||||
| Sales | Temporal shift of production (+/−) | Increased temperature | Changes in consumption patterns (+/−) | |
| Reduced requirements of the products (−) | Shift in risk patterns | |||
| Support | Sapling supply | Increased sapling mortality (−) | Changing diurnal variation | Reduced availability of saplings (−) |
| Sapling production possible at other locations (e.g., higher elevation) (+/−) | ||||
| Changes in management practices (+/−) | Changing seasonal temperature | Shift of plantation season (+/−) | ||
| Research | Demand of new varieties and new management practices (+/−) | All risks | Increased costs (−) | |
| Availability of resistant and adapted material at required quantities (−) | ||||
| Crop insurance | Productivity losses (−) | Damage from wind and storm | Production cost increased (−) | |
| Increased fungal and bacterial diseases due to diurnal variation and changing seasonal temperature | ||||
| Rules | Agriculture policy | Need for new standards and quality control (+/−) | Increasing temperature | Changes in quality (+/−) |
| Crop production possible in new locations (at higher elevations) (+/−) | Increased disease and post occurrence | Production zones moving to new areas, particularly altitudinal shifts (+/−) | ||
Table 4.
Adaptation to climate change and disaster risk management measures (Suggestions regarding coffee originate in an earlier report [35]).
Table 4.
Adaptation to climate change and disaster risk management measures (Suggestions regarding coffee originate in an earlier report [35]).
| Banana |
|
| Charcoal |
|
| Coffee |
|
| Macadamia |
|
| Orange |
|
| Riverbed vegetables |
|
| Walnut |
|
© 2017 by the authors. Licensee MDPI, Basel, Switzerland. This article is an open access article distributed under the terms and conditions of the Creative Commons Attribution (CC BY) license (http://creativecommons.org/licenses/by/4.0/).
Share and Cite
MDPI and ACS Style
Barrueto, A.K.; Merz, J.; Clot, N.; Hammer, T. Climate Changes and Their Impact on Agricultural Market Systems: Examples from Nepal. Sustainability 2017, 9, 2207. https://doi.org/10.3390/su9122207
AMA Style
Barrueto AK, Merz J, Clot N, Hammer T. Climate Changes and Their Impact on Agricultural Market Systems: Examples from Nepal. Sustainability. 2017; 9(12):2207. https://doi.org/10.3390/su9122207
Chicago/Turabian StyleBarrueto, Andrea Karin, Juerg Merz, Nicole Clot, and Thomas Hammer. 2017. "Climate Changes and Their Impact on Agricultural Market Systems: Examples from Nepal" Sustainability 9, no. 12: 2207. https://doi.org/10.3390/su9122207
Note that from the first issue of 2016, this journal uses article numbers instead of page numbers. See further details here.