Article

A Road to Sustainable Development of Chinese Cities: A Perception of Improving Urban Management Efficiency Based on Two-Level Production Factors

1
School of Land Science and Technology, China University of Geosciences (Beijing), Beijing 100083, China
2
Key Laboratory of Land Consolidation and Rehabilitation, Ministry of Land and Resources, Beijing 100083, China
*
Author to whom correspondence should be addressed.
Sustainability 2017, 9(12), 2212; https://doi.org/10.3390/su9122212
Submission received: 7 November 2017 / Revised: 27 November 2017 / Accepted: 28 November 2017 / Published: 30 November 2017

Abstract

:
It is an inevitable requirement of regional governance and sustainable development to improve urban management efficiency (UME). Different from the previous studies, this paper gives it a new meaning based on the production factors theories. Then the paper analyzes the response of UME to the primary production factors (PPFs) characterized by the traditional production factors theory (land, labor, and capital), and the expanded production factors (EPFs) reflected by the modern production factors theory (energy and ecology). By analyzing UME in China’s 334 cities on global and local scales, this paper found four characteristics of UME: (1) the striking spatial differences; (2) the strong correlation between management models; (3) the evident development emphasis; and (4) the weak matching linkage. Finally, we put forward the countermeasures of spatial governance, including strengthening the agglomeration effect, promoting diversified development models on different scales, and accelerating resource coordination and sharing.

1. Introduction

Improving the quality of urbanization has attracted a worldwide attention among scholars, organizations, and governments [1,2,3]. For a long time, the relevant studies mainly focus on two points: one is to explore the optimal city size [4,5,6], and the other is to improve urban management efficiency (UME) [7]. Specifically, there are three types of city sizes, including large [8,9], medium [10], and small [11,12,13,14,15]. Actually, each city has its own strengths and weaknesses, and any city, hereby, cannot be managed by the uniform theories and methodologies [16,17,18,19]. In other words, the city size is a superficial phenomenon, while the key point is to improve UME of different cities.
Nowadays, the study of UME is gradually being improved and embodied by its concept, theory, and method. Previous studies have not yet reached an agreement on the connotation. Only relevant concepts can be traced to resource efficiency [20], eco-efficiency [21,22,23], labor efficiency [24,25], and socio-economic efficiency [26,27,28]. Further, the connotation has been expanded to the efficiency of urban public transport systems and industries [29,30,31,32]. Clearly, these definitions above only explain UME in a certain way. With time, the idea of equating city efficiency with GDP growth has been criticized as not adequately capturing human welfare and progress [33], but a variety of urban functions are reflected in the economic, social, and ecological aspects [34]. Thus, the debate on UME has been expanded from traditional economic and social considerations to environmental and energy considerations [35,36,37].
The definition of UME is multi-sourced, which means that its theories and methods are different. To our knowledge, many theories are claimed, such as labor theory, value theory, function theory, and input-output theory. Labor theory takes worker’s output as the UME [24], while function theory shows that the UME is a reflection of the function and the urban growth share is divided into two parts (functional structure share and efficiency share). The calculation method is a shift-share analysis (SSA) which studies the UME through the analysis of the industrial structure. The SSA is a method of explaining the causes of economic growth and recession by decomposing economic changes into three components, including the share component, the structural deviation component and the competitive deviation component [38]. Input-output theory uses productivity to measure the UME and has developed the data envelopment analysis (DEA) [39,40,41,42] and the stochastic frontier analysis (SFA). The DEA is a nonparametric statistical method based on the concept of relative efficiency and is used to evaluate whether a multi-input, multi-output decision-making unit of the same type is technically valid [43,44]. It has the advantages of simple operation, less error, objective analysis, etc. The DEA does not allow for measurement error or random shocks [45], but the SFA can overcome the above shortcomings [46,47]. The SFA is a parameter method to estimate the efficiency through the stochastic frontier production function. The technical efficiency of the decision-making unit is estimated by decomposing the error term. The greatest merit of SFA is that it considers the influence of stochastic factors on output. Regrettably, most of these models/studies ignore energy consumption and environmental externality. However, the energy and environmental considerations have been substantially involved in the process and decision-making of managing a city.
As mentioned above, the current knowledge gaps are as follows: (1) there is no clear definition of UME at present; (2) the existing studies have yielded many achievements in terms of technical efficiency, labor efficiency, and energy efficiency, and that the efficiency of one or several production factors lack a systematic study of the production factors; (3) few scholars choose the urban system as the object to carry out the theoretical and empirical research on the evaluation of UME and spatial analysis, e.g., the city-level GDP data is unpopular in most countries [48] and there is a deficiency in comparatively measuring UME that the sustainability—characterized by environmental consideration and energy consumption—is seldom involved in this process. However, the green performance of a city—friendly environment or high energy utilization efficiency, or both—has been gradually integrated into judging the sustainability of a city in China [49,50]. Hence, this paper attempts to give a scientific and accurate concept of UME: it is based on the traditional and modern theories of production factors, and most effectively coordinates and shares the factors of production to meet the sustainable development of a city. On that, we try to judge the UME by a two-level perception of resource coordination and sharing, and introduce a multi-dimensional comparison of 334 Chinese cities as an entire study case from the primary production factors (PPFs) enlarged to the expanded production factors (EPFs). The PPFs represent the land, capital, and labor in traditional economics [51], and the EPFs represent the technology and management in modern economics [52,53]. The study is expected to answer the questions: (1) what is the spatial distribution of UME in China? (2) How do they (PPFs and EPFs) affect UME? (3) Which policies can be employed to improve UME?
To fill the gaps above, the following work has been conducted. The first aim is to supplement the relevant data at the city-level, covering land, population, capital, management, and technology. The second is the innovation of research ideas. Based on the traditional and modern theories of production factors, this article analyzes the UME from two levels of PPFs and EPFs. The third is to improve the policy recommendations. We propose the ways to improve the UME from a multi-angle perspective and consider it more comprehensively.

2. Materials and Methods

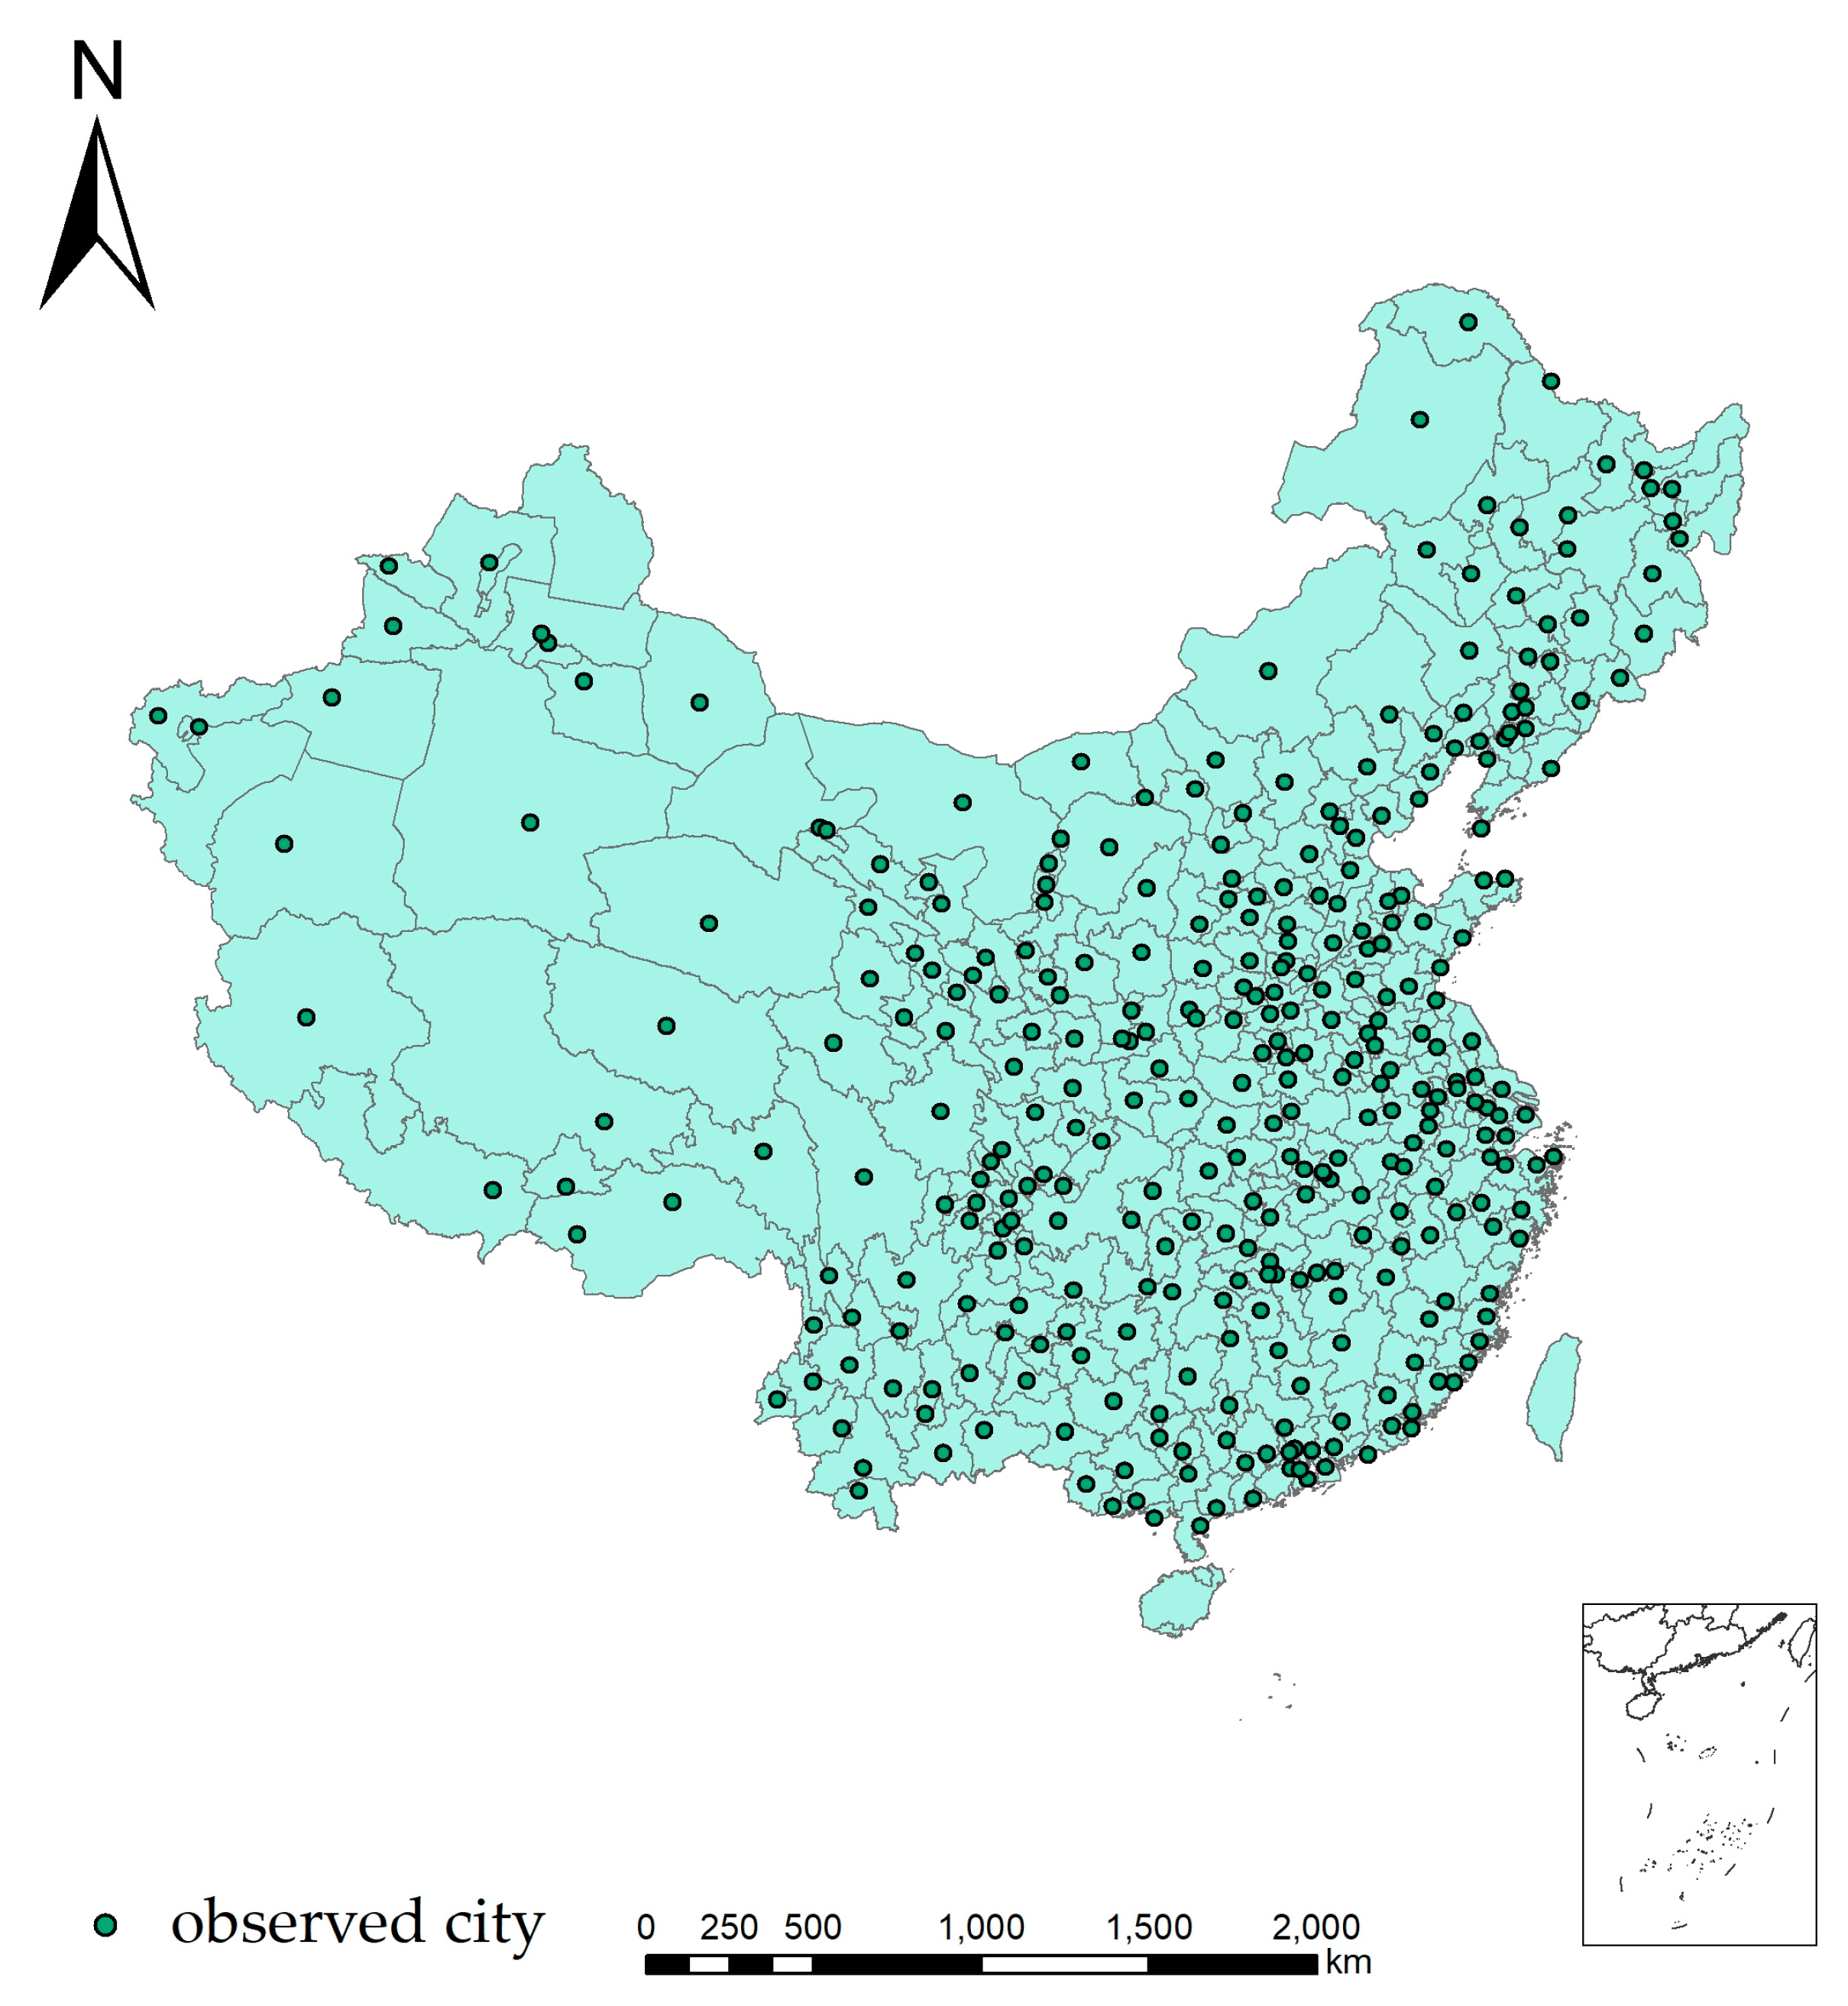
2.1. Description of the Study Area and Data Foundation

Our study focuses on the entirety of China. It lies between 4–54° N and 73–135° E and is covered by highlands and deserts in the middle and western parts and plains in the eastern part, with a significant variation across its vast width. In the east, there are densely-populated and infrastructure-improved cities, and well-drained land. The western part of China has marginal agro-environmental conditions for agriculture and less densely populated cities. In our study, 334 prefecture-level cities, a majority of key cities in China, are the direct objects for involvement in the comparison process (Figure 1).
The smallest city is Sansha City in Hainan Province which is only 13 km2, while Bayingol Mongolian Autonomous Prefecture is the largest city, up to 470,000 km2. Cities are widely distributed in China. Most of them are less than 50,000 km2 (298 cities, accounting for 89.75%). However, the areas between 5000 and 10,000 and 10,000 and 15,000 km2 are the largest. From the view of spatial distribution, large-scale cities are mainly gathered in the western provinces, such as Xinjiang and Tibet Province, etc., while other cities are more fragmented in the eastern region, they are relatively small. It can be seen that the span of cities is large across the whole country.
Compared with the population of urban residents, this paper finds that Chongqing has the most permanent population, with 29.914 million people, and the population is only 6.95 million in Suifenhe City. In summary, there is a very large difference between the population and land area in Chinese cities, and we need to analyze the characteristics of other production factors in depth.

2.2. Methods

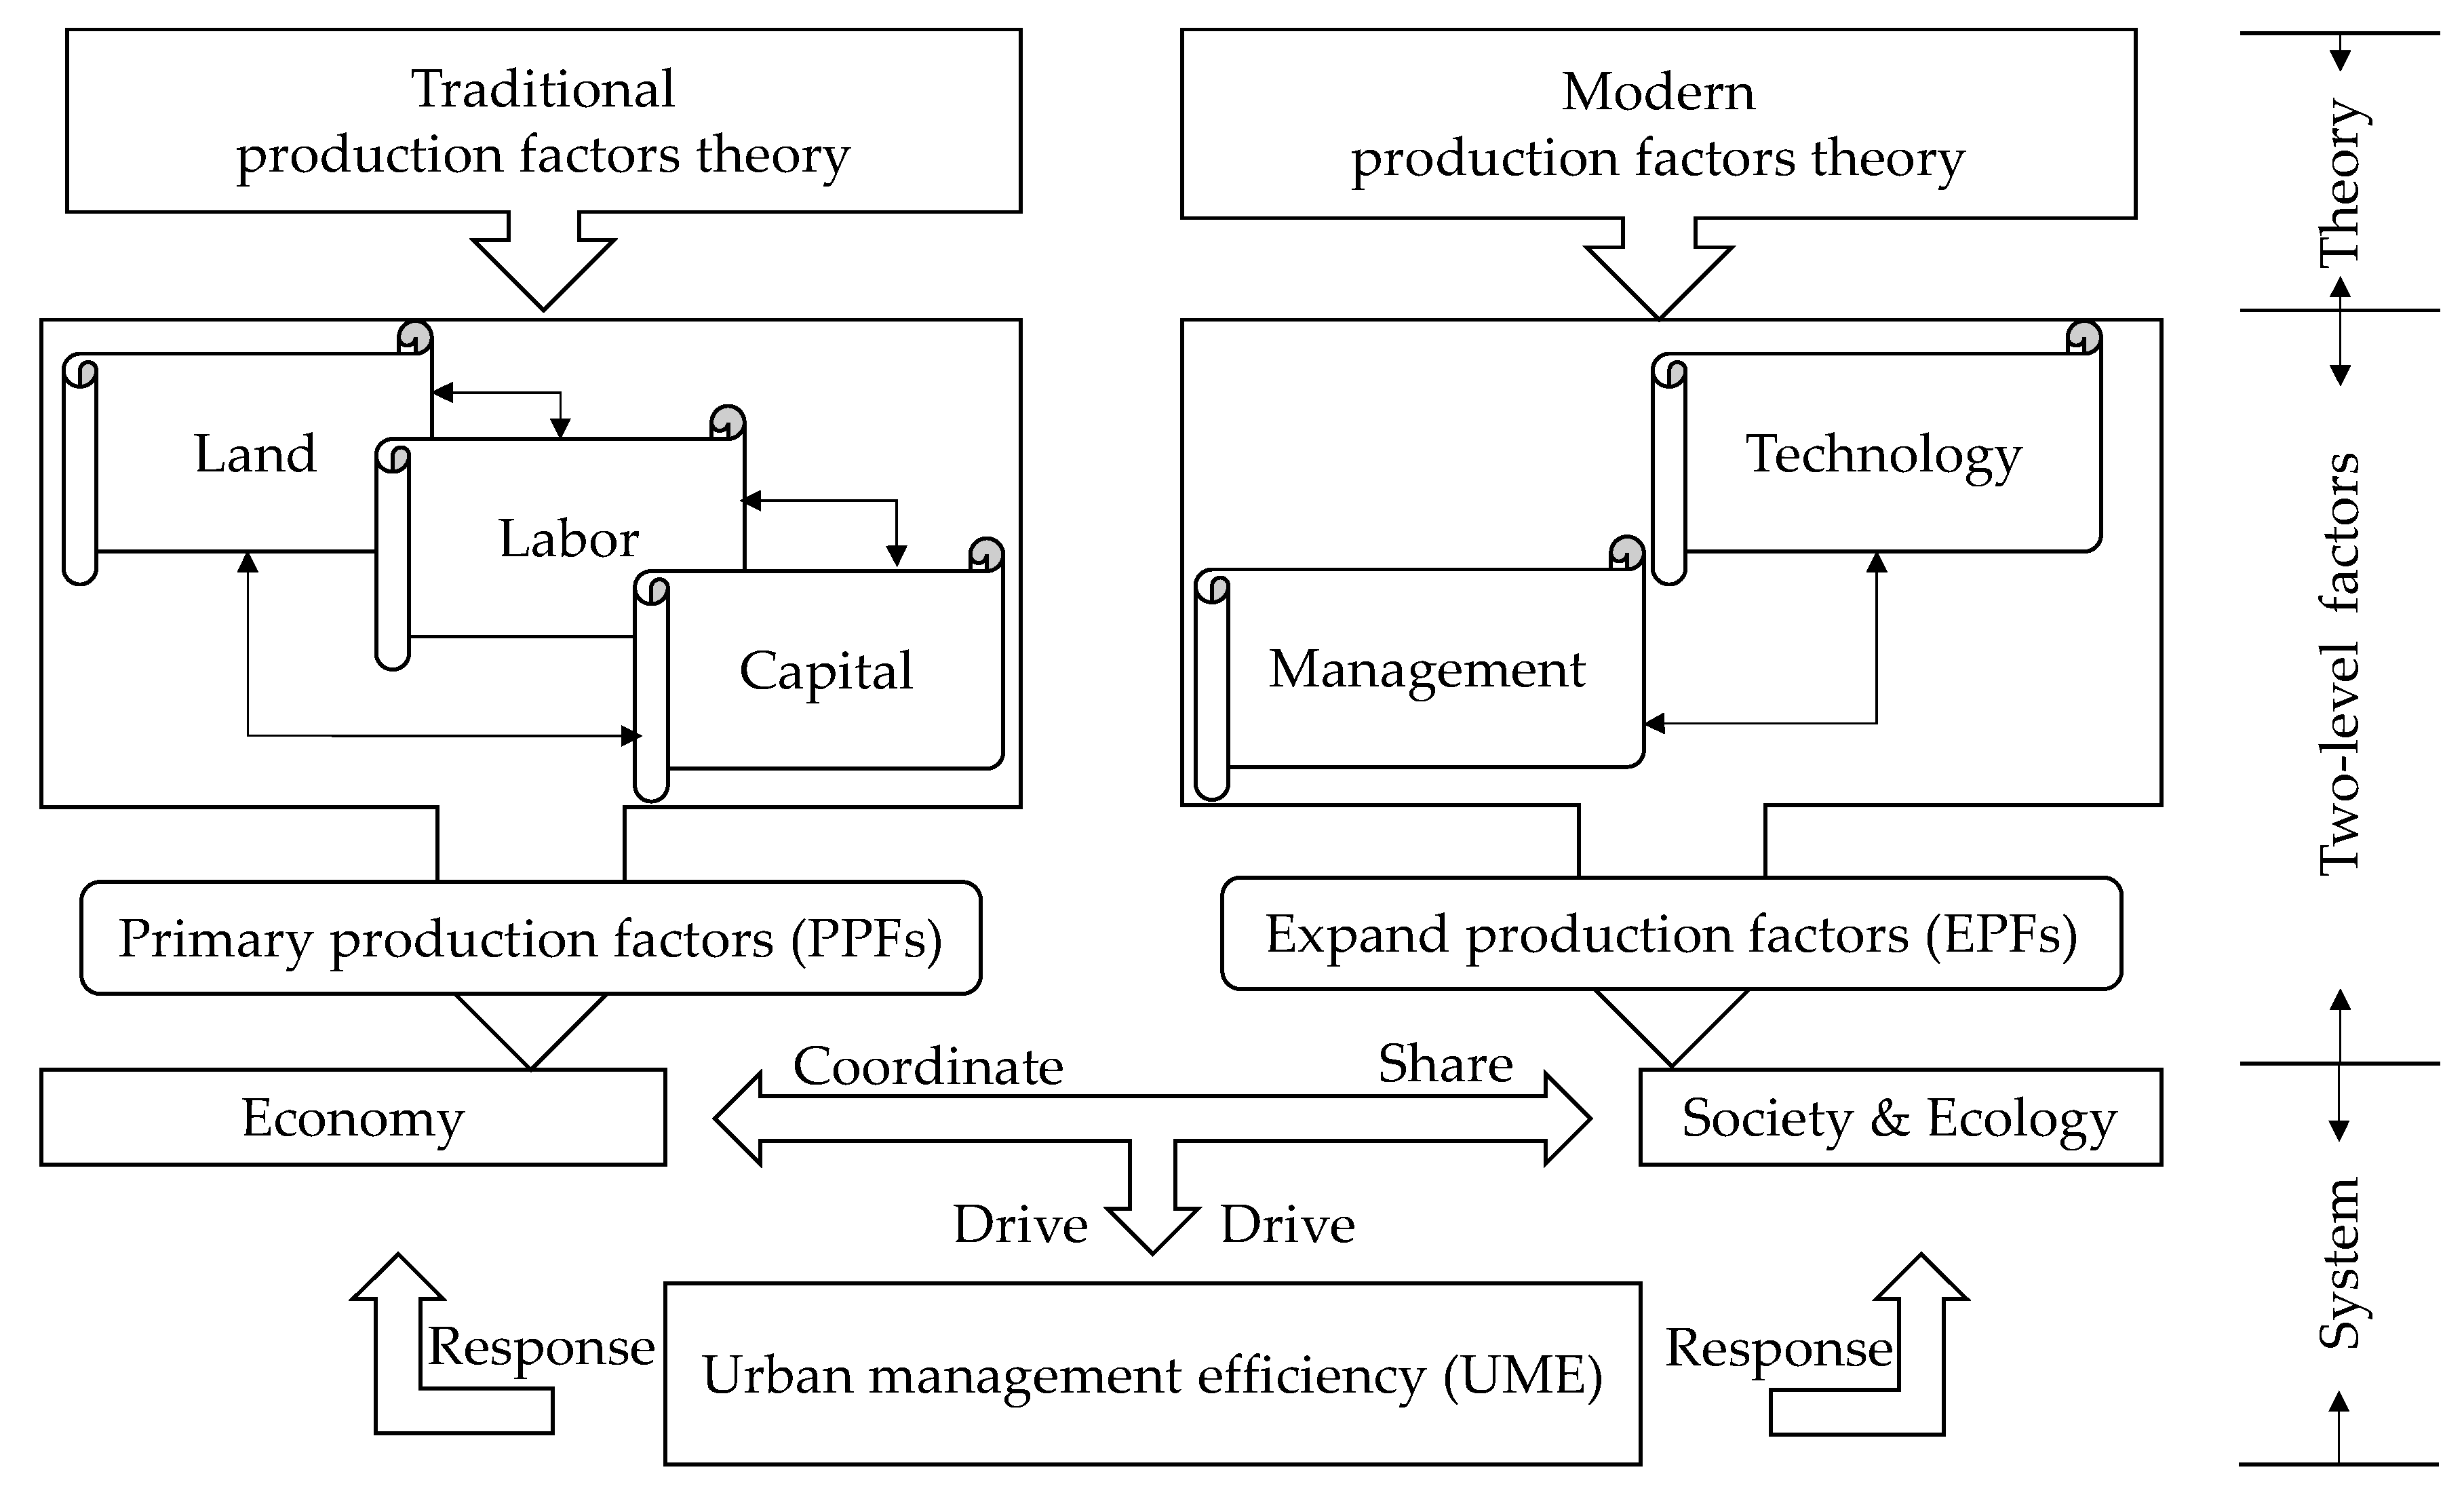
2.2.1. Considerations of Two-Level Production Factors Involved in Measuring UME

Scarce resources are difficult to meet infinite demands [54], while improving the UME is an effective means of balancing the relationship between resources and demands. Most of the published studies were, however, focused on only one or some efficiencies (labor efficiency, ecological efficiency, resource efficiency, and socio-economic efficiency). Therefore, this paper absorbs and combines the previous ideas and proposes the two-level analysis method (Figure 2), which aims at achieving the coordination and sharing of production factors.
Following the research idea and framework, the indicator system is obtained (Table 1), and multi-scale analyses (global and local) are used to discover the spatial distribution. The principles of accessibility, comprehensiveness, and relative independence are taken into consideration when selecting indicators [55], ultimately to improve the UME [56]. Particularly, the stock of human capital can improve production efficiency, so population density is selected as an indicator reflecting the degree of labor agglomeration [57,58]. GDP can be used to express the capital which is owned by the city or land, so per area GDP and per capita GDP can, respectively, represent land productivity and urban capital stock. The above three indicators can serve as specific components of the socio-economic system [59]. Energy consumption can be used to indicate energy efficiency and the technological level [60]. Air quality level two, or above, which is also called as the national class II, or above, can fully reflect China's urban air quality and the level of urban management [61]. Finally, the strategy of improving the UME is concluded in line with the actual situation of Chinese cities.

2.2.2. Multi-Scale Analyses Involved in Measuring the Response of UME to PPFs and EPFs

The global analysis starts with the Moran’s I indicators [62]. The formula is as follows:
I = n i = 1 n j = 1 n w i j ( x i x ¯ ) ( x j x ¯ ) i = 1 n ( x i x ¯ ) 2 i = 1 n j = 1 n w i j
The i and j range from 1 to n, indicating the areal units [63], and W i j represents the spatial weight matrix. Moran’s I value range is [–1, 1], and the positive and negative values represent the correlation direction. The closer the absolute value is, the stronger the correlation.
Then, it is necessary to determine whether the spatial autocorrelation of the Moran index is reliable by the Z statistic test. The formula is as follows:
Z = I E ( I ) σ ( I )
E ( I ) = 1 ( n 1 )
σ ( I ) = V a r ( I )
The null hypothesis of the test is a random distribution of the region, and there is no spatial autocorrelation. When |Z| is greater than 1.96, it proves that there is significant autocorrelation between these regions [64].
It is difficult to judge whether the value aggregation is high or low by using the Moran index. Additionally, only describing the whole distribution, it tends to conceal the characteristics of individuality and to ignore hot spots and cold spots and other important spatial information [65].
To avoid this, the Local Indicators of Spatial Association (LISA) was proposed to further measure the similarity or dissimilarity of attributes between a certain unit and its peripheral units [66], then to determine the unit of great influence on global relations [67]. The Moran index of the PPFs and EPFs are calculated by using the OpenGeoda (Urbana-Champaign, IL, America) software package, which is designed and developed by Luc Anselin and is an open source software for the exploration and visualization of geospatial data [68]. The statistics are written as follows:
I i = ( x i x ¯ ) S x 2 j w i j ( x j x ¯ )
s x 2 = i ( x i x ¯ ) 2 n
where W i j is the spatial weight matrix and i and j range from 1 to n, indicating the areal units. The result of clusters can indicate the aggregation between one unit and the surrounding units. These clusters are classified into four categories: high-high (HH), high-low (HL), low-high (LH), and low-low (LL). To amplify, the HH aggregation indicates that the same factors of production are gathered in the area [69]. Similarly, the LL aggregation means the development of the entire region is lagging behind. The HL aggregation is explained as a unit that has a prominent effect of aggregation on its peripheral units, and the LH aggregation means a unit is relatively backward compared to the surrounding units.
In the previous studies, a single factor was, or some of them were, generally employed for analysis. However, to fully characterize the UME, all single factors are considered and normalized by the Deviation Standardization Law, including the mean values of standard values of population density, per place and per capita GDP as PPFs, and of energy consumption and air quality as EPFs, as the range of values between 0 and 1 represents. When calculating the comprehensive score of EPFs, this paper eliminates areas that do not have both data on energy consumption and air quality.
Though the classification of UME is employed to characterize the spatial distribution of cities, the typical and observable spots are only estimated by the high or low values, and their relationships are not clear. Thus, to mark these spatial spots, the following equations are employed to identify the cold spots (aggregation of low values) and hot spots (aggregation of high values). The local analysis is statistically generally, expressed by bar graphs, the scatterplots, etc., to identify the spatial patterns of UME and propose targeted regional development policies.
G i * ( d ) = j = 1 n W i j ( d ) X j i = 1 n X i
After standardization it is simplified as:
Z ( G i * ) = G i * E ( G i * ) V a r ( G i * )
where E ( G i * ) is the expected value, V a r ( G i * ) is the variance, and W i j ( d ) is the spatial weight. If Z ( G i * ) is positive and significant, i has a relatively high value and is then defined as a hot spot, otherwise, it is defined as a cold spot [70].

3. Results

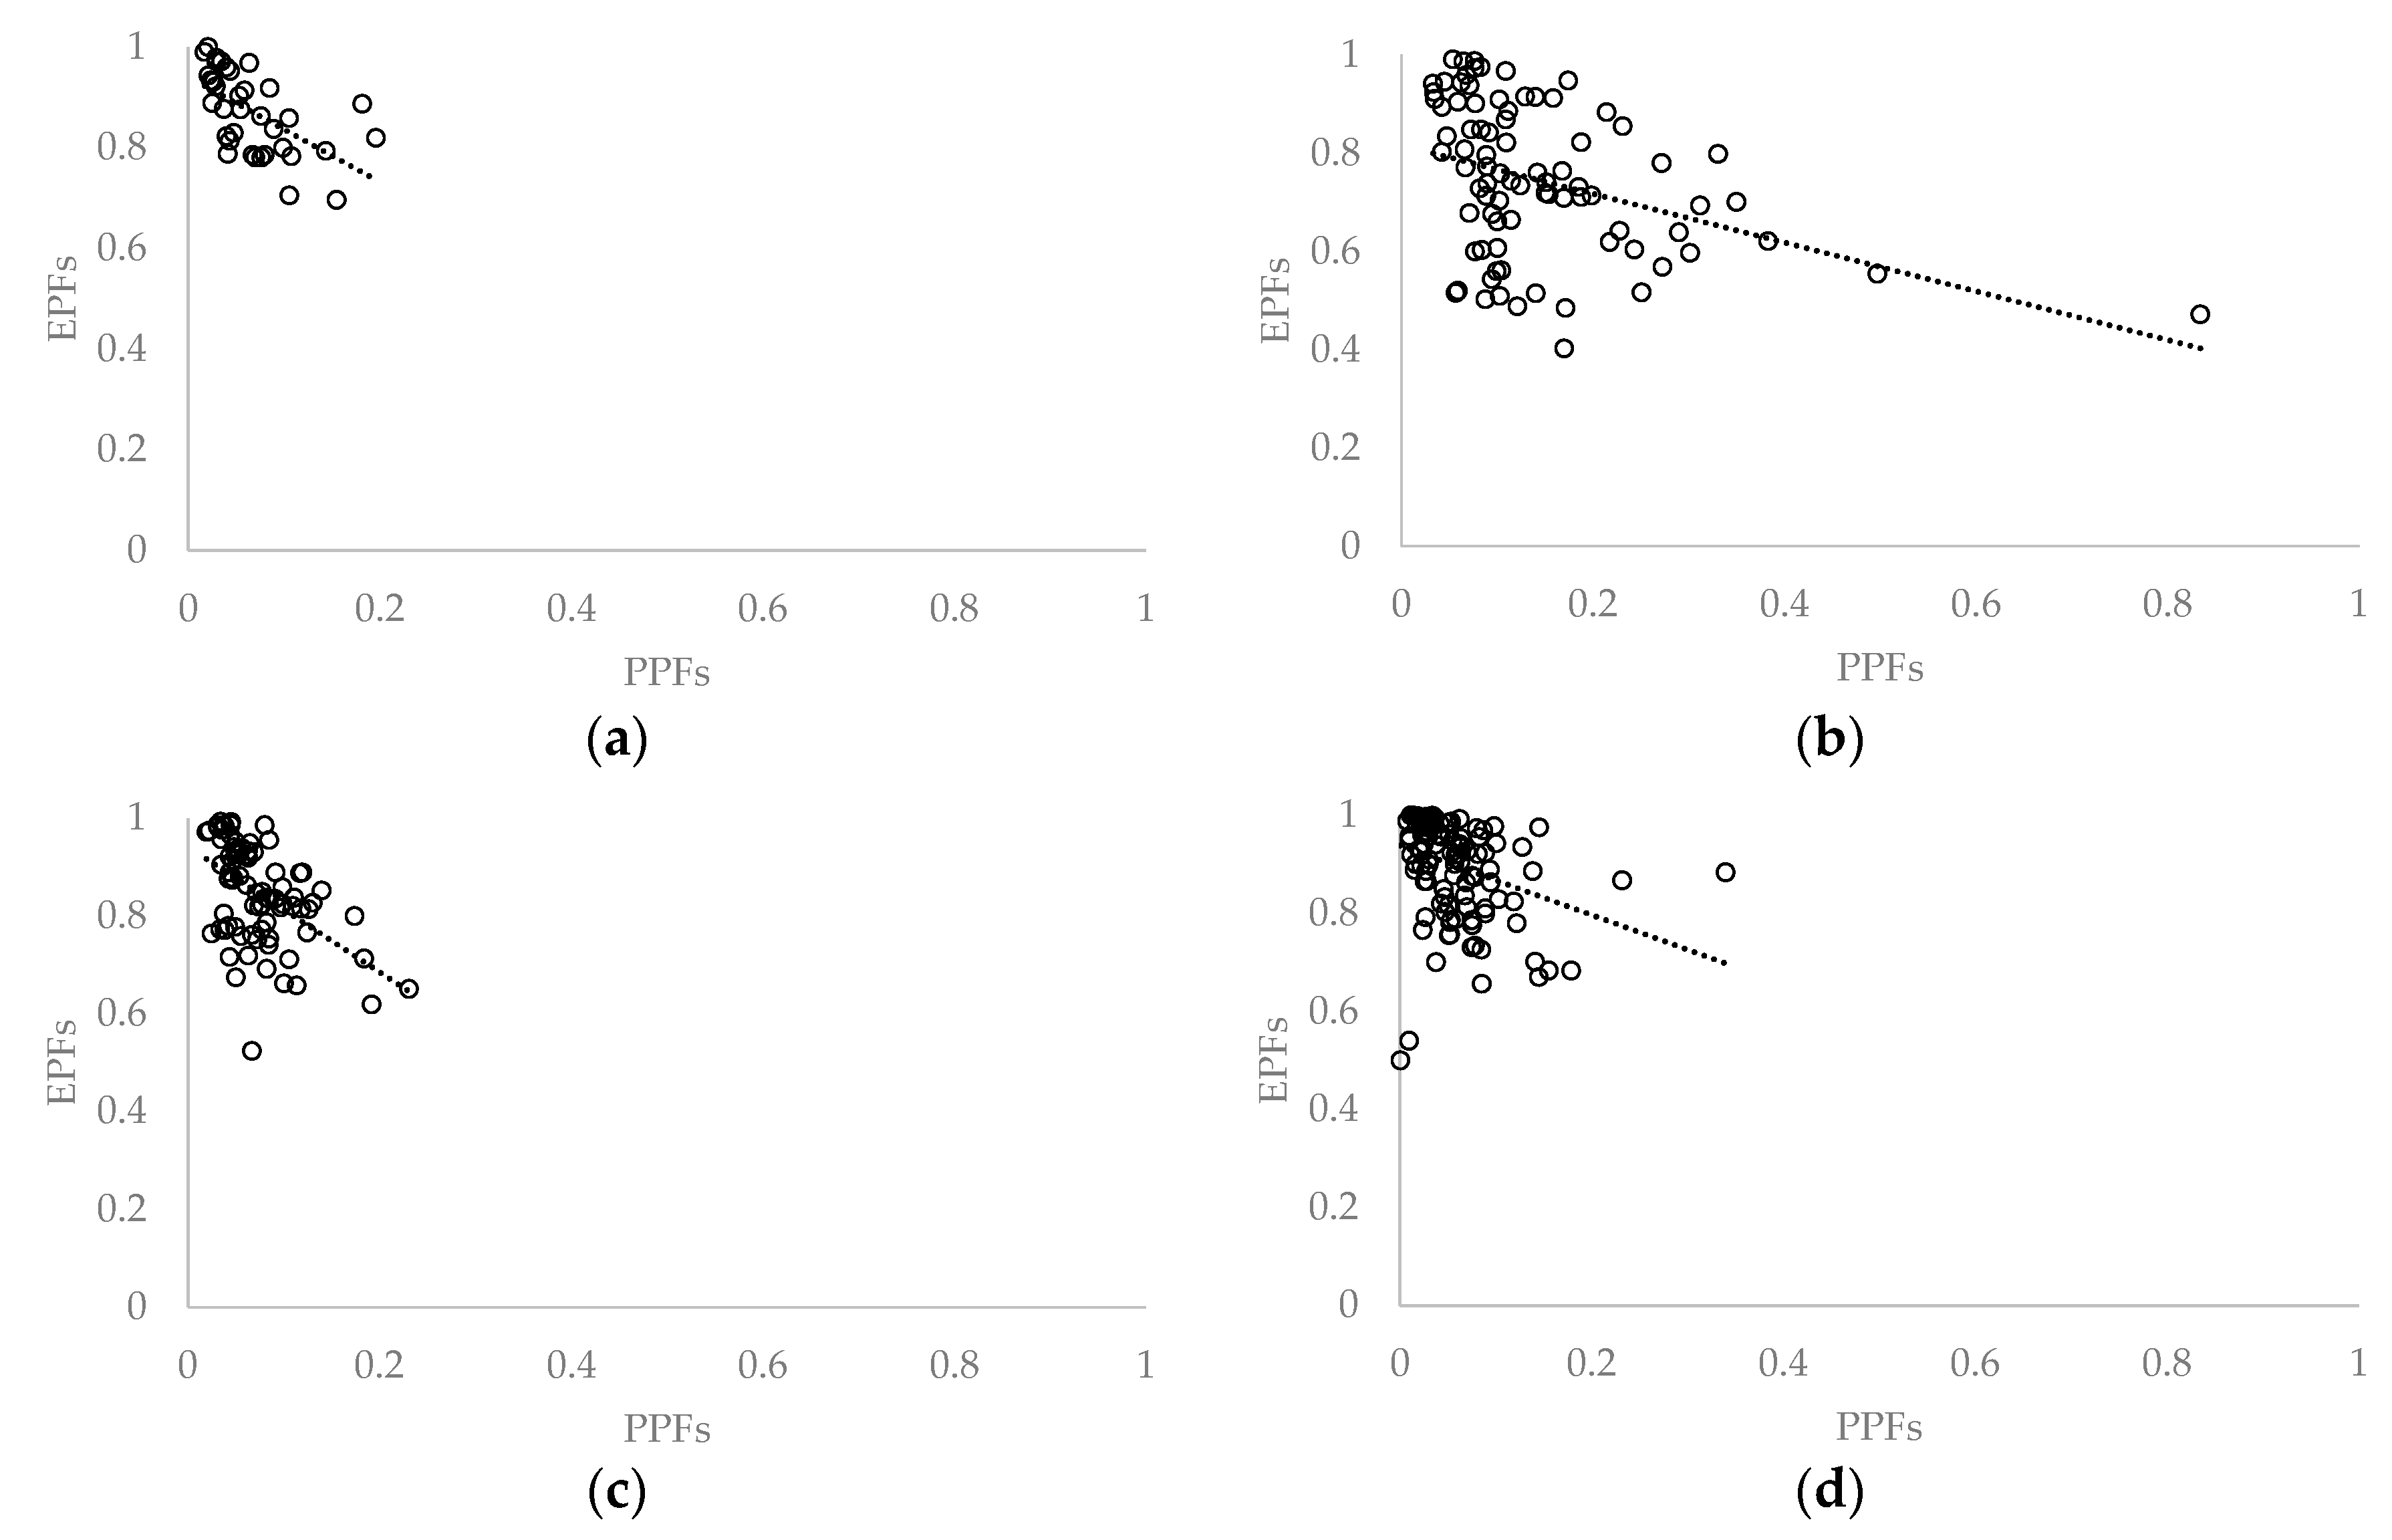
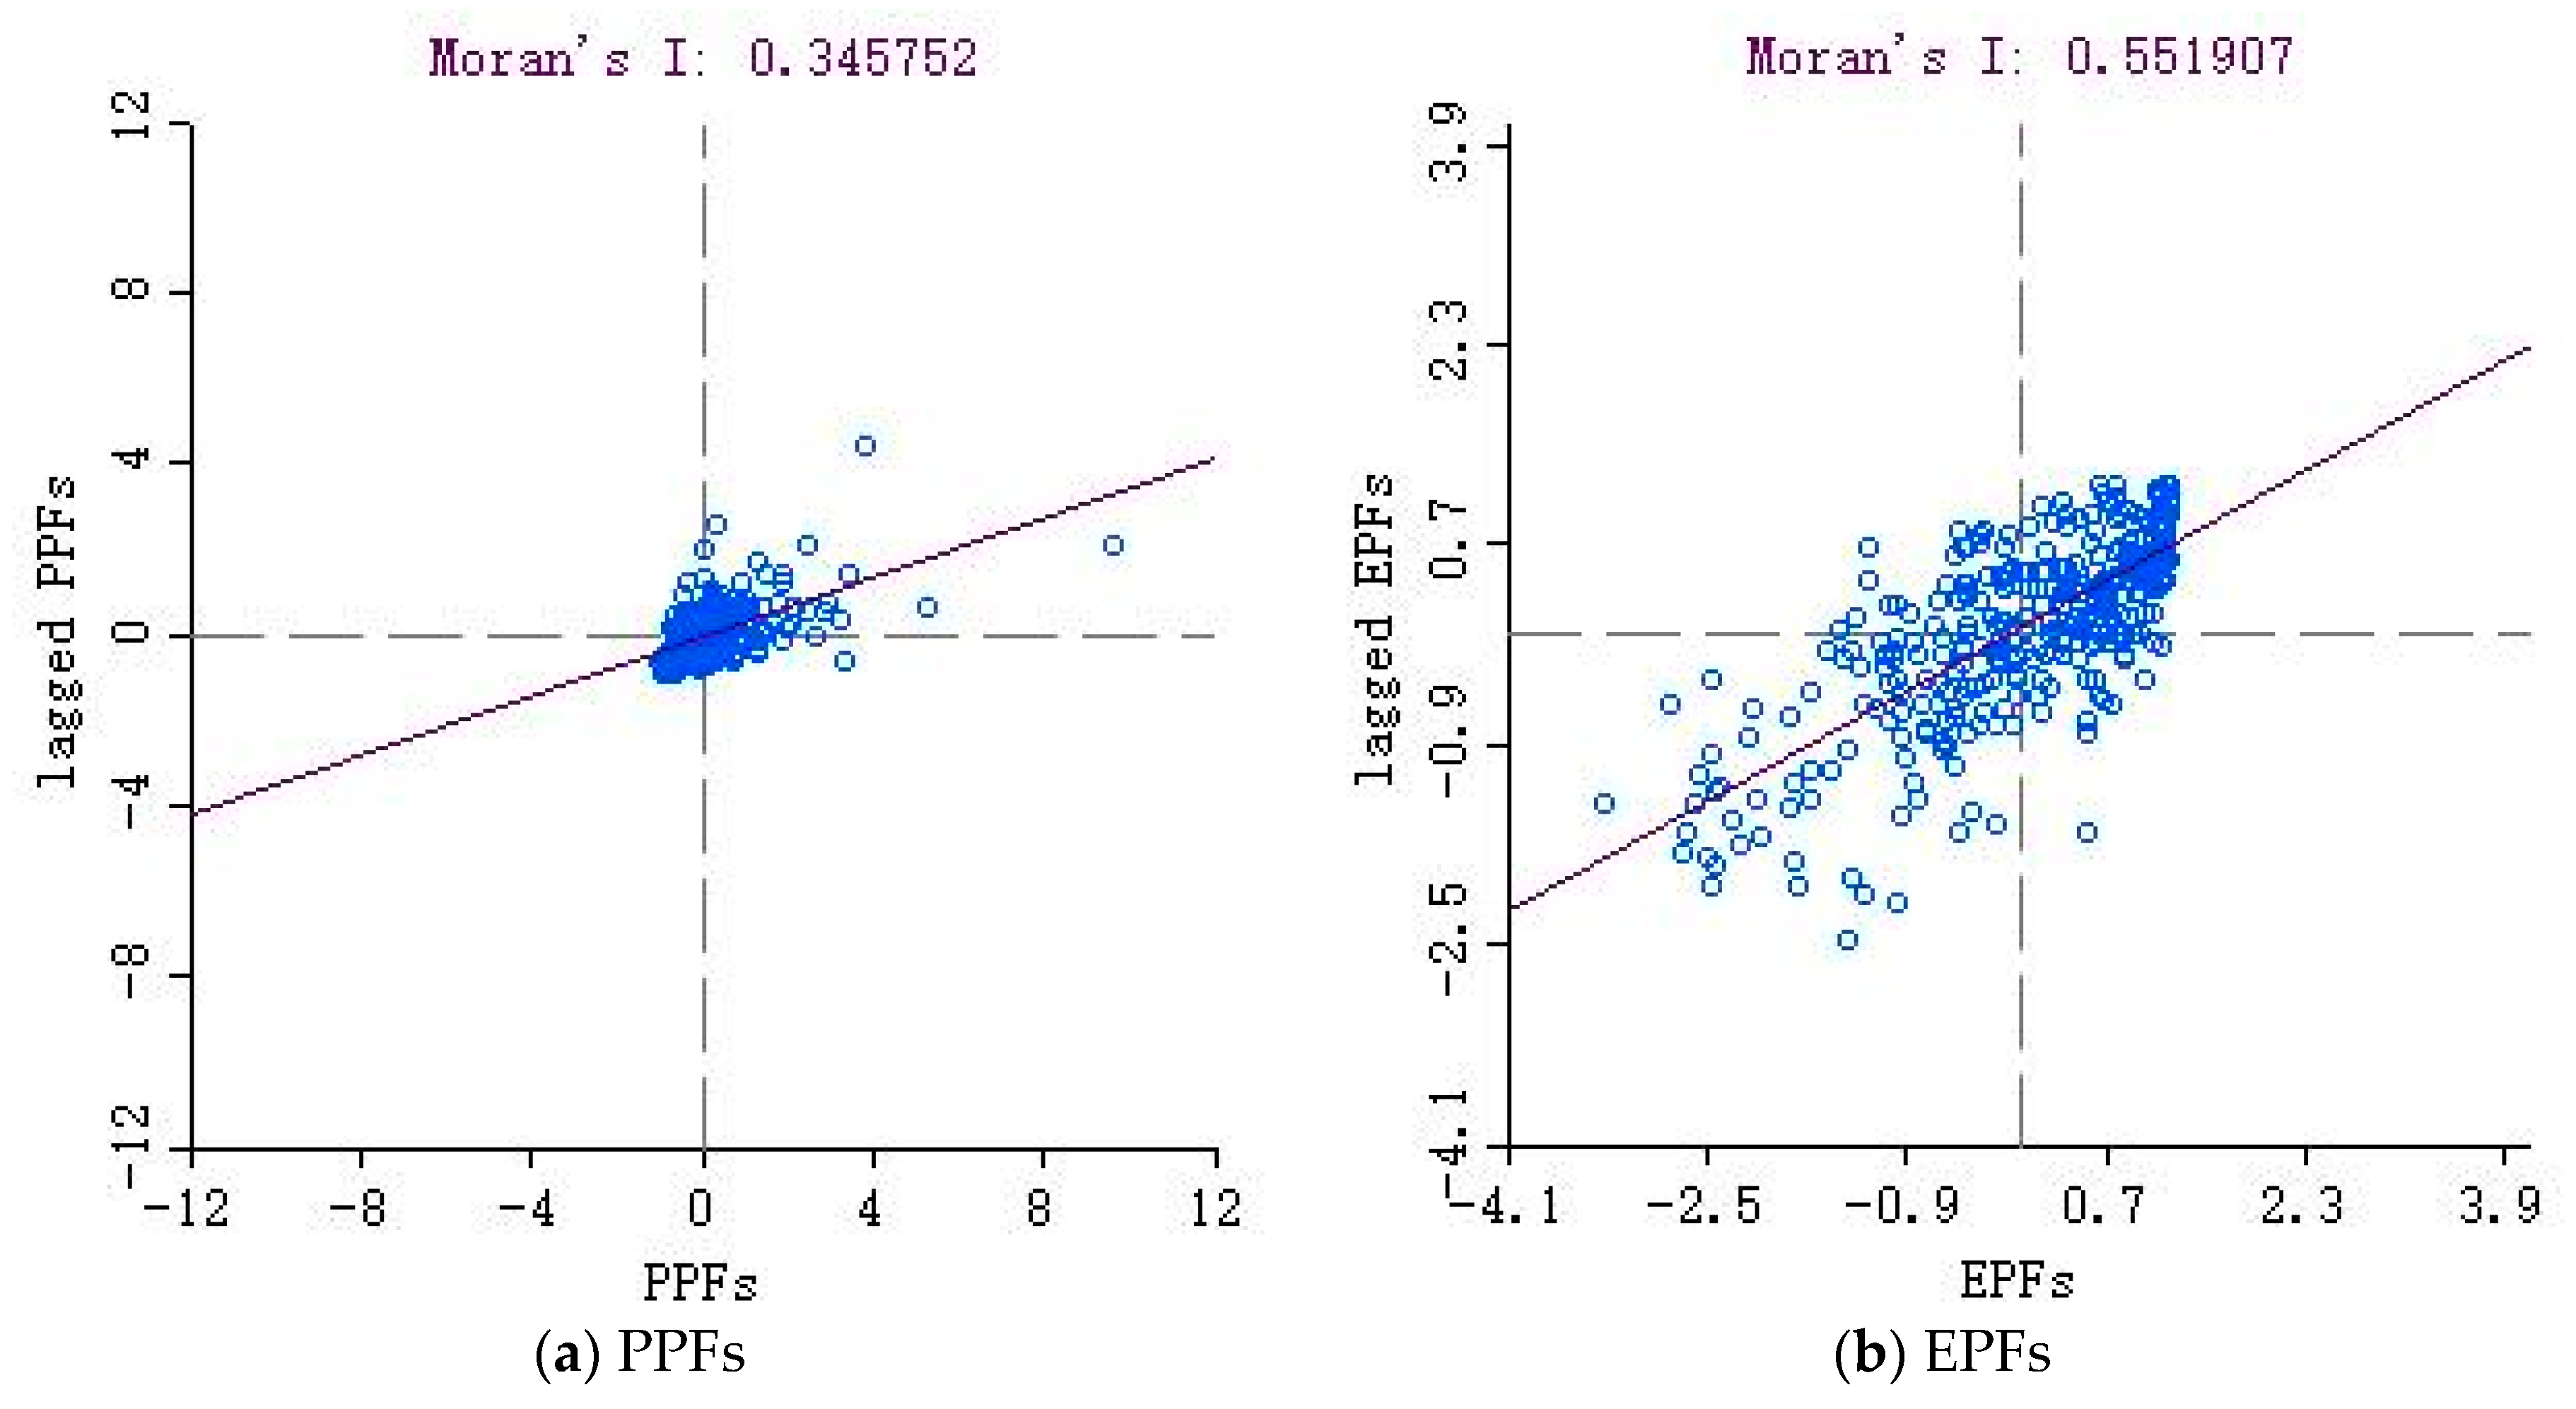
3.1. Agglomeration Effects by Global Analysis

The positive correlation of PPFs and EPFs means that the population growth, economic development, resource consumption, and environmental safety of Chinese cities are spatially inter-correlated and agglomerated in a certain way. The Moran index of the EPFs is 1.5 times larger than the value of the PPFs, which indicates that the positive aggregation of energy consumption and the environment become more significant (Figure 3).
On the basis of knowing the overall global correlation, the LISA is used to reveal the characteristics of local aggregations.
On the one hand, there are 15 HH areas, 61 LL areas, six LH areas, and five HL areas (Figure 4a). Firstly, the HH areas are mainly distributed in Guangdong, Jiangsu, and Zhejiang. These three provinces better enjoy the geographical condition, earlier opening-up to the outside world, and predominantly export-oriented manufacturing industry. As a result, three places have a stronger appeal to the population in their surrounding cities. Secondly, the LL areas have the maximum proportion and distribution, involving 13 provinces and 61 cities, because the economically-backward condition aggravates a population emigration. The more laborers that are lost, the more difficult it is to give full play to tap the potential of local resources, which causes a constantly backward development in the whole area Thirdly, the LH areas are mainly laid in Anhui Province because they neighbor with the development cores in the east (Jiangsu and Zhejiang). Furthermore, the population/human resources and other factors in Anhui are flocking into Jiangsu and Zhejiang, driven by the economic attraction. In a word, Anhui contributes production factors to the prosperity of its two neighbors. Then, the HL areas are scattered in Inner Mongolia, Guizhou, Qinghai, and Sichuan, etc. Compared with the surrounding areas, greater developmental potentials are mirrored in these regions. Finally, the rest of the areas, mainly in the middle district, have a less significant clustering effect, which indicates that these areas suffer the influence of interacted multi-factors.
On the other hand, there are 57 HH areas, 41 LL areas, six LH areas, and two HL areas (Figure 4b). The HH areas are mostly in Heilongjiang, Guangxi, Fujian, Jiangxi, Yunnan, Sichuan, etc. The areas above are of lower energy consumption and better environment. The reasons are as below: first of all, the local economic development gives priority to the small commodity-processing industry and service industries. Secondly, less population and more grassland and forest in the north leads to the good air quality and animal husbandry. The LL areas are concentrated in Northern China, like the BTH, where the cities are characterized by high energy consumption and poor environment, due to the serious pollution caused by physical and geographical conditions (terrain, climate, and vegetation), which hinder the dispersion of pollutants, and a dense population calling for very large energy demands. However, only some cities are assigned to the LH or HL areas, which indicates that regional clustering is dominated by economic interactions and extended environmental awareness.
This paper further studies the inherent mechanism of agglomeration of cities through hot and cold spot analyses. The PPFs are composed of 13 first-level hot spots, 12 second-level hot spots, seven third-level hot spots, seven second-level cold spots, and 22 third-level cold spots all over China (Figure 5a). The first-level hot spots assemble in the Yangtze River Delta (YRD) and the Pearl River Delta (PRD) where well-developed economic wealth and a considerable number of labor forces are collected. Overall, the second-level hot spots encircle the first-level spots, and are surrounded by the third-level hot spots, which show that the sphere decrement of development is obvious. The cold spots are mostly in the southwest of China because they are located in the Qinghai-Tibet Plateau and Yunnan-Guizhou Plateau, which are well endowed with resources but face poor conditions for exploitation. The EPFs include 13 first-level hot spots, 28 second-level hotspots, and 17 third-level hotspots (Figure 5b). In terms of cold spots, there are 35 first-level spots, nine second-level spots, and 15 third-level spots. The distribution of hot and cold spots based on the EPFs is basically consistent with the distribution of clusters. The Beijing-Tianjin-Hebei (BTH) is treated as a cold spot due to its superposition of high energy consumption, but low environmental values. The strip of hot spots in Sichuan and Yunnan is determined by the high regional vegetation coverage rate and less developed economy. All in all, the agglomeration of cities is formed by neither the advantages for the development of infrastructure conditions, nor the distribution of population and industry.

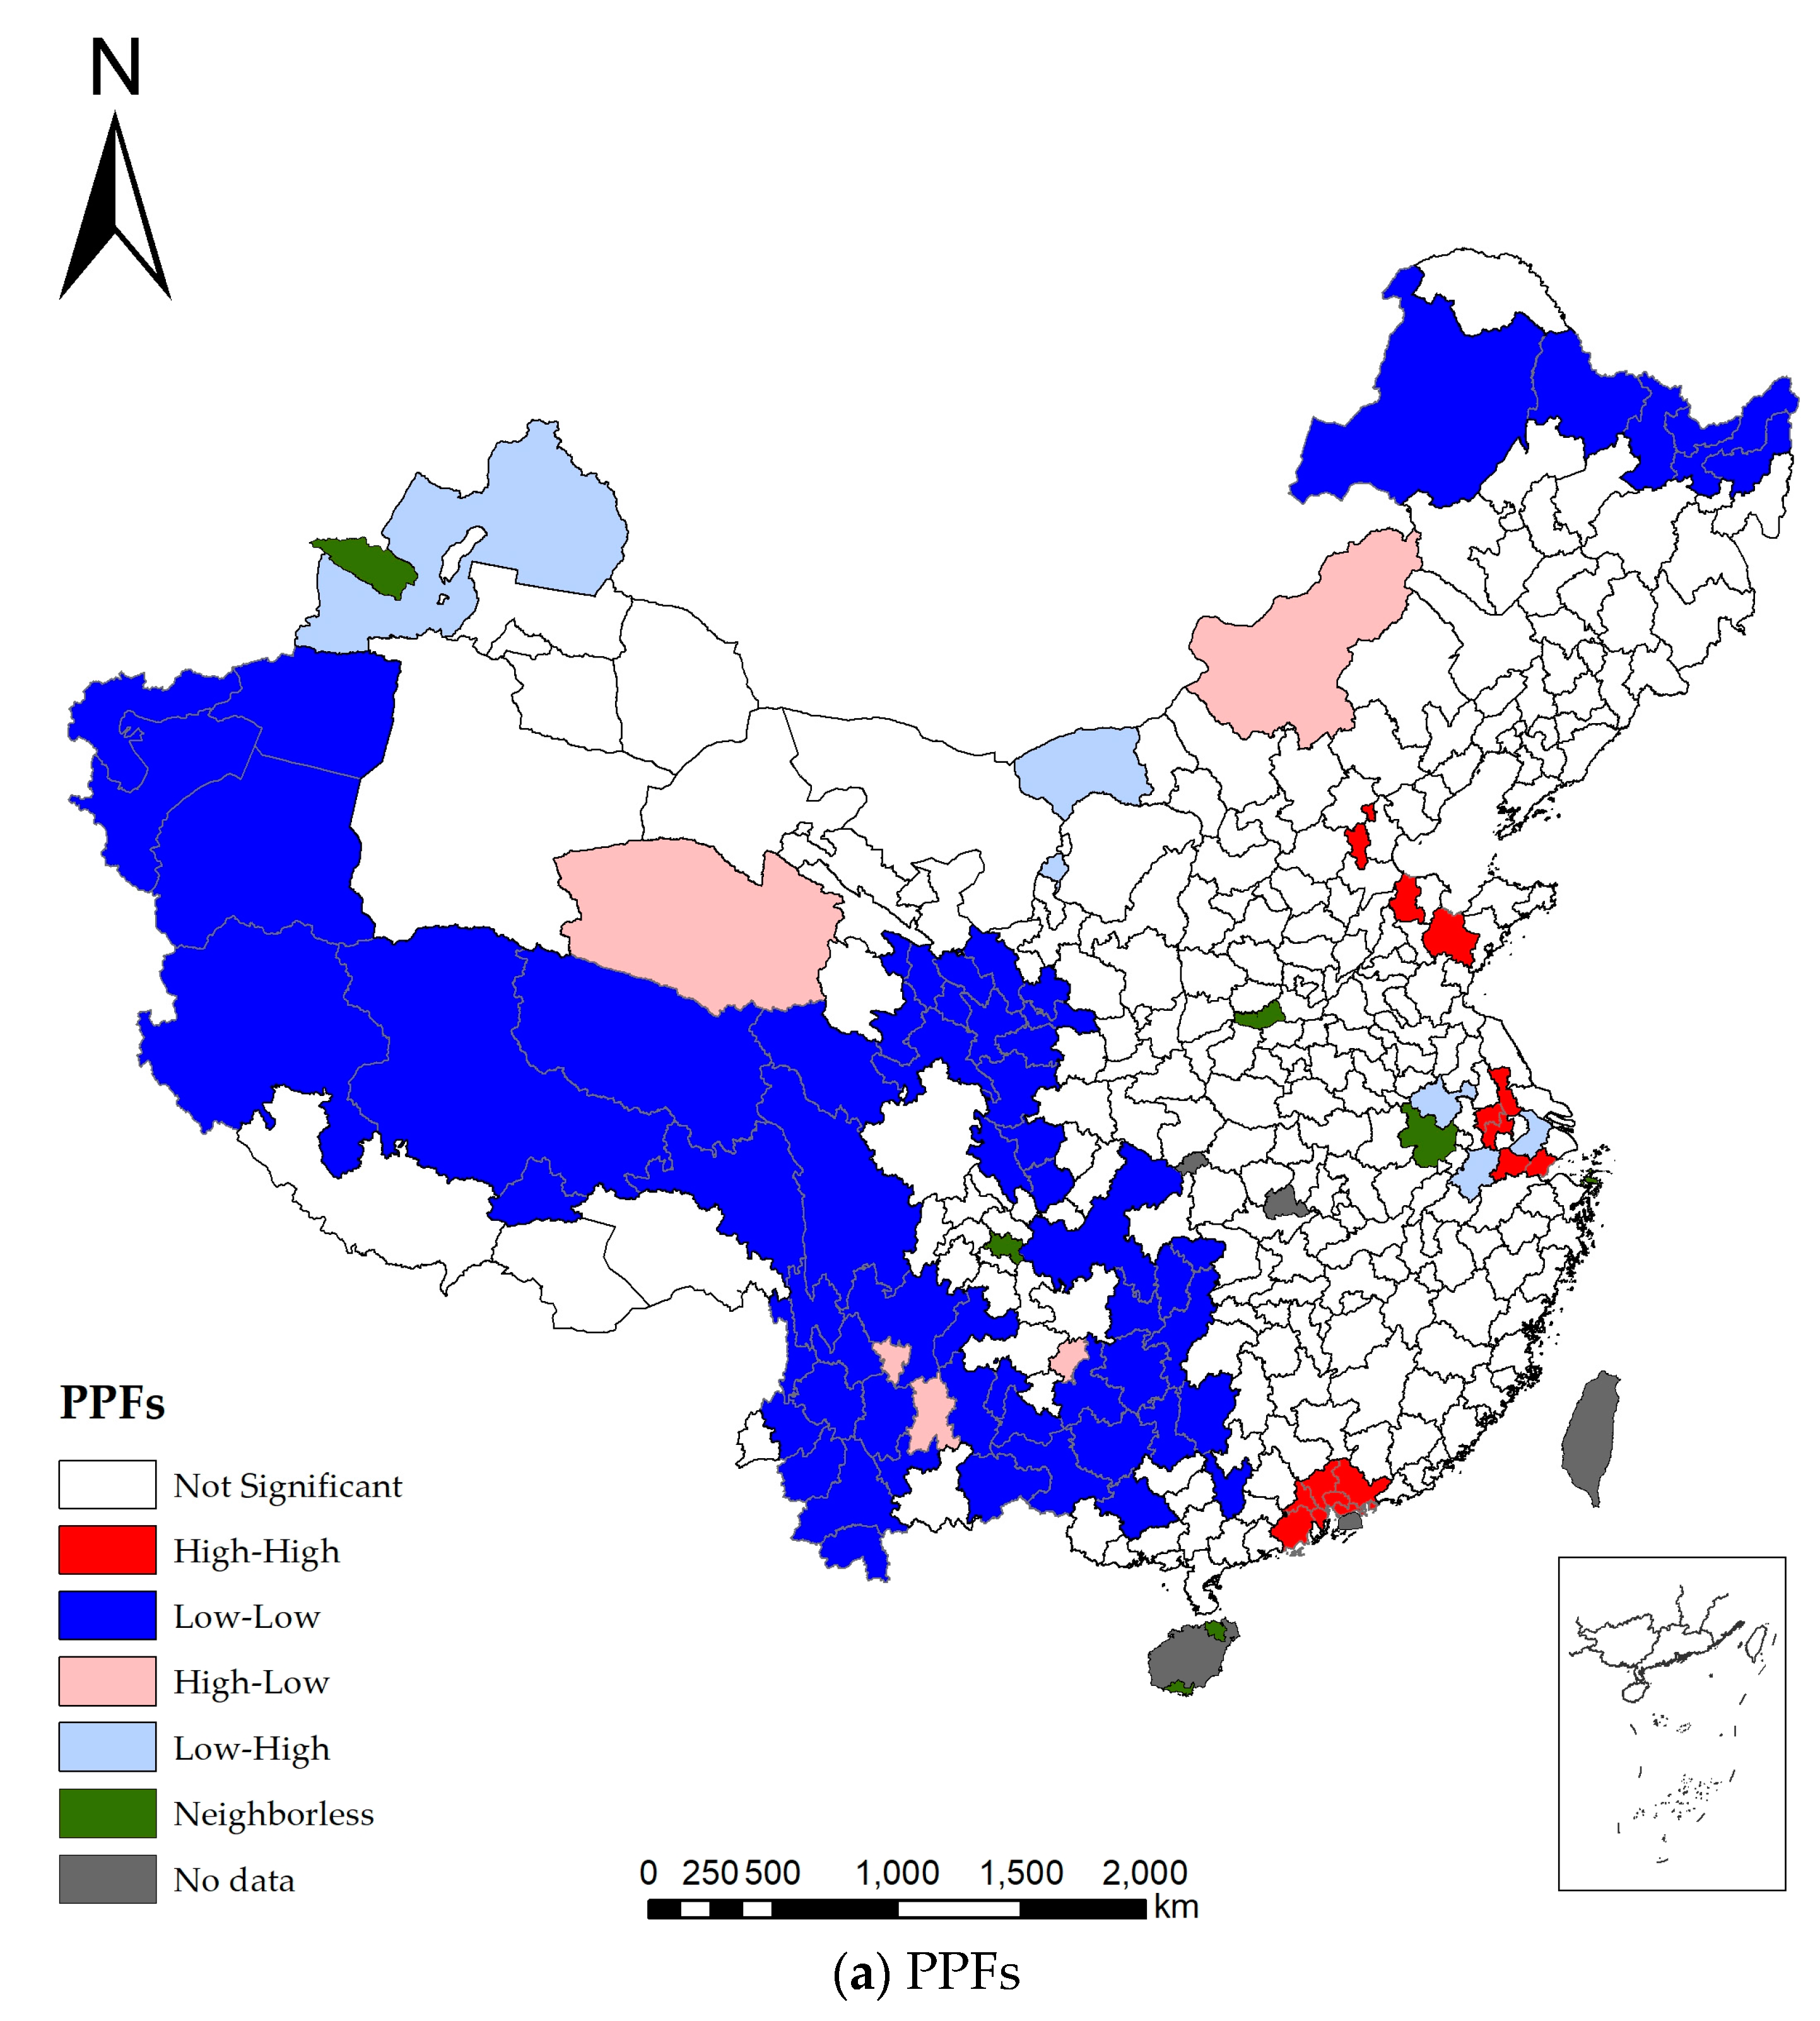
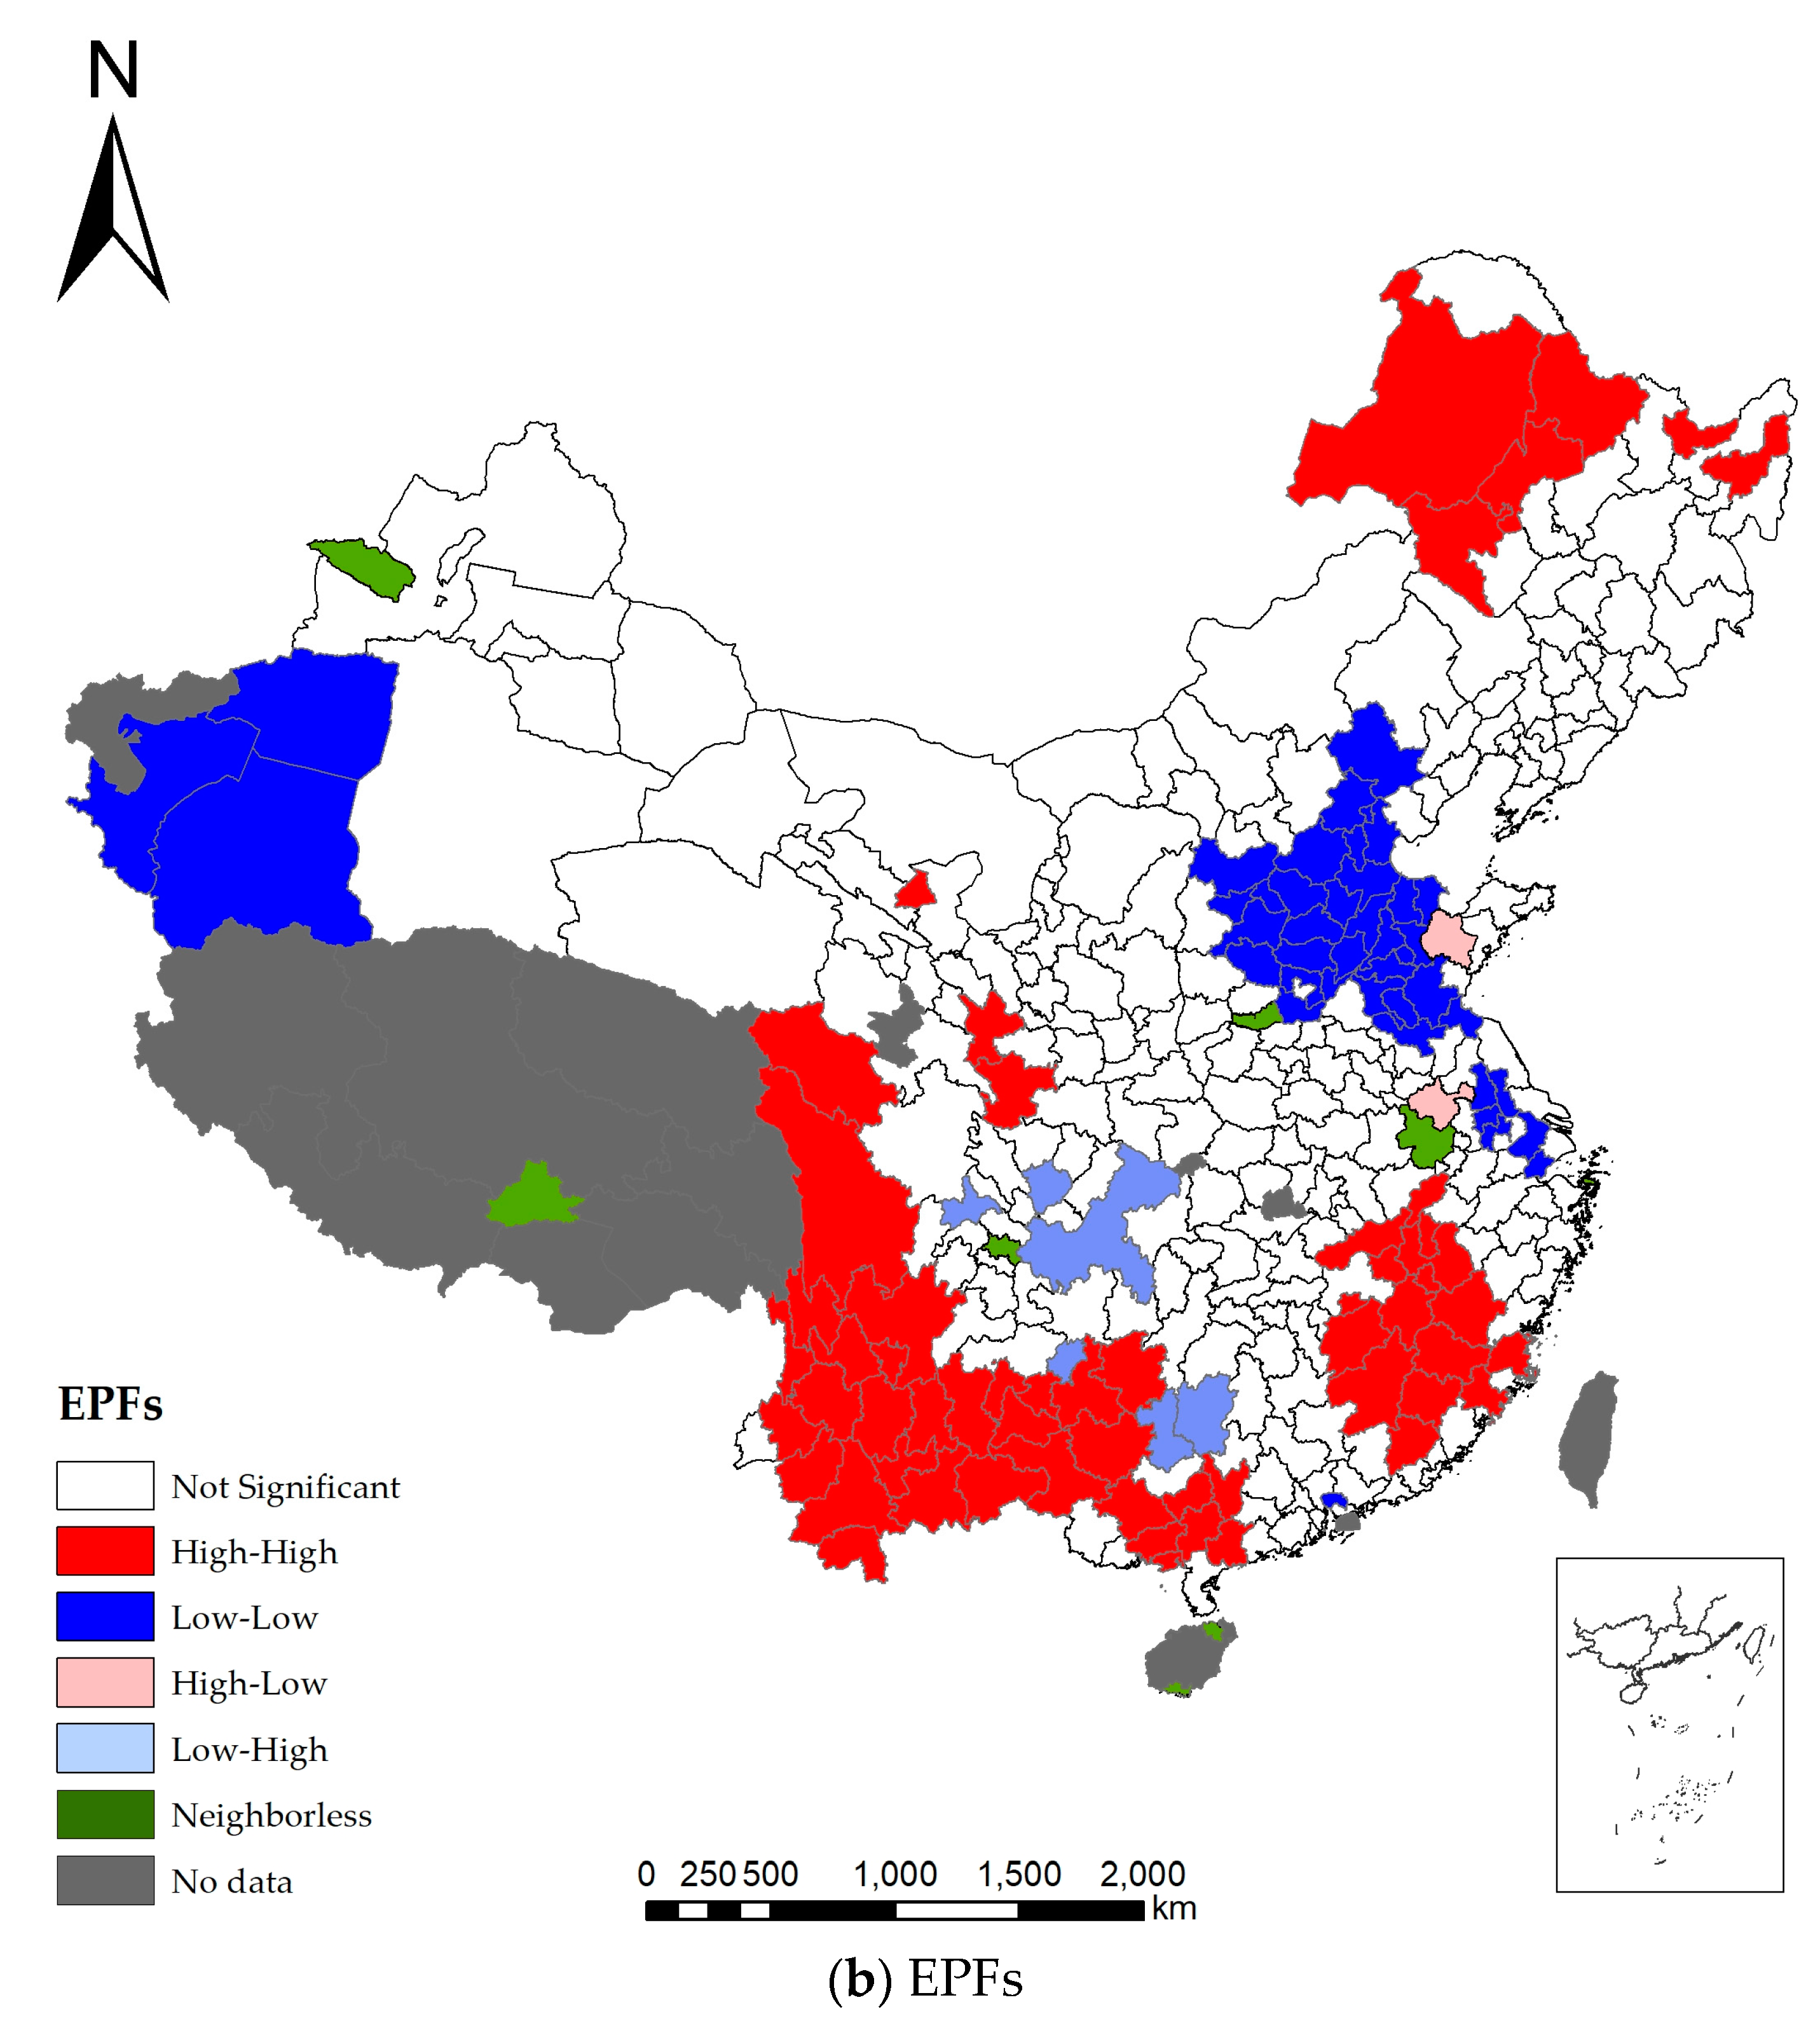
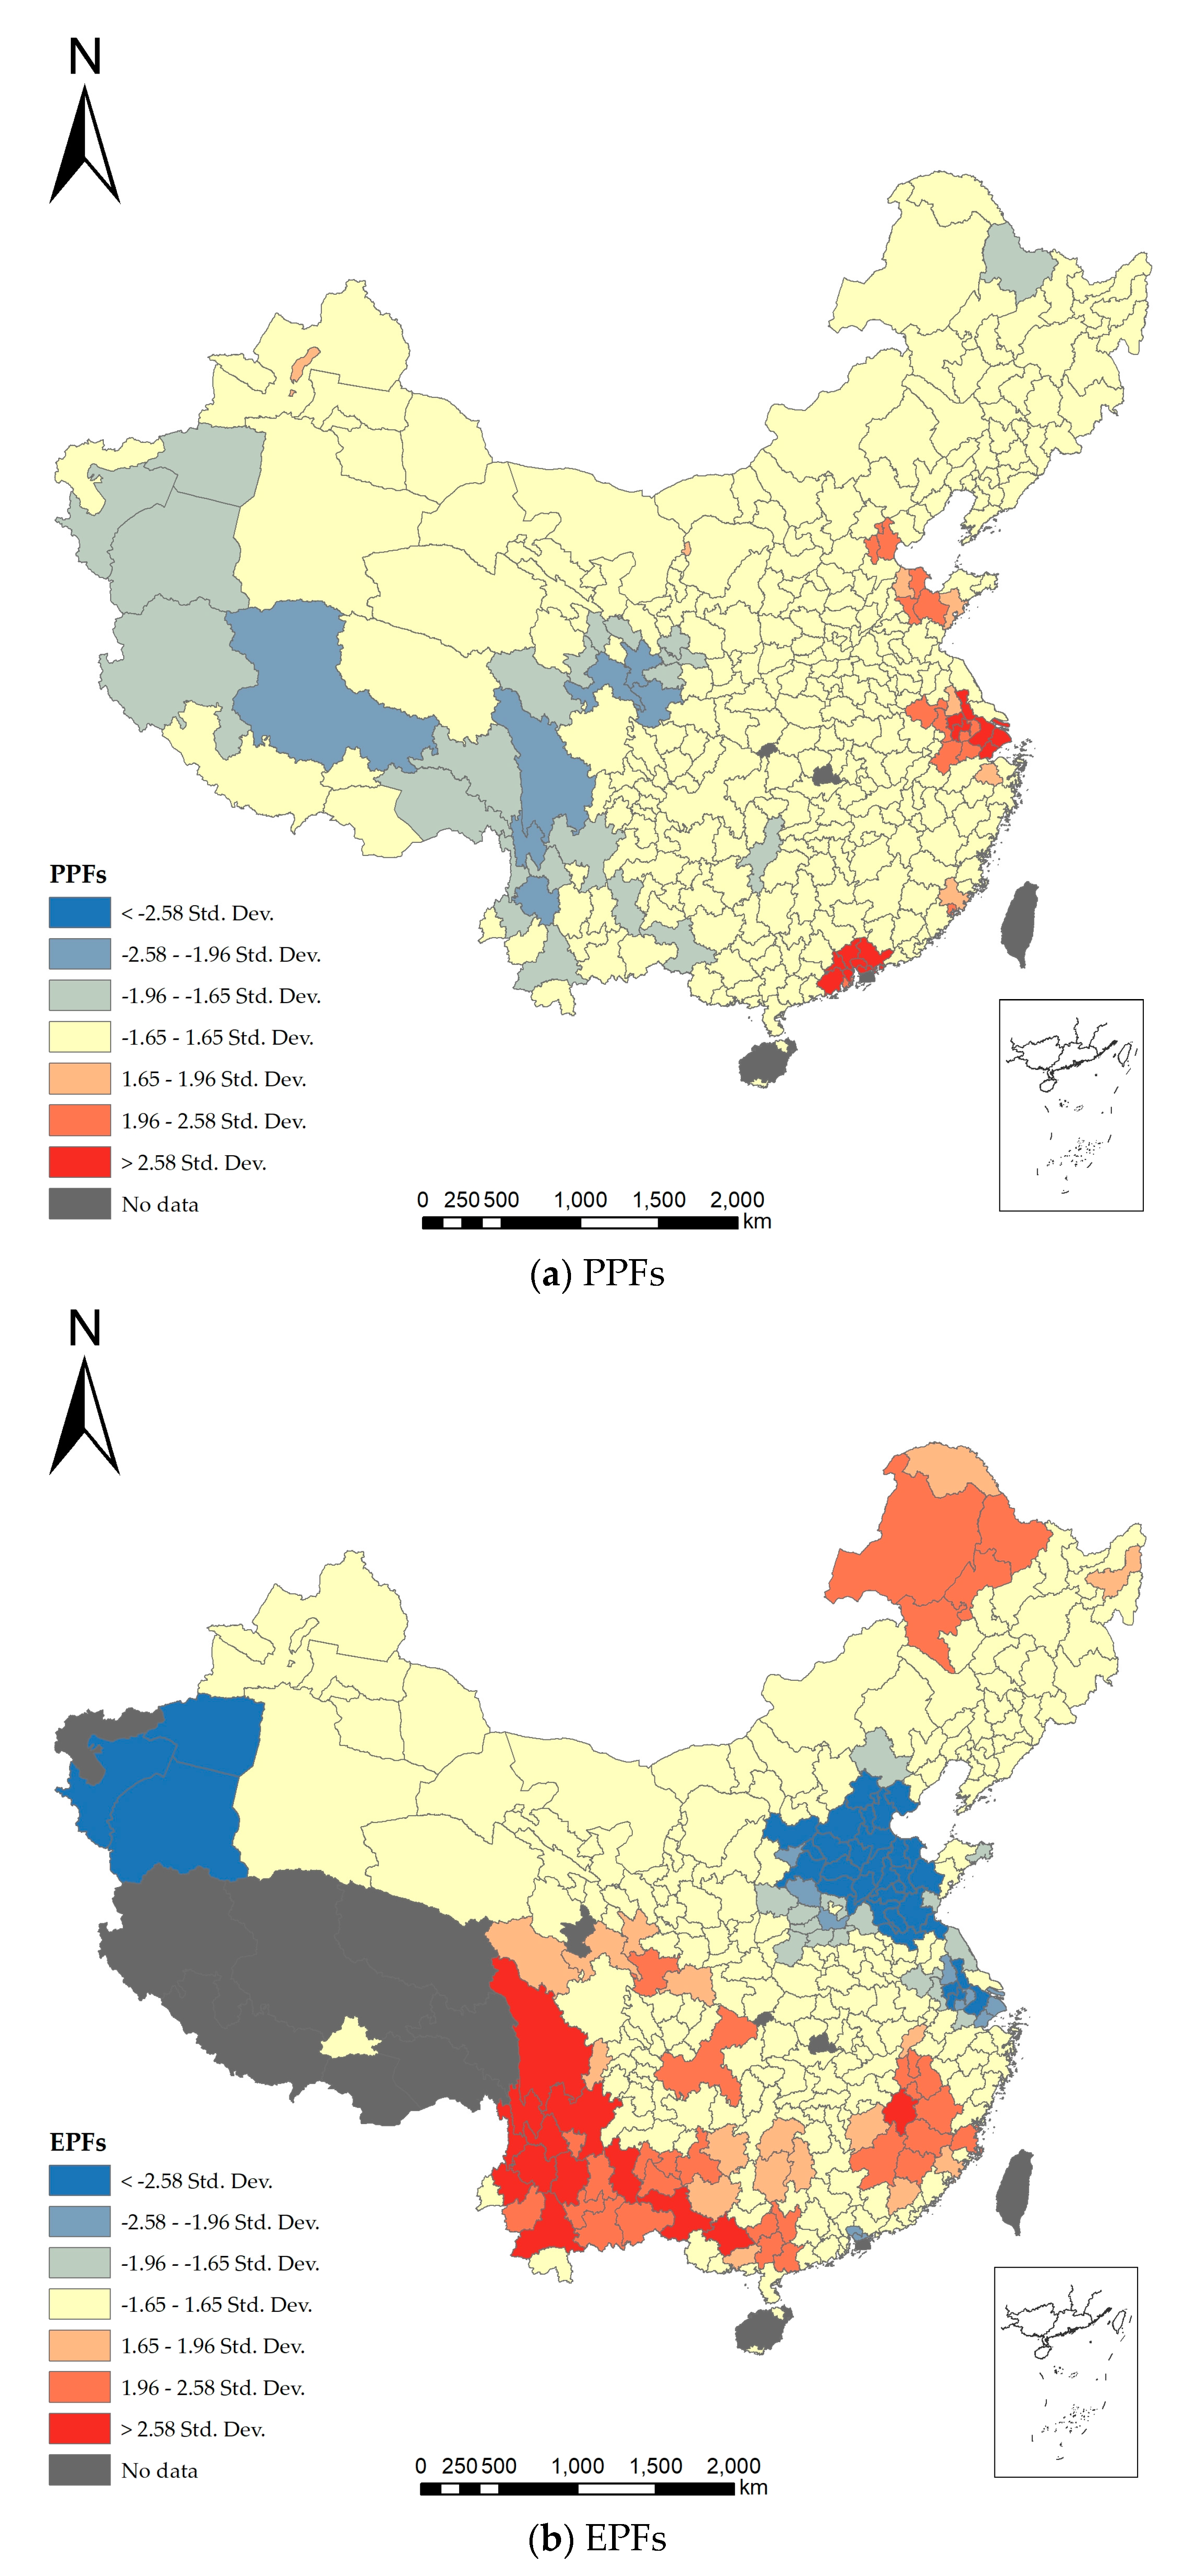
3.2. Variant Effects by Local Analysis

The global analysis above explores whether the PPFs and EPFs are coordinated. According to the China National Bureau of Statistics, the economic region in China is divided into the eastern, central, western, and northeastern districts. Therefore, the study follows this division and draws the scatterplots to clarify the pattern of UME in different regions (Figure 6).
The PPFs and EPFs are negatively correlated in each district, but, in present China, it is difficult to balance the relationship between the PPFs and EPFs. The eastern cities are more efficient in managing PPFs, while the western cities have more advantages in the EPFs. As for the northeastern and central districts, both of the PPFs and EPFs are placed in the transitional stages between in the east and west districts, which indicates that the UME in these areas is more complex and multi-influenced. According to the fitting effects, it is more suitable to use the linear equations for explaining the relationship between the PPFs and EPFs in the northeast and central parts. Moreover, the aggregation in the west is the most consistent with the results of LISA and hotspot analysis.
In addition, the slope of fitting lines is sorted from large to small: the east district > the west district > the northeast district > the central district. In other words, environmental quality is different in response to economic development. In the east district, natural conditions are superior and most of the heavy industries have migrated to the central and western regions. At the same time, economic strength is an important guarantee for the protection and upgrading of environmental quality. The overall economic level of the eastern part is higher than that of the others. Therefore, the environmental carrying capacity of the eastern part is higher, but the negative effect of economic development on the environment is lower. The northeast district, including Heilongjiang, Jilin, and Liaoning provinces, is an important old industrial base in China. For a long time, industrial production has put great pressure on the environment, and it is still in the industrial transition period so that the negative effect of industrial pollution on the environment is more obvious. Hence, the environment is more responsive to the economy in the northeast district. There are few heavy industries in the west, and economic development mainly relies on agriculture and animal husbandry with less environmental pollution. Therefore, the response of the environment to the economy is not very sensitive. In this paper, it is found that the east district is close to, or has reached, the advanced stage of industrial development and the UME is high. The low UME in the western cities is related with the low stage of industrial development and the UME is low. The northeast and central districts are roughly in the middle of industrialization, and the UME is at a moderate level.

4. Conclusions and Discussion

4.1. Main Achievements

The first finding are the striking spatial differences. Previous studies have shown that differences in natural and economic levels determine that the spatial distribution of urbanization in China is not balanced [71]. Similarly, in our study, the production factors, named as PPFs and EPFs, are spatially distinct. In general, the East District has a significantly higher carrying capacity than the central and western districts, marked by the features of economic vitality and population concentration of cities. Similarly, as for the regional carrying capacity, which reflects the characteristics of energy consumption and environmental protection, the cities are mainly distributed in the central and western districts, as well as other underdeveloped areas with hills, mountains, or deserts. Evidently, these spatial variations also manifest the contradictions between economy and the environment as two scenarios. The one is a region with rapid economic development, but its energy depletion and environmental degradation are relatively serious, and the other is characterized by an adverse trend.
The second finding is the strong correlation between management models. According to LISA and hotspots analysis, these spots are mainly gathered in the Yangtze River Delta, the Pearl River Delta, and the Bohai Rim, as well as in Qinghai, Gansu, Tibet (the center of the northwest region), and Sichuan and Yunnan (the center of the southwest region). Briefly, they are not only in isolated cities, but also exist as a form of clusters. Thus, the point-and-plane mode may provide a reference for the city’s development.
The third finding is the evident emphasis of development. The first two findings (mentioned above) are mainly caused by different physical conditions, socioeconomic status, and urban plans. It is no exaggeration to say that the location and policy dominate the development stage and pattern of China's urban agglomeration [72]. The current developed areas have been raised by their traditional economic advantages, however, it has inevitably brought heavy burdens to the environment. Therefore, the economic development stage and environmental policies lead to the different emphasized aspects of development in cities. However, these differences will converge with the advance of policies, systems, and technologies as time passes by.
The last finding is the weak matching linkage. The relationship between the district scale and the UME (reflected by PPFs and EPFs) represents the balance or imbalance between economic development and environmental protection. As mentioned above, few cities can balance this while a large number of cities have even held the mode. Moreover, the PPFs and EPFs of other cities show that there is mutual dependence, but no fixed development law due to weak linkage matching. Therefore, the matching linkage embodies the plausibility and high efficiency of PPFs and EPFs in the observed cities. The good linkage is the pursuit of UME in the future.

4.2. Limitations and Uncertainties

First, the data need to be further improved and added. Collecting and filtering data takes a great deal of time and effort, involving a number of indicators in 334 cities. If we can obtain more data, such as natural data, cultural data, national development strategy, etc., the research precision and reference value of this article will be greatly improved.
Second, the suggestions on the UME need to be further explored. Although this article has put forward suggestions and possible optimization solutions to enhance the UME from multiple perspectives, urban management is still a complicated issue. Especially for China, the largest developing country in the world, the UME is influenced by many factors, such as national planning and local government policies. Thus, the suggestions made in this paper need to be improved in the future.

4.3. Implications and Applications

4.3.1. Advantageous Applications

Urbanization, itself, is likely to drive economic growth. Fundamentally, the urban scale is the determinant of economic diversity [73]. However, if the urbanization rate is too high, the congestion effect will offset the agglomeration effect [74]. It can also cause resource depletion and ecological recession. The superficial reason of weak sustainability is the deterioration of the urban environment, but the root is the low efficiency of management [75]. In China, the “national prejudice” of resource allocation and the administrative level dominate the process of urbanization [76]. High-level cities are more likely to attract central government and foreign investment [77], but medium-sized cities and small cities in backward areas are difficult to attract capital and talent flow because of their weak financial capacity and poor public facilities [78]. Therefore, practical application includes three aspects: (1) to strengthen the agglomeration effect; (2) to promote diversified development models at different scales; and (3) to accelerate resource coordination and sharing.
Compared with previous studies, this paper has three types of scientific values. The first is the value of the data. Data comes from the official website and related statistics, covering 334 Chinese cities. The data is true, reliable, and helpful for other related studies. The second is the ideas and theoretical framework. The paper pays attention to the combination of production factors in traditional and modern economics. More importantly, the integration of statistical and spatial analyses in our study not only quantifies the UME, but also shows the spatial characteristics. Finally, this paper summarizes the management efficiency of Chinese cities in an all-round way, which may provide an important reference for analyzing whether the management efficiency of cities needs to be improved to some extent.
Specifically, the HH areas and HL areas are growing into the regional core, and forming high-quality urban clusters; the HL areas and LL areas are the key areas of town-scale development, also as the secondary core. For those regions with higher environmental pressure, the relationship between energy consumption and environmental protection has to be balanced as soon as possible. Conversely, for those regions with lower environmental pressure, they should share the ecological burden of neighboring cities, tap their own advantages, and seek the sharing of production factors for bearing the ecological burden from neighboring cities. Additionally, the developed cities could be positioned as a large-scale urban growth pole to give the effects of agglomeration and diffusion. As for the less undeveloped cities, they have concerns about the transformation of industry and population, positioning as secondary cores. At the same time, small cities should take efforts to retain their environmental conservation. From the perspective of developmental coordination, the leading role of economy in the hotspot area (based on the PPFs) should be fully played, but it is still necessary to accelerate the sharing of energy consumption and payments of environmental transformation (based on the EPFs).

4.3.2. Implications for Policy-Making

The Chinese government promotes a new urbanization strategy to coordinate the different sizes of urban clusters. In particular, there are two ways to achieve that goal. One is to control the growth of large clusters, and the other is to encourage smaller clusters [79]. In response to the national policy, this paper puts forward some suggestions on how to improve the UME from the perspective of production factors. Its policy significance lies in that it provides urban managers and planners with new ideas for promoting sustainable development and is not limited to improving energy efficiency and technical efficiency. Therefore, there are two future concerns for follow-up research. The first is to expand the scope of efficiency research. The analysis of urban scales is more granular than provincial ones [80] and more systematic than industrial parks [81], businesses [41], and industries [82]. A city is an important carrier of human activities in production and life. The level of UME reflects the sustainability of a city. Secondly, the combination of statistical and spatial analyses is beneficial for visualization and quantitative judgment, which is the trend of quantitative research in the future. Additionally, the purpose of this paper is to make targeted recommendations to guide the sustainable development of Chinese cities through improving the UME. This means urban development should not be limited to artificial boundaries (existing administrative boundaries).
Above all, we have concluded three ways to improve the UME in China. The first one is to balance production factors. That suits the situation when the PPFs and EPFs do not match. The second is to manage in administrative level directly. This can weaken and optimize the administrative settings system, then simplify and streamline the administrative divisions. The last method is to promote the urban agglomeration. Specifically, the urban agglomeration effect could assist a secondary-core city in upgrading to the core of regional development. If the Chinese government wants to improve the UME, it has to give full consideration to the role of PPFs and EPFs and pay more attention to the optimal allocation of land, capital, labor, energy, and environment.

Supplementary Files

Supplementary File 1

Acknowledgments

This paper is supported by “the Fundamental Research Funds for the Central Universities”. Thanks to all reviewers for their valuable advice on this paper.

Author Contributions

Ze Xu analyzed the data and wrote the manuscript. Jianjun Zhang designed the research. Chu Li improved the ideas of this paper. Zhenyu Li, Yongheng Rao, and Tianyu Lu collected the data and drew the graphs.

Conflicts of Interest

All the authors declare no competing financial interests.

References

  1. Krugman, P.; Elizondo, R.L. Trade policy and the third world metropolis. J. Dev. Econ. 1996, 49, 137–150. [Google Scholar] [CrossRef]
  2. Pauchard, A.; Aguayo, M.; Peña, E.; Urrutia, R. Multiple effects of urbanization on the biodiversity of developing countries: The case of a fast-growing metropolitan area (Concepción, Chile). Biol. Conserv. 2006, 127, 272–281. [Google Scholar] [CrossRef]
  3. Ameen, R.F.M.; Mourshed, M. Urban environmental challenges in developing countries—A stakeholder perspective. Habitat Int. 2017, 64, 1–10. [Google Scholar] [CrossRef]
  4. Alonso, W. The economics of urban size. Pap. Reg. Sci. 1971, 26, 66–83. [Google Scholar] [CrossRef]
  5. Stephan, H. The Optimal Size of German Cities an Efficiency Analysis Perspective. In Darmstadt Discussion Papers in Economics; Darmstadt University of Technology: Darmstadt, Germany, 2011. [Google Scholar]
  6. Camagni, R.; Capello, R.; Caragliu, A. One or infinite optimal city sizes? In search of an equilibrium size for cities. Ann. Reg. Sci. 2013, 51, 309–341. [Google Scholar] [CrossRef]
  7. Li, X.; Xu, X.; Chen, H. Temporal and spatial changes of urban efficiency in the 1990s. Acta Geogr. Sin. 2005, 60, 615. [Google Scholar]
  8. Mera, K. Income Distribution and Regional Development; University of Tokyo Press: Tokyo, Japan, 1975; Volume 87, p. 159. [Google Scholar]
  9. David, Q.; Peeters, D.; Van Hamme, G.; Vandermotten, C. Is bigger better? Economic performances of european cities, 1960–2009. Cities 2013, 35, 237–254. [Google Scholar] [CrossRef]
  10. Deilmann, C.; Lehmann, I.; Reißmann, D.; Hennersdorf, J. Data envelopment analysis of cities—Investigation of the ecological and economic efficiency of cities using a benchmarking concept from production management. Ecol. Indic. 2016, 67, 798–806. [Google Scholar] [CrossRef]
  11. Rostaei, S.; Bagheri, M. A study of the function of small towns in local development (Case study: Razan town). PLoS Pathog. 2010, 6, e1001239. [Google Scholar]
  12. Stephen, N. Income inequality and city size: An examination of alternative hypotheses for large and small cities. Rev. Econ. Stat. 1980, 62, 502. [Google Scholar]
  13. Glaeser, E.L. Are Cities Dying? J. Econ. Perspect. 1998, 12, 139–160. [Google Scholar] [CrossRef]
  14. Capello, R.; Camagni, R. Beyond optimal city size: An evaluation of alternative urban growth patterns. Urban Stud. 2000, 37, 1479–1496. [Google Scholar] [CrossRef]
  15. Lu, H.; Campbell, D.E. Ecological and economic dynamics of the shunde agricultural system under China’s small city development strategy. J. Environ. Manag. 2009, 90, 2589–2600. [Google Scholar] [CrossRef] [PubMed]
  16. World Bank. Entering the 21st Century: World Development Report 1999/2000: Summary; World Bank: Washington, DC, USA; Oxford University Press: Oxford, UK, 2000. [Google Scholar]
  17. United Nations. World Urbanization Prospects: The 1999 Revision; United Nations: New York, NY, USA, 2001. [Google Scholar]
  18. Guo, T.; He, S.; Dong, G. Metropolitan resources efficiencies, change trends and causes in china under the goal to build an international metropolis. J. Geogr. Sci. 2011, 21, 746–756. [Google Scholar] [CrossRef]
  19. Liu, Y.; Wang, W.; Ding, C.; Guo, H.; Guo, W.; Yao, L.; Xiong, H.; Tan, H. Metropolis parking problems and management planning solutions for traffic operation effectiveness. Math. Probl. Eng. 2012, 2012, 233–267. [Google Scholar] [CrossRef]
  20. Hiroaki, T.; Kazuhiko, T. Japanese 3R policies based on material flow analysis. J. Ind. Ecol. 2010, 12, 792–798. [Google Scholar]
  21. Leal Filho, W. The new sustainability advantage: Seven business case benefits of a triple bottom line. Int. J. Sustain. High. Educ. 2002, 14. [Google Scholar] [CrossRef]
  22. Huang, J.; Yang, X.; Cheng, G.; Wang, S. A comprehensive eco-efficiency model and dynamics of regional eco-efficiency in China. J. Clean. Prod. 2014, 67, 228–238. [Google Scholar] [CrossRef]
  23. Seppäläa, J.; Melanen, M.; Mäenpää, I.; Koskela, S.; Tenhunen, J.; Hiltunen, M.R. How can the eco-efficiency of a region be measured and monitored? J. Ind. Ecol. 2005, 9, 117–130. [Google Scholar] [CrossRef]
  24. Prud’homme, R.; Lee, C.W. Size, sprawl, speed and the efficiency of cities. Urban Stud. 1999, 36, 1849–1858. [Google Scholar] [CrossRef]
  25. Stuebs, M.; Sun, L. Business reputation and labor efficiency, productivity, and cost. J. Bus. Ethics 2010, 96, 265–283. [Google Scholar] [CrossRef]
  26. Athanassopoulos, A.D.; Karkazis, J. The efficiency of social and economic image projection in spatial configurations. J. Reg. Sci. 1997, 37, 75–97. [Google Scholar] [CrossRef]
  27. Blum, H. The economic efficiency of energy-consuming equipment: A DEA approach. Energy Effic. 2015, 8, 281–298. [Google Scholar] [CrossRef]
  28. Mariano, E.B. Transformation of wealth produced into quality of life: Analysis of the social efficiency of nation-states with the DEA’s triple index approach. J. Oper. Res. Soc. 2014, 65, 1664–1681. [Google Scholar] [CrossRef]
  29. Graham, D.J. Productivity and efficiency in urban railways: Parametric and non-parametric estimates. Transp. Res. Part E 2008, 44, 84–99. [Google Scholar] [CrossRef]
  30. Boame, A.K. The technical efficiency of Canadian urban transit systems. Transp. Res. Part E Logist. Transp. Rev. 2004, 40, 401–416. [Google Scholar] [CrossRef]
  31. Bergendahl, G.; Lindblom, T. Evaluating the performance of swedish savings banks according to service efficiency. Eur. J. Oper. Res. 2008, 185, 1663–1673. [Google Scholar] [CrossRef]
  32. Bannister, G.J.; Stolp, C. Regional concentration and efficiency in mexican manufacturing. Eur. J. Oper. Res. 1995, 80, 672–690. [Google Scholar] [CrossRef]
  33. Van den Bergh, J.C. The GDP paradox. J. Econ. Psychol. 2009, 30, 117–135. [Google Scholar] [CrossRef]
  34. Wang, R.; Zhou, T.; Hu, D.; Li, F.; Liu, J. Cultivating eco-sustainability: Social–economic–natural complex ecosystem case studies in China. Ecol. Complex. 2011, 8, 273–283. [Google Scholar] [CrossRef]
  35. Zhao, T.; Yang, Z. Towards green growth and management: Relative efficiency and gaps of chinese cities. Renew. Sustain. Energy Rev. 2017, 80, 481–494. [Google Scholar] [CrossRef]
  36. Rydin, Y. Environmental Governance for Sustainable Urban Development: A European Model? Local Environ. 1999, 4, 61–65. [Google Scholar] [CrossRef]
  37. Neirotti, P.; De Marco, A.; Cagliano, A.C.; Mangano, G.; Scorrano, F. Current trends in smart city initiatives: Some stylised facts. Cities 2014, 38, 25–36. [Google Scholar] [CrossRef]
  38. Dunn, E.S., Jr. A statistical and analytical technique for regional analysis. Pap. Reg. Sci. 1960, 6, 97–112. [Google Scholar] [CrossRef]
  39. Macmillan, W.D. The estimation and application of multi-regional economic planning models using data envelopment analysis. Pap. Reg. Sci. 1986, 60, 41–57. [Google Scholar] [CrossRef]
  40. Yu, Y.; Wen, Z. Evaluating China’s urban environmental sustainability with data envelopment analysis. Ecol. Econ. 2010, 69, 1748–1755. [Google Scholar] [CrossRef]
  41. Fang, C.; Guan, X.; Lu, S.; Zhou, M.; Deng, Y. Input–output efficiency of urban agglomerations in China: An application of data envelopment analysis (DEA). Urban Stud. 2013, 50, 2766–2790. [Google Scholar] [CrossRef]
  42. Zhang, X.P.; Cheng, X.M.; Yuan, J.H.; Gao, X.J. Total-factor energy efficiency in developing countries. Energy Policy 2011, 39, 644–650. [Google Scholar] [CrossRef]
  43. Farrell, M.J. The measurement of productive efficiency. J. R. Stat. Soc. 1957, 120, 253–290. [Google Scholar] [CrossRef]
  44. Charnes, A.; Cooper, W.W.; Rhodes, E. Measuring the efficiency of decision making unit. Eur. J. Oper. Res. 1978, 2, 429–444. [Google Scholar] [CrossRef]
  45. Cullinane, K.; Wang, T.F.; Song, D.W.; Ji, P. The technical efficiency of container ports: Comparing data envelopment analysis and stochastic frontier analysis. Transp. Res. Part A Policy Pract. 2006, 40, 354–374. [Google Scholar] [CrossRef]
  46. Meeusen, W.; van Den Broeck, J. Efficiency estimation from cobb-douglas production functions with composed error. Int. Econ. Rev. 1977, 18, 435–444. [Google Scholar] [CrossRef]
  47. Aigner, D.; Lovell, C.K.; Schmidt, P. Formulation and estimation of stochastic frontier production function models. J. Econ. 1977, 6, 21–37. [Google Scholar] [CrossRef]
  48. Au, C.C.; Henderson, J.V. Are Chinese cities too small? Rev. Econ. Stud. 2006, 73, 549–576. [Google Scholar] [CrossRef]
  49. Zhang, K.M.; Wen, Z.G. Review and challenges of policies of environmental protection and sustainable development in China. J. Environ. Manag. 2008, 88, 1249. [Google Scholar] [CrossRef] [PubMed]
  50. Ziegler, E.H. China’s cities, globalization, and sustainable development: Comparative thoughts on urban planning, energy, and environmental policy. Metab. Brain Dis. 2006, 5, 1–10. [Google Scholar]
  51. Say, J.B. A treatise on political economy; or the production, distribution, and consumption of wealth. Soc. Sci. Electron. Publ. 2009, 136, 199. [Google Scholar]
  52. Mankiw, N.G.; Phelps, E.S.; Romer, P.M. The growth of nations. Brook. Pap. Econ. Act. 1995, 1995, 275–326. [Google Scholar] [CrossRef]
  53. Xu, B.; Chaudhry, S.S.; Li, Y. Factors of production: Historical theories and new developments. Syst. Res. Behav. Sci. 2009, 26, 219–224. [Google Scholar] [CrossRef]
  54. Daly, H.E. Toward some operational principles of sustainable development. Ecol. Econ. 1990, 2, 1–6. [Google Scholar] [CrossRef]
  55. Zhang, Y.; Yang, Z.; Yu, X. Measurement and evaluation of interactions in complex urban ecosystem. Ecol. Model. 2006, 196, 77–89. [Google Scholar] [CrossRef]
  56. Button, K. City management and urban environmental indicators. Ecol. Econ. 2002, 40, 217–233. [Google Scholar] [CrossRef]
  57. Sveikauskas, L. The productivity of cities. Quart. J. Econ. 1975, 89, 393–413. [Google Scholar] [CrossRef]
  58. Abel, R.J.; Dey, I.; Gabe, T.M. Productivity and the density of human capital. J. Reg. Sci. 2012, 52, 562–586. [Google Scholar] [CrossRef]
  59. Liu, G.; Yang, Z.; Tang, Y.; Ulgiati, S. Spatial correlation model of economy-energy-pollution interactions: The role of river water as a link between production sites and urban areas. Renew. Sustain. Energy Rev. 2016, 69, 1018–1028. [Google Scholar] [CrossRef]
  60. Jain, D.; Tiwari, G. Sustainable Mobility Indicators for Indian Cities: Selection Methodology and Application. Ecol. Indic. 2017, 79, 310–322. [Google Scholar] [CrossRef]
  61. Wang, S.; Hao, J. Air quality management in china: Issues, challenges, and options. J. Environ. Sci. 2012, 24, 2–13. [Google Scholar] [CrossRef]
  62. Moran, P.A.P. Notes on continuous stochastic phenomena. Biometrika 1950, 37, 17–23. [Google Scholar] [CrossRef] [PubMed]
  63. Voss, P.R.; Long, D.D.; Hammer, R.B.; Friedman, S. County child poverty rates in the US: A spatial regression approach. Popul. Res. Policy Rev. 2006, 25, 369–391. [Google Scholar] [CrossRef]
  64. Kao, J.H.; Chan, T.C.; Lai, F.; Lin, B.C.; Sun, W.Z.; Chang, K.W.; Leu, F.Y.; Lin, J.W. Spatial analysis and data mining techniques for identifying risk factors of out-of-hospital cardiac arrest. Int. J. Inform. Manag. 2017, 37, 1528–1538. [Google Scholar] [CrossRef]
  65. Yang, Y.; Wong, K.K. Spatial distribution of tourist flows to China’s cities. Tour. Geogr. 2013, 15, 338–363. [Google Scholar] [CrossRef]
  66. Messner, S.F.; Anselin, L. Spatial analyses of homicide with areal data. Spat. Integr. Soc. Sci. 2004, 12, 127–144. [Google Scholar]
  67. Anselin, L. Local indicators of spatial association—LISA. Geogr. Anal. 1995, 27, 93–115. [Google Scholar] [CrossRef]
  68. Anselin, L.; McCann, M. OpenGeoDa, open source software for the exploration and visualization of geospatial data. In Proceedings of the ACM International Symposium on Advances in Geographic Information Systems, Seattle, DC, USA, 4–6 November 2009. [Google Scholar]
  69. Wang, Z.; Cheng, Y.; Ye, X.; Wei, Y.H. Analyzing the space-time dynamics of innovation in China: Esda and spatial panel approaches. Growth Chang. 2016, 47, 111–129. [Google Scholar] [CrossRef]
  70. Getis, A.; Ord, J.K. The analysis of spatial association by use of distance statistics. Geogr. Anal. 1992, 24, 189–206. [Google Scholar] [CrossRef]
  71. Liang, S. Research on the urban influence domains in China. Int. J. Geogr. Inform. Sci. 2009, 23, 1527–1539. [Google Scholar] [CrossRef]
  72. Wang, K.; Deng, Y.; Sun, D.; Song, T. Evolution and spatial patterns of spheres of urban influence in China. Chin. Geogr. Sci. 2014, 24, 126–136. [Google Scholar] [CrossRef]
  73. Jacobs, J. The Economy of Cities; Random House: New York, NY, USA, 1970. [Google Scholar]
  74. Brülhart, M.; Sbergami, F. Agglomeration and growth: Cross-country evidence. J. Urban Econ. 2009, 65, 48–63. [Google Scholar] [CrossRef]
  75. Van Dijk, M.P.; Mingshun, Z. Sustainability indices as a tool for urban managers, evidence from four medium-sized chinese cities. Environ. Impact Assess. Rev. 2005, 25, 667–688. [Google Scholar] [CrossRef]
  76. Chan, R.C.; Zhao, X.B. The relationship between administrative hierarchy position and city size development in China. GeoJournal 2002, 56, 97–112. [Google Scholar] [CrossRef]
  77. Chen, A.; Partridge, M.D. When are cities engines of growth in China? Spread and backwash effects across the urban hierarchy. Reg. Stud. J. Reg. Stud. Assoc. 2013, 47, 1313–1331. [Google Scholar] [CrossRef]
  78. Zhou, S.; Dai, J.; Bu, J. City size distributions in China 1949 to 2010 and the impacts of government policies. Cities 2013, 32, S51–S57. [Google Scholar] [CrossRef]
  79. Tan, M. Uneven growth of urban clusters in megaregions and its policy implications for new urbanization in China. Land Use Policy 2017, 66, 72–79. [Google Scholar] [CrossRef]
  80. Wu, J.; Zhu, Q.; Chu, J.; Liu, H.; Liang, L. Measuring energy and environmental efficiency of transportation systems in China based on a parallel DEA approach. Transp. Res. Part D Transp. Environ. 2016, 48, 460–472. [Google Scholar] [CrossRef]
  81. Fan, Y.; Bai, B.; Qiao, Q.; Kang, P.; Zhang, Y.; Guo, J. Study on eco-efficiency of industrial parks in China based on data envelopment analysis. J. Environ. Manag. 2017, 192, 107. [Google Scholar] [CrossRef] [PubMed]
  82. Liu, Z.; Qin, C.X.; Zhang, Y.J. Energy-environment efficiency of road and railway sectors in China: Evidence from the provincial level. Ecol. Indic. 2016, 69, 559–570. [Google Scholar] [CrossRef]
Figure 1. Locations of the 334 observed cities in China.
Sustainability 09 02212 g001
Figure 2. The framework of UME based on PPFs and EPFs.
Sustainability 09 02212 g002
Figure 3. Moran’s I of PPFs and EPFs: (a) Moran’s I of PPFs; and (b) Moran’s I of EPFs.
Sustainability 09 02212 g003
Figure 4. LISA of PPFs and EPFs: (a) the clustering result of PPFs; and (b) the clustering result of EPFs.
Sustainability 09 02212 g004aSustainability 09 02212 g004b
Figure 5. Hotspot analysis of PPFs and EPFs: (a) the hotspots and cold spots of PPFs; and (b) the hotspots and cold spots of EPFs.
Sustainability 09 02212 g005
Figure 6. Spatial coordination of city efficiency: (a) the northeast district; (b) the eastern district; (c) the central district; and (d) the western district.
Sustainability 09 02212 g006
Table 1. The index system of UME1.
LevelDataDescription
PPFPopulation densityThe amount of population in per land area, reflecting the number of population resources
Per area GDPThe gross national product in per land area, reflecting the land productivity
Per capita GDPThe gross national production in per person, reflecting the number of capital accumulation
EPFPer area energy consumptionThe degree of energy utilization in regional economic activities, reflecting the energy efficiency
Air quality level two or aboveThe air quality , reflecting the environmental condition
1 The data comes from Prefecture-level Statistical Yearbooks (2015) involving 334 cities, the Provincial Statistical Yearbooks (2015) involving 34 provinces, and the Environment Quality Bulletin (2014) issued by Ministry of Environmental Protection of the People’s Republic of China.

