Regional Ecological Risk Assessment in the Huai River Watershed during 2010–2015

1
Laboratory of Geospatial Technology for the Middle and Lower Yellow River Regions, Ministry of Education, Henan University, Kaifeng 475004, China
2
School of Water Conservancy & Environment, Zhengzhou University, 100 Kexue Avenue, Zhengzhou 450001, China
3
College of Environment and Planning, Henan University, Jinming Avenue, Kaifeng 475004, China
4
Henan Industrial Technology Academy of Spatio-Temporal Big Data, Henan University, Kaifeng 475004, China
5
Key Laboratory of Vegetation Restoration and Management of Degraded Ecosystems, South China Botanical Garden, Chinese Academy of Sciences, Guangzhou 510650, China
6
China Data Center of University of Michigan, Ann Arbor, MI 48106-1248, USA
*
Author to whom correspondence should be addressed.
Sustainability 2017, 9(12), 2231; https://doi.org/10.3390/su9122231
Submission received: 13 October 2017
/
Revised: 26 November 2017
/
Accepted: 30 November 2017
/
Published: 7 December 2017
Abstract
:Ecosystem deterioration has been and is still a serious threat to human survival and regional economic development. Theoretical and methodological challenges exist in assessing ecological risk of watershed ecosystem that is imposed by natural changes or human activities. To fill this research gap, this research proposes an interdisciplinary and quantitative methodology based on some techniques such as the Procedure for Ecological Tiered Assessment of Risk (PETAR), the Entropy, and the Celluar Automata Markov (CA-Markov). We focused on six vulnerable environmental variables, namely land-use change, water quantity, water quality, gross domestic product (GDP), environmental pollutants, and soil erosion in the Huai River watershed in the Henan Province in order to build multi-dimensional quantitative method. Further, the Coupling Coordination Degree Model is constructed, and the “threshold index” is also addressed to reflect the limitation of ecological risk. Our results show that the spatio-temperal distribution of the eco-environmental quality has greatly varied across this study area during different time spans. Natural eco-environmental quality has moderately degraded in 70% of this study area (mainly agricultural region), at a prefectural level from 2000 to 2010, and has slightly improved over the agricultural region (<170 m above sea level) during 2010–2015. However, when considering negative stressors from human social system on the natural ecosystem, the extent and distribution of the ecological risk varied across the whole area during 2000–2015. The results show that there was almost 90.40% of this region under the ecological risk, with varying extents over the study time, e.g., Kaifeng, Shangqiu, Xuchang, and Xinyang, with a moderate deterioration in the eco-environmental quality, and Zhengzhou with a slight deterioration in the eco-environmental quality. This paper provides a valuable perspective for governments at all levels to manage watershed environment resources.
1. Introduction
The watershed ecological environment is a complex social-economic-natural system, consisting of biological community and non-biological factors. It provides important water resources and life-support systems, at different scales, for the survival of plants and animals, as well as people inhabiting inside [1,2,3]. Also, it is the footstone for sustainable development of human societies. Around the world, watershed environments have been severely disturbed and changed, mostly as a result of human activities, such as population expansion, urbanization, increased industrialization, growing demands for water, pollution, and so on. This directly or indirectly resulted in heavy casualties, property losses, and water environment deterioration. These adverse environmental conditions, in turn, will hinder economic development and human well-being improvement. The Water Development Report from the World Health Organization (WHO) and United Nations (UN) showed that water scarcity has affected almost every continent, particularly developing countries. More than two-billion people have suffered, and are still suffering, from the shortage of water resources in more than 40 countries globally: 11 billion people having insufficient drinking water and 24 billion people having no access to clean water and health facilities, mainly distributed in Asia, Africa, and Latin American countries [4,5]. Governments of all levels and scientists around the world have paid more attention on the integrated watershed ecosystem management, both for sustainable developments of water resources and for ecological risk reduction [6,7,8,9]. Methods of ecological risk assessment have been transferred from the environmental impact assessment used widely in environment sciences to watershed ecological environment management. Since then, many ecological risk researches have been conducted at different watersheds across the globe, with the purpose of gathering the detailed information on the current status, spatial-temporal distributions, and existing problems of watershed ecological environment [10].
Ecological risk assessment rooted in the United States in the 1970s. The US Environmental Protection Agency defined the ecological risk assessment in 1992, which was the evaluation process of a certain region due to one or more external factors (mainly construction projects) that may lead to adverse ecological effects. The goal of ecological risk assessment is to help environmental management departments to better understand and predict the relationships between ecological factors and consequences, benefiting the formulation of environmental decision-makings. Ecological risk assessment is developed to predict ecological adverse effects from different kinds of construction projects at micro-scales, or to assess the possibilities of ecological changes due to some factors in the past.
Watershed ecosystem can be greatly different from one construction project to another at small scales, and is a complex geographic region that links surface water and groundwater with climate change, water cycle, land use/cover, and other natural support systems that coupled with human activities, such as point and non-point pollution discharges [11]. Therefore, any change regarding to natural or anthropogenic components may cause immediate or lagged ecological risks in a watershed ecosystem. A study has found that the concentrations of heavy metal pollution in drinking water have been close to or even beyond the safe limits of the WHO guideline values in most countries, particularly in developing worlds, such as India, China, and South Asian countries [12]. Similar work has also been undertaken by the scenario and climate model, showing that water stress will increase (between current conditions and the 2050s) over 62.0–75.8% of total river basin area globally, and decreases over 19.7–29.0% [13]. A more practical method for ecological risk assessment in a watershed should be done as an integral measurement, i.e., from the perspective of the whole watershed, by fully considering the relationships between the up and downstream, water flowing through environmental system, social and economic systems with various land use/cover, soil, and human activities.
Increasing studies of ecological risk assessment have been done at different levels, from a small scale to watershed to country scale [14,15,16,17]. These studies can be broadly traced along two main classifications: (1) the theoretical and methodological research on ecological risk assessment, such as defining ecological risk assessment and factor identification [18,19,20,21]; (2) research on assessing negative impacts that are caused by toxic chemicals from various construction projects [22,23]. A “three-step method”, namely problem formation, risk analysis, and risk characterization, has recently been developed to greatly improve studies of ecological risk assessment. It has gradually evolved into complex approaches for scientifically and quantitatively estimating ecological risks that are imposed by human activities, including the Weight-of-Evidence [24,25], the Procedure for Ecological Tiered Assessment of Risk [26], the Relative Risk Assessment Model [27,28], and the Bayesian Network Approaches [29].
However, some theoretical and methodological challenges still exist in assessing ecological risk of watershed ecosystem due to the complexity and heterogeneity of the watershed ecosystem. Quantitatively identifying the effects of multiple kinds of risk factors (biological, physical, and human-made) is the first constraint in terms of data availability and data collection cost. In addition, some adverse effects are time-lagged, which is hard to be detected in time. The identification of causality between human activities and their effects on endpoints (ecological deterioration, biodiversity loss, and water pollution) is another complicating challenge. The difficulty of this case is that it is hard to identify whether the impacts of anthropological activities are on a key component or some combined components of the watershed ecosystem.
The main objectives of this study were (1) to better understand the spatio-temperal changing trend of watershed ecosystem under land-use change and other contributors; and, (2) to identify the distribution of ecological risk in the study watershed. In this paper, an integrated method that consists of Coupling Coordination Degree Model, CA-Markov, and other models has been constructed to assess the ecological risk in the Huai River watershed in Henan Province during 2010–2015, based on the procedure of Ecological Tiered Assessment of Risk (PETAR).
2. The Methods and Datasets Description
2.1. The Study Area and Dataset Description
The Huai River watershed (within 111.93°–116.64° E, 31.38°–35.01° N) originates in the Tongbai Mountains in Henan Province, and consists of southern Henan, northern Anhui, and northern Jiangsu, with the river eventually entering the Yangtze River at Jiangsu (Figure 1). This river has a mainstream with a length of 417 km and its total drainage area is 87,683.10 km2, accounting for 52.50% of Henan Province. Based on the geographic characteristic and topography of the local river systems, the Huai River watershed is divided into four sub-catchments: the reaches of the Huai River mainstream and southern tributaries (1); the Hong River (2); the Shaying River (3); and, the rivers on the Yudong Plain (4), in corresponding areas of 18,300.60, 15,468.20, 35,082.50, and 18,831.80 km2, respectively. This catchment is situated in the Huai River-Qin Mountains region, which is generally considered as the geographic dividing line between Northern and Southern China. The average annual temperature over the study area is 13–15 °C (1969–2004), with a mean annual precipitation of 634–1200 mm during the same period. There is a clear gradient in precipitation, decreasing from south to north Huai River watershed, with notable seasonality having more than 50% of the annual rainfall occurred from June to September.
This study region covers nine prefectural cities: Zhengzhou, Kaifeng, Shangqiu, Xuchang, Pingdingshan, Luohe, Zhoukou, Zhumadian, and Xinyang, most of which are located in the eastern plains (<200 m above sea level). The cultivated area in this region decreased from 62,982.65 km2 (72.79% of the total area) in 1995 to 59,946.46 km2 (69.16%) in 2015, while the construction land increased from 10,485.11 km2 (12.12%) to 14,133.26 km2 (16.31%) during the same period. It is highly populated with an average population density of 633.97 cap/km2, which is more than four times the national average of 142.48 cap/km2 (2015 survey). By contrast, the gross domestic product (GDP) per capita in this catchment was 21,356.33 ¥, only 60.38% of the national average of 37,002.16 ¥ (2015 survey). The watershed was poorly developed with clear regional differences across cities. The maximum GDP per capita was 77,179 ¥ in Zhengzhou, followed by 50,162 ¥ in Xuchang, and 35,326 ¥ in Kaifeng, and the minimum GDP was 23,728 ¥ in Zhoukou (2015 survey).
According to data for pollution discharge volumes as reported by the Henan Statistical Yearbook 2011 and 2016, issued by the Henan Province Bureau of Statistics, the Huai River watershed in Henan Province has experienced a little change from middle-quality to low-quality eco-environment during 2010–2015, which was mainly attributed to urbanization, water pollutant discharges from industrial and agricultural activities, and air pollutants from industrial point sources and transportation sector. The total waste water discharge in the study area was 1870.52 Mt, nearly 49.36% of the total amount for Henan Province in 2010. The total chemical oxygen demand (COD) and ammonia-nitrogen (NH3-N) were 0.75 Mt and 0.08 Mt, respectively, accounting for 52.17% and 53.33% of the total for Henan Province, respectively. The total sulphur dioxide (SO2) was 0.48 Mt, sharing 35.29% of the total for Henan Province in the same period. In 2015, the total volume of waste water discharge in this watershed was 2423.27 Mt, 56% of the total for Henan Province. The total amounts of COD and NH3-N discharged were 0.79 and 0.08 Mt, accounting for 61% and 62% of the total for Henan Province, respectively. During the same period, the volumes of SO2 emission and nitrogen oxides were 0.51 and 0.60 Mt, sharing 44% and 47% of the total for Henan Province.
The land use/cover dataset in this study were derived from remote sensing images of Landsat TM/ETM+ and Landsat OLI/TIRS in 2010 and 2015 (http://henu.geodata.cn) at the scale of 1:100,000. River systems in the studied region were from a geographic dataset of Henan Province with the scale of 1:250,000. Socio-economic data in the Huai River watershed came from the Statistical Yearbooks in Henan Province from 2001 to 2016, such as population, GDP, and urban population. Environmental data were obtained from the Department of Environmental Protection of Henan Province, including wastewater discharges, water quality, and soil erosion. All of the data used in this study were collected from a municipal level to a county level in this studied area.
2.2. The Integrated Methodology for Ecological Risk Assessment
Following the main procedure of the PETAR method, the integrated method for assessing ecological risk was developed as shown in Figure 2. According to the requirements of the Technical Criterion for Eco-Environmental Status Evaluation (HJ/T192-2006), we chose five main contributors to ecological risk in the Huai River watershed in Henan Province [30]. Five indices were the Biological richness index (BRI), the Vegetation coverage index (VCI), the Density index of river network (DIR), the Land degradation index (LDI), and the Environmental quality index (EQI). These indices can indicate the eco-environment quality in watershed ecosystem, and can couple with the index of urbanization level characterizing the human system [31]. The method for comprehensive ecological risk assessment is described in Equations (1)–(4).
where Cn indicates the degree of mutual influence between these two systems; f(U) and ɡ(E) indicate human system described by land use/land cover and watershed ecosystem, respectively; α, β, γ, λ, δ, and φ are parameters; D indicates the coupling coordination degree of watershed ecological ecosystem and human system; , , , and define urbanization levels from the perspectives of regional population, economy, geographic space, and human society, respectively. The parameters for γ, λ, δ, and φ can be estimated by the gray correlation model and Entropy method.
The classification of ecological risk assessment for the Huai River watershed in Henan Province has been listed as the following Table 1. Four levels of ecological risk assessment were severe degradation, moderate degradation, slight degradation, and no risk, respectively. They were identified by threshold index ranking, which has been defined by the K-means statistical classification method proposed in the Technical Criterion for Eco-Environmental Status Evaluation (HJ/T192-2006).
2.3. The Assessment Methods for Watershed EcosystemVulnerablity to Human Activities
Risk factors of the watershed eco-environment vulnerable to anthropological activities were chosen according to the guidelines of PETAR methods. These vulnerable sub-ecosystems can be described as Biological richness index (BRI), Vegetation coverage index (VCI), Density index of river network (DIR), Land degradation index (LDI), and Environmental quality index (EQI), respectively, which are quantitatively defined as the following Equations (5)–(9):
where Abio, Aveg, Aero, Ariv, Alak, Ares, ACOD, ASOL, and are the normalized indexes, respectively; , , , , , and are land use types for forest land, grass land, water area, cultivated land, construction land, and unused land, respectively; Sriv, Slak, and Vres are the length and areas of river systems, and the volume of water resources, respectively; S is the total area of the studied region; Sero1, Sero2, and Sero3 are the areas for soils suffering mild, moderate to severe erosions, respectively; ECOD, , and ESOL are were the volumes of COD, SO2, and solid waste, respectively; P is regional precipitation. The coefficients in the Equations (5)–(9) are specified in the guidelines of the Technical Criterion for Eco-Environmental Status Evaluation (HJ/T192-2006).
2.4. The Assessment Methodology for Human Contributors
Gradually increasing research for the impacts from human activities on eco-environment risk has been conducted from small-scale construction sites to larger geographical areas [32,33]. Assigning the weights of multiple human contributors to ecological risk is crucial before objective conclusions may be reached. Various methods for weight assignment have been addressed in the process of ecological risk assessment, such as Entropy model, gray correlation model, and fuzzy-based model [34,35]. We choose 15 indicators to evaluate the urbanization of nine cities in Henan Province, and they can be broadly classified into four types, as shown in the following table (Table 2). The weight coefficients of these indicators in this paper can be assigned to corresponding values according to the Entropy method (Equations (10)–(13)).
where ln is the natural logarithm; R is the matrix of n indicators of human system in m cities; yij is normalized data of the matrix R by maximum value to eliminate the units of measurement for data. ej is the Entrop and Wj is the weight value of indicator.
3. Results
3.1. Spatio-Temperal Distributions of Eco-environmental Quality in the Huai River Watershed in Henan Province
The results of eco-environment quality in the Huai River watershed during 2000–2015 are shown in Figure 3a–d, according to the integrated method for assessing ecological risk listed in the Equations (1)–(13). Spatio-temporal variations in eco-environment quality in the study area are observed, but the extents of improvement or deterioration vary across the whole watershed from 2000 to 2015.
As shown in Figure 3a, there is no change in the eco-environmental quality over about 59.51% of the studied watershed during 2000–2005. This area covers the cities of Kaifeng, Shangqiu, Xuchang, Luohe, Zhoukou, and Zhumadian. The Pingdingshan and Zhengzhou cities experience a slight deterioration of eco-environment quality, while there is a slight improvement in Xinyang City during the same period. From 2005 to 2010 (Figure 3b), the eco-environment quality in most areas of this watershed does not change when compared with that during 2005–2010, however, the eco-environment quality in Zhumadian City and Xinyang City slightly degrades, and improves in Zhengzhou and Pingdingshan. Until 2015, the eco-environment quality again experiences no change in this region except for Zhengzhou City as compared with that from 2005 to 2010 (Figure 3c), and the eco-environment quality slightly deteriorates in Zhumadian City at the same period. From the Figure 3d, the eco-environmental quality as a whole does not change in this watershed during 2000–2015, except for Zhengzhou and Zhumadian. There is an obvious deterioration in the eco-environmental quality in Zhengzhou City, and there is a slight deterioration in the eco-environmental quality in Zhumadian City at the same time. In summary, most cities in the studied region does not experience an obvious spatio-temperal change in the eco-environmental quality during 2000–2015, however, Zhengzhou, Pingdingshan, and Xinyang present some change from improvement to deterioration or vice versa during the different periods.
3.2. Spatio-Temperal Distributions of Ecological Risk in the Huai River watershed in Henan Province
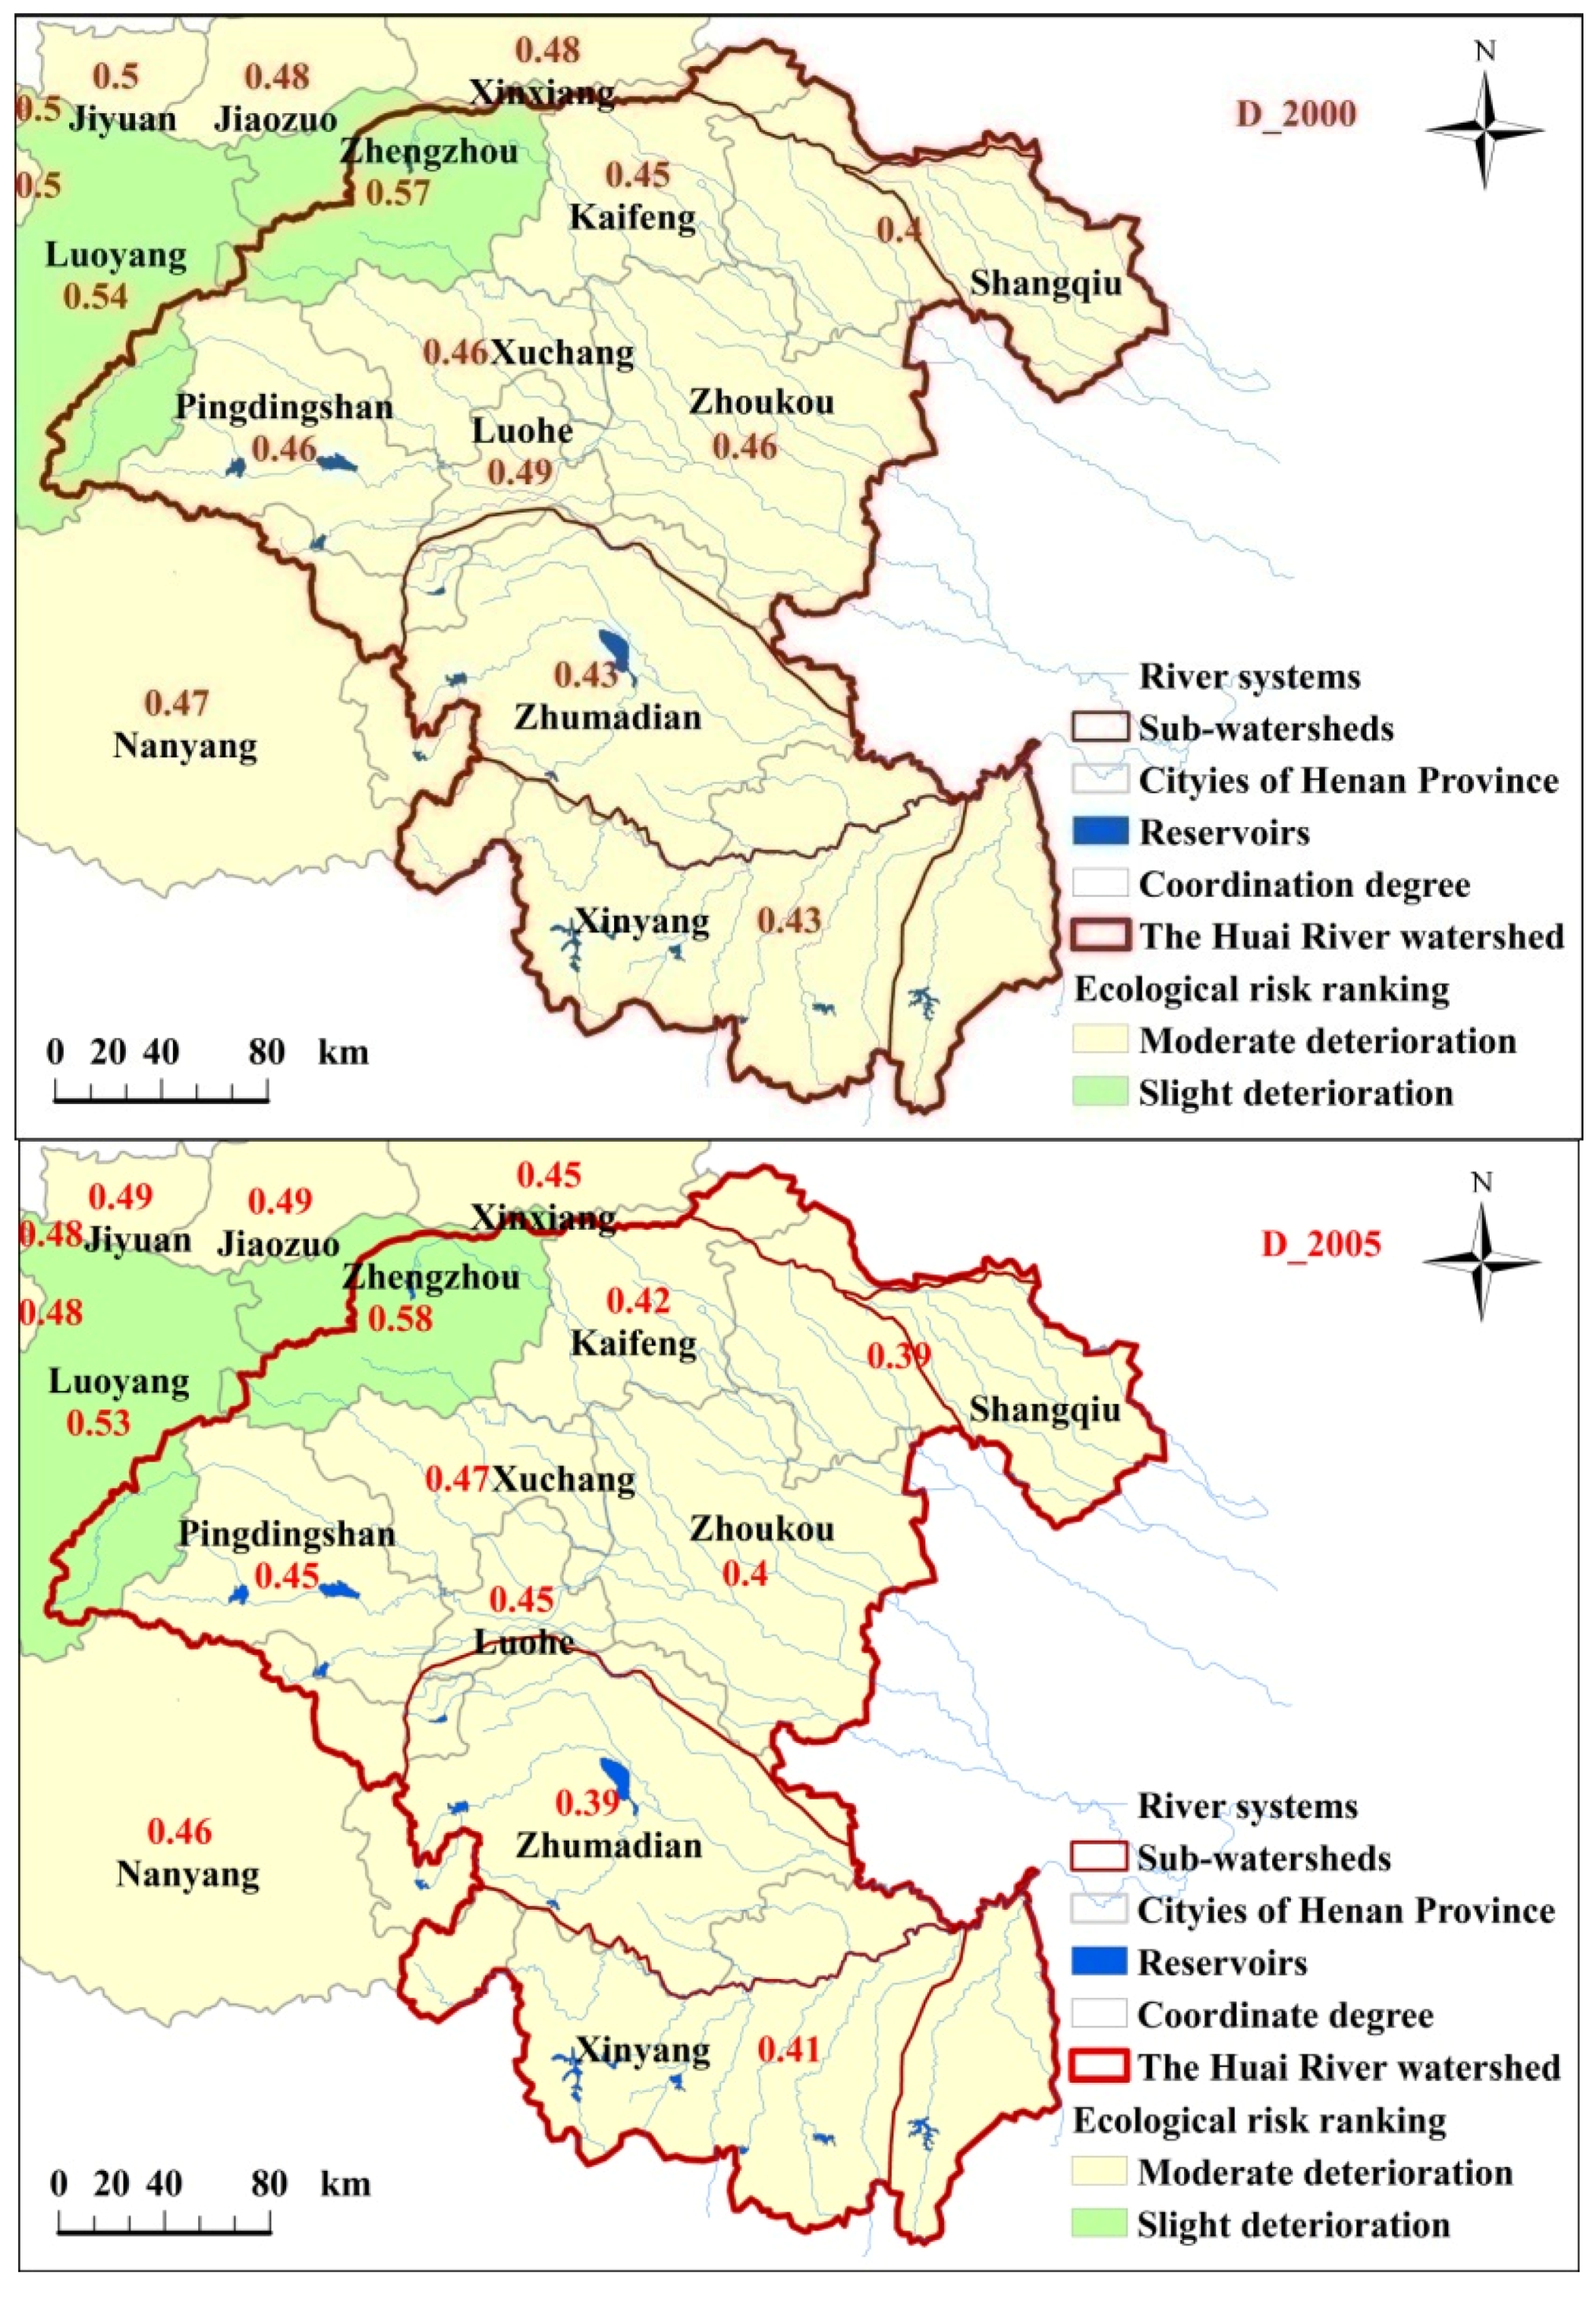
The spatio-temperal distributions of ecological risk were estimated (as shown in Figure 4) according to the Equations (1)–(13), and the factors listed in the Table 2.
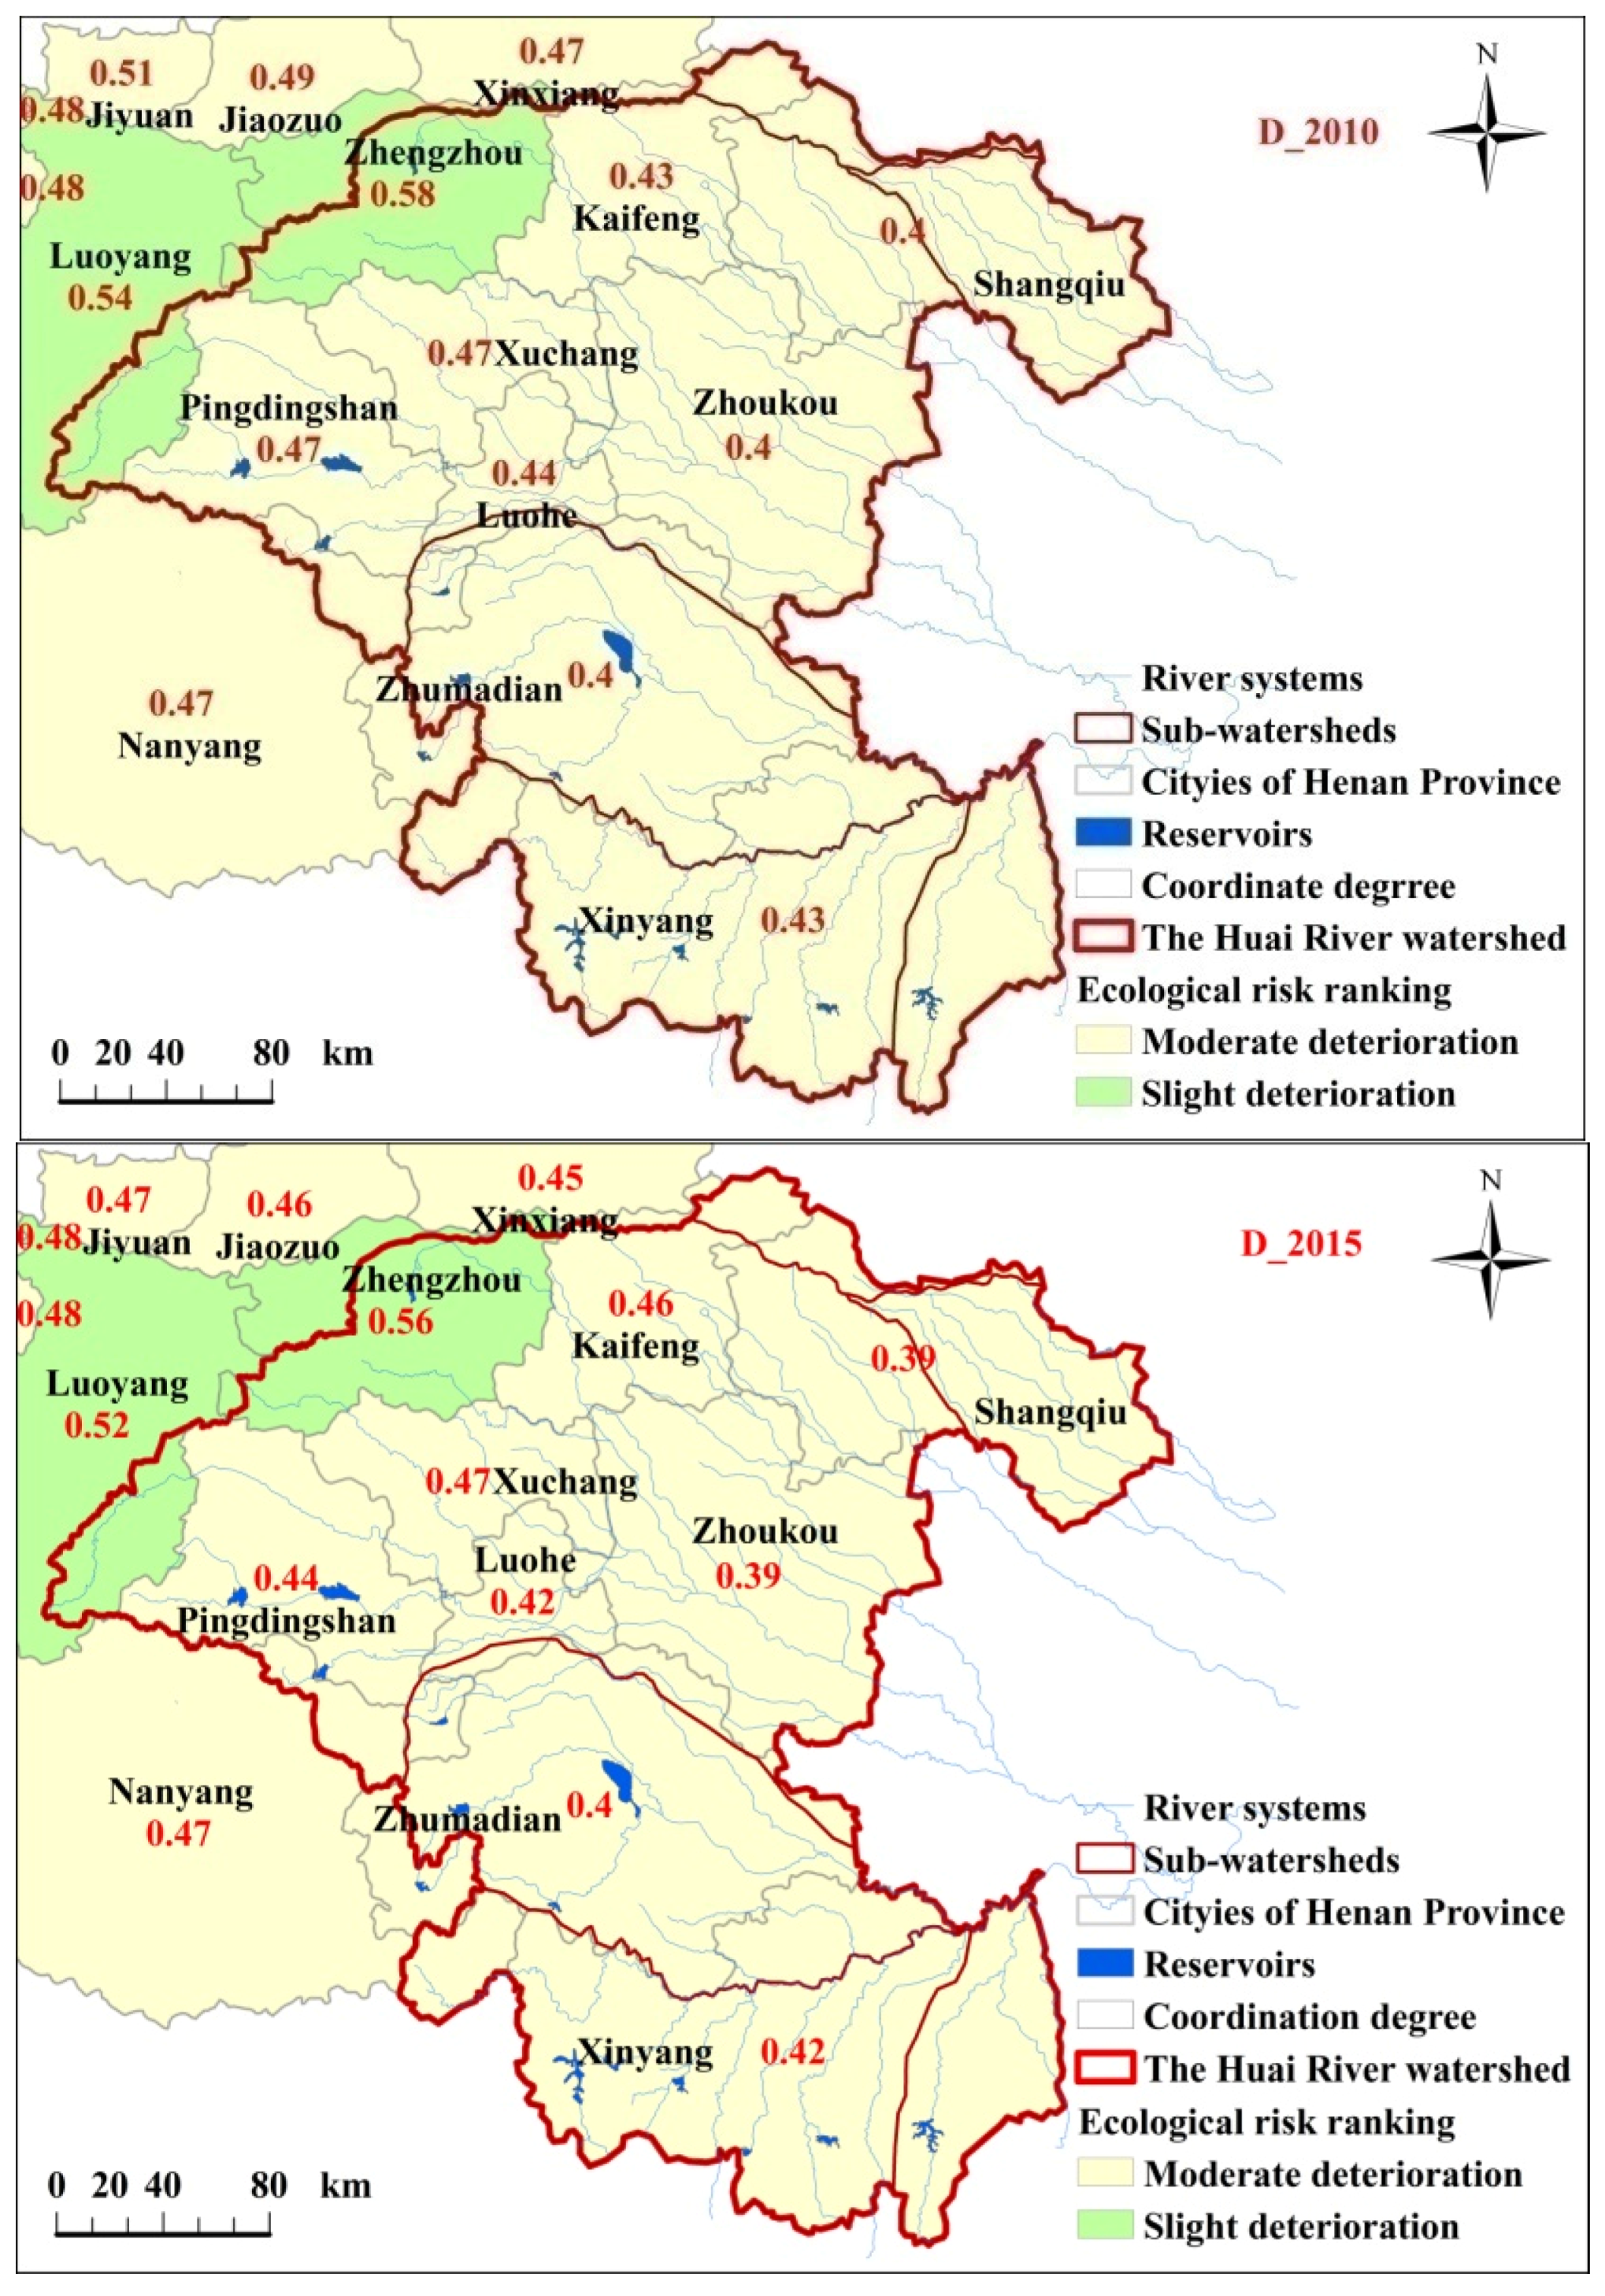
After the contributors of human system coupled with the indicators of ecological ecosystem at a watershed, the coupling coordination degrees (D) of ecological ecosystem and human system, as shown in the D_2000, D_2005, D_2010, and D_2015 of Figure 4, show that 90.40% of the region is under ecological risk during 2010–2015. The areas include the cities of Kaifeng, Shangqiu, Xuchang, Zhoukou, Pingdingshan, Zhumadian, and Xinyang, which are mainly located in the plain area of the Huai River watershed in the Henan Province. By contrast, only Zhengzhou City experiences ecological risk at slight level during the same period.
In the D_2000 of Figure 4, we can observe that the values of the coupling coordination degrees are less than 0.50 in Kaifeng (D = 0.45), Shangqiu (D = 0.40), Xuchang (D = 0.46), Zhoukou (D = 0.46), Pingdingshan (D = 0.46), Luohe (D = 0.49), Zhumadian (D = 0.43), and Xinyang (D = 0.43) in the year 2000, that is, the eco-environmental quality in these cities are all in the moderate deterioration. The eco-environmental quality in Zhengzhou City (D = 0.57), however, is in the slight deterioration at the same time. As shown in the D_2005 of Figure 4, the eco-environmental quality in this study area has the similar spatial distribution as that in the D_2000 of Figure 4. The values of the coupling coordination degrees are 0.42 (Kaifeng), 0.39 (Shangqiu), 0.47 (Xuchang), 0.40 (Zhoukou), 0.45 (Pingdingshan), 0.45 (Luohe), 0.39 (Zhumadian), 0.41 (Xinyang), and 0.58 (Zhengzhou), respectively, in the year 2005. These cities are all in the moderate deterioration in the eco-environmental quality, except for Zhengzhou City (D = 0.57). We also find that the eco-environmental quality has hardly changed in this study area in the year 2010 (as shown in the D_2010 of Figure 4), namely Kaifeng (D = 0.43), Shangqiu (D = 0.40), Xuchang (D = 0.47), Zhoukou (D = 0.40), Pingdingshan (D = 0.47), Luohe (D = 0.44), Zhumadian (D = 0.40), and Xinyang (D = 0.43), respectively. The value of the coupling coordination degree equals to 0.58 in Zhengzhou City, greater than 0.50, which is, Zhengzhou experiences the moderate deterioration in the eco-environmental quality at the same period. Until the year 2015, the values of the coupling coordination degrees in this region range from 0.39 to 0.47 (less than 0.50), e.g., D equals to 0.46 in Kaifeng City, 0.39 in Shangqiu City, 0.47 in Xuchang City, 0.44 in Pingdingshan City, 0.42 in Luohe City, 0.40 in Zhumadian City, and 0.42 in Xinyang City, respectively. The eco-environmental quality in the above mentioned cities is in the moderate deterioration in 2015. When compared with those cities, the eco-environmental quality (D = 0.56) in Zhengzhou City is the moderate deterioration at the same period.
4. Conclusions and Discussion
In this paper, we proposed an integrated method to assess the ecological risk across the Huai River watershed in Henan Province. Our results showed changes in the spatio-temperal distributions of eco-environment quality in this watershed during 2000–2015 at a prefectural scale. The risk impacts of human activities on vulnerable watershed ecosystem were also quantitatively evaluated by the “threshold index”, as described in the integrated method, and conclusions have been drawn in this paper. From the perspective of natural eco-environmental quality, the spatio-temperal distribution of the ecological environment has greatly varied across this study area during different time spans. The eco-environmental quality has moderately deteriorated in nearly 70% of this study area (mainly agricultural region) at a prefectural level from 2000 to 2010, and has slightly improved over the agricultural region (<170 m above sea level) during 2010–2015. After the negative contributors from human social system have been imposed on the natural ecosystem in this study area, the extent and distribution of ecosystem risk varied across the whole area during 2000–2015. Our findings show that there existed about 90.40% of this region under the ecological risk, with varying extents across the study time, e.g., Kaifeng, Shangqiu, Xuchang, Zhoukou, Pingdingshan, Zhumadian, and Xinyang, where the eco-environmental quality is mainly in the moderate deterioration. When compared with these cities, there is the slight deterioration in the eco-environmental quality in Zhengzhou City. The contributors chosen from human social system and the indicators selected from natural ecosystem, together with the integrated method for ecological risk assessment in this study, can be used in other watersheds of China. However, there exist some limitations in this study. One limitation of this study is that we only examined the risk impacts of human activities on natural ecosystem in the Huai River watershed in Henan Province, mainly focusing on biological richness, land cover, soil erosion, and so on. For example, we did not investigate the relationship between water pollutants (such as COD, heavy metal, and NH3-N) and wildlife health (e.g., animal extinction and biodiversity loss). As a result, the effects of water pollution discharges on wildlife health have not been assessed at a regional scale. In future, the tools and methods from medical science and social investigation might be introduced into the ecological risk assessment in order to better detect the relationship between pollutants and animal health.
Another limitation is that the threshold index for the ecological risk assessment needs to be further studied. In this paper, we specified the threshold index for risk ranking according to the Technical Criterion for Eco-Environmental Status Evaluation (HJ/T192-2006), in order to compare with the ecological risk assessment in other watersheds in China. Then, the spatio-temperal distribution of ecological risk assessment at a national scale can be made for scientific decision-makings. However, a specific threshold index for ecological risk assessment should be aimed to a specific region, and can be improved by other methods, e.g., Bayesian network approaches [36], artificial neural network [37], and ecosystem services [38,39].
Governors and researchers around the world have paid more attention on ecological risk that is imposed by human activities over various scales, for example, regional or local ecosystems [40,41]. Existing studies showed that ecological risk assessment resulting from the human system has been facing a lot of theoretical and methodological challenges. For instance, some effects of human activities are hard to be identified or quantified due to their indirect and lagged characteristics, which will introduce uncertainties in assessing ecological risk. Also, causal ambiguity in multiple stressors and multiple receptors often constrain our understandings of the relationship between human and nature. Consequently, more information and methods might be required to models and tools that relate the stressors from human social system and the receptors from natural ecosystem. Furthermore, growing studies will be also needed with these models in future to evaluate whether the negative impacts of anthropological activities have exceeded the “threshold value” of watershed ecosystems in other regions globally, with the purpose of balancing the nature health and human development.
Acknowledgments
This work was supported by a grant from the National Science Foundation of China (71203200), the National Science and Technology Platform Construction Project (2005DKA32300), and the Major Research Projects of the Ministry of Education (16JJD770019). We are grateful for these supports. We also thank the National Science & Technology Infrastructure of China, Data Sharing Infrastructure of Earth System Science-Data Center of Lower Yellow River Regions (http://henu.geodata.cn). The authors would like to express appreciation to colleagues and graduate students in our laboratory for their valuable comments and help. We are very grateful to three anonymous peer-reviewers for their comments and constructive suggestions.
Author Contributions
Yan Lu and Fen Qin designed the research, and Zhongbing Chang collected and analyzed the data. Yan Lu wrote the manuscript. Shuming Bao helped us with the improvement of our manuscript.
Conflicts of Interest
The authors declare no conflict of interest.
References
- Parmesan, C.; Yohe, G. A globally coherent fingerprint of climate change impacts across natural systems. Nature 2003, 421, 37–42. [Google Scholar] [CrossRef] [PubMed]
- Sala, O.E.; Chapin, F.S.; Armesto, J.J.; Berlow, E.; Bloomfield, J.; Dirzo, R.; Huber-Sanwald, E.; Huenneke, L.F.; Jackson, R.B.; Kinzig, A.; et al. Biodiversity—Global biodiversity scenarios for the year 2100. Science 2000, 287, 1770–1774. [Google Scholar] [CrossRef] [PubMed]
- Xu, X.; Lin, H.; Fu, Z. Probe into the method of regional ecological risk assessment—A case study of wetland in the Yellow River Delta in China. J. Environ. Manag. 2004, 70, 253–262. [Google Scholar] [CrossRef] [PubMed]
- The United Nations (UN). The United Nations World Water Development Report: Water for People, Water for life 2003 report. WWA Programme; UN: New York, NY, USA, 2003. [Google Scholar]
- WHO/UNICEF (World Health Organization/United Nations Children’s Fund). Global Water Supply and Sanitation Assessment 2000 Report; WHO/UNICEF: Geneva, Switzerland, 2000. [Google Scholar]
- Heathcote, I.W.; Edwards, J.R.; Greener, H.; Coombs, H.M. Integrated Watershed Management: Principles and Practice; Taylor & Francis: Abingdon-on-Thames, UK, 1998. [Google Scholar]
- Pitt, R. Integrated Watershed Management. In World Environmental and Water Resource Congress 2006: Examining the Confluence of Environmental and Water Concerns; American Society of Civil Engineers: Reston, VA, USA, 2006; pp. 1–10. [Google Scholar]
- Dixon, J.A.; Easter, K.W. Integrated watershed management: An approach to resource management. In Watershed Resource Management: Studies from Asia and the Pacific; Institute of Southeast Asian Studies: Singapore, 1991; pp. 3–15. [Google Scholar]
- Bulkley, J.W. Integrated watershed management: Past, present, and future. J. Contemp. Water Res. Educ. 2011, 100, 3. [Google Scholar]
- Hunsaker, C.T.; Graham, R.L.; Suter, G.W.; O’Neill, R.V.; Barnthouse, L.W.; Gardner, R.H. Assessing ecological risk on a regional scale. Environ. Manag. 1990, 14, 325–332. [Google Scholar] [CrossRef]
- Xu, Y.; Gao, J.; Zhao, J.; Chen, J. The research progress and prospect of watershed ecological risk assessment. Acta Ecol. Sin. 2012, 32, 284–292. (In Chinese) [Google Scholar]
- Fernández-Luqueño, F.; López-Valdez, F.; Gamero-Melo, P.; Luna-Suárez, S.; Aguilera-González, E.N.; Martinez, A.I.; Garcia-Guillermo, M.D.S.; Hernández-Martínez, G.; Herrera-Mendoza, R.; Álvarez-Garza, M.A.; et al. Heavy metal pollution in drinking water-a global risk for human health: A review. Afr. J. Environ. Sci. Technol. 2013, 7, 567–584. [Google Scholar]
- Alcamo, J.; Flörke, M.; Märker, M. Future long-term changes in global water resources driven by socio-economic and climatic changes. Hydrol. Sci. J. 2007, 52, 247–275. [Google Scholar] [CrossRef]
- Wang, G.; Cheng, G.; Qian, J. Several problems in ecological security assessment research. Chin. J. Appl. Ecol. 2003, 14, 1551–1556. (In Chinese) [Google Scholar]
- Fu, B.; Liu, G.; Wang, X.; Ouyang, Z. Ecological issues and risk assessment in China. Int. J. Sustain. Dev. World Ecol. 2004, 11, 143–149. [Google Scholar] [CrossRef]
- Serveiss, V.B. Applying ecological risk principles to watershed assessment and management. Environ. Manag. 2002, 29, 145–154. [Google Scholar] [CrossRef]
- Detenbeck, N.E.; Batterman, S.L.; Brady, V.J.; Brazner, J.C.; Snarski, V.M.; Taylor, D.L.; Thompson, J.A.; Arthur, J.W. A test of watershed classification systems for ecological risk assessment. Environ. Toxicol. Chem. 2000, 19, 1174–1181. [Google Scholar] [CrossRef]
- Fu, Z.; Xu, X. Regional ecological risk assessment. Adv. Earth Sci. 2001, 16, 267–271. (In Chinese) [Google Scholar]
- Gibbs, M. Ecological risk assessment, prediction, and assessing risk predictions. Risk Anal. 2011, 31, 1784–1788. [Google Scholar] [CrossRef] [PubMed]
- Adams, S.M.; Power, M. Assessing the current status of ecological risk assessment. Environ. Manag. 1997, 21, 825–830. [Google Scholar]
- Zhou, T.; Meng, J. Research progress in regional ecological risk assessment methods. Chin. J. Ecol. 2009, 28, 31. [Google Scholar]
- Lu, H.; Zeng, G.; Xie, G.; Zhang, S.; Huang, G.; Jin, X.; Liu, H. The regional ecological risk assessment of the Dongting Lake watershed. Acta Ecol. Sin. 2002, 23, 2520–2530. [Google Scholar]
- Xu, X.; Yang, G.; Tan, Y.; Zhuang, Q.; Li, H.; Wan, R.; Su, W.; Zhang, J. Ecological risk assessment of ecosystem services in the Taihu Lake Basin of China from 1985 to 2020. Sci. Total Environ. 2016, 554, 7–16. [Google Scholar] [CrossRef] [PubMed]
- Linkov, I.; Loney, D.; Cormier, S.; Satterstrom, F.K.; Bridges, T. Weight-of-evidence evaluation in environmental assessment: Review of qualitative and quantitative approaches. Sci. Total Environ. 2009, 407, 5199–5205. [Google Scholar] [CrossRef] [PubMed]
- Jiang, Y.; Liu, Y.; Ying, G.; Wang, H.; Liang, Y.; Chen, X. A new tool for assessing sediment quality based on the Weight of Evidence approach and grey TOPSIS. Sci. Total Environ. 2015, 537, 369–376. [Google Scholar] [CrossRef] [PubMed]
- Moraes, R.; Molander, S. A procedure for ecological tiered assessment of risks (PETAR). Hum. Ecol. Risk Assess. 2004, 10, 349–371. [Google Scholar] [CrossRef]
- Brien, G.C.O.; Wepener, V. Regional-scale risk assessment methodology using the Relative Risk Model (RRM) for surface freshwater aquatic ecosystems in South Africa. Water SA 2012, 38, 153–166. [Google Scholar]
- Liu, J.; Chen, Q.; Li, Y. Ecological risk assessment of water environment for Luanhe River Basin based on relative risk model. Ecotoxicology 2010, 19, 1400–1415. [Google Scholar] [CrossRef] [PubMed]
- Pollino, C.A.; Woodberry, O.; Nicholson, A.; Korb, K.; Hart, B.T. Parameterisation and evaluation of a Bayesian network for use in an ecological risk assessment. Environ. Model. Softw. 2007, 22, 1140–1152. [Google Scholar] [CrossRef]
- Ministry of Environmental Protection of the People’s Republic of China. Technical Criterion for Eco-Environmental Status Evaluation (HJ/T192-2006); China Environmental Science Press: Beijing, China, 2006. (In Chinese)
- Wang, S.; Fang, C.; Wang, Y. Quantitative investigation of the interactive coupling relationship between urbanization and eco-environment. Acta Sin. 2015, 35, 2244–2254. (In Chinese) [Google Scholar]
- Meng, J.; Zhao, C. Research progress on index system of regional ecological risk assessment. Chin. J. Appl. Ecol. 2009, 20, 983–990. (In Chinese) [Google Scholar]
- Hu, B.; Zhao, X.; Liu, H.; Liu, Z.; Song, T.; Wang, Y.; Tang, L.; Xia, X.; Tang, G.; Ji, D.; et al. Quantification of the impact of aerosol on broadband solar radiation in North China. Sci. Rep. 2017, 7, 44851. [Google Scholar] [CrossRef] [PubMed]
- Gao, C.; Chen, X.; Wei, C.; Peng, X. Application of entropy weight and fuzzy synthetic evaluation in urban ecological security assessment. Chin. J. Appl. Ecol. 2006, 17, 1923–1927. (In Chinese) [Google Scholar]
- Huang, H.; Peng, X.; Kong, F.; Zhang, L. Evaluation of ecological economy index in the Poyang Lake ecological economic zone. Acta Ecol. Sin. 2014, 34, 3107–3114. (In Chinese) [Google Scholar] [CrossRef]
- Mcdonald, K.S.; Ryder, D.S.; Tighe, M. Developing best-practice Bayesian Belief Networks in ecological risk assessments for freshwater and estuarine ecosystems: A quantitative review. J. Environ. Manage. 2015, 154, 190–200. [Google Scholar] [CrossRef] [PubMed]
- Ni, J.R.; Xue, A. Application of artificial neural network to the rapid feedback of potential ecological risk in flood diversion zone. Eng. Appl. Artif. Intell. 2003, 16, 105–119. [Google Scholar] [CrossRef]
- Munns, W.R., Jr.; Rea, A.W.; Suter, G.W., II; Martin, L.; Blake-Hedges, L.; Crk, T.; Davis, C.; Jordan, S.; Mahoney, M.; Barron, M.G. Ecosystem services as assessment endpoints for ecological risk assessment. Integr. Environ. Assess. Manag. 2016, 12, 522–528. [Google Scholar] [CrossRef] [PubMed]
- Faber, J.H.; Van, W.J. Elaborations on the use of the ecosystem services concept for application in ecological risk assessment for soils. Sci. Total Environ. 2012, 415, 3–8. [Google Scholar] [CrossRef] [PubMed]
- Graham, R.L.; Hunsaker, C.T.; O’Neill, R.V.; Jackson, B.L. Ecological Risk Assessment at The Regional Scale. Ecol. Appl. A Publ. Ecol. Soc. Am. 1991, 1, 196–206. [Google Scholar] [CrossRef] [PubMed]
- Leuven, R.S.E.W.; Poudevigne, I. Riverine landscape dynamics and ecological risk assessment. Freshw. Bio. 2010, 47, 845–865. [Google Scholar] [CrossRef]
Figure 1.
Geographical location of the studied area in the Huai River watershed in Henan Province.
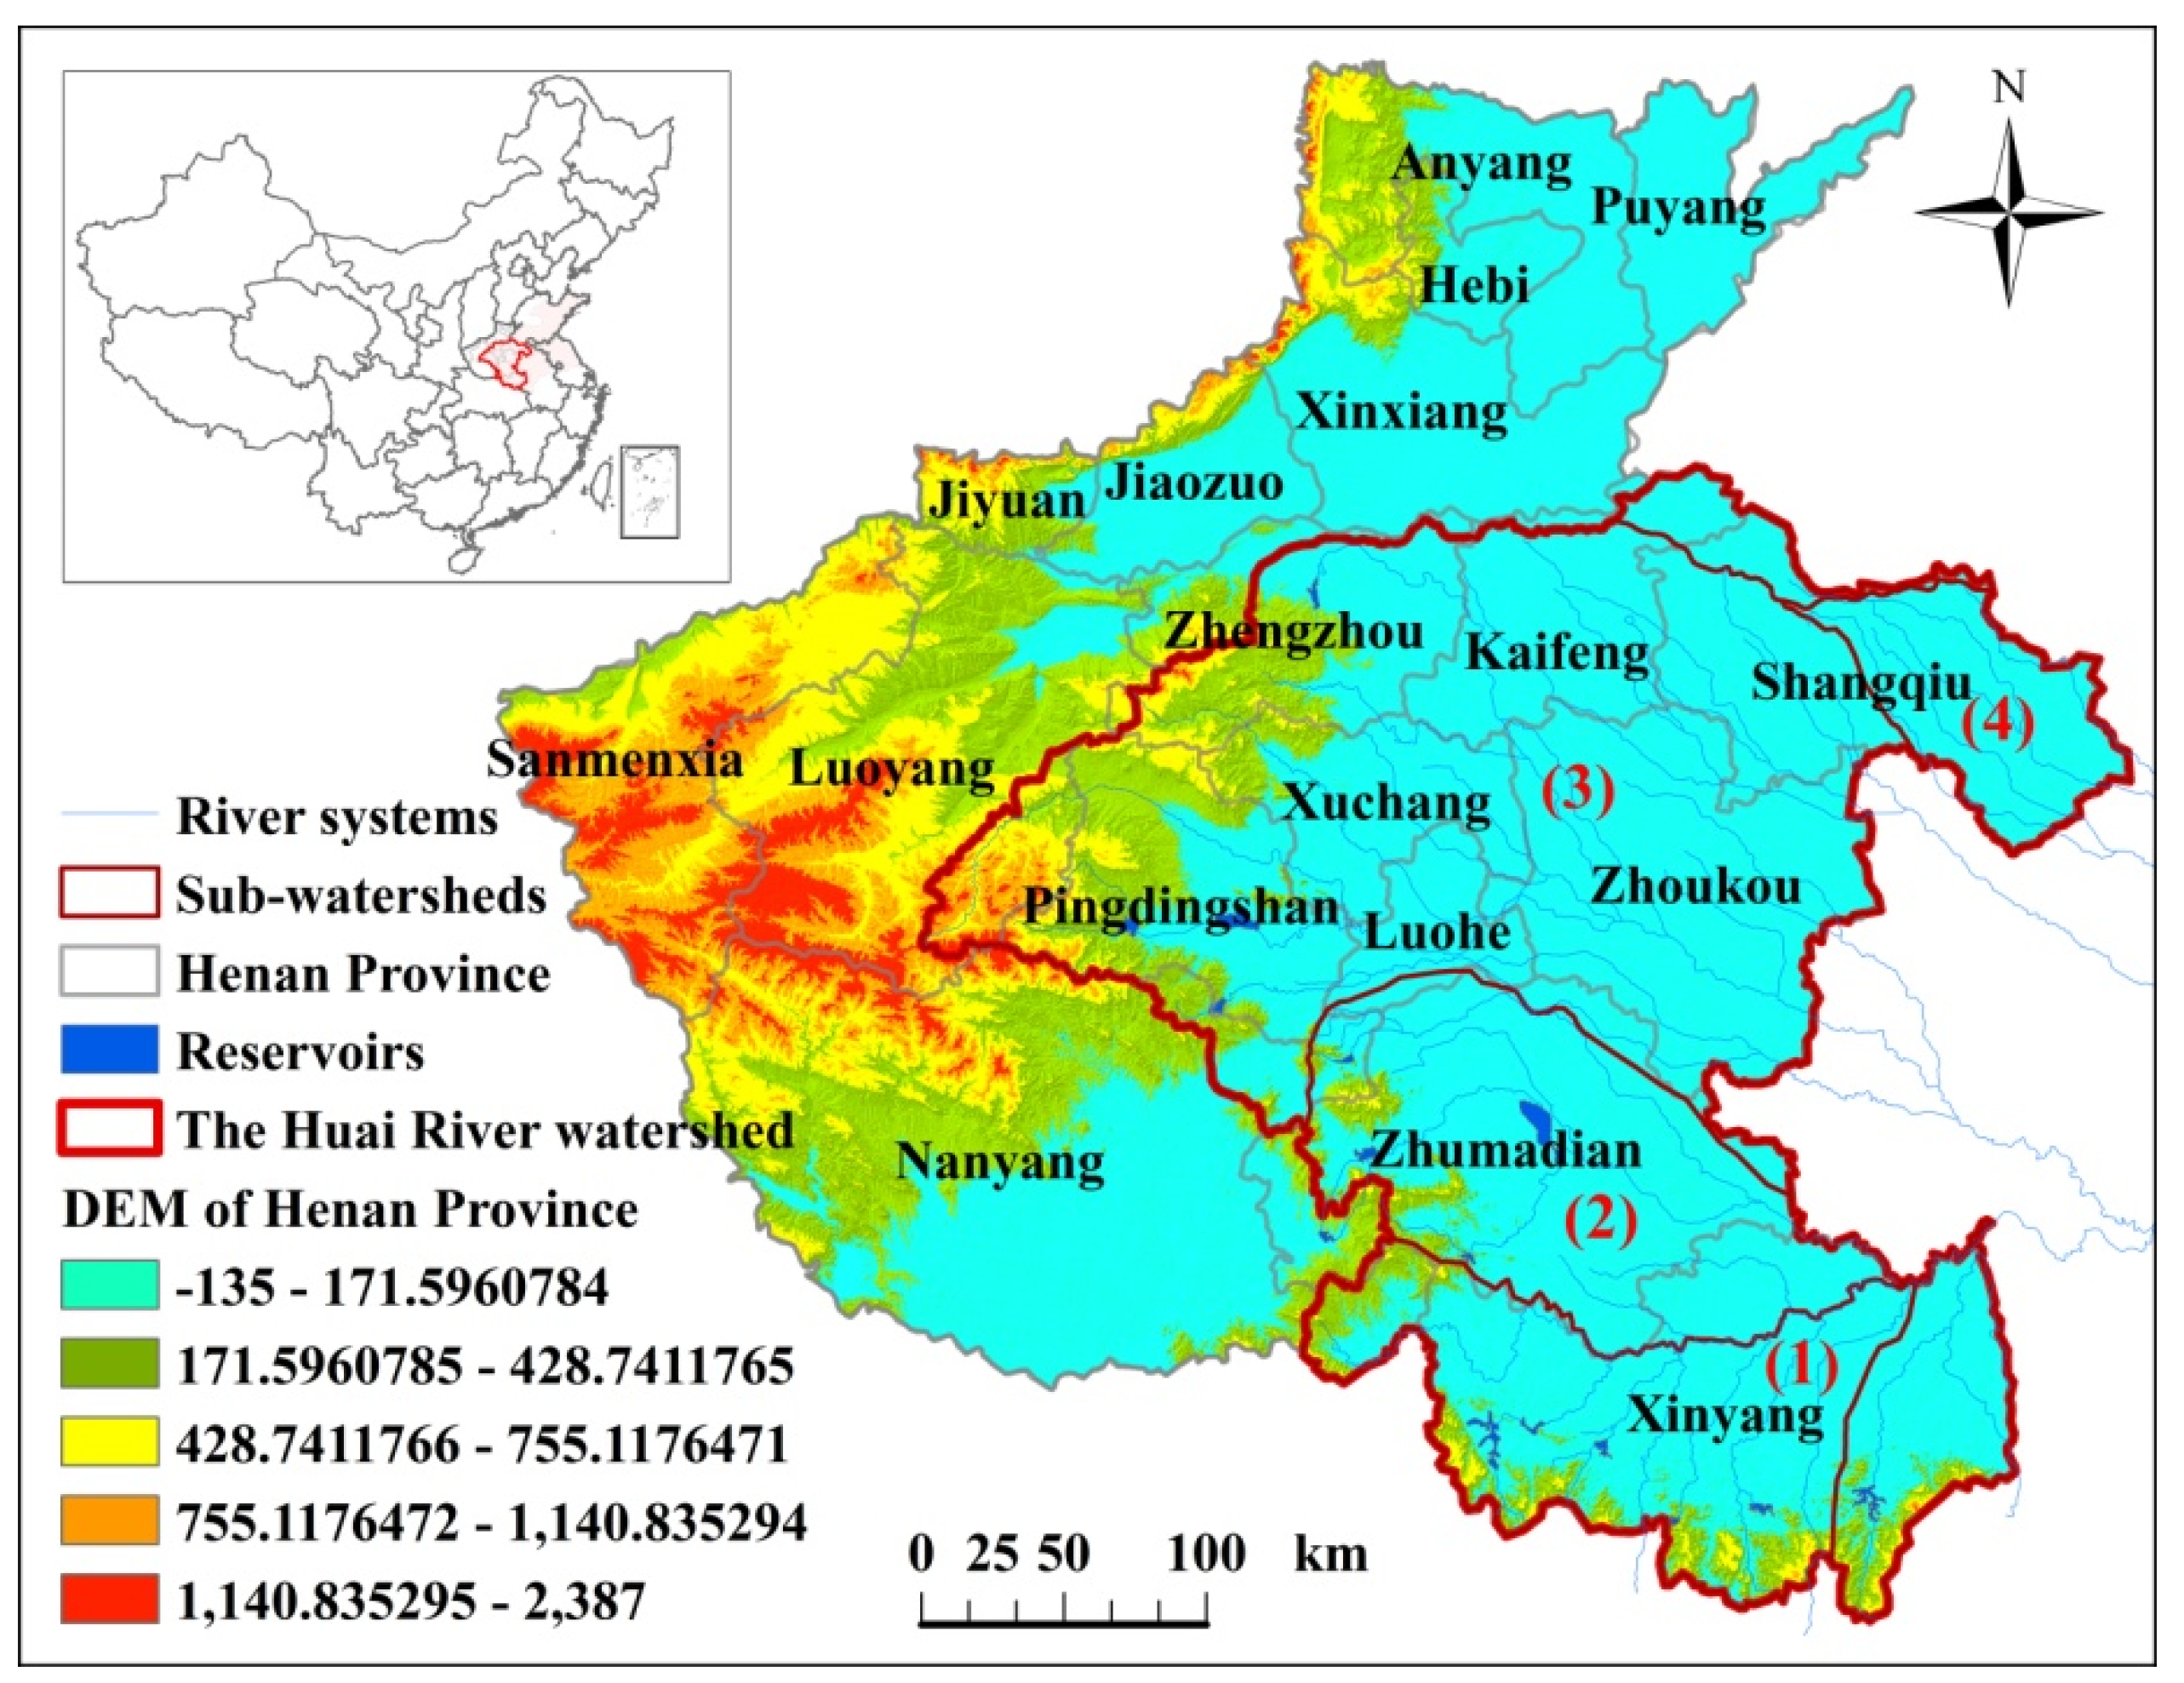
Figure 2.
The framework for the ecological risk assessment in the Huai River watershed in Henan Province.
Figure 2.
The framework for the ecological risk assessment in the Huai River watershed in Henan Province.

Figure 3.
The spatio-temperal distribution of eco-environment quality in the Huai River watershed in Henan Province during 2000–2015. The symbols for (a–d) here represent the changes for eco-environment quality in this region during 2000–2005, 2005–2010, 2010–2015, and 2000–2015, respectively.
Figure 3.
The spatio-temperal distribution of eco-environment quality in the Huai River watershed in Henan Province during 2000–2015. The symbols for (a–d) here represent the changes for eco-environment quality in this region during 2000–2005, 2005–2010, 2010–2015, and 2000–2015, respectively.
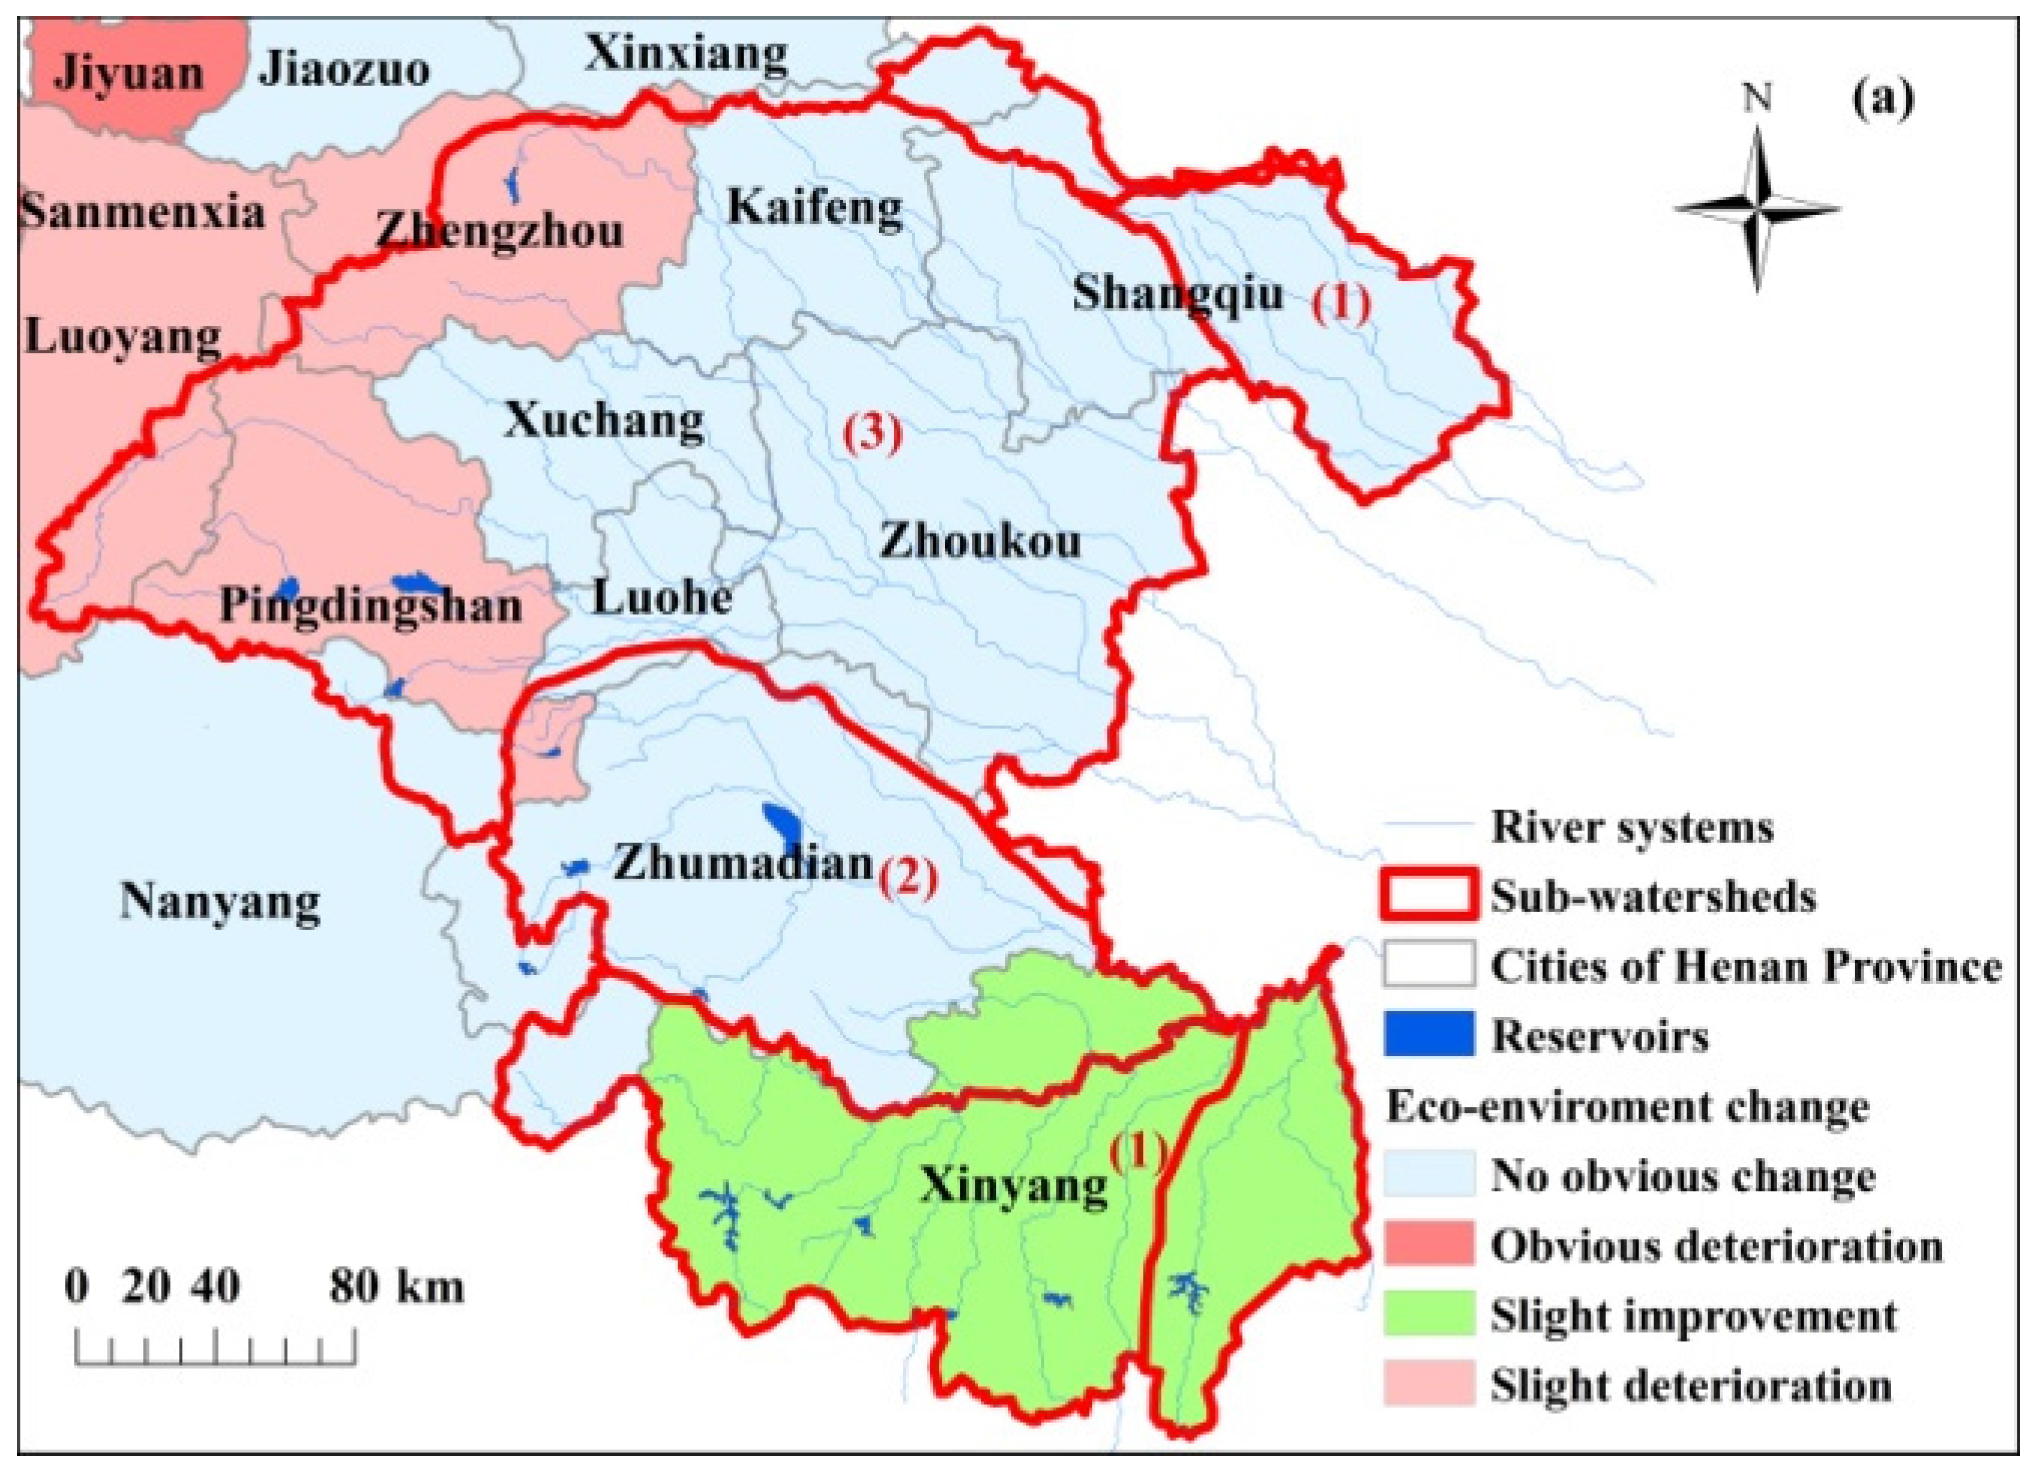
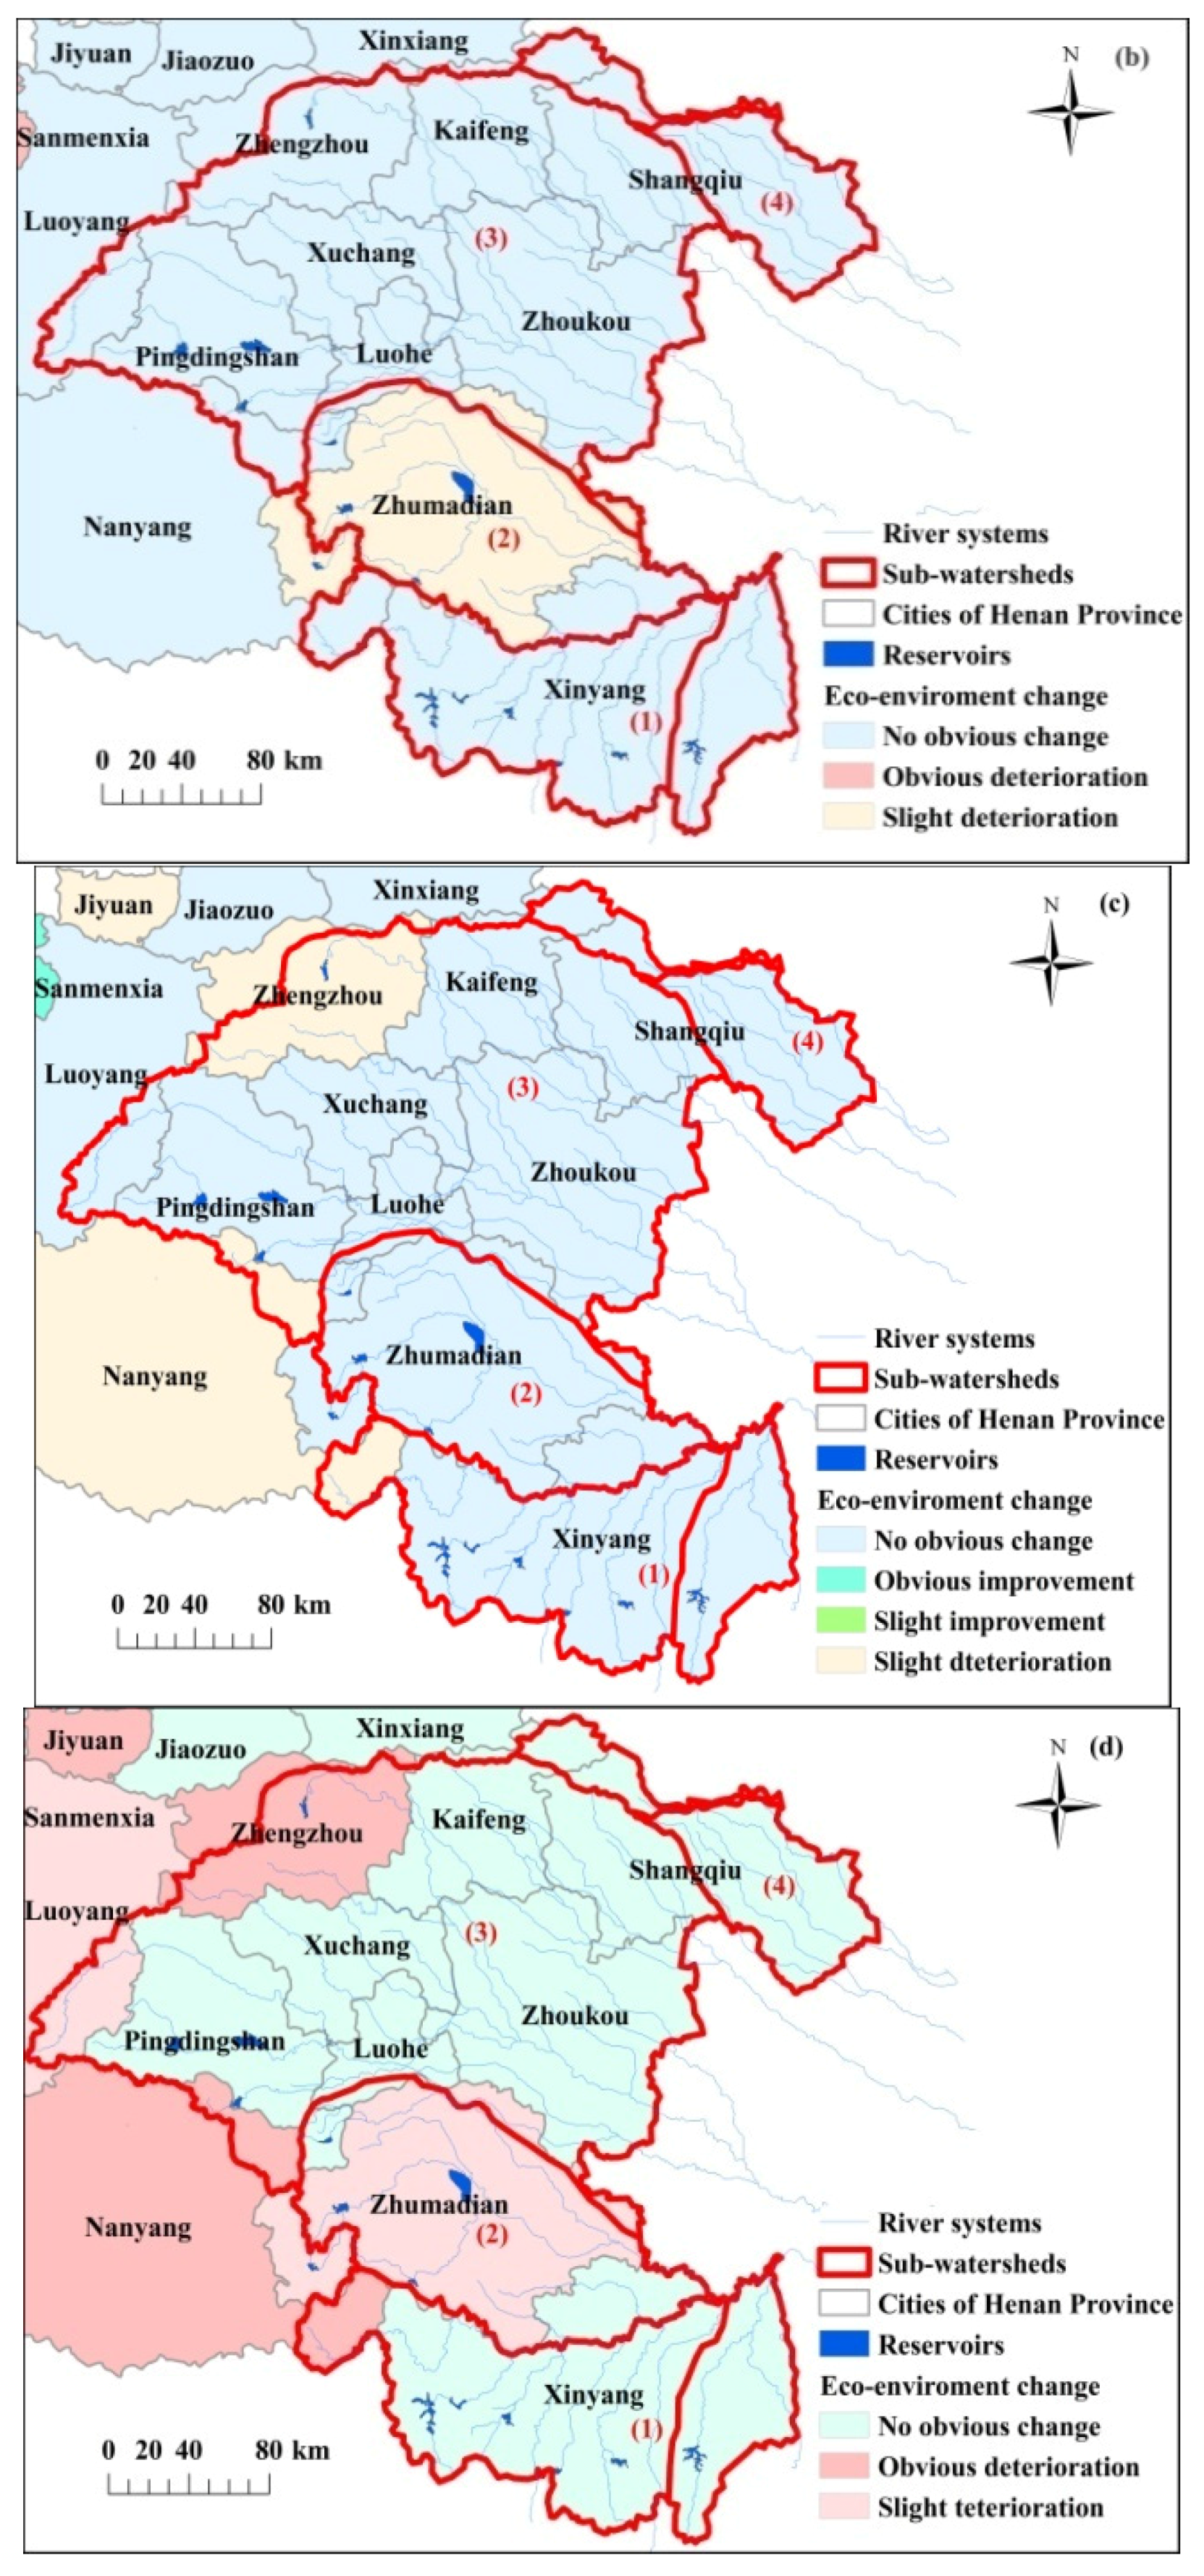
Figure 4.
Spatio-temperal distribution of ecological risk in the Huai River watershed in Henan Province during 2000–2015. The symbols for D_2000, D_2005, D_2010, and D_2015 here represent the coupling coordination degrees of ecological ecosystem and human system in 2000, 2005, 2010, and 2015, respectively.


Table 1.
Classification of the ecological risk assessment for the Huai River watershed in Henan Province.
Table 1.
Classification of the ecological risk assessment for the Huai River watershed in Henan Province.
| Ecological Risk Ranking | Threshold Index (D) | Sub-Types of Ecological Risk | Sub-Threshold Indicators |
|---|---|---|---|
| Severe degradation | 0 < D ≤ 0.3 | Delayed urbanization | g(E) − f(U) > 0.1 |
| Delayed eco-environment | f(U) − g(E) > 0.1 | ||
| Severe degradation | 0 ≤ |f(U) − g(E)| < 0.1 | ||
| Moderate degradation | 0.3 < D ≤ 0.5 | Delayed urbanization | g(E) − f(U) > 0.1 |
| Delayed eco-environment | f(U) − g(E) > 0.1 | ||
| Moderate degradation | 0 ≤ |f(U) − g(E)| < 0.1 | ||
| Slight degradation | 0.5 < D ≤ 0.8 | Delayed urbanization | g(E) − f(U) > 0.1 |
| Delayed eco-environment | f(U) − g(E) > 0.1 | ||
| Slight degradation | 0 ≤ |f(U) − g(E)| < 0.1 | ||
| No risk | 0.8 < D ≤ 1 | Delayed urbanization | g(E) − f(U) > 0.1 |
| Delayed eco-environment | f(U) − g(E) > 0.1 | ||
| No risk | 0 ≤ |f(U) − g(E)| < 0.1 |
Table 2.
Indicators and weight coefficients of human system for the Huai River watershed in Henan Province in 2010.
Table 2.
Indicators and weight coefficients of human system for the Huai River watershed in Henan Province in 2010.
| Quantification of Human Systems | Indicators | Weight Coefficients | |
|---|---|---|---|
| Contributors from human social system |
| Population density (cap/km2) | 0.09 |
| Percentage of non-agricultural population (%) | 0.04 | ||
| Employed persons in tertiary industry (%) | 0.01 | ||
| Urbanization area (m2/cap) | 0.04 | |
| Road area (m2/cap) | 0.05 | ||
| Residential area (m2/cap) | 0.22 | ||
| Per capital GDP (¥) | 0.05 | |
| Gross value of industrial output (¥/cap) | 0.13 | ||
| Urbanpercapitadisposable income (¥) | 0.00 | ||
| Ratio of primary and secondary industries (%) | 0.00 | ||
| Total financial revenue (¥/cap) | 0.17 | ||
| Total retail sales of consumer goods (¥) | 0.02 | |
| Regular institutions of higher education (104 persons) | 0.11 | ||
| Internet users (104 persons) | 0.06 | ||
| Employed persons in health institutions(104 persons) | 0.01 |
© 2017 by the authors. Licensee MDPI, Basel, Switzerland. This article is an open access article distributed under the terms and conditions of the Creative Commons Attribution (CC BY) license (http://creativecommons.org/licenses/by/4.0/).
Share and Cite
MDPI and ACS Style
Lu, Y.; Qin, F.; Chang, Z.; Bao, S. Regional Ecological Risk Assessment in the Huai River Watershed during 2010–2015. Sustainability 2017, 9, 2231. https://doi.org/10.3390/su9122231
AMA Style
Lu Y, Qin F, Chang Z, Bao S. Regional Ecological Risk Assessment in the Huai River Watershed during 2010–2015. Sustainability. 2017; 9(12):2231. https://doi.org/10.3390/su9122231
Chicago/Turabian StyleLu, Yan, Fen Qin, Zhongbing Chang, and Shuming Bao. 2017. "Regional Ecological Risk Assessment in the Huai River Watershed during 2010–2015" Sustainability 9, no. 12: 2231. https://doi.org/10.3390/su9122231
Note that from the first issue of 2016, this journal uses article numbers instead of page numbers. See further details here.