Solid Waste Disposal in Chinese Cities: An Evaluation of Local Performance


1
College of Public Administration, Huazhong University of Science and Technology, Wuhan 430074, China
2
John Glenn College of Public Affairs, The Ohio State University, Columbus, OH 43210, USA
*
Author to whom correspondence should be addressed.
Sustainability 2017, 9(12), 2234; https://doi.org/10.3390/su9122234
Submission received: 20 October 2017
/
Revised: 26 November 2017
/
Accepted: 30 November 2017
/
Published: 3 December 2017
(This article belongs to the Collection Trends in Municipal Solid Waste Management)
Abstract
:China meets increasingly serious solid waste problems and has adopted various policies in response in recent years. Meanwhile, few studies have investigated the performance of solid waste disposal through statistical analysis with empirical data. This study examines provincial resource use policy’s influence on the comprehensive utilization rate of industrial solid waste in Chinese cities. Through comparing results for statistical analysis in the year 2009 and 2015 by multiple linear regression analysis, this study analyzes similarities and differences in the drivers for solid waste disposal in the era of the 11th Five-Year Plan and the 12th Five-Year Plan in China. It finds that the adoption of resource use policy positively increases the comprehensive utilization rate of industrial solid waste. Other factors such as industrial SO2 emission, local environmental regulations, GDP per capita, population density and educational level also affect industrial solid waste disposal. Therefore, China should continue implementing solid waste disposal policies, upgrade current industrial systems, push forward economic and social reform and increase environmental education to enhance the effectiveness of solid waste disposal for long-term sustainable development.
1. Introduction
China has made great achievements in its urbanization during the past thirty years. According to China Statistical Yearbook 2016, in 2015, 56.1% of Chinese people were city residents [1]. There are still many migrant workers working and living in urban area [2]. The population in urban area accounts for more than 60% of the total population in China [3]. The rapid growth of the population brings heavy burdens to sustainable development, as China faces both energy shortages and environmental pollution simultaneously. Four major solid waste pollutants, municipal solid waste (MSW), industrial solid waste (ISW), hazardous waste (HW) and agricultural waste (AW), affect China’s environmental quality and long-term sustainable development. Since China’s industries are mainly located in urban area, industrial solid waste, such as slag and dust, has seriously deteriorated urban China’s environment [4].
How to deal with the increasing volume of solid waste is becoming a tremendous challenge to the Chinese government. The traditional way is to incinerate or landfill solid waste, leading to serious environmental problems and causing energy waste. As a result, China has tried to learn from the experiences in solid waste management from developed countries in recent years [5].
Many developed countries have adopted systematic approaches to disposal problems brought by solid waste. The European Union and the United States have developed complex and multifaceted solid waste management systems by combining and coordinating a series of new technology, economic approaches and regulatory institutions. These practices led to positive changes in regional sustainable development [6]. Since solid waste management involves multidisciplinary knowledge, it needs systematic analysis to offer integrated models and methodologies to deal with specific waste management problems.
Most developed countries have addressed environmental problems systematically, with higher levels of ability to dispose of solid waste than developing countries [7]. The Chinese government has noticed the problem of solid waste disposal in urban area and has taken various approaches such as developing the green economy, upgrading industrial systems and encouraging social and market participation to deal with solid waste [8]. However, studies on solid waste management, disposal and utilization in China are still under-developed. Current studies are mainly introductory and descriptive [9]. It is still not clear whether the government’s solid waste disposal policies have played positive roles and whether various solid waste disposal approaches which have been applied in recent years are useful. Consequently, effective policy recommendations and adjustments are difficult to make due to the lack of rigorous quantitative research about the performance of solid waste disposal in China.
This study employs quantitative methods to explore the problem by examining the performance of China’s environmental policies of industrial solid waste disposal. This paper will quantify municipal governments’ solid waste disposal policies and examine their impact on local comprehensive utilization rates of industrial solid waste in Chinese cities. Since China has had fast economic development in recent years, solid waste disposal situations might also experience changes. Hence, this study will conduct statistical analysis based on the data from 2009 and 2015 to find similarities and differences of solid waste disposal in recent years. In the following sections, this paper will review the literature on solid waste disposal. Then we will present our research methods, data collection and measurements. Results and discussions will be presented based on regression analysis. The article concludes with a summary of findings and policy implications for solid waste disposal policies.
2. Literature Review
Industrial solid waste (ISW), municipal solid waste (MSW), hazardous waste (HW) and agricultural waste (AW) can be seen as major types of solid waste (SW) [10]. An increasing number of studies have started to pay attention to solid waste disposal and management, due to the heated discussions among the general public in both developed countries and developing countries [11]. Both developed and developing countries are concerned about using sustainable and suitable methods to deal with urban solid waste challenges [12]. As the second largest economic power with fast industrialization and urbanization, China also faces problems of solid waste management and disposal [13]. Solid waste management practice in the developed world is more standardized and mature [14]. Since most developed countries have established comprehensive waste recycling systems, MSW generation can be seen as a significant part of developed countries’ solid waste disposal systems [15].
The US and the EU governments established solid waste recycling systems through market and policy approaches to achieve effective waste recycling. Higher living standards and diet habits in Western developed countries lead to lower moisture and higher caloric value in municipal waste suitable for MSW generation [16]. OECD (Organization for Economic Co-operation and Development) countries, especially the Unites States and European countries, have high MSW generation rates as the rate in OECD countries was 1.430 kg/person/day, the rate in the Unites States was 2.080 kg/person/day and the rate in the EU was 1.510 kg/person/day [6]. Developing countries have much lower MSW generation rates than developed countries since the average MSW generation rate of 23 developing countries was 0.759 kg/person/day according to the 2002 United Nations Environment Programme data [17]. It is believed that the average income level is positively related to the MSW generation rate and the performance of solid waste management in western countries [18].
A similar situation can also be seen in developed countries in East Asia. Compared with the western countries, East Asian developed countries lack land and natural resources but have greater population density [19]. Therefore, they try to develop MSW generation to increase energy supply and to reduce possible land pollution brought by waste landfill [20]. Besides that, Japan, South Korea, Singapore, Hong Kong and Taiwan are taking various methods such as the “3R” strategy (reduce, reuse and recycle), the “3P” strategy (public, private and public, government) and volume-based waste classification systems to achieve waste minimization [21].
Solid waste management and disposal problems are more obvious in developing countries. Compared with developed countries, developing countries face more institutional and financial challenges in addressing solid waste problems [22]. In many developing countries, agricultural waste disposal has been a traditional problem. Backwards agricultural production methods without environmental consideration not only produces solid waste such as straw and cow manure directly, but also the waste disposal method (normally burning) can cause secondary pollution (air pollution) [11].
Besides traditional agricultural solid waste disposal problems, many Southeast Asian developing countries also do not have specific policies to manage solid waste effectively in urban area [23]. Solid waste management policies in other South and Southeast Asian developing countries also do not have much practical effect. Malaysia has shaped a private-based solid waste management system that allows individuals and households to collect and recycle solid waste based on human labor [24]; Indonesia also established quasi-private and community-based solid waste management systems by involving the non-government sectors [25]. Malaysia and Indonesia’s solid waste disposal policies encourage individuals and community participation in solid waste disposal. However, neither the Malaysian nor Indonesian government has mandatory rules to punish individuals or small enterprises if the disposal result does not meet relevant environmental requirements. The negative result of private-based solid waste disposal policies in Malaysia and Indonesia is that only some types of solid waste with high economic values and easily collected by human labor are recycled while other types of solid waste are not. Without effective government involvement, solid waste disposal does not achieve its environmental purpose.
As a large developing country with a huge population, India made policies and attempted to establish mechanical waste processing programs in big cities in the 1980s [26]. Meanwhile, those programs and policies failed due to information asymmetry and the incompatibility of facilities since the government did not consider that the structures of Indian cities were not suitable for waste recycling vehicles and large waste disposal factories and machines. Indian officials also could not find experienced workers to operate and maintain waste disposal machines. India still has serious solid waste challenges and secondary pollution. Various approaches and policies have been made to increase India’s solid waste disposal abilities [27].
Compared with developed countries, developing countries faced greater challenges in the effective use of incineration and MSW generation, since their solid waste contents have lower heating value and most of the countries do not have clean incineration technology [28]. Besides institutional and policy reasons, poor environmental education is another factor that affects solid waste disposal [11]. Farmers, small waste recycle business owners and even some officials did not get sufficient education and training in solid waste disposal. This makes solid waste disposal in developing countries more challenging.
Although solid waste disposal does not work well in some developing countries, many countries such as China still establish their own waste recycling system [29]. Waste paper, metals, plastics and some industrial waste are recycled as resources. As mentioned, recycling waste in some developing countries is commercial action run by poor individuals or families as small businesses [30]. This recycling method can deal with some specific types of wastes effectively. Meanwhile, some other wastes, especially those which do not have much value for recyclers, may still lead to environmental problems [31].
Mexico and China are two developing countries which share similar characteristics with developed countries on solid waste disposal. This is because the social and economic developmental levels of the two countries are closer to developed countries [32]. Fast economic and social development in the two countries offers more resources and a better institutional environment to improve solid waste disposal [33].
As mentioned above, solid waste disposal development in China has made some progress in the past 30 years. Meanwhile, China still faces various challenges to establish an effective and sustainable solid waste disposal system [34]. China meets both technological and institutional problems for solid waste disposal. Compared with developed countries, contents of solid waste in China are more similar to other developing countries. The moisture content of solid waste in China is much more than that in developed countries while the heating value is much lower [35]. China is still not able to recycle some types of solid waste, which can be recycled in the US or Japan [5]. Although China faces technical bottlenecks such as using low heating value waste effectively and using machines to classify different types of solid waste, it has established waste power stations and several mechanized recycling plants to increase the effectiveness of solid waste disposal [9]. At the start of the 21st century, China could dispose of 54.2% of its total municipal solid waste (MSW) and 50.4% of its total industrial solid waste (ISW). About 44% of hazardous waste (HW) was also successfully recycled [36]. According to China Statistical Yearbook 2016, the municipal solid waste harmless treatment rate has reached 94.1% and the comprehensive utilization rate of industrial solid waste was over 70% in 2015 [1].
Since the 21st century, China has adopted a series of policies, plans and laws to regulate and control solid waste disposal. The government encouraged the development of circular economy and green industries [37]. It also has taken action to shut down polluting enterprises and push the upgrading of current equipment and industrial systems [38]. Meanwhile, those ambitious plans did not have a practical basis since the Chinese government has little experience or capital to achieve environmental goals within a short time period. Solid waste disposal in China still has a long way to go [34].
Major problems of solid waste disposal in China include: (1). Landfill is still the main method to deal with MSW in China. It can cause heavy environmental problems as well as land and water waste and pollution [39]; (2). Recycling rates of some major types of industrial solid wastes are still low. Many of them are not widely recycled yet in China [5]; (3). Hazardous waste recycling still meets some technical problems which may make the recycling process environmentally unfriendly [40]. The Chinese government has taken action to reduce solid waste generation and improve solid waste recycling and processing abilities [33]. The Chinese government has also reformed the solid waste management system in recent years [29]. From the perspective of research methodology, developed countries paid more attentions to systematically investigating the application of new technology, economic performance, policy innovations and social-psychology in solid waste management [6]. Scholars in those countries have widely used statistical and quantitative methods to assess the performance of solid waste disposal [18]. Studies on solid waste disposal in developing countries pay more attention to direct and practical institutional influences [41]. However, these studies typically apply a case study method which makes it hard to measure and compare performance of solid waste disposal [42]. Although these studies can explain some phenomena and address some problems, they lack generalizability to offer valuable suggestions to improve the performance of solid waste disposal beyond the jurisdiction under study [43].
In China, the main trend in solid waste disposal research also features a large number of studies relying on case studies. Since China has experienced fast economic and social development, solid waste disposal also faces new situations and challenges in the 21st century. Although some studies have given introductions of circular economy/green industries and new solid waste disposal technology, most of the studies are descriptive research that focuses on disposal approaches from the technological perspective [4]. The performance of solid waste disposal policies has not been specifically studied yet. Therefore, studies are needed to explain China’s solid waste disposal in recent years. What is more, few studied investigated province-level policies in prefecture-level cities in China. This study fills the research gap through quantifying and evaluating the relationship between local governments’ solid waste disposal policies and the local comprehensive utilization rate of industrial solid waste via statistical analysis.
3. Solid Waste Policies in China
Since solid waste disposal has been a serious problem that affected China’s long term sustainable development, both the central government and local governments in China have issued multiple laws, regulations and policies, as well as macro development plans, to regulate solid waste issues (See Table 1). The central government of China has demonstrated its ambition to deal with environmental problems through its Five-Year Plans (FYP) [44]. Since the 11th Five-Year Plan (the 11th FYP, 2006–2010), China has set up targets to reduce major air pollutants (mainly SO2 and NOx) and industrial solid waste and dust [45]. During the period of the 12th Five-Year Plan (the 12th FYP, 2011–2015), the central government placed more emphasis on reducing pollution and emissions to achieve better environmental governance [46]. Argument has been made that the 11th Five-Year Plan (the 11th FYP) and the 12th Five-Year Plan (the 12th FYP) were both effective in improving urban China’s air quality by reducing the average emission of SO2 and NO2 [46]. The Chinese central government also made similar policies in its Five-Year Plans and emission control plans to limit and control the emission of CO2. Although CO2 does not pollute the environment directly, there are more sources of CO2 emissions than SO2 and NO2 emissions. The government never loses its control of CO2 emissions [47].
Other national environmental protection plans and laws have also played significant roles in solid waste disposal. The implementation of National Total Emission Control (NTEC) was seen as a key factor to improve environmental conditions in metropolitan areas of China during the 12th FYP [48]. In 2011, the Chinese government also adopted the “12th Five-Year Plan” for national environmental protection. The plan clearly stated that both the government and professional disposal organizations should pay more attention to the governance of industrial solid waste disposal. The plan hoped to use various ways to reach the 72% industrial solid waste comprehensive utilization rate in 2015. Besides, in 2015, China revised the Solid Waste Pollution Preventing and Control Law. The revised version of the law clearly defined the government and enterprises’ responsibilities in solid waste disposal. It also added information that the government should encourage the development of a circular economy. The revised law regulated and limited the discharge and import of industrial solid waste. In general, the revised Solid Waste Pollution Preventing and Control Law has noticed new phenomena of solid waste disposal in recent years and offered legal support for the sustainable development of solid waste disposal in China.
Besides the national level, provinces and cities, especially those in middle and western part of China or those highly relying on the energy economy, also meet solid waste disposal challenges. On the one hand, provincial and municipal governments had to make local policies and regulations to respond to and implement the central government’s environmental policies. On the other hand, they feared that the implementation of environmental protection actions and policies could harm the growth rate of the local GDP [38].
Meanwhile, in correspondence with environmental protection policies made by the central government, provincial governments in China have also made their own policies such as local solid waste disposal and control regulations and played more significant and positive roles in environmental governance. All the provincial governments have taken regulatory actions to close polluting enterprises (such as small power plants and paper mills), limit the development of polluting industries (such as the iron/steel industry and coal industry), increase the intensity of punishment for illegal pollution and emission and make more strict policies to regulate and supervise individuals’ and enterprises’ environmental behaviors since the era of the 11th Five-Year Plan [49]. Provincial governments also made policies to offer financial subsidies to encourage the development of clean energy industries such as wind and solar power stations, encourage the development of green/clean industries without serious pollution and emission, and encourage the upgrading of environmental protection equipment in traditional industries [50]. Besides direct financial subsidies, the government also used administrative approaches such as setting and supporting good examples for energy saving and protecting the environment. The government makes favorable policies to reduce obstructions from relevant interest groups to get individuals’ and enterprises’ support for developing the green economy and reducing pollution and emission [51].
Provincial and municipal governments are major entities to implement the central government’s macro policies to save energy and protect the environment at the local level in China. They are direct players to supervise enterprises to achieve energy conservation and waste disposal [38]. Case studies have shown that appropriate solid waste disposal policies and management at the local level can reduce SO2 and PM10 (respirable particulate matter) effectively [46]. Case studies also have shown that the government’s punishment to polluting enterprises and encouragement to new technology and communities/enterprises’ environmental actions are helpful for solid waste disposal [49]. However, few studies have explored the accurate performance of solid waste disposal policies in China with a quantitative research method. There is a lack of research on the links between national and provincial policies and the performance of solid waste disposal [52]. Based on prior research on sub-national environmental policies in China, this study quantifies provincial governments’ solid waste disposal policies and examine their performance via statistical analysis.
4. Methods and Data
4.1. Model
The purpose of this paper is to analyze the performance of solid waste disposal in Chinese cities. A multiple regression analysis is employed to study the relationship between the provincial energy and environmental policies and the comprehensive utilization rate of solid waste disposal at the city level. The model could be formulated as:
where Y is the dependent variable, which is the logged comprehensive utilization rate of solid waste disposal in Chinese cities. X are explanatory variables, including independent variables on resource use policy, harmless treatment rate, greenbelt area per capita, industrial SO2 emissions, industrial soot emissions and value of waste utilization. Five control variables are also included, which are saving deposit, total volume of freight, population density, GDP per capita and educational level. ε varies independently across cities.
Y = sum(βX + ε)
4.2. Data
This paper studies industrial solid waste management and disposal situations in Chinese cities. As one of the most significant solid wastes, industrial solid waste has significantly affected the urban environment. The study of industrial solid waste has both theoretical and practical meanings. According to China City Statistical Yearbook 2016’s definition, industrial solid waste means solid waste produced in industrial production [53]. It includes various kinds of slag, mud and other wastes which are discharged into the environment. There are two types of industrial solid wastes. One is the general industrial solid waste which includes blast furnace slag, steel slag, red mud, non-ferrous metal slag, cinder, sulfuric acid slag, gypsum waste, carbide slag, salt mud and so on. The other is the dangerous industrial solid waste which is poisonous, flammable, corrosive or has other dangerous features.
This study will mainly use the data from 2009 to exam the disposal situation of industrial solid waste. Data of this year can be used to explain the development of solid waste disposal in mainland China in the first ten years of the 21st century well. In order to keep the study result scientific and reliable, this paper will also select the same data in the year 2015 (the newest official data which can be found) to make a comparative study to find similarities and changes in solid waste disposal in recent years.
Major sources and data of this research are from China City Statistical Yearbook 2010 and China City Statistical Yearbook 2016, including most independent variables and the dependent variable. Some other independent variables are from the official website of provincial statistics departments, most control variables are from China Statistical Yearbook 2010 and China Statistical Yearbook 2016.
Details of variables, measures and data sources can be found in Table 2, Table 3 and Table 4. Table 3 and Table 4 present descriptive statistics in the years 2009 and 2015.
4.2.1. Dependent Variable
Comprehensive utilization is a significant way to dispose of industrial solid waste. Based on the explanation of China National Bureau of Statistics and the indicator explanation of China City Statistical Yearbook 2016, comprehensive utilizing of industrial solid waste means using approaches of recycling, processing, collecting and exchanging to collect or transfer resources, energy and other raw materials from industrial solid wastes [53]. Since detailed calculation, classification and statistics of the amount and types of comprehensively utilized industrial solid waste are technical and engineering issues which are not directly relevant to this study, we do not explain the details here.
The comprehensive utilization rate of industrial solid waste is set as the dependent variable for this study. According to China City Statistical Yearbook 2016, the comprehensive utilization rate of industrial solid waste refers to the percentage ratio of industrial solid waste comprehensively utilized to the sum of the production amount of solid waste and the previous storage capacity [53]. The calculation formula of the comprehensive utilization rate of industrial solid waste is that:
where Y represents the comprehensive utilization rate of industrial solid waste, U represents industrial solid waste comprehensively utilized, P represents the production amount of industrial solid waste and S represents the previous storage capacity. Since the comprehensive utilization rate of industrial solid waste is a common indicator to judge industrial solid waste disposal in China, China City Statistical Yearbooks systematically collect such data, which we use in this study.
As the biggest developing country, China heavily relies on the development of industries for social and economic development [38]. Meanwhile, industrial pollutants are also main reasons for serious environmental problems in urban China nowadays. The utilization rate of industrial solid waste is the main indicator which can reflect the abilities of Chinese cities to deal with their solid waste problems and environmental issues.
In the first ten years of the 21st century, the Chinese government put much money and effort into addressing solid waste problems. According to China Statistical Yearbook 2010, official investment on industrial pollution disposal rapidly increased to 44.26 billion Yuan (RMB) in 2009 [55]. In China Statistical Yearbook 2016, this number increased to 77.36 billion Yuan (RMB) in 2015 [1]. However, the official investment of industrial solid waste disposal in 2009 was 2.185 billion Yuan (RMB) and the official investment reduced to 1.615 billion Yuan (RMB) in 2015 [1]. It is still not clear whether China has made achievements in comprehensively utilizing industrial solid waste and whether any change in industrial solid waste disposal happened in recent years. Some explanations will be presented in the latter part of this paper. The data for the comprehensive utilization rate of industrial solid waste are coded from China City Statistical Yearbook 2010 and China City Statistical Yearbook 2016. The data for industrial solid waste utilization include 287 prefecture level cities [53].
4.2.2. Independent Variables
Many factors can affect the comprehensive utilization rate of industrial solid waste. Independent variables can be divided into several different types with various influences on the performance of solid waste disposal in China.
a. Provincial Resource Use Policy
As mentioned above, although macro solid waste disposal policies in Table 1 are made by the central government, provinces have their autonomies to adopt and modify resource use policies according to their own situations to control the growth of solid waste [44]. Adopting resource use policy is a positive sign of the province’s commitment to sustainable solid waste management.
Therefore, this study hypothesizes that provincial resource use policies play positive roles in inducing solid waste management and disposal. Since current provincial resource use policies mainly focus on controlling the growth of solid waste, it can be hypothesized that these policies have positive influence on solid waste management and disposal.
Since resource use policies in many provinces are newly established, there is no fair standard, objective evaluation index or effective measurement approach to judge the quality of the policy in academia. Therefore, to measure provincial resource use policies, this study relies on a binary variable to indicate whether a province adopted resource use policy or not in the year 2009 and 2015, with “1” indicating a province adopted resource use policies in that year, while “0” indicates no such policy. The necessary background information and macro policies at the central government level are from the 12th Five-Year Plan (the 12th FYP), National Total Emission Control (NTEC) National Environmental Protection “12th Five-Year Plan” and Solid Waste Pollution Preventing and Control Law (Revised Version). All detailed data about the application of resource use policies are from provincial statistical offices and environmental departments.
b. Stringency of Environmental Regulations
Solid waste disposal and management is a significant part of government environmental regulations and administration in China. A province/city with positive environmental policies should have more substantive support to manage industrial solid waste. Thus we hypothesize that cities can better solve solid waste problems if they have more stringent environmental regulations. This research selects the collection of harmless treatment rate and greenbelt area per capita as two proxies to measure the stringency of environmental regulations. The two proxies represent major characteristics of the stringency of environmental regulations. The two variables are collected from China City Statistical Yearbook 2010 and China City Statistical Yearbook 2016.
c. Pollutant Emissions
Exhaust gas and solid waste are always seen as having close links. These two pollutants are generated primarily from carbon-intensive industries [56]. Most industries produce solid waste as well as exhaust gas. The amount of exhaust gas and industrial solid waste in the same urban area should have a positive relationship. Thus we hypothesize that if a city produces more industrial exhaust gas, there will be more industrial solid waste. More industrial solid waste means the solid waste disposal pace will be slower and thus the total utilization rate will be lower. This research selects industrial SO2 and industrial soot emissions to represent industrial exhaust gas since these two pollutants are the main air pollutants together with solid waste made by industries in urban China nowadays. Using the data of industrial SO2 and industrial soot emissions rather than the total SO2 and soot emissions can strengthen the logic chain to explain the relationship among exhaust gas, solid waste amount and solid waste utilization in industrial sectors and avoid the problem of weak explanation and irrelevance between total SO2, soot emissions and industrial solid waste utilization. Technically, China has established a sound monitoring system for industrial SO2 and soot emissions specifically and there is rich and accurate data for this study. China City Statistical Yearbook 2010 and China City Statistical Yearbook 2016 offers data on industrial SO2 and soot emissions (in tons) for this research.
d. Value of Waste Utilization
This research uses the value of waste utilization to measure the level of solid waste use and recycling in a city. It can be expected that if a city has a higher waste utilization value, it can process more solid wastes, transfer more wastes to resources and energy, and better solve solid waste problems. The data of value of waste utilization are also from China City Statistical Yearbook 2010 and China City Statistical Yearbook 2016.
4.2.3. Control Variables
This study also includes five control variables—saving deposit, total volume of freight, population density, GDP per capita and educational level. Their relationships with the dependent variable are as follow:
a. Saving Deposit
Many researchers have demonstrated that the higher the economic development level and living standard, the more waste produced [16]. An area’s economic development and average living standard is helpful to understand solid waste disposal situations in the region. Since Chinese people have the habit of saving their extra money in the bank, the saving deposit can be used to measure an area’s general economic development and living standards. A high saving deposit normally means good economic performance and a high living standard in China. The saving deposits of residents at the end of the year could represent the local economic health which significantly affects the environment and solid waste disposal performance. The data on the saving deposits of residents at the end of 2009 and 2015 are collected from China Statistical Yearbook 2010 and China Statistical Yearbook 2016.
b. Total Volume of Freight
Freight can also produce solid waste. Industrial packaging materials and waste are major sources of solid waste especially in port areas. The amount of freight waste can significantly affect the disposal and utilization of industrial solid waste. The larger the total volume of freight is, the more freight waste will be produced and the lower the industrial solid waste utilization rate will be. The unit of the total volume of freight is ten thousand tons. The data are collected from China City Statistical Yearbook 2010 and China City Statistical Yearbook 2016.
c. Population Density
If a city has a larger population than others, it will have more pressure to develop the economy and industries to solve employment issues. Therefore, environmental issues and relevant policies may not be strongly emphasized in these cities. It could lead to negative influences on solid waste management and disposal. However, more population also means the local government has to find better ways to improve the abilities in managing its solid waste and process more solid waste to maintain the basic operation of the city. Therefore, this research hypothesizes that if a city has a larger population, it will have a higher industrial solid waste utilization rate. This paper utilizes person per square kilometer to measure population density. China Statistical Yearbook 2010 and China Statistical Yearbook 2016 are sources for this variable.
d. GDP Per Capita
As mentioned above, economic development has a positive relationship with the amount of solid waste and a negative relationship with solid waste disposal [43]. Gross Domestic Product (GDP) per capita is a significant and effective way to measure the city’s economic development level. Normally, it can be predicted that a city with high GDP per capita has a low comprehensive utilization rate of industrial solid waste. However, since the era of the 12th Five-Year Plan, especially after 2010, China has paid more attention to developing green industries and circular economy. The composition of GDP has had significant changes. Green growth has been a new trend which might change the relationship between GDP per capita and solid waste disposal. This study will use GDP (unit in one hundred million RMB Yuan) divided by the population at the end of years 2009 and 2015 (unit in ten thousand persons) to measure GDP per capita. In this research, the data also come from China Statistical Yearbook 2010 and China Statistical Yearbook 2016.
e. Educational Level
The solid waste disposal situation is also affected by the educational level of farmers, enterprise holders, government officials and other people in the society. Since China does not have specific environmental education in its formal educational system all around the country, it is hard to measure the level of environmental education directly. However, voluntary environmental actions and activities normally happen in university and college campuses. It can be predicted that if a city has more people with higher education experience, the people in the city will have better environmental awareness and higher abilities in complying with solid waste rules. This study uses the number of population with higher education experience (college and university student enrollment per ten thousand people in the city) to measure the educational level of a city. The data comes from China City Statistical Yearbook 2010 and China City Statistical Yearbook 2016.
5. Results and Discussions
The result of the multiple linear regression analysis is presented as follows. Table 5 is the regression analysis of solid waste disposal in the year 2009 and Table 6 is the regression analysis in the year 2015.
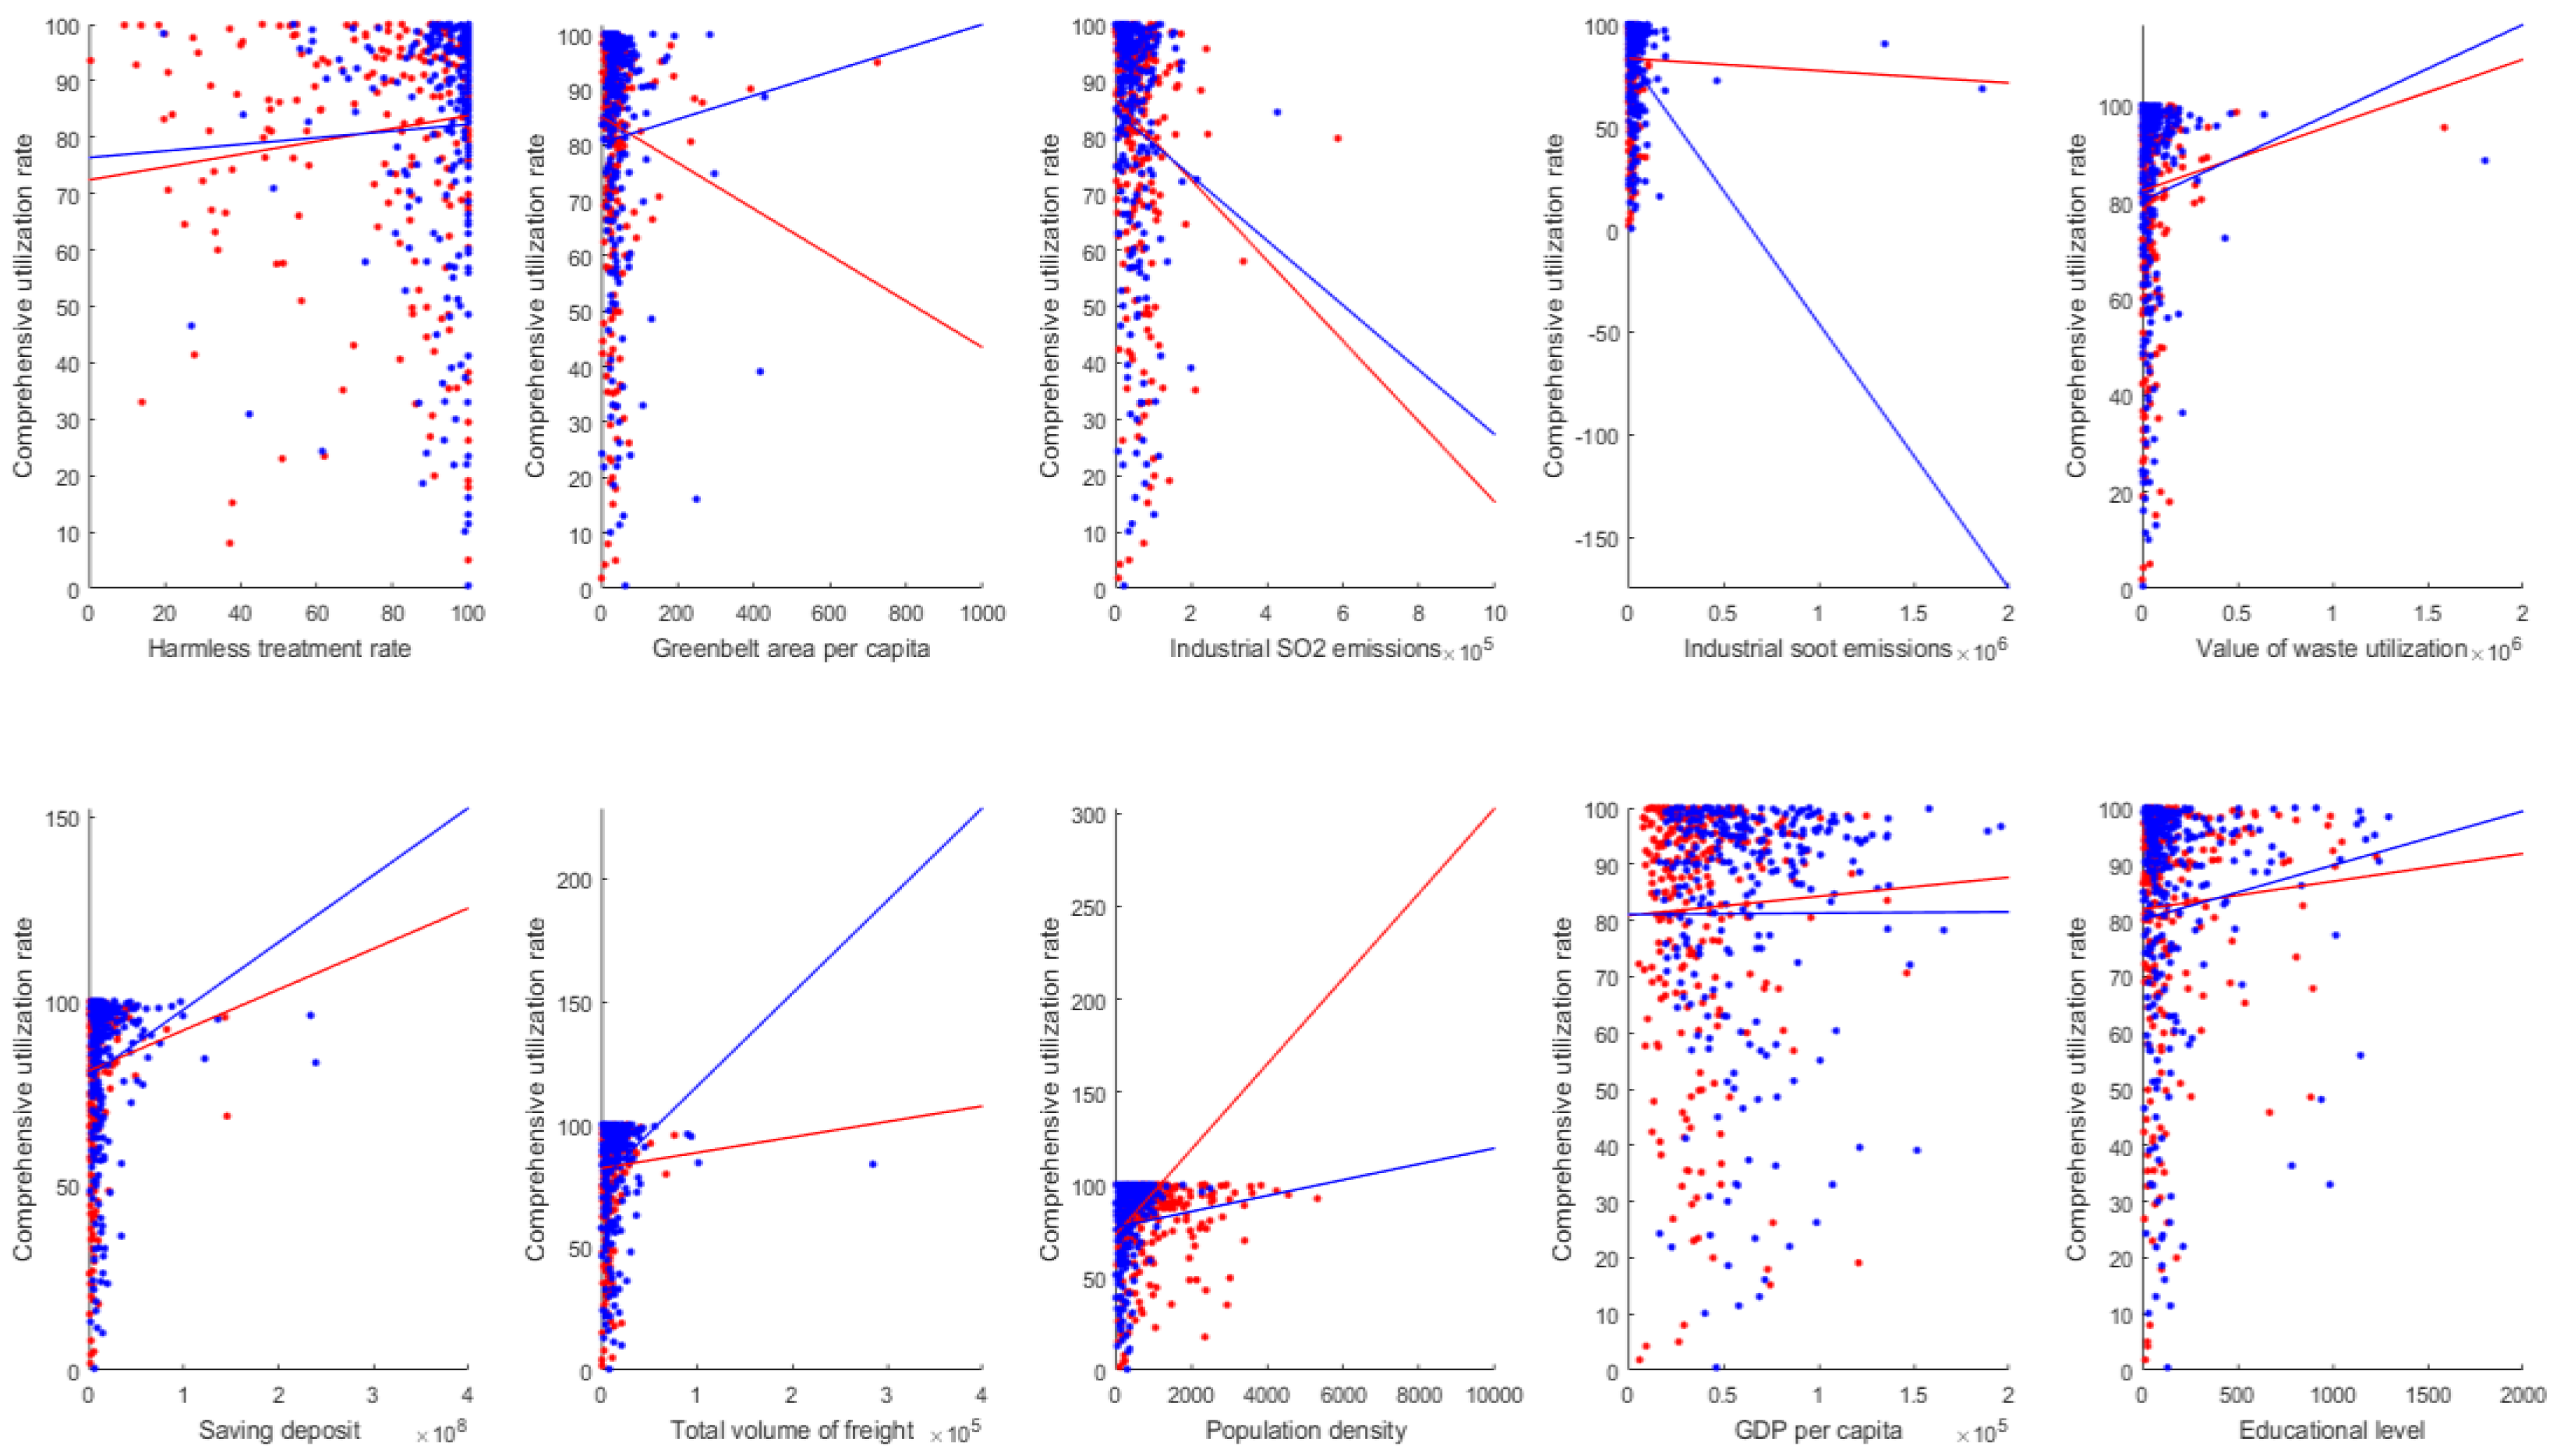
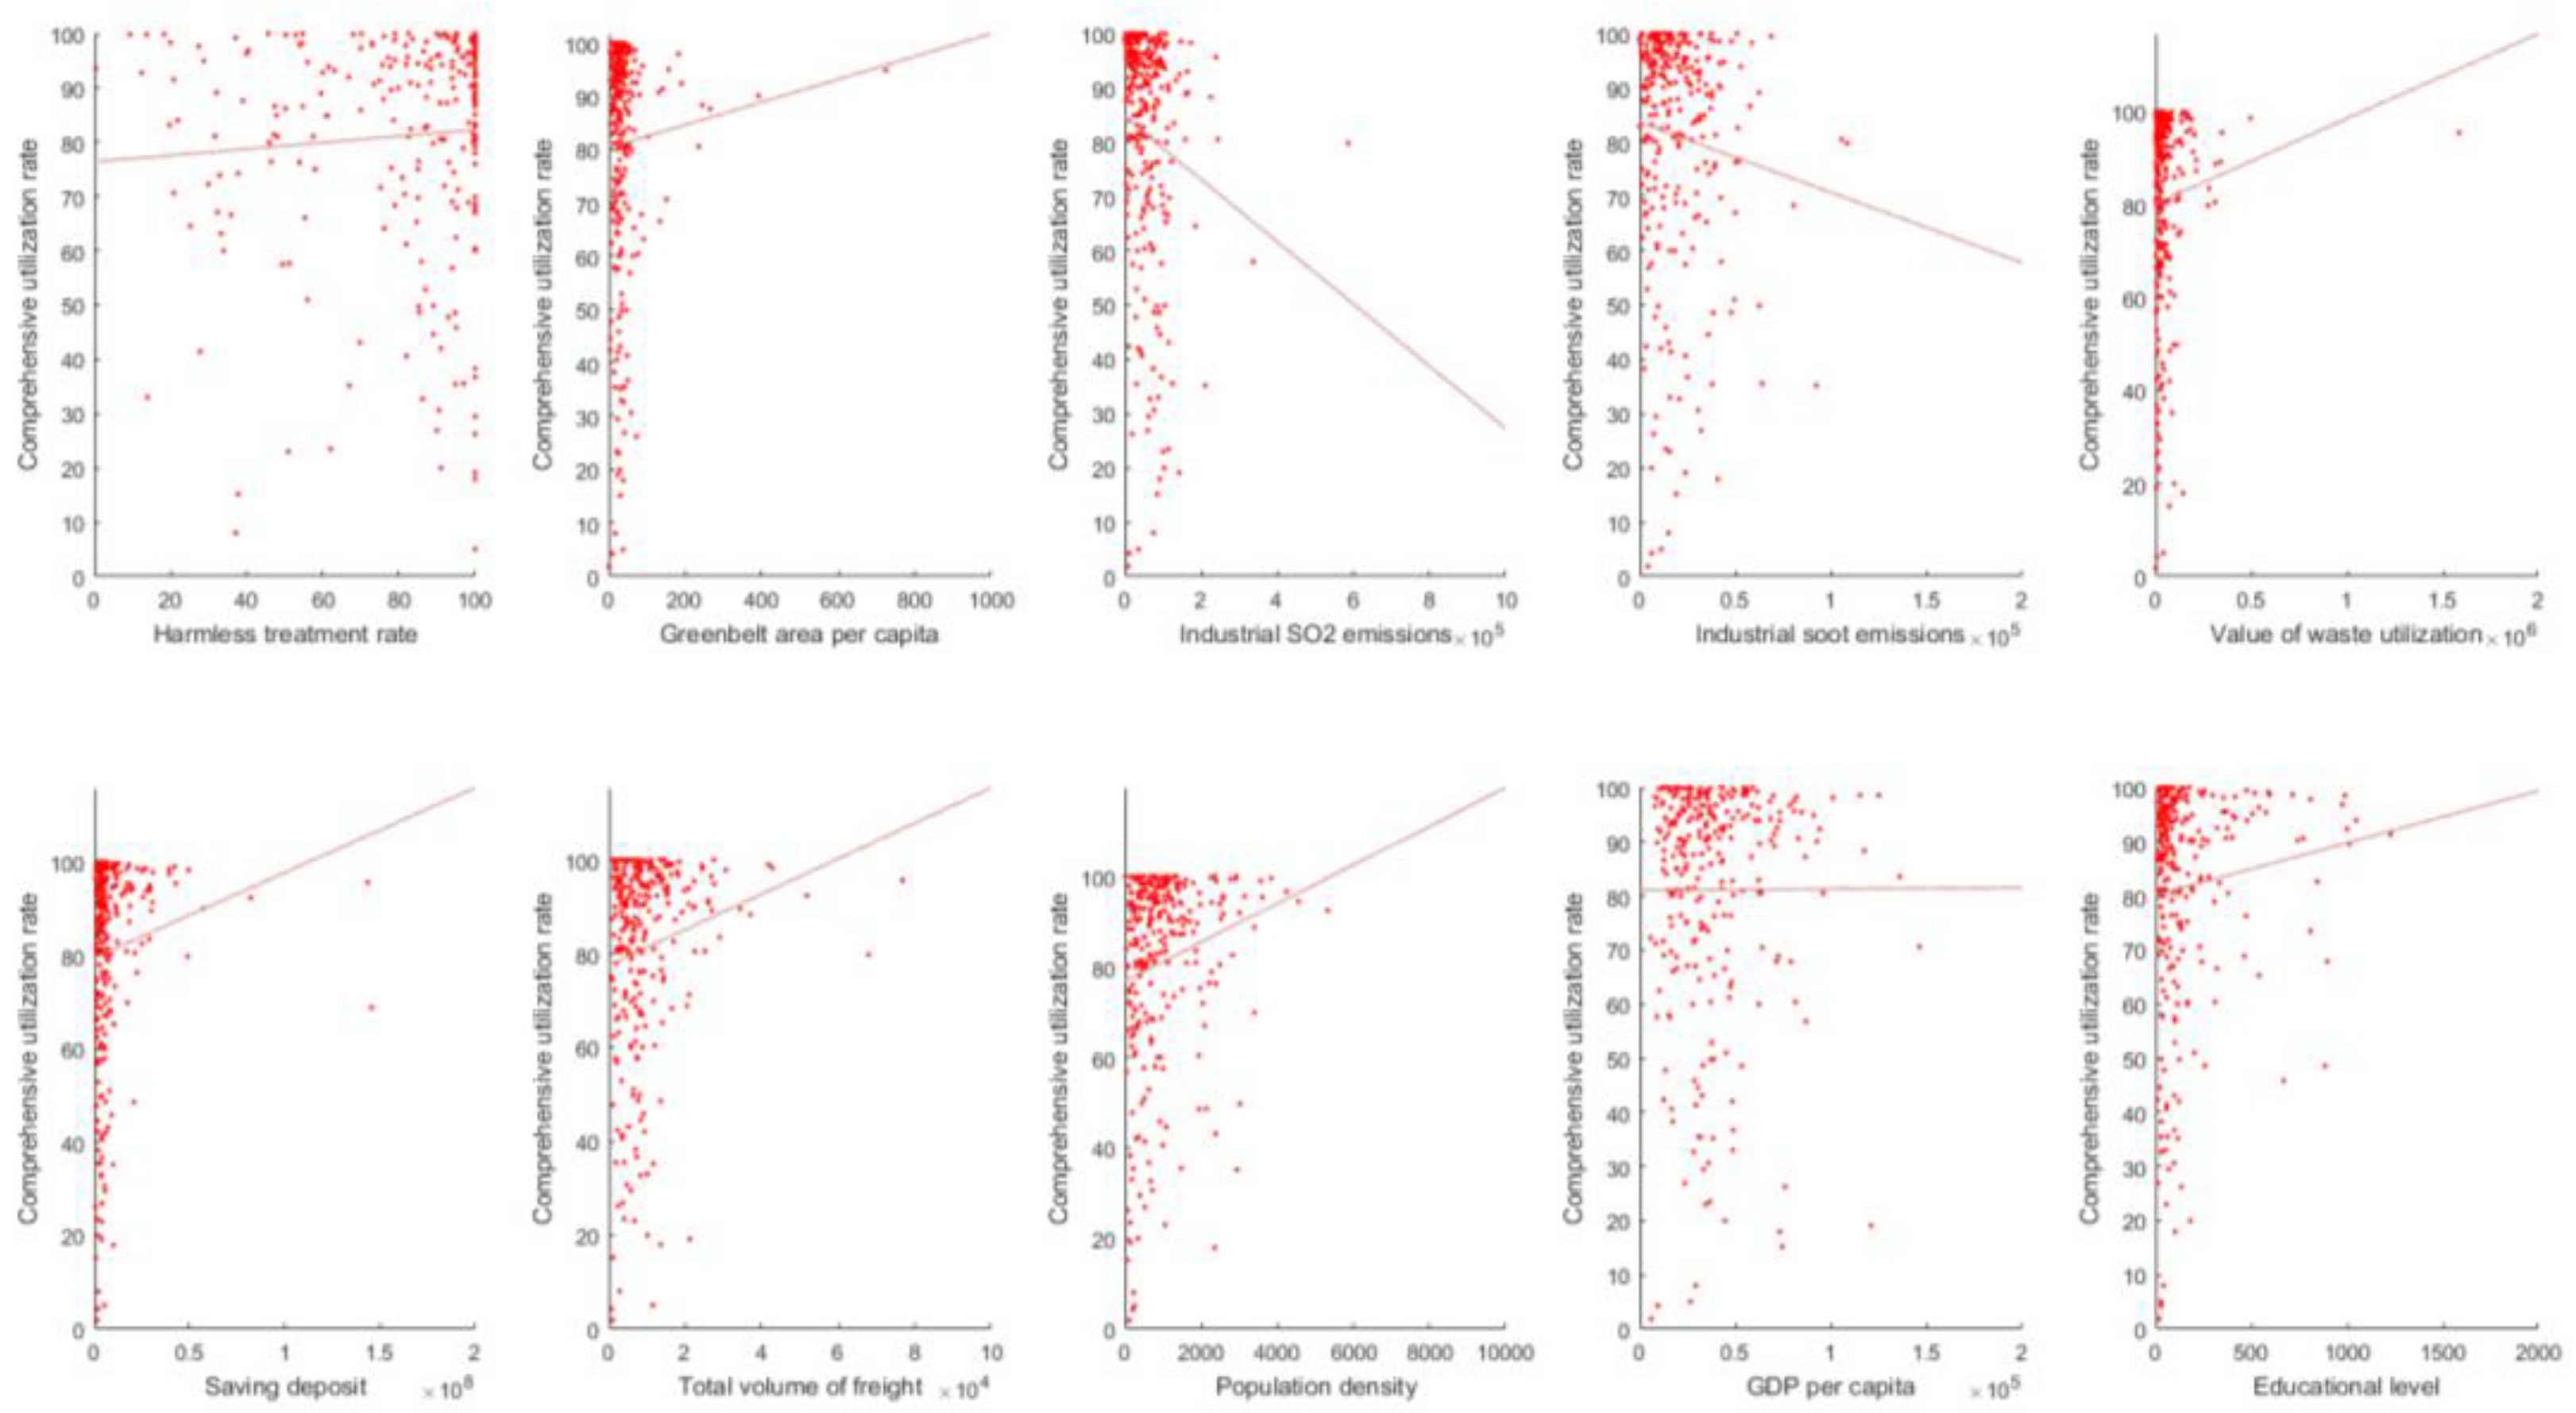
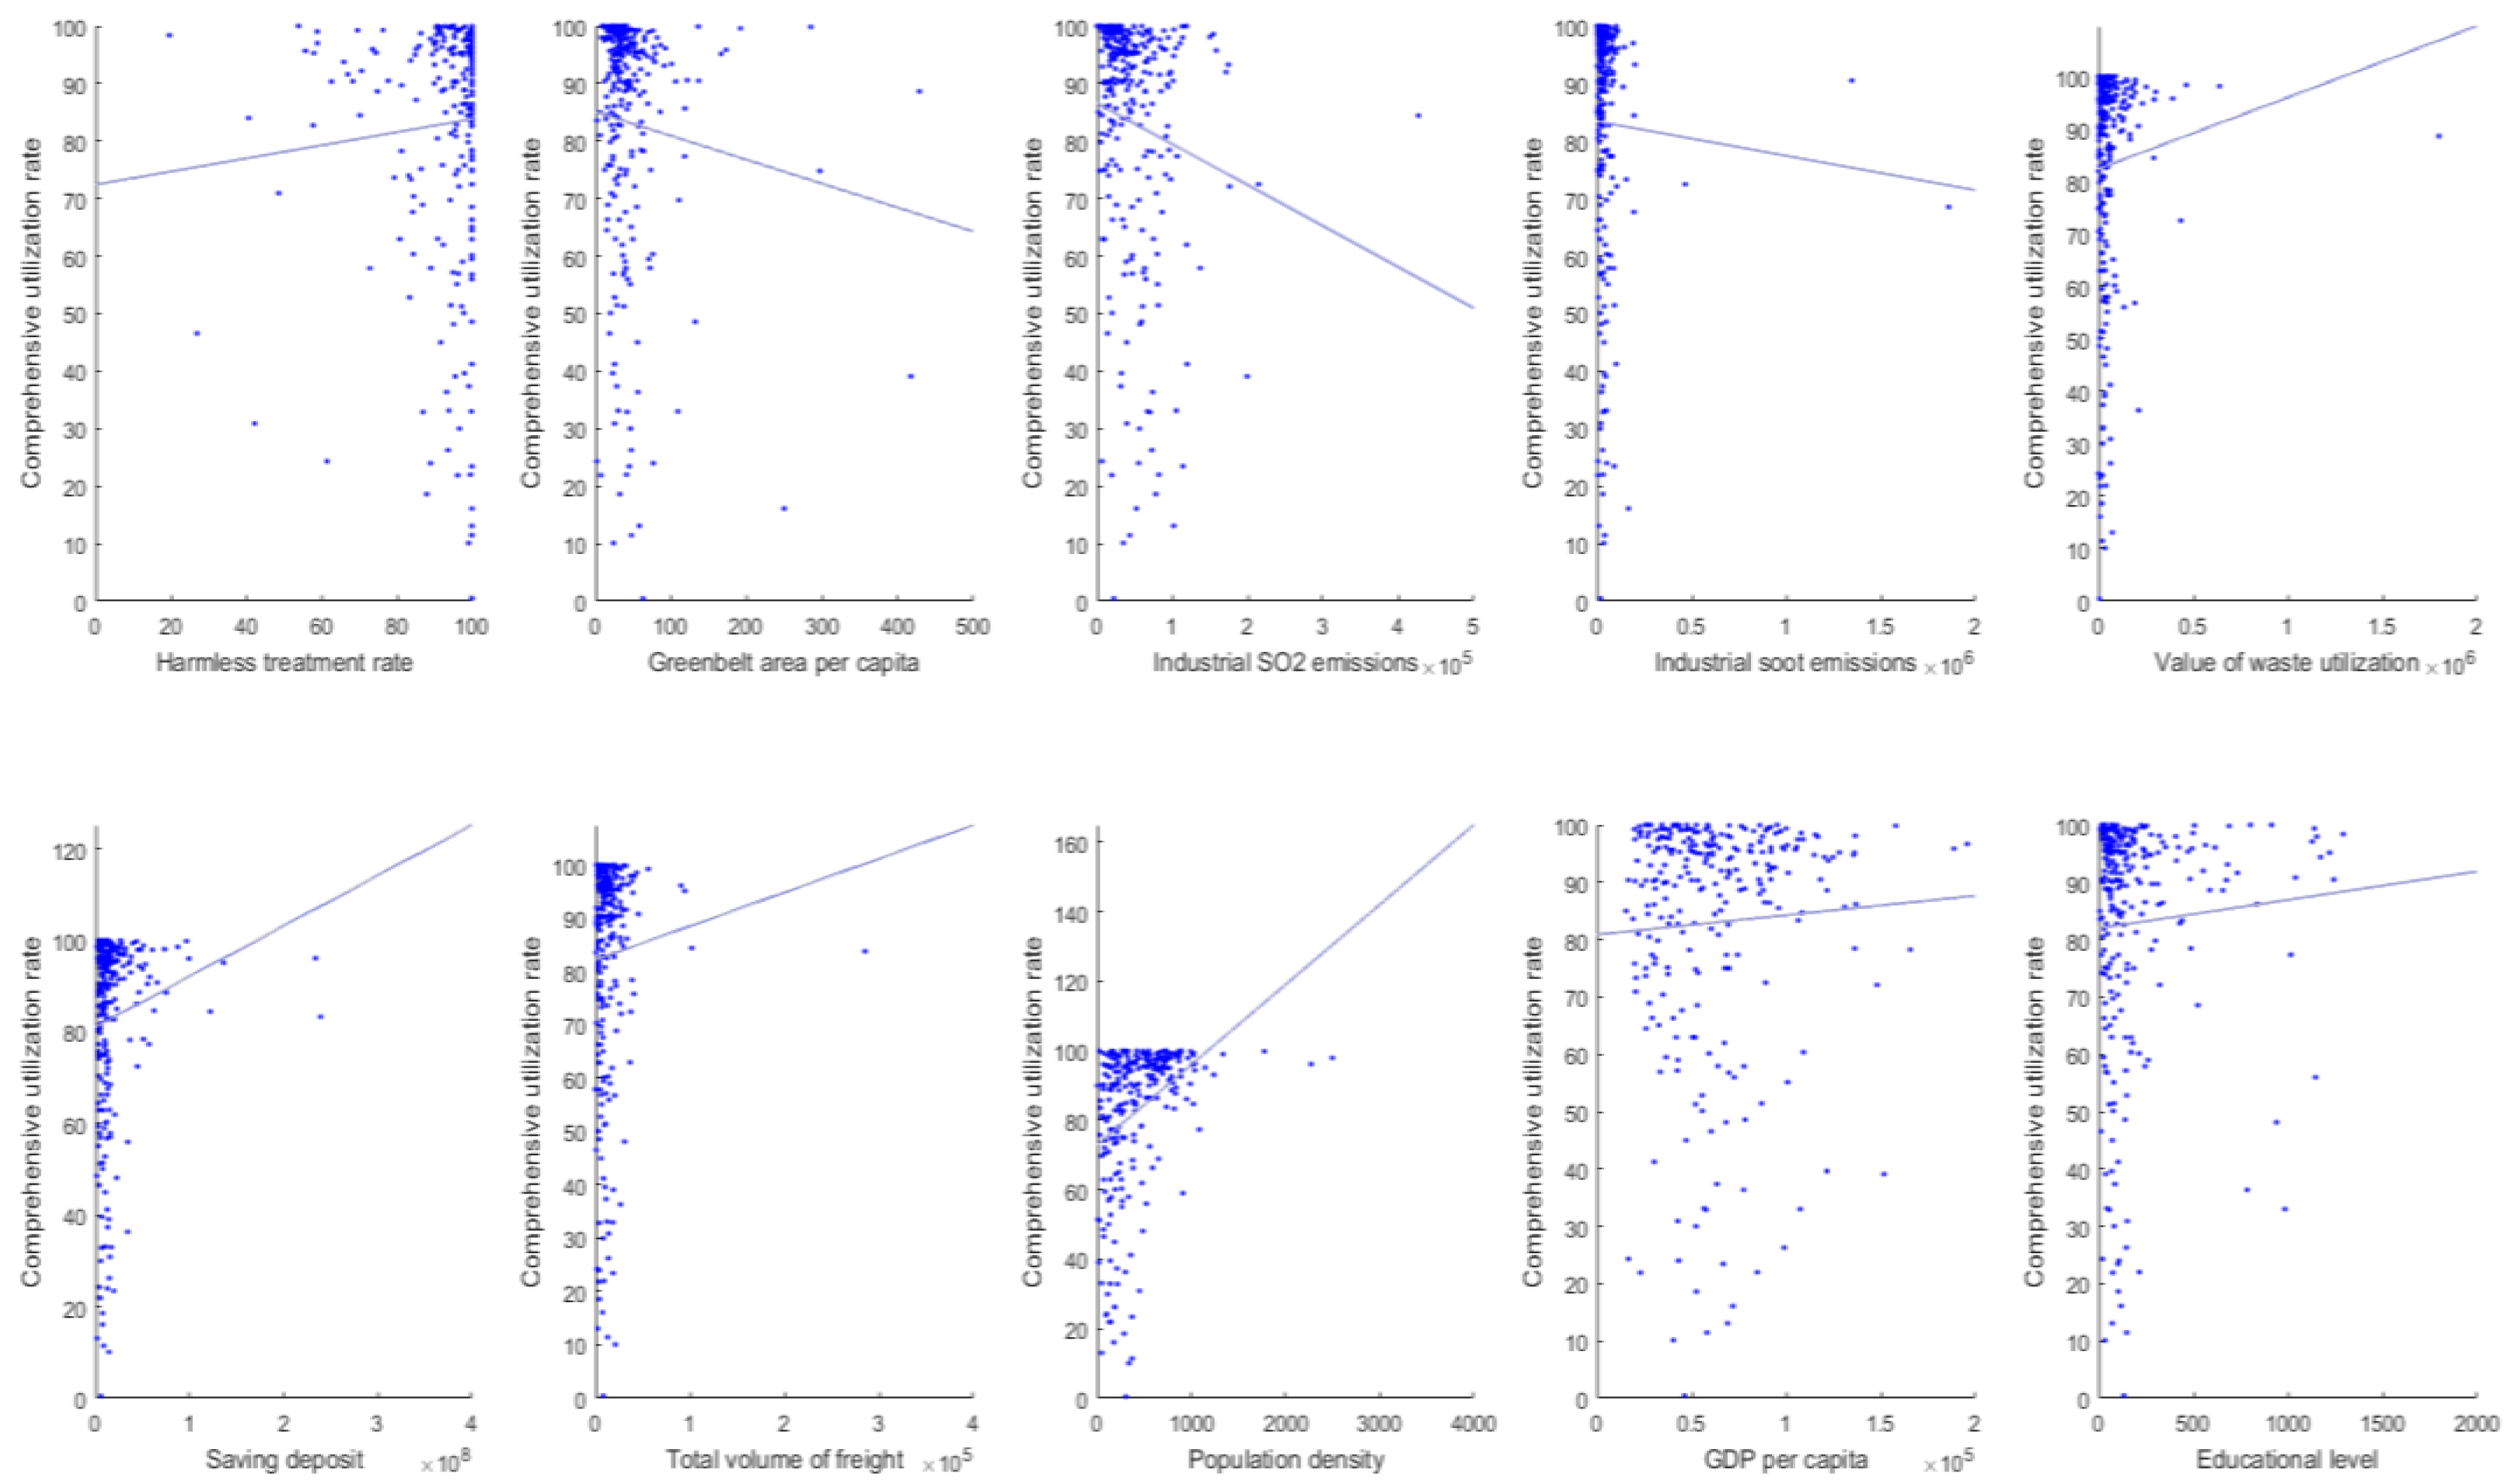
Besides the multiple linear regression analyses, we also made ten scatter plots and regression lines for each year and compared the results of the two years to strengthen the analysis of this study.
Through a two-tailed test, the result of the two regression models show that some variables are significant at 5%, 1% or 0.1% levels in the year 2009 and the year 2015. The R-squared model goodness of fit is about 20% in both years. Since our sample is not very large (287 observations) while we have a group of eleven variables, R2 = 0.1612 (2009 data)/R2 = 0.1842 (2015 data) is not a bad result in this situation. Meanwhile, harmless treatment rate, greenbelt area per capita, soot emissions, value of waste utilization, saving deposit and some other variables are not statistically significant at 5%, 1% or 0.1% levels. The following analysis will provide explanations of the result.
5.1. Resource Use Policy
The result of the analysis in Table 5 and Table 6 supports the hypotheses of resource use policy. The coefficient of the variable of resource use policy in the year 2009 is positive and highly statistically significant at the 0.05 level. Controlling for other factors, if a province applies resource use policy effectively, its comprehensive utilization rate of industrial solid waste will increase. In the year 2015, although the result is not statistically significant, we still can find that resource use policy is positively correlated to the comprehensive industrial solid waste utilization rate. The magnitude of the coefficient in 2009 means that a given city can increase its solid waste disposal amount by about 5.8% on average with the implementation of resource use policy. However, this rate decreased to 2.66% in 2015. This change matched the trend of the reduction of government investment in industrial solid waste disposal from 2009 to 2015. One reason should be that the Chinese government has taken various policies and approaches for solid waste disposal since the National Environmental Protection “12th Five-Year Plan” [50]. Resource use policy is no longer the single choice for provincial governments to process industrial solid waste. The effect of resource use policy is not as obvious as before. Another reason is that although more provinces have applied resource use policy after 2009 for solid waste disposal, resource use policy has been applied for over ten years in some other provinces and cities such as Beijing and Hebei. The marginal effect of resource use policy in those provinces has decreased.
The result of this research still indicates that as one of the most significant solid waste management policies at the provincial level, resource use policy indeed drives the disposal of solid waste in Chinese cities effectively. Since the compliance ratio of provincial resource use policy was high in 2009 and 2015, resource use policies’ positive impacts on solid waste disposal is within expectations. However, the decreasing effect of resource use policy needed to be noticed. Policy evaluations and adjustments should be made to extend the positive influence of this policy on solid waste disposal over the long term.
5.2. Stringency of Environmental Regulations
From the regression analysis and scatter plots, we can find that neither the harmless treatment rate of living garbage nor greenbelt area per capita were statistically significant and the correlations of the harmless treatment rate of living garbage and the industrial solid waste utilization rate were different in 2009 and 2015. Both variables were chosen to show governments’ attitudes for solid waste disposal.
The explanation of the change of the correlation of the harmless treatment rate is that in 2009, solid waste disposal issues in urban area was just noticed by the government. The government did not have enough capacity to deal with large amounts of living garbage and industrial solid waste at the same time [3]. With limited waste disposal abilities and capacities, processing more living garbage means less industrial solid waste would be recycled and utilized. Therefore, the correlation of the harmless treatment rate of living garbage and the industrial solid waste utilization rate was negative. However, in 2015, most cities in China had enhanced their abilities and capacities to deal with solid waste. There was no conflict of living garbage disposal and industrial solid waste disposal and the correlation became positive.
For the variable of greenbelt area per capita, according to the China City Statistical Yearbook 2010 and 2016 and the environmental Kuznets curve, it is not difficult to find that cities in China with high greenbelt area per capita normally have a low industrial development level (except for a few highly developed cities) and low industrial solid waste disposal abilities [18]. That caused the negative correlation of the greenbelt area per capita and industrial solid waste utilization rate. Only if the majority of Chinese cities change current heavy industrial-based development modes and establish effective industrial solid waste disposal systems, will the correlation of the greenbelt area per capita and comprehensive utilization rate of industrial solid waste be positive.
5.3. Pollutant Emissions
Industrial SO2 emission is the only variable which shows statistical significance in the multiple linear regression analyses in both 2009 and 2015. Industrial SO2 emission and the comprehensive utilization rate of industrial solid waste are negatively correlated at 0.1% level based on the 2009 data and negatively correlated at 5% level based on the 2015 data. To interpret the coefficient, controlling for other factors, when the industrial SO2 emission decreases, the comprehensive utilization rate of industrial solid waste would slightly increase in both years. Since industrial SO2 emission and industrial solid waste both come from industrial production and have the same source, this result is consistent with the observation that industrial SO2 emission tends to potentially affect the industrial solid waste utilization rate.
As different industries produce different amounts of industrial SO2 emission and solid waste, correlations of industrial SO2 emission and solid waste vary across different industrial sectors [13]. That is the reason why the coefficient in the analysis is small. The high level of statistical significance proves that industrial SO2 emission and the comprehensive utilization rate of industrial solid waste are correlated. However, the small size of the coefficient indicates that the substantive impact of the variable should be interpreted with caution.
Similar result also can be applied to explain the results for industrial soot emission. Although coefficients of the variable of industrial soot emission in 2009 and 2015 are not highly statistically significant, industrial soot emission still has a negative correlation with the comprehensive utilization rate of industrial solid waste.
In order to demonstrate that industrial SO2 emission and soot emission indeed have influence on the comprehensive utilization rate of industrial solid waste, we made a test. We made multiple linear regression analysis with the data of 2009 and 2015, keeping other factors but deleting variables of industrial SO2 emission and industrial soot emission. We found that if industrial SO2 and soot emission were dropped from the regression analysis, R-squared reduced from 0.1612 to 0.0646 with the 2009 data and R-squared reduced from 0.1842 to 0.1653 with the 2015 data. Therefore, industrial SO2 and soot emission are necessary variables to include in the explanation for the solid waste utilization rate.
5.4. Value of Waste Utilization
Coefficients of the variable of value of waste utilization in 2009 and 2015 are both positive but not statistically significant. The coefficient (0.00001) indicates that the correlation between the value of waste utilization and the industrial solid waste utilization rate is weak. Since China has adopted multiple waste utilization strategies in recent years, many types and amounts of waste are recycled and bring high economic values. However, the indicator of the value of waste utilization just calculates values from recycling and using some specific kinds of waste water, exhaust gas and solid waste. The weak correlation of the value of waste utilization and the industrial solid waste utilization rate can be seen as a positive signal that China takes various approaches to comprehensively utilize industrial solid waste.
5.5. Control Variables
The coefficient for total volume of freight is positive and statistically significant at 0.001 level in this research. It means that if the total volume of freight increases by 1000 units, the comprehensive utilization rate of industrial solid waste can increase 1 unit in 2009 and 0.1 unit in 2015, controlling for other factors.
From Figure 1, Figure 2 and Figure 3, we can find that population density is positively correlated with the industrial solid waste utilization rate. In 2009, if there is a 1% increase in the population density, there will be a 0.0023% increase in the utilization rate of industrial solid waste, controlling for other factors. The result is the same in 2015. Although more people always means more solid waste, provincial and municipal governments in China have proved that they have considered challenges and negative influences brought by population growth and have adopted effective policies to deal with solid waste produced by increasing people. The hypothesis of the variable of population density has proved that more people also means more chances for the city to manage environmental and solid waste disposal issues.
We can find that GDP per capita was negatively correlated with the industrial solid waste utilization rate in 2009 but positively correlated with the dependent variable in 2015 from Table 5 and Table 6 and Figure 3. To put the size of the coefficient into perspective, as the number of GDP per capita increases by 1%, the rate of solid waste utilization decreases by 0.0001% in the year 2009. From the data of 2009, we find that cities with higher GDP per capita are more likely to experience more problems in dealing industrial solid waste disposal compared with those with comparatively lower GDP per capita. This is partly related to the economic structure of Chinese provinces. Since China was still heavily relying on industrial development for economic growth, rich industrialized provinces meet more serious problems from industrial solid waste. Meanwhile, things have changed since the 12th FYP. From the 12th FYP, China puts more efforts to develop circular economy and green industries [50]. The economic structure has started to change so that green GDP has a bigger share. As China is trying to change and upgrade its economic and industrial system, GDP is more and more environmentally friendly. Therefore, in 2015, as the number of GDP per capita increases by 1%, the rate of solid waste utilization increases by 0.00005%. GDP per capita starts to show positive correlation with the industrial solid waste disposal utilization rate.
The variable of saving deposit is negatively correlated with the comprehensive utilization rate of industrial solid waste in both 2009 and 2015. In both years, if saving deposits increase by 1%, the solid waste utilization rate decreases by 0.00001%. Chinese cities with higher saving deposits than others have better economic situations and normally rely more on industries in the current development stage. They always produce more solid waste but with lower disposal abilities. High living standards and economic growth pressures reduce the effectiveness of the solid waste process. However, as mentioned, both China’s industrial and economic structures and people’s living habits are changing now [57]. High consumption has replaced high saving to become the new lifestyle in urban China, especially among young people in big cities. Therefore, saving deposits’ influence on local economic health is much weaker than before. This can explain why the coefficient is so small.
The results of regression analysis and scatter plots show that the educational level indeed has an influence on industrial solid waste utilization rate. However, from Table 5 and Table 6, correlations of the college/university student enrollment number and the comprehensive utilization rate of industrial solid waste are different in 2009 and 2015. In 2009, the college/university student enrollment number is positively correlated with the industrial solid waste utilization rate as when the number of college/university students increases by 1%, the rate of solid waste utilization in the city increases by 0.00131%. However, in 2015, the weak positive correlation of the college/university student enrollment number and the comprehensive utilization rate of industrial solid waste changed to negative. In that year, when the number of college/university students increases by 1%, the rate of solid waste utilization in the city decreases by 0.001%. Since Chinese poeple’s environmental awareness and educational level is increasing, the correlation should be positive. To explore the reason from literature, we can find that the change of the correlation might be affected by other reasons rather than the variable of education level itself. Packaging materials and waste from online shopping goods and takeaway food have become an unexpected new composition of solid waste in the last five years. University/college students are major consumers of online shopping and takeaway food [57]. The increasing enrollment number of college/university students means more solid waste will be produced and will bring negative influence on solid waste disposal. The negative effect of consumption habits offsets the positive impact of environmental education. For further sustainable development, environmental education should be strengthened and environmentally friendly consumption habits should be developed.
6. Conclusions
Solid waste has become a problem which has seriously affected China’s long term sustainable development in the last three decades. Although the Chinese government has adopted policies to solve solid waste problems, the performance of solid waste disposal has not been systematically examined at the local level. This paper has analyzed factors driving the growth of solid waste disposal capacity in Chinese cities, with hypotheses proposed on resource use policy, environmental regulation, polluting emissions and value of waste utilization. The statistical analysis of the 2009 and 2015 data sets reveal that the adoption of resource use policy drives local China’s solid waste disposal development.
Meanwhile, current study still can be improved. This study treats the concept of industrial solid waste as a uniform term to measure. Since the composition of industrial solid waste varies in different sectors and cities, future study will focus on some major types of solid wastes to conduct further analysis. A similar problem also exists in the independent variable of resource use policy. Since there is a lack of effective measurement to judge the quality of resource use policy, it is hard to quantify the quality of the policy. Future study will try to fix the problem and enhance the explanation.
Finally, we offer some specific policy recommendations to support the long term sustainable development of solid waste disposal in local China.
6.1. Continue Implementing Solid Waste Disposal Policies
Maintaining and strengthening solid waste disposal legislations is essential for keeping current development momentum of solid waste management. According to the above analysis, it is obvious that a city located in a province with resource use policy has stronger solid waste disposal capacity than others. Therefore, Chinese cities should keep the implementation of resource use policy and reform it for better effectiveness.
Meanwhile, through this research, we found that other environmental regulations do not have a direct influence on the comprehensive utilization rate of industrial solid waste. This means that although many environmental policies have been made to regulate solid waste disposal, further investigations are needed to assess their effectiveness.
Government officials could ask environmental experts to participate in making resource use policy and other solid waste disposal policies to keep policy arrangements more professional and targeted. The Chinese government also should consider allowing more enterprises and communities to be involved in solid waste disposal to reduce official pressures and increase effectiveness through market and social powers. Besides, the government itself should take action to dispose of some specific types of solid waste. If certain kinds of solid wastes are hard to be collected and recycled by voluntary or commercial actions, the government should use its administrative power to support relevant official departments and professional organizations to address them.
6.2. Upgrading the Industrial System
Many solid wastes are from industrial sectors in China. The traditional industrial system and production methods have seriously affected the environment. Controlling the development of traditional industries, especially heavy industries, is a good approach to reducing solid waste problems as well as polluting emissions. In recent years, upgrading industrial systems and developing sustainable green industries have been new trends to reduce resource and environmental burdens for long term development.
All Chinese provincial governments and municipal governments should not only follow general environmental policies made by the central government, but also develop their own sustainable development strategies and upgrade their industrial system according to local contexts. All the industrial upgrading actions and development of circular economies should consider local economic and environmental carrying capacity. If the local government just thinks about the urgency of upgrading the industrial system but ignores local economic/resource capacity and advantages, it can only bring new disasters for sustainable development. Only the sustainable industrial system has the potential to solve China’s solid waste problems at a more fundamental level.
However, upgrading environmental equipment and industrial systems needs much money and policy support. It is hard to totally rely on local government and entrepreneurs to achieve the task since upgrading for environmental purposes makes it hard to get direct economic profit. The central government should give more preferential policies and financial subsidies for local governments and enterprises to upgrade local industrial systems, factories and environmental equipment. The official involvement could guide the development of industrial systems in China to pay more attention to environment protection and energy saving than economic profits. China also can combine experience from developed countries and its own characteristics to avoid the unpredicted problems in the industrial upgrading plan.
6.3. Push Forward Economic and Social Reform
This research demonstrated the relationship between social and economic development and solid waste disposal. On the one hand, fast social and economic growth increases environmental burdens of solid waste disposal. On the other hand, economic and social development can impose pressures and chances on the government to pay more attention to prioritize and solve solid waste problems.
As mentioned, economic development can offer capital and new technology for a province or a city to solve solid waste problems. However, the premise is that the province or the city should have a relatively healthy economic structure. Meanwhile, heavy industrial-based economic structure is still very common in China nowadays which increases difficulty in implementing environmental policies.
In order to change the situation, China should abandon its focus on GDP, and refocus its development strategy to economic and social structure reform, striking a balance between economic development, social development and environmental protection. The whole economic and social structure of China should be shifted to sustainable development. Both administrative approaches and market approaches can be taken to make appropriate institutional arrangements. China should deepen the reform of economic structures and focus on environmentally friendly production methods. More detailed policies should be made and the execution of policies should be strengthened to keep the economic and social reform on the right path. Environmental offenses should be punished strictly. The government could also use multiple ways to increase the development of finance, IT and other new industries, which produce less solid waste and are environmentally friendly. Social/private capital, foreign investment and government resources should all be used to push the sustainable reform of economic and social sectors.
6.4. Increasing Environmental Education
Environmental protection and solid waste disposal cannot only rely on making appropriate institutional arrangements but also need to increase environmental education for students, officials, enterprise owners, farmers and anyone else in the society. China needs to establish a formal environmental education system to spread environmental common sense and knowledge, and improve the environmental education level. Establishing healthy and environmentally friendly living and consumption habits should also be included in the education system. Besides, the Chinese government should establish a professional training system to offer knowledge to enterprise owners, farmers and workers about how to deal with waste and pollutants effectively and scientifically.
Acknowledgments
This research is supported by the NSFC project of China “Risk Identification and Prevention Mechanisms of Non-traditional Security Issues—A Case Study of Information Sharing and Use in Smart City Governance” (Project No. 71734002). This paper is also supported by Hubei Province Teaching Reform Fund “A Research on the Training Model of Undergraduate Student’s International Consciousness and Intercultural Communication Ability in Public Administration Subject” (Project No. 2014061). This paper is also supported by the Independent Innovation Research Fund of Huazhong University of Science and Technology “An International Comparative Study of Urban Emergency Management System”. A special thanks to Li Danqing in Stony Brook University who offered advice and support for some statistical issues in this paper. A special thanks to Ryan Kramer for his effort in data extraction and processing to make this work possible.
Author Contributions
All authors are responsible for the design of the research. The draft manuscript and data analysis was done by Boya Zhou with Chunxia Sun and Hongtao Yi providing review and comments. All the authors were engaged in the final manuscript preparation and agreed to the publication of this paper.
Conflicts of Interest
The authors declare no conflict of Interest.
References
- National Bureau of Statistics of People’s Republic of China. China Statistical Yearbook 2016; China Statistics Press: Beijing, China, 2016; ISBN 978-7-5037-7917-6.
- Tang, S.; Hao, P.; Huang, X. Land conversion and urban settlement intentions of the rural population in China: A case study of suburban Nanjing. Habitat Int. 2016, 51, 149–158. [Google Scholar] [CrossRef]
- Zhang, D.Q.; Tan, S.Q.; Gersberg, R.M. Municipal solid waste management in China: Status, problems and challenges. J. Environ. Manag. 2010, 91, 1623–1633. [Google Scholar] [CrossRef] [PubMed]
- Li, J.; Li, F.; Xi, S.; Jin, R. Descriptive Study of 2014 industrial solid waste treatment situation in major cities of China. Glob. J. Res. Bus. Manag. 2016, 6, 432–440. [Google Scholar]
- Wen, X.; Luo, Q.; Hu, H.; Wang, N.; Chen, Y.; Jin, J.; Hao, Y.; Xu, G.; Li, F.; Fang, W. Comparison research on waste classification between China and the EU, Japan, and the USA. J. Mater. Cycles Waste Manag. 2014, 16, 321–334. [Google Scholar] [CrossRef]
- Pires, A.; Martinho, G.; Chang, N.B. Solid waste management in European countries: A review of systems analysis techniques. J. Environ. Manag. 2011, 92, 1033–1050. [Google Scholar] [CrossRef] [PubMed]
- Marshall, R.E.; Farahbakhsh, K. Systems approaches to integrated solid waste management in developing countries. Waste Manag. 2013, 33, 988–1003. [Google Scholar] [CrossRef] [PubMed]
- Tian, J.; Liu, W.; Lai, B.; Li, X.; Chen, L. Study of the performance of eco-industrial park development in China. J. Clean. Prod. 2014, 64, 486–494. [Google Scholar] [CrossRef]
- Zheng, L.; Song, J.; Li, C.; Gao, Y.; Geng, P.; Qu, B.; Lin, L. Preferential policies promote municipal solid waste (MSW) to energy in China: Current status and prospects. Renew. Sustain. Energy Rev. 2014, 36, 135–148. [Google Scholar] [CrossRef]
- Huang, Q.; Wang, Q.; Dong, L.; Xi, B.; Zhou, B. The current situation of solid waste management in China. J. Mater. Cycles Waste Manag. 2006, 8, 63–69. [Google Scholar] [CrossRef]
- Hanifzadeh, M.; Nabati, Z.; Longka, P.; Malakul, P.; Apul, D.; Kim, D.S. Life cycle assessment of superheated steam drying technology as a novel cow manure management method. J. Environ. Manag. 2017, 199, 83–90. [Google Scholar] [CrossRef] [PubMed]
- Shekdar, A.V. Sustainable solid waste management: An integrated approach for Asian countries. Waste Manag. 2009, 29, 1438–1448. [Google Scholar] [CrossRef] [PubMed]
- Li, Y.; Zhao, X.; Li, Y.; Li, X. Waste incineration industry and development policies in China. Waste Manag. 2015, 46, 234–241. [Google Scholar] [CrossRef] [PubMed]
- Mian, M.M.; Zeng, X.; Nasry, A.A.N.B.; Al-Hamadani, S.M. Municipal solid waste management in China: A comparative analysis. J. Mater. Cycles Waste Manag. 2017, 19, 1127–1135. [Google Scholar] [CrossRef]
- Sun, X.; Li, J.; Zhao, X.; Zhu, B.; Zhang, G. A review on the management of municipal solid waste fly ash in American. Procedia Environ. Sci. 2016, 31, 535–540. [Google Scholar] [CrossRef]
- Troschinetz, A.M.; Mihelcic, J.R. Sustainable recycling of municipal solid waste in developing countries. Waste Manag. 2009, 29, 915–923. [Google Scholar] [CrossRef] [PubMed]
- United Nations, Environment Programme. Key Environmental Issues: Management of Solid Waste and Sewage, Maldives: State of the Environment 2002; United Nations: New York, NY, USA, 2002. [Google Scholar]
- Arbulú, I.; Lozano, J.; Rey-Maquieira, J. Tourism and solid waste generation in Europe: A panel data assessment of the Environmental Kuznets Curve. Waste Manag. 2015, 46, 628–636. [Google Scholar] [CrossRef] [PubMed]
- Poon, C.S. A few pointers for effective MSW management for Hong Kong. In Proceedings of the Second Expert Meeting on Solid Waste Management in Asia and Pacific Islands, Kitakyushsu, Japan, 23–24 November 2006. [Google Scholar]
- Othman, S.N.; Noor, Z.Z.; Abba, A.H.; Yusuf, R.O.; Hassan, M.A.A. Review on life cycle assessment of integrated solid waste management in some Asian countries. J. Clean. Prod. 2013, 41, 251–262. [Google Scholar] [CrossRef]
- Memon, M.A. Integrated solid waste management based on the 3R approach. J. Mater. Cycles Waste Manag. 2010, 12, 30–40. [Google Scholar] [CrossRef]
- Guerrero, L.A.; Maas, G.; Hogland, W. Solid waste management challenges for cities in developing countries. Waste Manag. 2013, 33, 220–232. [Google Scholar] [CrossRef] [PubMed]
- Ngoc, U.N.; Schnitzer, H. Sustainable solutions for solid waste management in Southeast Asian countries. Waste Manag. 2009, 29, 1982–1995. [Google Scholar] [CrossRef] [PubMed]
- Manaf, L.A.; Samah, M.A.A.; Zukki, N.I.M. Municipal solid waste management in Malaysia: Practices and challenges. Waste Manag. 2009, 29, 2902–2906. [Google Scholar] [CrossRef] [PubMed]
- Dhokhikah, Y.; Trihadiningrum, Y.; Sunaryo, S. Community participation in household solid waste reduction in Surabaya, Indonesia. Resour. Conserv. Recycl. 2015, 102, 153–162. [Google Scholar] [CrossRef]
- Rathi, S. Alternative approaches for better municipal solid waste management in Mumbai, India. Waste Manag. 2006, 26, 1192–1200. [Google Scholar] [CrossRef] [PubMed]
- Srivastava, V.; Ismail, S.A.; Singh, P.; Singh, R.P. Urban solid waste management in the developing world with emphasis on India: Challenges and opportunities. Rev. Environ. Sci. Bio/Technol. 2015, 14, 317–337. [Google Scholar] [CrossRef]
- Nizami, A.S.; Rehan, M.; Waqas, M.; Naqvi, M.; Ouda, O.K.M.; Shahzad, K.; Miandad, R.; Khan, M.Z.; Syamsiro, M.; Ismail, I.M.; et al. Waste biorefineries: Enabling circular economies in developing countries. Bioresour. Technol. 2017, 241, 1101–1117. [Google Scholar] [CrossRef] [PubMed]
- Fei, F.; Qu, L.; Wen, Z.; Xue, Y.; Zhang, H. How to integrate the informal recycling system into municipal solid waste management in developing countries: Based on a China’s case in Suzhou urban area. Resour. Conserv. Recycl. 2016, 110, 74–86. [Google Scholar] [CrossRef]
- Moh, Y.C.; Manaf, L.A. Overview of household solid waste recycling policy status and challenges in Malaysia. Resour. Conserv. Recycl. 2014, 82, 50–61. [Google Scholar] [CrossRef]
- Pappu, A.; Saxena, M.; Asolekar, S.R. Solid wastes generation in India and their recycling potential in building materials. J. Build. Environ. 2007, 42, 2311–2320. [Google Scholar] [CrossRef]
- Tozlu, A.; Özahi, E.; Abuşoğlu, A. Waste to energy technologies for municipal solid waste management in Gaziantep. Renew. Sustain. Energy Rev. 2016, 54, 809–815. [Google Scholar] [CrossRef]
- Mathews, J.A.; Tan, H. Lessons from China: The country consumes the most resources in the world and produces the most waste—But it also has the most advanced solutions. Nature 2016, 531, 440–443. [Google Scholar] [CrossRef] [PubMed]
- Chen, X.; Geng, Y.; Fujita, T. An overview of municipal solid waste management in China. Waste Manag. 2010, 30, 716–724. [Google Scholar] [CrossRef] [PubMed]
- Zhao, P.; Shen, Y.; Ge, S.; Chen, Z.; Yoshikawa, K. Clean solid biofuel production from high moisture content waste biomass employing hydrothermal treatment. Appl. Energy 2014, 131, 345–367. [Google Scholar] [CrossRef]
- Chinese Environmental Yearbook Compiling Committee. China Environmental Yearbook 2011; China Environmental Science Press: Beijing, China, 2011; ISBN 978-7-5037-6408-0. [Google Scholar]
- Su, B.; Heshmati, A.; Geng, Y.; Yu, X. A review of the circular economy in China: Moving from rhetoric to implementation. J. Clean. Prod. 2013, 42, 215–227. [Google Scholar] [CrossRef]
- Zhao, X.; Li, H.; Wu, L.; Qi, Y. Implementation of energy-saving policies in China: How local governments assisted industrial enterprises in achieving energy-saving targets. Energy Policy 2014, 66, 170–184. [Google Scholar] [CrossRef]
- Zhao, X.; Jiang, G.; Li, A.; Li, Y. Technology, cost, a performance of waste-to-energy incineration industry in China. Renew. Sustain. Energy Rev. 2016, 55, 115–130. [Google Scholar]
- Duan, H.; Huang, Q.; Wang, Q.; Zhou, B.; Li, J. Hazardous waste generation and management in China: A review. J. Hazard. Mater. 2008, 158, 221–227. [Google Scholar] [CrossRef] [PubMed]
- Rotich, K.H.; Zhao, Y.; Dong, J. Municipal solid waste management challenges in developing countries—Kenyan case study. Waste Manag. 2006, 26, 92–100. [Google Scholar]
- Babayemi, J.O.; Dauda, K.T. Evaluation of solid waste generation, categories and disposal options in developing countries: A case study of Nigeria. J. Appl. Sci. and Environ. Manag. 2009, 13, 83–88. [Google Scholar] [CrossRef]
- Ezeah, C.; Roberts, C.L. Analysis of barriers and success factors affecting the adoption of sustainable management of municipal solid waste in Nigeria. J. Environ. Manag. 2012, 103, 9–14. [Google Scholar] [CrossRef] [PubMed]
- Liu, L.; Zhang, B.; Bi, J. Reforming China’s multi-level environmental governance: Lessons from the 11th Five-Year Plan. Environ. Sci. Policy 2012, 21, 106–111. [Google Scholar] [CrossRef]
- Xu, Y. The use of a goal for SO2 mitigation planning and management in China’s 11th Five-Year Plan. J. Environ. Plan. Manag. 2011, 54, 769–783. [Google Scholar] [CrossRef]
- Zhou, J.; Mao, X.Q.; Hu, T.; Zeng, A.; Xing, Y.K.; Corsetti, G. Implications of the 11th and 12th Five-Year Plans for energy conservation and CO2 and air pollutants reduction: A case study from the city of Urumqi, China. J. Clean. Prod. 2016, 112, 1767–1777. [Google Scholar] [CrossRef]
- Gu, A.; Teng, F.; Feng, X. Effects of pollution control measures on carbon emission reduction in China: Evidence from the 11th and 12th Five-Year Plans. Clim. Policy 2016, 2016, 1–12. [Google Scholar] [CrossRef]
- Xue, W.; Wang, J.; Niu, H.; Yang, J.; Han, B.; Lei, Y.; Chen, H.; Jiang, C. Assessment of air quality improvement effect under the national total emission control program during the twelfth national five-year plan in China. Atmos. Environ. 2013, 68, 74–81. [Google Scholar] [CrossRef]
- Wang, S.; Xing, J.; Zhao, B.; Jang, C.; Hao, J. Effectiveness of national air pollution control policies on the air quality in metropolitan areas of China. J. Environ. Sci. 2014, 26, 13–22. [Google Scholar] [CrossRef]
- Chen, W.; Chen, J.; Xu, D.; Liu, J.; Niu, N. Assessment of the practices and contributions of China’s green industry to the socio-economic development. J. Clean. Prod. 2017, 153, 648–656. [Google Scholar] [CrossRef]
- Shu, C.; Zhou, K.Z.; Xiao, Y.; Gao, S. How green management influences product innovation in China: The role of institutional benefits. J. Bus. Ethics 2016, 133, 471–485. [Google Scholar] [CrossRef]
- Chung, S.S.; Lo, C.W.H. Local waste management constraints and waste administrators in China. Waste Manag. 2008, 28, 272–281. [Google Scholar] [CrossRef] [PubMed]
- National Bureau of Statistics of People’s Republic of China. China City Statistical Yearbook 2016; China Statistics Press: Beijing, China, 2016; ISBN 978-7-5037-8082-0.
- National Bureau of Statistics of People’s Republic of China. China City Statistical Yearbook 2010; China Statistics Press: Beijing, China, 2011; ISBN 978-7-5037-6192-8.
- National Bureau of Statistics of People’s Republic of China. China Statistical Yearbook 2010; China Statistics Press: Beijing, China, 2010; ISBN 978-7-5037-6070-9/C.2424.
- Wang, S.; Hao, J. Air quality management in China: Issues, challenges, and options. J. Environ. Sci. 2012, 24, 2–13. [Google Scholar] [CrossRef]
- Clemes, M.D.; Gan, C.; Zhang, J. An empirical analysis of online shopping adoption in Beijing, China. J. Retail. Consum. Serv. 2014, 21, 364–375. [Google Scholar] [CrossRef]
Figure 1.
Scatter Plots and Regression Lines of Variables in 2009. Source: China City Statistical Yearbook 2010 [54]; China Statistical Yearbook 2010 [55]; made by authors.

Figure 2.
Scatter Plots and Regression Lines of Variables in 2015. Source: China City Statistical Yearbook 2016 [53]; China Statistical Yearbook 2016 [1]; made by authors.

Figure 3.
The Comparison of Scatter Plots and Regression Lines of Variables in 2009 and 2015. Source: China City Statistical Yearbook 2010 & 2016 [53,54]; China Statistical Yearbook 2010 & 2016 [1,55]; made by authors.

Table 1.
National Environmental Protection Plans.
| ID | Year | Solid Waste Policies and Plans |
|---|---|---|
| 1 | 2003 | The 11th Five-Year Plan (11th FYP) |
| 2 | 2009 | The 12th Five-Year Plan (12th FYP) |
| 3 | 2009 | National Total Emission Control (NTEC) |
| 4 | 2011 | National Environmental Protection “12th Five-Year Plan” |
| 5 | 2015 | Solid Waste Pollution Preventing and Control Law (Revised Version) |
Source: Summarized by authors.
Table 2.
Variables, Measures and Data Sources.
| Variables | Measures | Predicted Relationship | Data Sources |
|---|---|---|---|
| Comprehensive utilization rate | Industrial solid waste comprehensive utilization rate of Chinese cities (%) | Dependent variable | China City Statistical Yearbook 2010, 2016 |
| Resource use policy | Whether there is accurate provincial resource (waste) use policy | Independent variable | Statistics office by province |
| Harmless treatment rate | Harmless treatment rate of living garbage (%) | Independent variable | China City Statistical Yearbook 2010, 2016 |
| Greenbelt area per capita | Greenbelt area per capita (square meter) | Independent variable | China City Statistical Yearbook 2010, 2016 |
| Industrial SO2 emissions | Industrial SO2 emissions (ton) | Independent variable | China City Statistical Yearbook 2010, 2016 |
| Industrial Soot emissions | Industrial soot emissions (ton) | Independent variable | China City Statistical Yearbook 2010, 2016 |
| Value of waste utilization | Value of comprehensive utilization of waste (ten thousand RMB Yuan) | Independent variable | China City Statistical Yearbook 2010, 2016 |
| Saving deposit | Saving deposit of resident at the end of year (ten thousand RMB Yuan) | Control | China Statistical Yearbook 2010, 2016 |
| Total volume of freight | Total volume of freight (ten thousand tons) | Control | China City Statistical Yearbook 2010, 2016 |
| Population density | Population density (person per square kilometer) | Control | China Statistical Yearbook 2010, 2016 |
| GDP per capita | GDP per capita (RMB Yuan) | Control | China Statistical Yearbook 2010, 2016 |
| Educational level | Number of population who have higher education (College/university students enrollment per ten thousand people) | Control | China City Statistical Yearbook 2010, 2016 |
Table 3.
Descriptive Statistics (Year 2009).
| Variables | Obs. | Mean | Standard Deviation | Min | Max |
|---|---|---|---|---|---|
| Comprehensive utilization rate | 280 | 81.17175 | 21.8174 | 1.85 | 100 |
| Resource use policy | 287 | 0.4703833 | 0.4999939 | 0 | 1 |
| Harmless treatment rate | 258 | 80.02523 | 24.54255 | 0.44 | 100 |
| Greenbelt area per capita | 287 | 39.90693 | 56.90494 | 0.42 | 724.3 |
| Industrial SO2 emissions | 279 | 59,944.44 | 55,641.12 | 103 | 586,117 |
| Industrial soot emissions | 279 | 19,472.51 | 17,031.04 | 82 | 108,674 |
| Value of waste utilization | 274 | 54,600.89 | 113,873 | 2 | 1,586,099 |
| Saving deposit | 287 | 8,812,627 | 1,500,000 | 587,675 | 1,460,000 |
| Total volume of freight | 287 | 9539.378 | 9259.629 | 409.36 | 76,821.06 |
| Population density | 286 | 977.0937 | 871.7021 | 13.3 | 5324.12 |
| GDP per capita | 282 | 38,269.64 | 24,048.86 | 16.3 | 146,324 |
| Educational level | 280 | 161.2757 | 214.5462 | 5.5 | 1228.06 |
Table 4.
Descriptive Statistics (Year 2015).
| Variables | Obs. | Mean | Standard Deviation | Min | Max |
|---|---|---|---|---|---|
| Comprehensive utilization rate | 278 | 83.14626 | 21.33987 | 0.49 | 100 |
| Resource use policy | 287 | 0.6097561 | 0.4886569 | 0 | 1 |
| Harmless treatment rate | 279 | 93.38419 | 12.17444 | 19.65 | 100 |
| Greenbelt area per capita | 277 | 47.39215 | 48.78732 | 0 | 428.3126 |
| Industrial SO2 emissions | 284 | 49,192.24 | 42,453 | 208 | 426,800 |
| Industrial soot emissions | 284 | 48,901.32 | 139,805 | 854 | 1,859,866 |
| Value of waste utilization | 279 | 60,375.61 | 129,682.1 | 2 | 1,799,985 |
| Saving deposit | 286 | 18,100,000 | 25,800,000 | 1,466,300 | 239,000,000 |
| Total volume of freight | 286 | 14,185.48 | 20,561.38 | 80.0213 | 285,238 |
| Population density | 286 | 435.4102 | 339.1644 | 5.77 | 2501.14 |
| GDP per capita | 281 | 62,843.37 | 32,415.43 | 15,356 | 195,792 |
| Educational level | 282 | 195.4665 | 256.171 | 6.29 | 1293.69 |
Table 5.
Regression Analysis of Solid Waste Disposal in Chinese Cities in 2009.
| Variables | Coefficient | Standard Errors | t | P > t | 95% Conf. | Interval |
|---|---|---|---|---|---|---|
| Resource use policy | 5.786 * | 2.616 | 2.21 | 0.028 | 0.6319391 | 10.93968 |
| Harmless treatment rate | −0.0462 | 0.054 | −0.86 | 0.39 | −0.1518016 | 0.059458 |
| Greenbelt area per capita | −0.0121 | 0.034 | −0.36 | 0.72 | −0.0786566 | 0.0544227 |
| SO2 emissions | −0.0001 *** | 0.00003 | −3.48 | 0.001 | −0.0001794 | −0.0000497 |
| Soot emissions | −0.0001 | 0.0001 | −1.39 | 0.167 | −0.0003082 | 0.0000537 |
| Value of waste utilization | 0.00001 | 0.00001 | 0.96 | 0.339 | −0.0000118 | 0.0000341 |
| Saving deposit | −0.00001 | 0.00001 | −0.58 | 0.56 | −0.0000003 | 0.0000002 |
| Total volume of freight | 0.001 *** | 0.0002 | 4.27 | 0 | 0.0004964 | 0.0013473 |
| Population density | 0.0023 | 0.002 | 1.49 | 0.137 | −0.0007406 | 0.0053433 |
| GDP per capita | −0.0001 | 0.0001 | −0.68 | 0.494 | −0.0001842 | 0.0000892 |
| Educational level | 0.00131 | 0.0064 | 0.2 | 0.84 | −0.0113882 | 0.0139989 |
| Constant | 83.10 *** | 4.716 | 17.62 | 0 | 73.81128 | 92.39569 |
| Observation | 240 | 2.616 | 2.21 | 0.028 | 0.6319391 | 10.93968 |
| R-squared | 0.1612 | - | - | - | - | - |
Table 6.
Regression Analysis of Solid Waste Disposal in Chinese Cities in 2015.
| Variables | Coefficient | Standard Errors | t | P > t | 95% Conf. | Interval |
|---|---|---|---|---|---|---|
| Resource use policy | 2.659 | 2.784 | 0.95 | 0.341 | −2.825879 | 8.143081 |
| Harmless treatment rate | 0.0267 | 0.10454 | 0.26 | 0.799 | −0.1792381 | 0.232645 |
| Greenbelt area per capita | −0.0523 | 0.02849 | −1.84 | 0.068 | −0.1084265 | 0.0038111 |
| SO2 emissions | −0.0001 * | 0.000035 | −2.29 | 0.023 | −0.0001487 | −0.000011 |
| Soot emissions | −0.000001 | 0.00001 | −0.21 | 0.834 | −0.0000192 | 0.0000155 |
| Value of waste utilization | 0.00001 | 0.00001 | 0.88 | 0.379 | −0.0000115 | 0.0000302 |
| Saving deposit | −0.00001 | 0.00001 | −0.56 | 0.574 | −0.000001 | 0.0000001 |
| Total volume of freight | 0.0001 | 0.00015 | 0.54 | 0.589 | −0.0002177 | 0.0003823 |
| Population density | 0.023 *** | 0.00458 | 5.03 | 0 | 0.0139863 | 0.0320118 |
| GDP per capita | 0.00005 | 0.00005 | 1.06 | 0.289 | −0.0000458 | 0.0001532 |
| Educational level | −0.001 | 0.00602 | −0.12 | 0.907 | −0.0125615 | 0.0111495 |
| Constant | 70.68 *** | 9.7187 | 7.27 | 0 | 51.53422 | 89.82399 |
| Observation | 252 | 2.784 | 0.95 | 0.341 | −2.825879 | 8.143081 |
| R-squared | 0.1842 | - | - | - | - | - |
© 2017 by the authors. Licensee MDPI, Basel, Switzerland. This article is an open access article distributed under the terms and conditions of the Creative Commons Attribution (CC BY) license (http://creativecommons.org/licenses/by/4.0/).
Share and Cite
MDPI and ACS Style
Zhou, B.; Sun, C.; Yi, H. Solid Waste Disposal in Chinese Cities: An Evaluation of Local Performance. Sustainability 2017, 9, 2234. https://doi.org/10.3390/su9122234
AMA Style
Zhou B, Sun C, Yi H. Solid Waste Disposal in Chinese Cities: An Evaluation of Local Performance. Sustainability. 2017; 9(12):2234. https://doi.org/10.3390/su9122234
Chicago/Turabian StyleZhou, Boya, Chunxia Sun, and Hongtao Yi. 2017. "Solid Waste Disposal in Chinese Cities: An Evaluation of Local Performance" Sustainability 9, no. 12: 2234. https://doi.org/10.3390/su9122234
Note that from the first issue of 2016, this journal uses article numbers instead of page numbers. See further details here.