Article

Energy Toolbox—Framework for the Development of a Tool for the Primary Design of Zero Emission Buildings in European and Asian Cities

by
Christoph Koller
1,
Max Jacques Talmon-Gros
2,
Ranka Junge
1 and
Thorsten Schuetze
3,*
1
Institute of Natural Resource Sciences, Zurich University of Applied Sciences, Grüental, 8820 Wädenswil, Switzerland
2
Oberortweg 6, 8804 Au, Switzerland
3
Department of Architecture, College of Engineering, SungKyunKwan University, 2066 Seobu-ro, Jangan-gu, Suwon-si, Gyeonggi-do 440-746, Korea
*
Author to whom correspondence should be addressed.
Sustainability 2017, 9(12), 2244; https://doi.org/10.3390/su9122244
Submission received: 17 October 2017 / Revised: 26 November 2017 / Accepted: 28 November 2017 / Published: 5 December 2017

Abstract

:
This paper discusses the framework for the development of an Energy Toolbox (ETB). The aim of the ETB is to support the design of domestic Zero Emission Buildings (ZEBs), according to the concept of net zero-energy buildings during the early architectural design and planning phases. The ETB concept is based on the calculation of the energy demand for heating, cooling, lighting, and appliances. Based on a building’s energy demand, technologies for the onsite conversion and production of the specific forms and quantities of final and primary energy by means of renewable energy carriers can be identified. The calculations of the ETB are based on the building envelope properties of a primary building design, as well as the physical and climate parameters required for the calculation of heat transfer coefficients, heat gains, and heat losses. The ETB enables the selection and rough dimensioning of technologies and systems to meet, and, wherever possible, reduce the thermal and electric energy demand of a building. The technologies included comprise green facades, adaptable dynamic lighting, shading devices, heat pumps, photovoltaic generators, solar thermal collectors, adiabatic cooling, and thermal storage. The ETB facilitates the balancing of the energy consumption and the production of renewable energies of a primary building design.

1. Introduction

Approximately 80% of the human population is expected to live in cities by 2050 [1]. Humans spend up to 90% of their time in buildings, while buildings contribute up to 40% to humanity’s energy demand, and are responsible for 33% of the total resources consumption [2]. Technical efforts for the construction, service, and maintenance of centralized infrastructures that are state-of-art in the developed world today lead to increased economic and environmental costs. For example, almost 70% of the primary energy required for centralized electricity production in conventional coal power plants is lost [3]. Therefore, new sustainable solutions are required in order to enhance the effectiveness and efficiency of infrastructures and to preserve limited resources.
A very promising approach to reduce (urban) resource consumption is the application of decentralized systems for the improvement of resource efficiency and renewable resource production. A framework utilizing this approach is the so-called Zero Emission Buildings (ZEBs). ZEBs do not produce harmful emissions, and can even exert positive impacts on the environment by producing energy, water, and other resources [4]. The international research project Zero Emission Building—Integrating Sustainable Technologies and Infrastructure Systems (ZEBISTIS) [4] aimed to enforce and improve the design of ZEBs. A specific goal of ZEBISTIS was the development of tools and methods to achieve zero emissions from a building. Potential emissions from a building in terms of air, water, and soil can be assigned to the main categories “biomass”, “water”, and “energy”. The development of toolboxes for each of the three categories and the linkage and combination of these toolboxes aimed to support architects and planners from different disciplines in the planning process of ZEBs during the early design and planning stages.
A basic requirement for a ZEB is the maximization of both the building’s energy efficiency and its renewable energy productivity. This also reflects the European “Energy in Buildings Performance” directive, which demands that by 2021 all new buildings in the EU must be built as nearly zero energy buildings with an energy demand of “zero” or “nearly zero” for heating, cooling, and domestic hot water production [5]. The remaining energy demand should be provided by renewable energy produced on the building property or within its neighborhood [4]. A basic characteristic of the Net Zero-Energy Buildings is to meet the energy demand of a building onsite with integrated renewable energy production systems, such as using Building Integrated Photovoltaics (BIPVs) [6].
This paper discusses the development of a general framework for a Microsoft Excel based Energy Toolbox (ETB) for the planning of domestic (residential) ZEBs. The minimum requirement for the application of the ETB is the design of energy efficient homes that meet the so-called Passive-House criteria, defined by the Passive House Institute [7]. To achieve Net Zero-Energy buildings, the annual energy demand of very energy efficient buildings meeting the Passive-House criteria is met with renewable energy that is produced with sustainable technologies and systems [6].
The so-called Passive House (PH) standard [7] and the concept of Net Zero-Energy or Net Plus-Energy Buildings [6,8,9] are the starting basis for the modeling of the energy demand and the specific energy flows of a ZEB [10] by means of the ETB. To achieve net zero-energy consumption for a building over the period of one year, the total renewable energy production of a building must either exceed, or at least be similar to, the total final energy demand of the particular building [6]. After quantitative and qualitative determination of the specific thermal and electric energy demands, the ETB facilitates the identification of appropriate technologies and systems for the provision and production of the building’s energy demand by means of renewable energies, and for achieving at least a net Zero-Energy Balance for the operation of the building concerned over the period of one year.

2. Objectives and Methodology

The goals of the ETB development were to facilitate: (i) the estimation of the energy demand of a specific building design; (ii) the optimization of the building design in order to optimize its energy efficiency; and (iii) the determination of required technologies and the specific basic conditions for appropriate building integrated installations (such as the required area) in order to achieve net zero-energy demand. The maximum energy demand and technical background of the building physics in the ETB adhere to the minimum criteria for certified PH according to the PH Institute [7,11]. The most important characteristics of the PH concept are the minimization of ventilation and transmission heat losses by ensuring energy efficient mechanical ventilation with heat recovery (HRC), air-tight building envelope, well-insulated building envelope with minimized thermal bridges, and the use of internal and external (solar) heat gains and passive cooling. In general, the limits of the objective to refrain from a conventional heating system are derived from the PH standard [7]. The maximum heating and/or cooling load is limited to ≤10 W/m2 and the heating and/or cooling energy demand is limited to 15 kWh/m2 per year [12]. Therefore, the heating and/or cooling energy demand can be provided via mechanical ventilation systems, with the minimum required fresh air demand, and without a conventional “active” heating and/or cooling system [7,11,12]. Specific technologies are required for the building integrated provision of the final energy use, and the production of primary renewable energy in order to meet at least 100% of the yearly energy demand. Such specific technologies need to: (i) improve the overall energy efficiency and lower the buildings service energy demand; (ii) reduce the heating and/or cooling loads; and (iii) to generate the required amount of energy for hot water, heating, cooling, and electricity.
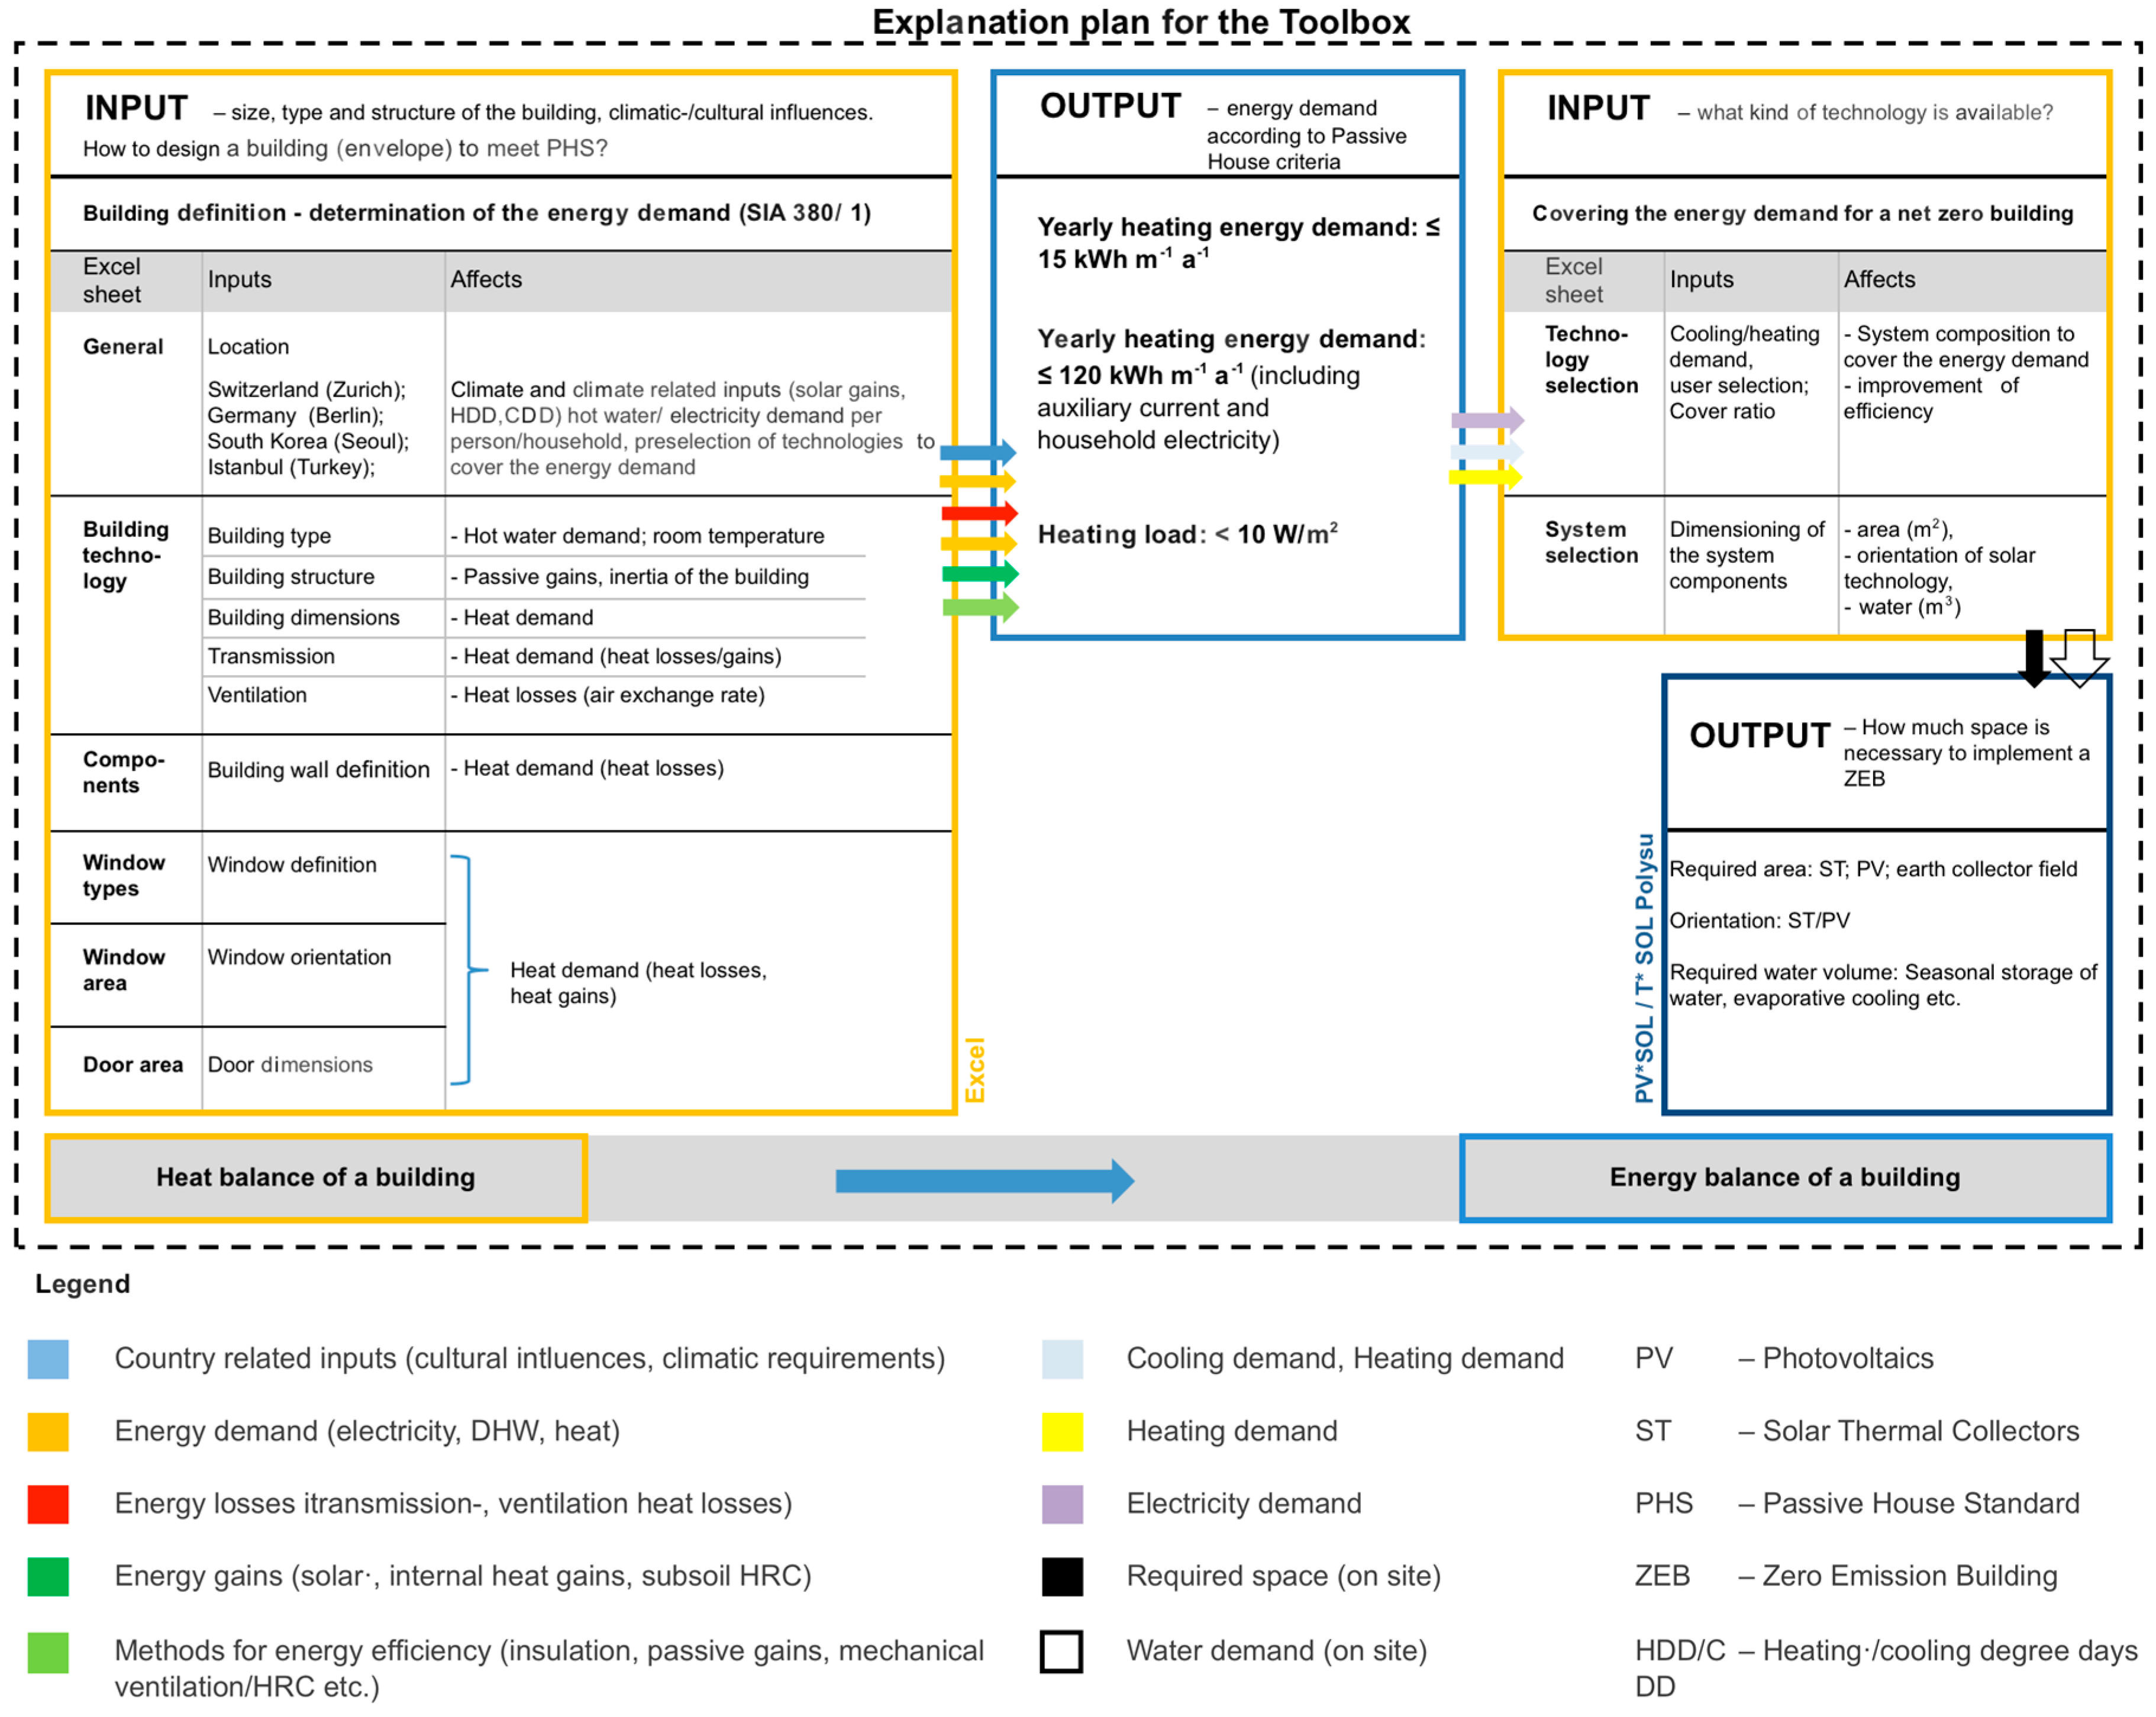
The ETB comprises two parts: (1) “Energy Demand and Efficiency”; and (2) “Energy Conversion and Provision”. In Part 1 of the ETB, the quantity and quality of a building’s energy demand are determined. These demands form the inputs for Part 2 of the ETB. In Part 2 of the ETB, different technologies can be selected in order to meet the demands for specific forms of energies required for the operation of a specified building, and to achieve Net Zero-Energy consumption over the period of one year.
The building’s energy demand consists of the heat demand for domestic hot water (DHW) production and heating, and the electricity demand for appliances and components of the building services engineering system. The energy demand is calculated based on input parameters, such as building utilization, number of residents, building structure, composition of the building envelope, building shape, position, and orientation.
Depending on the property location and site conditions of a building, such as its orientation and climate, some technologies might be more appropriate than others to meet the energy demands. Part 2 of the ETB also quantifies the required dimensions of considered technologies, such as the required areas for photovoltaic (PV) generators with specific cell technology and orientation, or solar thermal (ST) systems with specific absorbers and orientations. Thus, the selection of appropriate technologies is facilitated.

2.1. ETB Part 1 “Energy Demand and Efficiency”

The ETB part 1 “Energy Demand and Efficiency” follows the methodology of the Swiss standard SIA 380/1 [13] and is based on the international standard EN ISO 13790 [
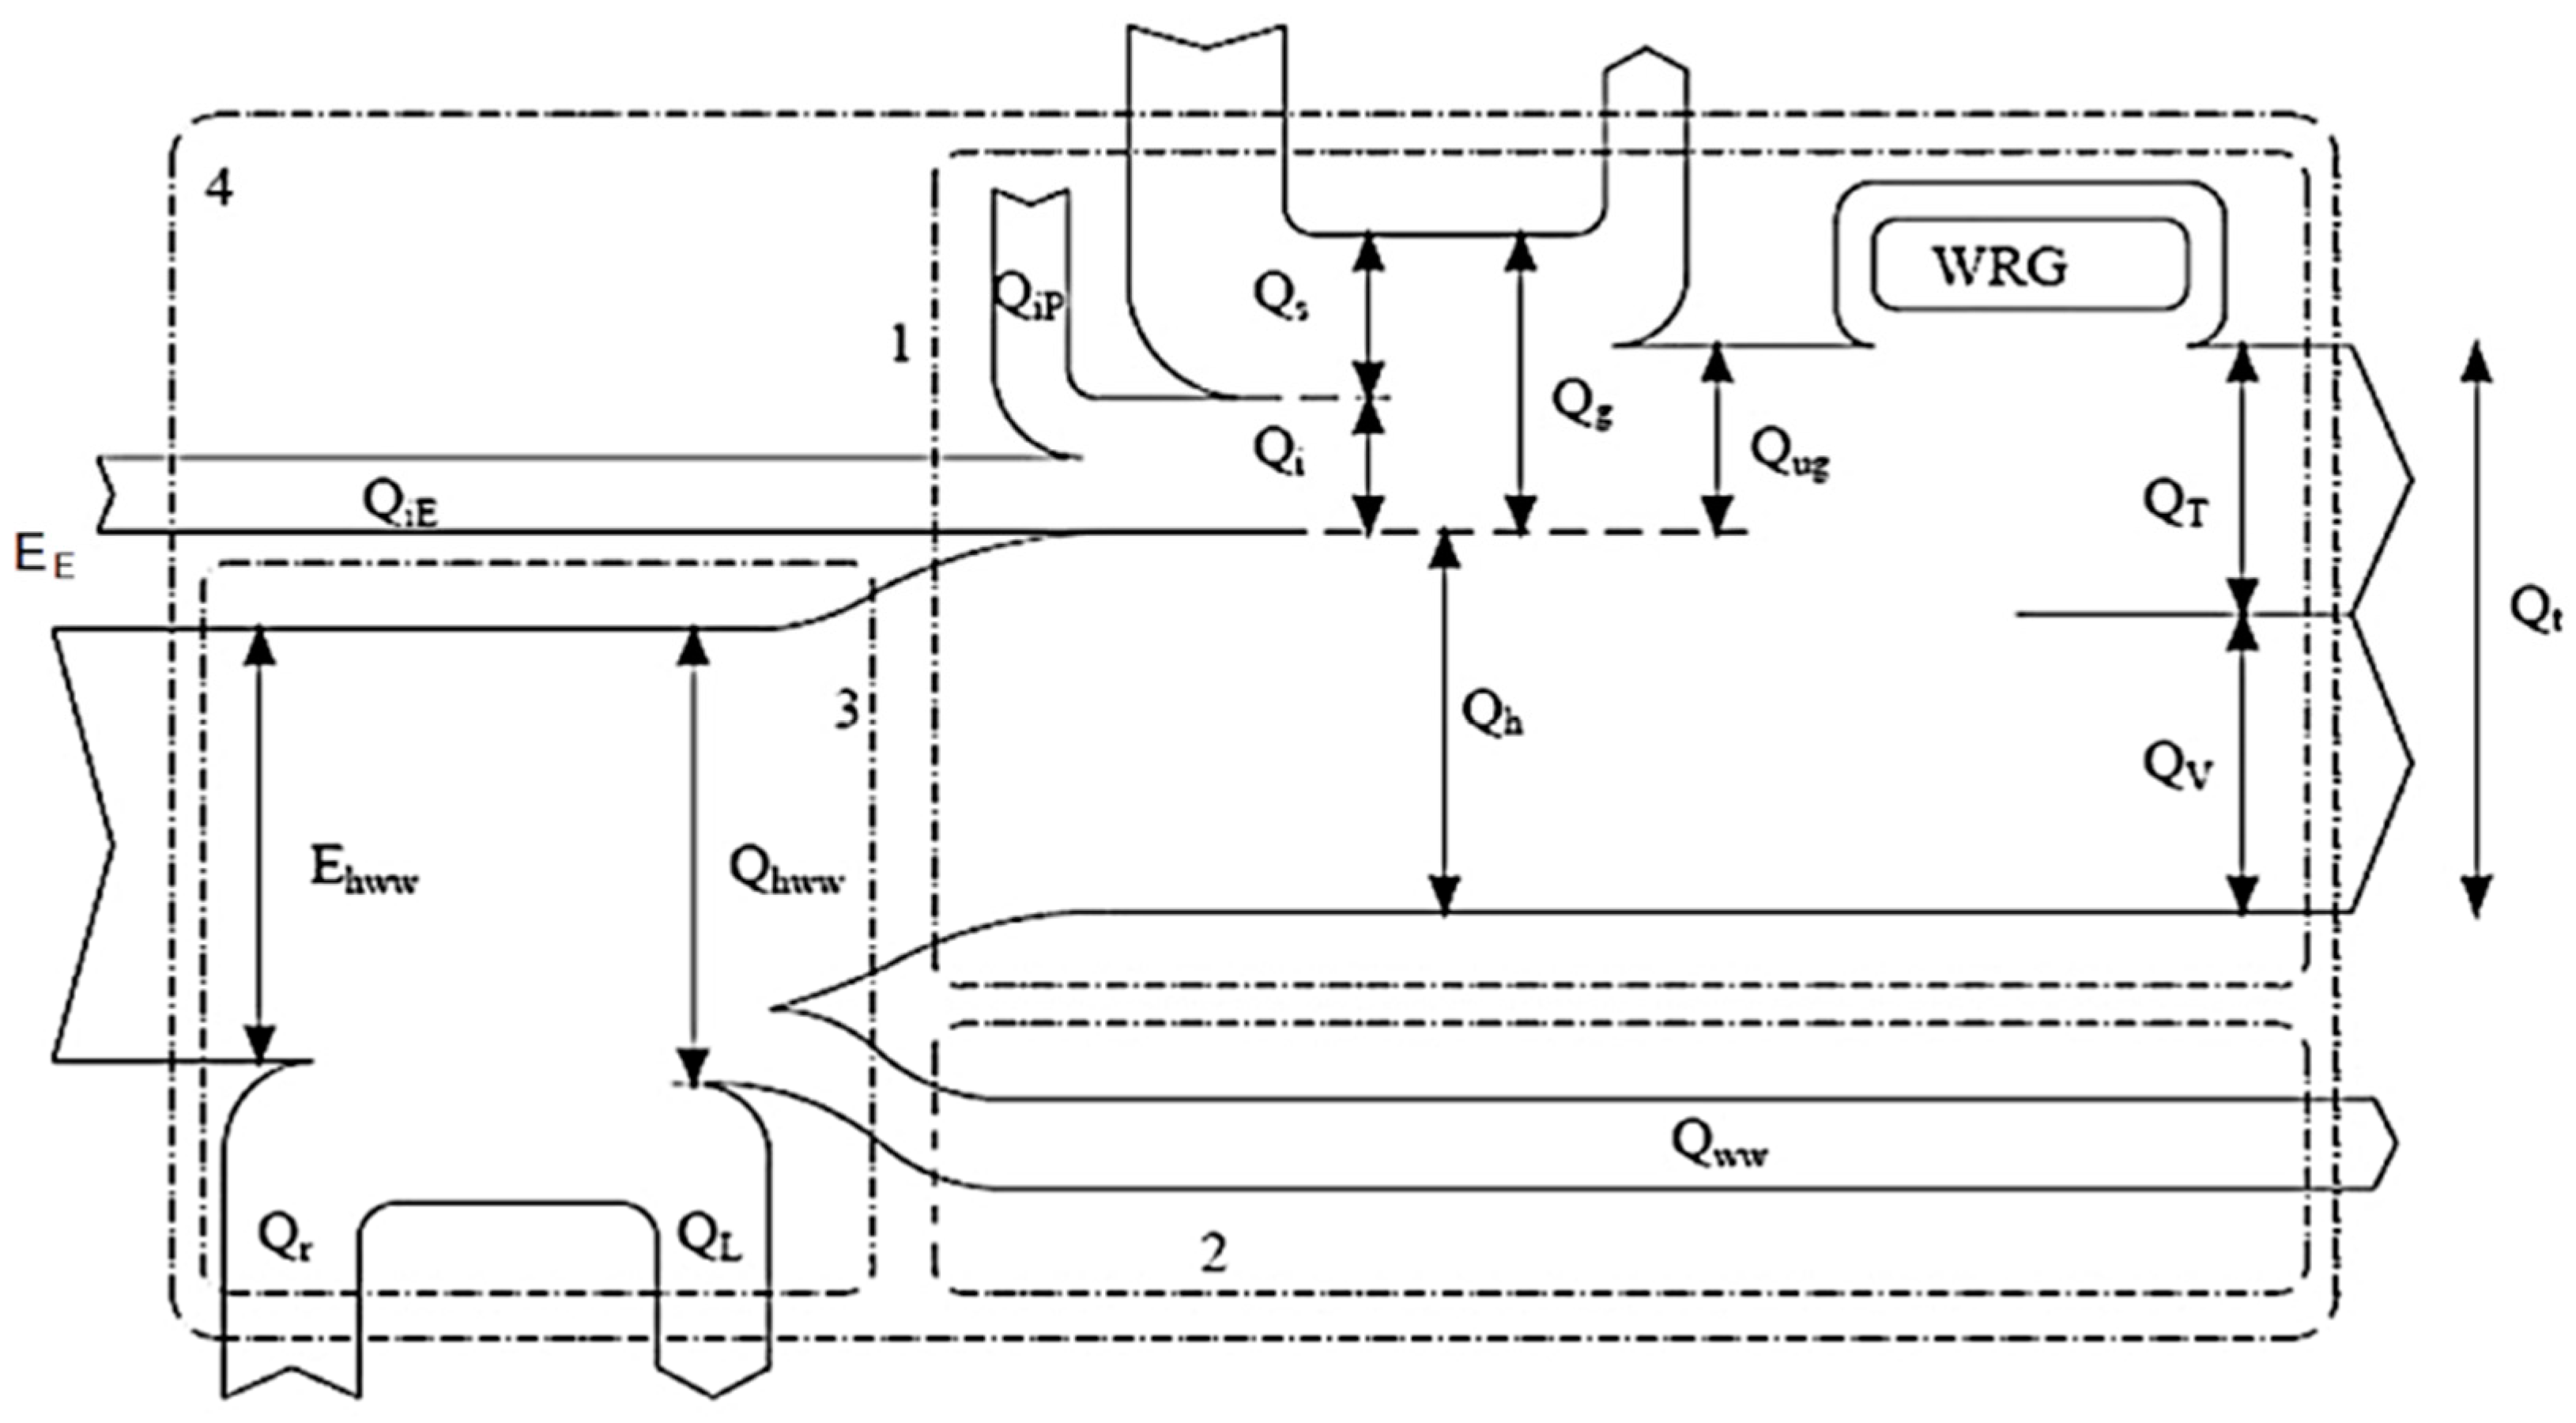
13]. The latter includes a detailed guideline on to the method of calculating the heating and cooling demand of a building. The calculation method refers to the energy balance on the exterior building envelope and relates to the heat fluxes in a building in order to balance the heat demand with the heat gains and losses. The most important energy fluxes within the building envelope are illustrated in Figure 1 and defined in Table 1. The equations used to calculate the transmission and ventilation heat losses, as well as the heat gains, are listed in Table 2.
The equations, used to calculate the thermal behavior of buildings, are presented below (Equations (1)–(8)). They are simplified summaries of the more detailed calculation method according to EN ISO 13790 [13]. Detailed specifications and the methodology for calculations are described, amongst others, in the Austrian, Swiss, and International guidelines and standards [13,14,15,16]. The calculations can be made per month or per year, depending on the goals of the study.
The heat demand of the building (Qh) is calculated according to
Q h = [ Q T + Q V η g ( Q i + Q s ) ]
where QT represents the transmission heat losses; Qv is the ventilation heat losses; ηg is the performance ratio for the heat gains (depending on the building structure); Qi denotes the internal heat gains; and Qs is the solar heat gains (units in (kWh/a)).
The cooling demand of a building (Qcn) is calculated according to
Q cn = ( 1 η g ) Q gcn   i f   Q gains   per   month   >   Q losses   per   month   ,   i f   n o t   Q cn = 0
where Qgcn, Qgains per month and Qlosses per month are the total heat gains (kWh/month); and ηg is the performance ratio for heat gains (depending on the building structure. Simplified according to ISO 13790:2008 [14]: heavy = 1.0; lightweight: 0.9).
The transmission heat losses (QT, in ( kWh / a ) are calculated according to
Q T = 0.024   · L T · HDD
where LT represents the transmission–conductance value (W/K); and HDD are heating degree days ( K · d a · ) .
The heat transmission value for the entire building envelope (LT, in W/K) consists of the sum of all individual heat transmission values for the different building components:
L T = L e + L u + L g + L ψ + L χ
where Le denotes the building components adjoining ambient air (W/K); Lu denotes the building components adjoining unheated rooms (EN ISO 13789) [15]; Lg denotes the building components adjoining ground in (W/K) (EN ISO 13370) [16]; Lψ is the value for linear heat bridges in (W/K) (EN ISO 10211) [17]; and Lχ is the value for punctual heat bridges in (W/K) [17]. The individual heat transmission coefficients of different building components are included in the calculations to describe the thermal properties of the different building components, depending on their location, and their contact with outside air or ground. Further details are described in the EN ISO (European Norm International Standard Organization) 13789 [18] and EN ISO 13370 [19]. The calculation of windows heat transmission coefficient is considered and summarized in EN ISO 10077-1 [20]. In addition, heat losses due to heat bridges are considered with building component related conductivity values, according to EN ISO 10211(Equation (4)) [17].
The solar heat gains (QsS, MJ/(m2a)) are calculated as:
Q sS = G sS · A WS · 0.9 · g ·   F F · F ss / AE
where GsS is the global sun radiation (MJ/m2a) (calculated, e.g., with Meteonorm Version 7.1 Software (Meteotest, Bern Switzerland) [21]); Aws is the window area south (m2); g⊥ is the total energy transmittance value for glazing; Fss is the shading factor south orientation (consisting of elements with the following orientations: horizontal south, vertical, south, vertical east, and vertical west); FF is the reduction factor—window frame (0.6–0.9 ratio of transparent window area to window area used by SIA380/1 [13]); and AE is the energy reference area (m2) (the reduction factor 0.9 is defined by SIA 380/1) [13].
The internal heat gains (Qi, MJ) are calculated according to:
Q i = 0.024 · q i · BGF h · HT
where qi is the heat flow density (W/m2); BGFh is the heated gross area (m2); and HT is heat days (d).
The ventilation heat losses (Qv, in MJ/a) are calculated as:
Q v = 0.024 · L v · HDD
where HDD are heating degree days ( K · d a · ) ; and Lv is the ventilation conductivity value (W/K).
The heating energy for DHW (QDHW, in kJ) is calculated according to
Q DHW = c w · m DHW · Δ T
where; cw is the specific heat capacity of water ( ~ 4.2 kJ kg · K ) ; mDHW is the mass (water) (kg); and ΔT is the temperature difference (K).
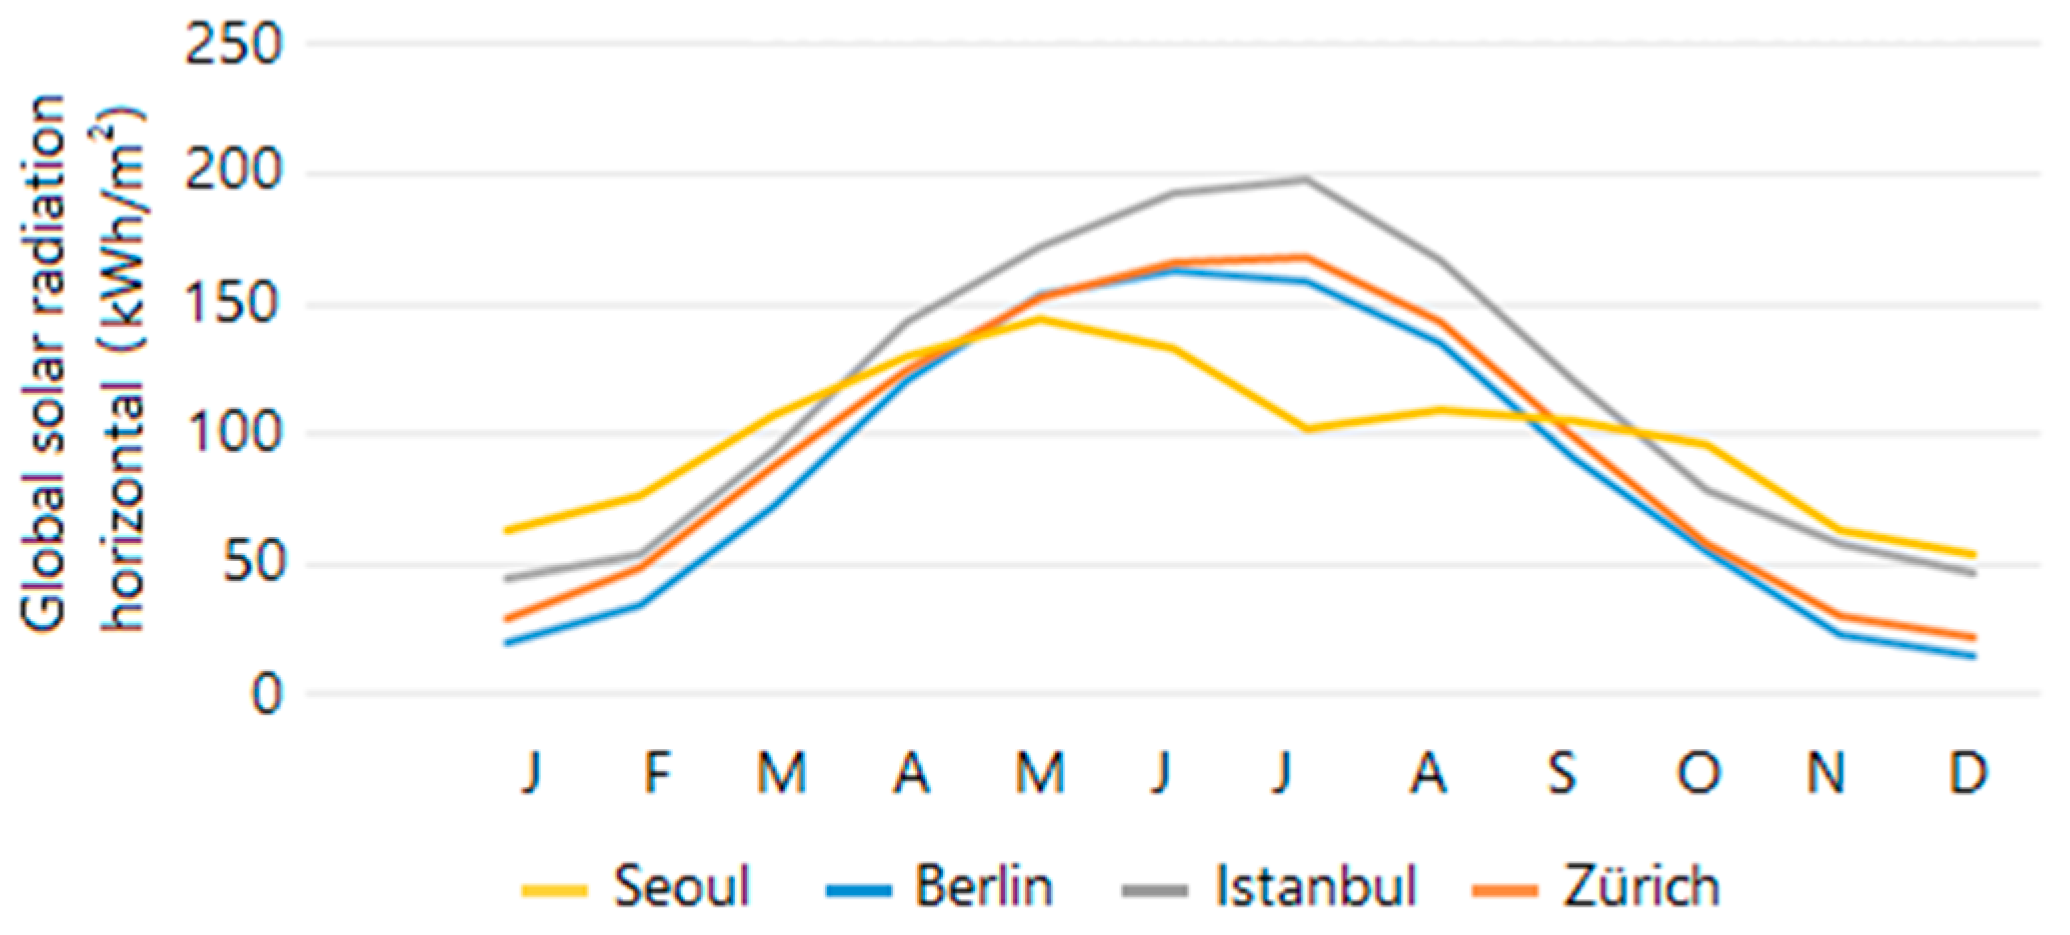
The building shape, the thermal conductivity of the building envelope, and the distribution of window areas need to be adjusted in order to meet the PH criteria according to the specific local conditions of the site such as the climate, orientation and potential surrounding shading elements. Climatic influences (heating and cooling degree days (HDD/CDD) and heat days (HT)) are considered in the transmission heat losses (Equation (3)). Furthermore, the solar/internal heat gains (Equations (5) and (6)) and the ventilation losses (Equation (7)) need to be considered.
The climatic conditions at the building location influence the energy demand for heating and cooling. Thus, the climate conditions also influence the climate responsive design of a building as well as the selection of adapted technologies. High heat gains (both, solar and internal) can cause either a reduction of a building’s heating demand during heating periods and/or overheating of a building’s interior during the non-heating periods. A PH is mainly heated by solar- and internal heat gains [12,22]. The heating or cooling requirements for a given structure at a specific location are considered to be directly proportional to the number of heating or cooling degree days at that location [22]. A summary of the climate parameters relevant for the calculation of the energy demand according to EN ISO 13790 [13] is listed in Table 2.

2.2. ETB Part 2 “Energy Conversion and Provision”

In ETB Part 2, “Energy Conversion and Provision”, the technologies that facilitate the conversion and provision of specific forms of energy for the operation of a building can be pre-selected. The quantification of specific technologies (such as the definition of the required area for installation) is based on the specific energy efficiency and energy demand of a selected building. The definition of the location, and accordingly of the specific climate conditions, is essential for the calculation of ETB Part 1 and Part 2. The ETB user can decide which technologies should be included in the design of the building. The technologies included in the ETB are divided in two groups. The first group consists of technologies that convert and provide specific forms of energy in order to cover the energy demand, such as ST and PV systems, geothermal (GT) systems, and heat pumps (HPs). The second group consists of technologies that reduce the energy demand, e.g., heat exchangers for HRC from wastewater, dynamic adaptive shading control, and dynamic electric lighting control. Technologies from both these groups can be combined in order to assemble adapted systems for the conversion and provision of energy for the operation of a building.
HPs can for example convert heat from different sources (such as air, GT, waste water or ST) or can be combined with seasonal storage systems, such as the Swiss Jenni system [28]. The heating and cooling demand covered by HPs, adiabatic cooling systems, or alternative systems, can be for example calculated with factors or ratios given by the Annual Performance Factor (APF) for heating (APFheating), Energy Efficiency Ratio (EERcooling), and the Seasonal Energy Efficiency Ratio for cooling (SEERcooling) [29]. The results of these calculations provide the required inputs: (i) the electric energy for the operation of a Heat Pump (HP) for heating, cooling, and hot water production; and (ii) the volume of water for adiabatic cooling (Table 3). The calculation results referring to the estimated electric energy demand and consumption are the input for the simulation of the required space for the onsite production of electricity by means of a PV power plant.
Simulations for the onsite production of PV energy can be executed with the program PV*SOL [30]. All relevant conditions such as radiation, orientation, angle, potential shading and different module and converter technologies can be considered by the program. For example, ST and HP systems can be calculated with the simulation program T*SOL [31] or Polysun [32]. The definition of the APFheating and the covering ratios of the ST system are mutually dependent. It is therefore important to consider the entire system in order to evaluate the performance of complete systems for the conversion and provision of specific forms of required energies.
The performance numbers given by HP manufacturers often do not reflect the real performance of a specific HP system, especially when compared with an international level [33]. In this research, performance values were therefore obtained from interviews with experts [34,35], and from published and unpublished reports [36,37,38]. In addition, the HP Coefficient of Performance (COP) in many cases does not properly reflect the performance of HP systems. With the APFheating a more realistic definition is used for applying HP systems in the ETB [39]. According to the primary energy factor for centrally supplied electricity in Switzerland, the HPs should reach at least an APF of 3.5 to be classified as efficient technology with a positive primary energy balance compared with technologies based on the combustion of fossil fuels for the provision of heat and cold [40,41].
The results of the ETB development are discussed in the subsequent section of this paper. To validate the ETB, its application and validation of the results for buildings at different locations around the world would need to be executed. The extensive validation of the ETB exceeds the development of the ETB framework described in this paper and is accordingly not included in the discussion of the results. However, in Section 3.3, an exemplary building design and building services system configuration was analyzed regarding its energy consumption, energy productivity, and resulting energy balance at four different locations.
It must be assumed that the theory and practice of the calculation of a building’s energy demand does not always coincide with the energy demand and the energy consumption during operation of the realized building [42]. Cultural differences and user behavior can have a considerable impact on the energy demand and actual energy consumption of buildings. In Zurich for example, more than 20% of the energy saving potential can be attributed to resident’s behavior. Findings regarding the influence of user behavior on the energy consumption of domestic buildings from Switzerland and Germany illustrate the difficulty of predicting the energy consumption of specific domestic buildings by means of building simulations [43,44].
The average quantity of domestic drinking water consumption per person varies between the four investigated cities, particularly between Seoul (with the highest average consumption) and Berlin (with the lowest average consumption) [45]. Accordingly, the DHW demand and the related energy demand differ. The values for both the quantity of water consumption and the quantity of related energy demand for water treatment, supply, and DHW production are therefore based on country related average values per person and day. User group specific differences in quantities are not considered because such detailed estimation would require information about the user groups and agent based modeling of water consumption patterns [46].
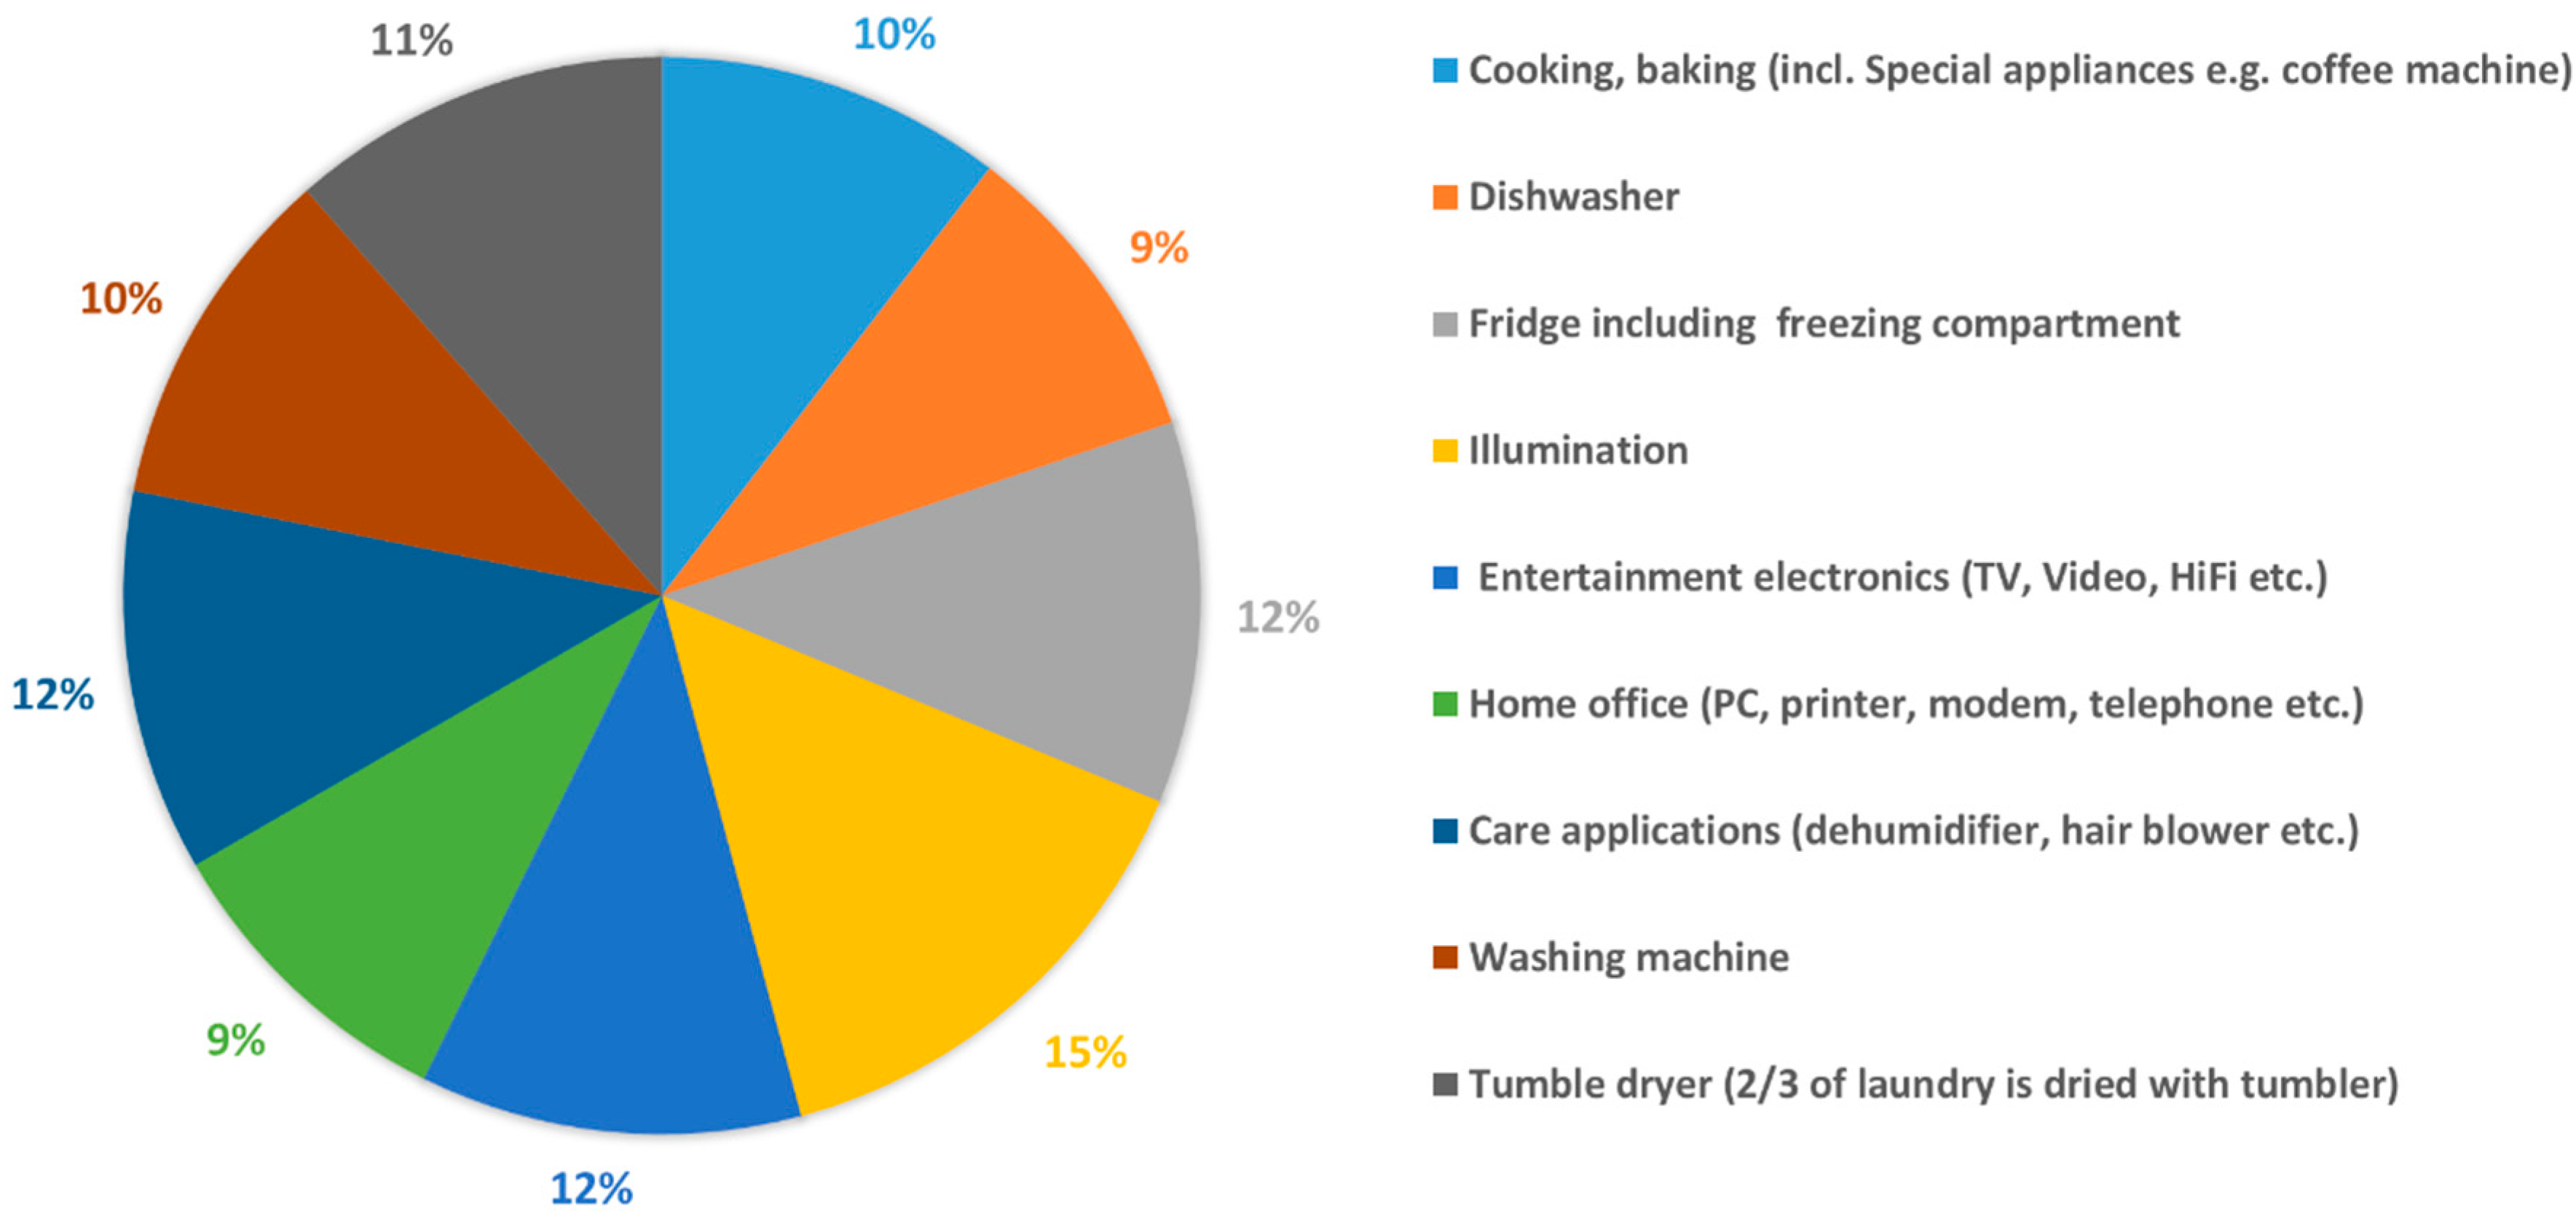
The primary electric energy demand is included in the ETB based on average values per person and year and the number of persons in a household. The values included are estimates based on available data and can only be partially determined without detailed study. The findings of the ZEBISTIS research project show that cultural specific user behavior influences the energy consumption. The number of persons per household must be considered in the ETB because the average electric energy demand for household appliances and lighting per person is higher in a household with a smaller number of persons than in that with a larger number [47]. In addition, the electrical base consumption of the building technology (ventilation, pumping systems, etc.) is less when more residents share a living space [47,48]. For example, the values for the average number of persons per household and the available usable area per person differ between Turkey and Switzerland. Comparing a Swiss household with a Turkish household with the same usable area, the Turkish household is generally occupied by a family of more than two persons, while the Swiss household is typically only occupied by two persons [47,48,49].
While rainwater harvesting and utilization for adiabatic cooling is generally feasible during the cooling periods in Germany, Korea, and Switzerland [4,50,51], rainwater shortages might limit the feasibility of rainwater use for adiabatic cooling in Turkey [52].
Electricity storage systems would need to be included in the ETB in order to guarantee continuous energy supply [6,53]. Computer programs that allow a much deeper insight into the specific building energy demand are available [54]. Microsoft Excel based toolboxes for the detailed simulation of a building’s heating energy and cooling demand are, for example, already available in the Swiss market [55]. However, such programs do not facilitate the integrated primary design of ZEBs discussed in this paper.

3. Results and Discussion

3.1. ETB Part 1 “Energy Demand and Efficiency” (Heat Balance of Building)

The ETB developed in the above mentioned research can be used either in the early design and planning phases for the construction of new buildings or in the renovation of old buildings. In both cases, the building design and construction need to be adapted to the specific local basic conditions and climate to reduce the energy demand for heating and cooling to the limits defined for a certified PH. The minimization of the heating energy demand requires the reduction of transmission and ventilation heat losses, and the use of internal and external heat gains along with heat storage in building components. To reduce the cooling energy demand, passive cooling strategies must be implemented, such as the reduction of internal and external (solar) heat gains and adapted ventilation concepts. In temperate climate zones, both passive heating and cooling strategies need to be applied in the building design in order to provide a comfortable indoor climate and to reduce the energy demand for heating and cooling [12,56].
The ETB also allows changes to the building massing, the composition of building components (thermal insulation), and the components of the building services engineering system such as the mechanical ventilation system with heat recovery. The output of the ETB Part 1 “Energy Demand and Efficiency” is the energy demand of the building, and it must be adjusted and optimized until the energy demand meets the PH criteria. Figure 2 illustrates the basic layout and connections of the Microsoft Excel based ETB Parts 1 and 2. Furthermore, Figure 2 illustrates the specific inputs, outputs, and results of the ETB Part 1 “Energy Demand and Efficiency” (Heat Balance of Building) discussed in this section, and of the ETB Part 2 “Energy Conversion and Provision” (Energy balance of a building), discussed in Section 3.2.
Climate data for the four investigated cities in the three different climate zones were implemented in the ETB. Zurich in Switzerland and Berlin in Germany were assigned to temperate climate; Istanbul in Turkey was assigned to the subtropical/Mediterranean climate; and Seoul in Korea was assigned to temperate climate with strong humid subtropical and continental influence. The basic properties of the locations and climate zones and important factors to be considered in the design of Net Zero-Energy Buildings with the ETB are summarized in Table 4. An overview of the climate data, applied in the ETB for the four investigated cities, is provided in Table 5 [21,27]. The average monthly global solar radiation over the period of one year for the four investigated cities on a horizontal surface [21] is illustrated in Figure 3. The results indicate the potentials, limitations, and challenges associated with the available global solar radiation and solar heat gains at the specific locations.
The electric energy consumption of devices and equipment in households does not necessarily directly correlate with the number of residents. The type of building, such as apartment or single-family house, plays an important role. Most applications have a “base consumption”, whereby the average electric energy consumption per person of a household with only one or two residents is higher than that with a household with more occupants, e.g., four or more persons [48]. For the data implemented in the ETB and the design of a ZEB, a household with very low electric energy demand is assumed. Feasible measures for the reduction of the electric energy demand of a typical Swiss household occupied by two persons are listed in Figure 4 [48]. The listed data do not include the electricity consumption of building services engineering system components in conventional buildings or additional electricity uses, e.g., for additional deep freezers, which would account for an additional electricity consumption of 400 kWh/a. The total electricity consumption in a typical Swiss household occupied by two persons would be accordingly 2350 kWh/a + 400 kWh/a = 2750 kWh/a [48].
The reduction of the total primary energy demand and the primary energy consumption is essential for meeting the PH criteria of buildings according to the ETB Part 1. Accordingly, in addition to the minimization of the energy demand for heating, cooling and hot water, the minimization of the electric energy demand and electric energy consumption are essential in order to effectively reduce a building’s primary energy demand and consumption. The two most important factors for the minimization of the electric energy consumption are: (i) the use of the most efficient electric appliances; and (ii) the optimization and minimization of the operation period of electric appliances. For example, limiting operation periods to when appliances are specifically needed can be managed by so-called intelligent or smart control systems [48,58]. To optimize the direct and local use of PV electricity produced on the building site, the consumption of electricity should take place during the periods with high solar radiation and availability of PV electricity. Accordingly, electric appliances such as refrigerators, washing machines, etc. that do not need to be operated 24 h a day should be synchronized with the availability of PV electricity on site or in the neighborhood. However, some household appliances need to be operated during periods when PV electricity is not available, particularly lighting systems. To minimize the electric energy demand of energy efficient lighting systems, they need to be controlled based on the presence of users and the availability of natural lighting to reduce as much as possible the need for electric lighting [48]. Table 6 lists the most important basic measures that can contribute to significant electric energy savings in a household.
A summary of the measures and quantification of possible savings of electricity consumption in kWh per person and year for a very energy efficient household occupied by two persons in comparison with a standard Swiss household is shown in Table 7 [48].
The domestic hot water (DHW) consumption has a significant impact on the energy demand of a PH. While DHW has a portion of approximately 10% of the total heat demand of conventional buildings, the heat demand for DHW production in PHs can have a portion of approximately 45% of the heat demand [33]. Moreover, the water consumption can be reduced by about one third when using water-saving appliances [22]. Furthermore, the domestic water demand could be higher or lower depending on the different water use behavior patterns according to various cultures, such as the difference between water use in Europe and Korea [34]. In Switzerland, a DHW consumption of 35 l/d per person is set by the norm SIA 385/1 [5] and can be used as a basis for the ETB.

3.2. ETB Part 2 “Energy Conversion and Provision” (Energy Balance of a Building)

3.2.1. Technologies for the Provision of Heat

HP systems using different heat sources are a common technology for the provision of heat for both heating and hot water in contemporary buildings. The seasonal performance factor of commercially available HP is in the range of 6–7, but is significantly dependent on the HP technology, the operating conditions, and the heat source. Very efficient HP systems can also reach a COP of 6–7 [59]. However, in the ETB, the maximum COP considered is 5.5 (Table 8) in order not overestimate the efficiency of the heat pump system and generate realistic simulation results. The required electricity for the operation of a HP (which is, in the best case, approximately 18% of the heating energy demand for the operation of electric HP) can be desirably generated by a building integrated PV power plant in order to fulfill the concept of a Net Zero-Energy Building [8,56,57]. Another sustainable option is to use the heat from wastewater originating from the building (Table 8). The latter is an effective way to produce domestic hot water. Furthermore, an alternative to GT heat sources can be used such as groundwater, e.g., if groundwater is not available or if its use is restricted by law [60].
To achieve high energy yields, factors related to the efficiency and productivity of the entire system need to be considered. ST systems are usually used to heat water to be used for DHW, heating and/or industrial processes. The yearly maximum cover ratios of ST systems in Switzerland are generally approximately up to 60% for DHW production and 30% for heating system [61]. For process heat coverage, rates of 40% can be achieved with ST Installations [62]. The thermal capacity for hot water storage tanks and the yield of the ST collector areas need to be adjusted in order to optimize the efficiency of ST systems. Both the required area for ST panels with a specific efficiency and the storage tank capacity for hot water need to be considered. The concept of the Swiss Jenni system for example strives to meet 100% of the heat demand for both heating and DHW. The Jenni concept is based on an energy efficient building with an integrated ST system that is built around an appropriately designed seasonal thermal storage tank (Table 9) [28]. The installation of ST collectors for the support of heating systems with a steeper angle of incidence (such as when installed on vertical areas such as facades) can be regarded as a smart design solution. A vertical installation reduces the risk of the ST system overheating during non-heating periods, but facilitates the production of sufficient ST energy during the heating period when the sun path is at a lower altitude. Therefore, ST collectors integrated into the south facade of a building are an appropriate and adapted solution for ST systems that are designed for both heating and DHW production in buildings located in the northern hemisphere and in the investigated cities. Both ST flat plate collectors and vacuum collectors can be integrated in building envelopes. Furthermore, such ST collectors are generally non-concentrating and are accordingly appropriate technologies for locations with a considerable portion of diffuse radiation in relation to the global radiation [27,63].

3.2.2. Technologies for the Provision of Cooling

Depending on the specific climate conditions of the building site and the design of the building, the installation and operation of active cooling systems might be necessary in buildings in order to provide comfortable indoor temperatures. The cooling demand in a building increases generally on an urban scale [64] due not only to rising temperatures resulting from global warming but also rising indoor temperatures due to the use of translucent glazed surfaces, increased thermal insulation of building envelopes, the lack of passive cooling strategies in contemporary architecture, and the loss of vegetation in cities which contributes significantly to the occurrence of Urban Heat Island Effects [65,66]. As a result of rising indoor temperatures and cooling demand, the installation of air conditioning systems is a common approach in order to cool indoors environments. Air conditioning systems are generally based on conventional electrical compressor cooling systems and the utilization of Air-source heat pumps (ASHPs). ASHPs contribute to the heating of the outdoors and therefore also to the occurrence of Urban Heat Island Effects. For example, an ASHP with a COP of 2.2 consumes 1 kWh electric energy in order to produce 2.2 kWh cold air for the cooling of indoors and 3.2 kWh sensible heat that is released to the outdoors. Accordingly, an ASHP using electric energy transforms primary electric energy to heat, with cold air as a “side product” [65].
To prevent the overheating of outdoors and the occurrence of Urban Heat Island Effects around buildings that need to be actively cooled, alternative cooling technologies need to be applied. Thermal energy for both heating and cooling can be stored in building components. Climate adapted intelligent design also includes green areas such as on the roof or façades and external shading systems in order to provide passive cooling and avoid indoor overheating during non-heating periods [67,68]. The ETB therefore includes technologies such as adiabatic cooling, green roofs, and green facades. Through the utilization of rainwater for adiabatic cooling, the buildings and the urban environment can be cooled effectively. Furthermore, adiabatic cooling with decentralized collected rainwater contributes to the restoration of the natural water cycle. The evaporation of rainwater cools down the climate in urban areas, increases local rainfall, and could help to decrease or even prevent the Urban Heat Island Effect [65]. Plants on green roofs for example can absorb two thirds of the global radiation and transform it into evapotranspiration of water which actively contributes to the evaporative cooling of both the building envelope and the surrounding outdoor environment. In contrast to green roofs, conventional roofs convert most of the global radiation into sensible heat and therefore contribute to the heating of both the building envelope and the surrounding outdoor environment. The evapotranspiration or evaporation of water contributes to the active cooling, but not to the heating of the surrounding areas. This is because the condensation of the water vapor generally occurs in the upper layers of the atmosphere during cloud formation, where the occurring heat does not contribute to the warming of the urban environment but becomes a driver of the natural water circle [65,69,70].
Adiabatic cooling is a technology in which the synergy of evaporation and cooling is harnessed using a near-natural process. The basic element of the adiabatic cooling process is a controlled mechanical ventilation system with heat recovery (HRC) by means of air-to-air heat exchangers. During the colder periods (heating is needed), the heat exchanger is used to recover heat from exhaust air in order to pre-heat fresh cold air from outdoors. During the warmer (cooling is needed) periods, the heat exchanger is used to recover cold from exhaust air in order to pre-cool fresh warm air from outdoors. During non-heating and non-cooling periods, the ventilation systems are operated without heat exchangers via a by-pass system. To cool down the fresh air in an adiabatic cooling facility, the exhaust air stream needs to be cooled down by evaporative cooling processes. Therefore, the exhaust air is passed through chambers in which water mist is evaporated. The cooled down exhaust air is then passed through double plate heat exchangers in order to cool down the fresh air, without exchange of humidity (and accordingly without humidification of fresh air) [71] (Figure 5). Except the adiabatic cooling module which facilitates the evaporative cooling of the exhaust air stream before the air passes through the heat exchanger, all major components of such an adiabatic cooling system are already included in mechanical ventilation systems with air-to-air heat exchangers [69] (Figure 5). The field of application, performance, and specific benefits of adiabatic cooling systems implemented in the ETB are listed in Table 10.
Compared with efficient ASHPs which have a COP of 3 [59], integrated adiabatic evaporative cooling systems have a COP of up to 7.3 [71]. The cooling power of such adiabatic evaporative cooling systems can be used for the cooling and/or dehumidification of supply air. However, the cooling power is limited to the heat transport capacity of the maximum supply air stream, which in Passive Houses is limited to the minimum required air exchange rate. Therefore, the ETB facilitates the combination of mechanical ventilation systems with heat recovery via an air-to-air heat exchanger and adiabatic cooling with HP systems. The purpose of this combination is to increase the cooling capacity of the overall system, as well as to provide sufficient cooling for both the dehumidification of outside air and the provision of the required cooling load without the need to increase the air exchange rate above the limit defined by the PH design criteria.
Green roofs can reduce the occurrence of latent heat because the vegetation can convert approximately 58% of the received radiation in the evaporation of water. In contrast, conventional roofs without vegetation convert up to 95% into latent heat [69]. This passive cooling effect can result in a reduction of the cooling related energy demand of buildings, e.g., of approximately 60% in investigated buildings in Berlin, Germany [69]. If roofs are not rear ventilated, green roofs contribute to additional thermal insulation of roofs during all seasons. Synergies can be achieved by PV electricity generation on green roofs. The PV panels contribute to the shading of a green roof and the cooling effect of a green roof can contribute to a higher power output of PV panels compared with the location on non-greened roofs [72].
Green facades and climbing plants in front of windows can function as natural blinds. Vegetation in front of transparent building envelope surfaces can block the penetration of direct solar radiation on the facade and are therefore effective means for the prevention of indoor overheating. However, during cold winter months, indoor solar radiation penetration is desired for passive heating of the building. Therefore, the greening of transparent building envelope components with deciduous plants is an appropriate measure in order to facilitate passive indoor heating with solar radiation during the heating period. During the vegetation period, green facades provide not only shading but also active cooling by evapotranspiration.
Evapotranspiration by green facades takes place outdoors and outside the building envelope. However, advantages can be found in using the building climate compared to using a conventional sunblind. Compared with conventional external blinds, green facades can rectify inappropriate user behavior such as the opening of windows during periods with high outdoor ambient temperatures, due to their outdoor cooling effect. Furthermore, compared with conventional blinds, the operation and maintenance costs of green facades can be significantly less. Compared with a building without blinds, the cooling energy demand can be reduced with green facades by 30% (to 70% of the cooling demand without blinds according to the measurements taken over a long period in a university building in Berlin, Germany) [69].
Cooling technologies with HP systems that are included in the ETB and can be used for the provision of cooling energy during the cooling period in summer are listed in Table 11.
Specific technologies can increase the energy efficiency of both cooling and heating systems. Such technologies can accordingly reduce the required effort to convert and provide energy to cover the energy demand of buildings. An overview of technologies that can be used to reduce the demand for heat and cold of buildings and the specific reduction parameters that are included in the ETB is listed in Table 12. Additional available technologies such as cool roofs [73], green roofs [74], green walls and facades [75], and phase change materials [76,77] will be included in the further development of the energy toolbox. However, the integration of detailed parameters is beyond the scope of this paper, which focuses on the basic framework development of the energy toolbox for the primary design of zero emission buildings.

3.3. Influences of Local Conditions on the Energy Balance of a Case Study Building in Seoul, Istanbul, Berlin, and Zurich

To illustrate the influences of the specific climate conditions of different locations on the energy performance of buildings with different energy efficiency, the ETB was applied on four virtual case study buildings (Buildings 1, 2, 3, and 4) for the four different locations: Seoul, Istanbul, Berlin, and Zurich. All four case study buildings are single-family houses with almost identical designs, building services engineering systems, and building occupancy levels. The designs of Buildings 3 and 4 differ from Buildings 1 and 2 only regarding the window to wall ratio that has been reduced from 0.13 to 0.06 (Table 13). Accordingly, Buildings 3 and 4 have smaller window areas in the north façade than Buildings 1 and 2.
Buildings 1 and 3 differ from Buildings 2 and 4 in the level of energy efficiency of the building envelope. Buildings 1 and 3 (Low Energy House) have a lower energy efficiency level than Buildings 2 and 4 (Passive House). Buildings 1 and 2 characteristics and energy efficiency levels are according to catalogue 3 from Polysun Version 10.0.9.24720 [30] (Table 13). Buildings 2 and 4 have the same basic characteristics but a higher energy efficiency, which is primarily based on the significantly lower u-values of certified so-called “Passive Houses” [7], and correspond to catalogue 2 from Polysun Version 10.0.9.24720 [30] (Table 13). Because of the higher energy efficiency of Buildings 2 and 4, the power, and energy demands for heating and cooling are lower than those of Building 1 and 3 (Table 13).
The case study Buildings 1, 2, 3 and 4 have a heated/cooled usable area of 150 m2. The plan layout is rectangular with façade lengths of 10.7 m oriented to south and north, and lengths of 7 m oriented to east and west. The story height is 2.5 m and the building is roofed with a south oriented monopitch roof with a slope of 10 degrees. The roof overhang is 0.75 m in the north, east, and west. A wider overhang of 1.95 m is provided on the South for shading of the south oriented windows during the summer months.
The buildings are equipped with a low temperature floor heating system with a flow temperature of 40 °C and a return temperature of 35 °C, equipped with a 1 m3 capacity hot water buffer tank and a freshwater station. Four people use a total of 200 liters of 50 °C warm water per day. The electricity consumption is 5000 kWh/a without circulation and heat pumps.
The main results illustrating the differences in energy losses and gains for the four different locations are presented in Table 14.
For Building 1, the heating energy demand is 63 kWh/m2a for Berlin, 56 kWh/m2a for Zurich, 15 kWh/m2a for Istanbul, and 39 kWh/m2a for Seoul (Table 14). For Building 2, the heating energy demand is 27 kWh/m2a for Berlin, 23 kWh/m2a for Zurich, 2.4 kWh/m2a for Istanbul, and 14 kWh/m2a for Seoul (Table 14). For Building 3, the heating energy demand is 64 kWh/m2a for Berlin, 57 kWh/m2a for Zurich, 15 kWh/m2a for Istanbul, and 39 kWh/m2a for Seoul (Table 14). For Building 4, the heating energy demand is 28 kWh/m2a for Berlin, 24 kWh/m2a for Zurich, 2.9 kWh/m2a for Istanbul, and 15 kWh/m2a for Seoul (Table 14). The results unveil that energy efficient buildings can be also realized with comparable big north oriented window areas. In contrast to Buildings 3 and 4 which have a smaller window to wall area ratio, Buildings 1 and 2 have a smaller heating energy demand (Table 14). Furthermore, these results illustrate that the criteria for certified Passive Houses, which require a maximum heating energy demand of 15 kWh/m2a, can be met by all four case study buildings located in Istanbul, but only for Buildings 2 and 4 located Seoul. All four case study buildings located in Berlin and Zurich exceed the maximum heating energy demand of 15 kWh/m2a (Table 14).
The hot water required for heating and hot water use is provided by a system consisting of a 10 kW air-source heat pump combined with a 12 m2 solar thermal system. Six solar thermal flat plate collectors with dimensions of 1   m × 2   m are installed at the South façade with a slope of 70 degrees. The minimum indoor temperature is 20 °C. Considering an outside air temperature of 2 °C and a water temperature of 35 °C, the heat pump has a COP of 3.1. To provide the electric energy required for the operation of the building services engineering systems and to achieve a net zero energy building at the four locations, a Photovoltaic system is installed on the roof of the building with a total area of 102 m2, a 10.8 kWPeak PV system, and a total gross area of 84 m2. The system consists of 60 modules, the size of each is 1.4 m2.
According to the calculations of the energy balances, executed with Polysun [32] for Buildings 1 and 2, the previously described building concept results in a positive annual energy balance (Net Zero-Energy buildings) for location in Seoul, Istanbul, and Zurich (Table 14). Compared with Building 1 the energy productivity of Building 2 is higher at all 3 locations due to its higher energy efficiency (Table 14). For Berlin, the total annual energy balance of Building 1 is negative while the energy balance of Building 2 is positive. Whilst Building 1 here has an electric energy demand of 1 kWh/m2a Building 2 produces an electric energy surplus of 12 kWh/m2a.

4. Conclusions and Outlook

This paper presents a framework for the development of the ETB for the primary design of ZEBS in different climate zones and discusses the required physical background that needs to be considered for the calculation of the energy behavior in buildings according to EN ISO 13790, and the Swiss norm SIA 380/1 [13,14]. The concepts and basic conditions of certified PH, Net Zero-Energy, and Net Plus-Energy buildings are the basis with which to approach the energy behavior of ZEBs and to develop the framework for the development of the ETB. Technologies for GT, ST, and PV energy production, and the most efficient technologies currently available for a building services engineering system are identified to convert energy to meet the energy demand for the operation of ZEBs. The maximum energy demand for certified PHs [7] defines the maximum heating load and primary energy demand.
The aim of this research was to provide a primary analysis of the basic conditions, and the identification of basic requirements for the design of ZEBs located in Berlin, Zurich, Istanbul, and Seoul. Accordingly, the feasibility for the design of a ZEB in the four cities with different basic conditions could be confirmed. Based on the summary of the research findings, the following guidelines for the design of ZEBs and the further development of the ETB can be provided.
ETB Part 1: To meet the criteria of a certified PH [12], the building design and structure must be adapted to the specific climate conditions. The factors to consider include the appropriate thermal insulation of the building envelope, the avoidance of thermal bridges, appropriate size and orientation of transparent building envelope components (such as windows) with low u-values and high g-values, the control of solar radiation to facilitate both passive solar heating and passive cooling, and highly energy efficient appliances, lighting systems and building services engineering systems such as mechanical ventilation systems with HRC. A climate adapted building shape has a positive influence on passive heat gains. Large portions of a PH’s heating demand are comprised by internal gains and external gains in the form of solar radiation [12]. Thermal energy for both heating and cooling can be stored in building components. Climate adapted design includes green components such as greened roofs, greened façades and external shading systems in order to provide passive, and evaporative cooling and avoid indoor overheating during non-heating periods.
ETB Part 2: The appropriate selection, dimensioning, and combination of efficient, effective and sustainable technologies for the conversion of energy are required to at least balance a building’s total yearly primary energy demand with the yearly onsite production of renewable energy, and to achieve the design of a Net Zero- or a Net Plus-Energy building. Specific local conditions such as climate, soil, surrounding buildings and flora, user behavior, and the legal framework may limit the use of some technologies while favoring the use of others. The use of GT, ST, and HC in combination with thermal storage capacity and high efficiency HP systems can contribute to a comparable low primary energy demand for the provision of heat for heating and DHW production. The derived efficiency factors (APF, EER, and SEER) allow a simple calculation of the required electricity energy for the operation of HPs based on the end energy demand for heating and DHW. The resulting yearly electricity demand, plus the electricity demand for lighting and other facilities can be met by a PV to meet the requirements for Net Zero-Energy and Net Plus-Energy buildings. The appropriate and climate adaptive installation of technologies included in the ETB can contribute effectively to the reduction of the final electric energy demand. Such technologies in the ETB, including HC from wastewater, green facades and roofs, adaptive shading (controlled blinds), dynamic adaptive lighting and/or component activation have positive effects on the building’s efficiency and therefore space of PV and ST.
The purpose of the ETB is a design tool for the primary planning and design of ZEBs. It must be assumed that the theory and practice of the calculation of a building’s energy demand does not necessarily coincide with the energy demand and the energy consumption during operation of the realized building. Therefore, the calculation results of the ETB should be seen as rough estimations. The development of the ETB framework has been finalized in the framework of this research. However, the results delivered by the ETB need to be validated by evaluation and comparison with measured data from case studies at the projected locations in the cities of Berlin, Zurich, Istanbul, and Seoul. Future investigations and adjustment of the ETB input parameters according to the validation results will ensure the reliability of the input parameters for the applied technologies under different climatic and cultural conditions. The climate plays a central role in the energy demand and energy productivity of a specific building design. Climate data are currently only included in the ETB based on Swiss Building Standards. An important task for the future research and development of the ETB will be the transfer of national specifications for climate data, electric energy demand, and building components to an international level. Definitions for HGT, HDD, CDD, and the heating limit are critical values that vary internationally. Cultural differences and user behavior can have a considerable impact on the energy demand and actual energy consumption of buildings.
Simulation programs [30,31,32] are suitable for the configuration, dimensioning, and calculation of yields of HP systems with ST and PV systems in the ETB. However, such simulations require a comparably significant effort because the simulations need to be executed with different orientations of ST collectors and/or PV panels, as well as extra options such as different efficiency ratios, size of storage tanks. For example, about 120 simulations are required to define system layouts for PV power plants at every location.
To simplify the simulation procedure and facilitate the configuration and layout of HP systems with ST and PV systems layout, a database is planned that can be linked to the ETB. The database should include the preset system configurations and yields for different orientations and locations. New technologies that are suitable for the transformation and provision of energy for the operation of ZEBs need to be included in the ETB as soon as they are available in the market.
It is important to include technologies and systems for effective and energy efficient cooling in the ETB due to the increasing cooling demand for buildings which is associated with the increasing proportion of housing stock with well insulated building envelopes and with large areas of transparent glass facades [65]. The ETB includes the quantification of cooling performances of new and innovative technologies such as green facades or adiabatic cooling technologies and under different climate conditions. Qualitative aspects that are considered in the ETB include the need for combining cooling and dehumidification during the hot and humid summer months in Korea, and accordingly a higher cooling energy demand in order to provide comfortable indoor temperatures and to avoid the potential occurrence of condensation and mold indoors [25]. The ETB also includes information regarding the availability of local resources for the operation of energy technologies, such as rainwater for adiabatic cooling. In the future the ETB should be extended to technologies that are relevant for the design of ZEBs and that are included in the toolboxes for the categories’ biomass (e.g., for the processing of organic wastes and food production with soil based or hydroponic systems) and water (e.g., rainwater harvesting and management, recycling and reuse of wastewater, and water supply) [57].
This ETB is based on simplified static calculation methods and data derived from the norms cited in this paper in order to support the primary design and planning of ZEBs. An extension of the ETB to energy-autonomous and self-sufficient ZEBs, which requires no external energy infrastructure but therefore seasonal energy storage on site [6,9], has not been addressed in this research. In such an ETB, the layout and dimensioning of on-site renewable energy production (such as ST and PV) and storage systems would need to be included in order to guarantee continuous energy supply [6,53]. Therefore, simulations regarding the energy demand and energy production in relatively short time intervals such as days, weeks, and months would need to be executed. Accordingly, the effort needed for these simulations would be much larger than that for the ETB for Net Zero- and Net Plus-Energy addressed in this research, and would require an automation of the simulation process with linkage to a database. Programs that allow a much deeper insight in the specific building energy demand are available [54]. In addition, Microsoft Excel based toolboxes for the detailed simulation of a building’s heating energy and cooling demand are already available in the Swiss market [55] and could be further developed at an international level.
It can be concluded that planning an energy layout for a building is a highly complex process. While difficulties due to a vast number of influencing factors can arise, the energy layout process provides creative potential to implement new technologies and building shapes.
This article on the research of the development of a framework for the ETB discussed a new simplified approach that facilities the basic primary design of ZEBs. This ETB facilitates the comparable, easy, and fast selection, appropriate combination, and primary dimensioning of technologies for the on-site conversion, provision, and management of energy required for the operation of ZEBs in four cities in Germany, Switzerland, Turkey, and Korea. Accordingly, this ETB can be used for the analysis and evaluation of different technologies and systems for the operation of ZEB’s in the cities of similar climate zones. In the future, the ETB is planned to be extended to other climate zones and to include new and innovative technologies that facilitate the efficient conversion, provision and management of energy for the operation of ZEBs. Thus, ETB could become a powerful tool for architects and building planners for the primary design and planning of ZEBs in different countries and climate zones around the world.

Acknowledgments

This work was supported by funding from the KORANET Joint Call on Green Technologies (www.koranet.eu). The discussed research was also supported by Valentin Software GmbH (Berlin, Germany) by provision of simulation tools [30,31]. The authors would like to thank Franziska Brück and Jens Vent-Schmidt for their support and productive discussions.

Author Contributions

Initial research for the ETB was executed by M. Talmon-Gros with T. Schuetze in Korea. Further research and development of the ETB was carried out with C. Koller and contributions from M. Talmon Gros and R. Junge in Switzerland. All authors contributed equally to the writing of this paper and read and approved the final manuscript.

Conflicts of Interest

The authors declare no conflict of interest.

References

  1. Heinrich-Böll-Stiftung. Urban Futures 2050—Szenarien und Lösungen für das Jahrhundert der Städte (German: Scenarios and Solutions for the Century of Cities); Heinrich-Böll-Stiftung: Berlin, Germany, 2011; p. 176. [Google Scholar]
  2. UNEP—United Nations Environment Programme. Buildings and Climate Change Summary for Decision-Makers; UNEP DTIE Sustainable Consumption and Production Branch: Paris, France, 2009; p. 62. [Google Scholar]
  3. Harvey, D. Energy and the New Reality 1—Energy Efficiency and the Demand for Energy Services; Routledge: Toronto, ON, Canada, 2010; p. 672. [Google Scholar]
  4. Schuetze, T.; Junge, R. Zero Emission Building—Integrating Sustainable Technologies and Infrastructure Systems. Available online: http://www.zebistis.ch/index.php?option=com_content&view=article&id=3&Itemid=103 (accessed on 14 January 2016).
  5. European Commission. Energy Performance of Buildings Directive (2010/31/EU); European Parliament and the Council of the European Union, Ed.; European Parliament and the Council of the European Union: Brussels, Belgium, 2010; p. 23. [Google Scholar]
  6. Voss, K.; Musall, E.; Lichtmeß, M. From Low Energy Buildings to Net Zero-Energy Buildings: Status and Perspecives. J. Green Build. 2011, 6, 46–57. [Google Scholar] [CrossRef]
  7. Passive House Institute (PHI). Available online: http://passiv.de/en/ (accessed on 3 May 2016).
  8. Voss, K.; Musall, E. Net Zero Energy Buildings, 2nd ed.; Institut für Internationale Architektur-Dokumentation GmbH & Co. KG: Munich, Germany, 2012; p. 192. [Google Scholar]
  9. Torcellini, P.; Pless, S.; Deru, M.; Crawley, D. Zero energy buildings: A critical look at the definition. In ACEEE Summer Study; NREL National Renewable Energy Laboratory: Pacific Grove, CA, USA, 2006; pp. 1–15. [Google Scholar]
  10. Voss, K.; Musall, E. Nullenergiegebäude (German: Zero Energy Buildings); Detail Green Books: Munich, Germany, 2011; p. 192. [Google Scholar]
  11. Passive House Institute (PHI). Certification Criteria for Certified Passive House Glazings and Transparent Components; Passive House Institute (PHI): Darmstadt, Germany, 2012; p. 15. [Google Scholar]
  12. Passive House Institute (PHI). Passipedia. Available online: http://passipedia.org (accessed on 3 May 2016).
  13. International Organization for Standardization (ISO). ISO 13790:2008 Energy Performance of Buildings—Calculation of Energy Use for Space Heating and Cooling; International Organization for Standardization (ISO): Geneva, Switzerland, 2008; p. 162. [Google Scholar]
  14. Schweizer Ingenieur und Architektenverein (English: Swiss Public Association for Engineering and Architecture). SIA 380/1 Thermische Energie im Hochbau (German: Thermal energy in building construction). In Schweizer Ingenieur und Architektenverein; Schweizer Ingenieur und Architektenverein: Zurich, Switzerland, 2009; p. 60. [Google Scholar]
  15. Vorarlberg, E. Leitfaden für die Berechnung des Heizwärmebedarfs (German: Guideline for the Calculation of the Heating Energy Demand); Landesregierung Vorarlberg: Dornbirn, Austria, 2006; p. 21. [Google Scholar]
  16. OIB Austrian Institute for Construction Engineering. Energietechnisches Verhalten von Gebäuden (German: Energy Performance of Buildings); OIB Austrian Institute for Construction Engineering: Vienna, Austria, 2006; Volume 2.5, p. 417. [Google Scholar]
  17. International Organization for Standardization (ISO). ISO 10211:2007—Thermal Bridges in Building Construction—Heat Flows and Surface Temperatures—Detailed Calculations; International Organization for Standardization (ISO): Geneva, Switzerland, 2007; p. 45. [Google Scholar]
  18. International Organization for Standardization (ISO). ISO 13789:2007—Thermal Performance of Buildings—Transmission and Ventilation Heat Transfer Coefficients—Calculation Method; International Organization for Standardization (ISO): Geneva, Switzerland, 2007; p. 18. [Google Scholar]
  19. International Organization for Standardization (ISO). ISO 13370:2007—Thermal Performance of Buildings—Heat Transfer via the Ground—Calculation Methods; International Organization for Standardization (ISO): Geneva, Switzerlnd, 2007; p. 48. [Google Scholar]
  20. International Organization for Standardization (ISO). ISO 10077-1:2006—Thermal Performance of Windows, Doors and Shutters—Calculation of Thermal Transmittance—Part 1: General; International Organization for Standardization (ISO): Geneva, Switzerland, 2006; p. 35. [Google Scholar]
  21. Meteotest Meteonorm Software. Available online: http://www.meteonorm.com (accessed on 4 May 2016).
  22. Baumert, K.; Selman, M. Heating and Cooling Degree Days; World Resources Institute: Washington, DC, USA, 2003; p. 12. [Google Scholar]
  23. Paschotta, R. RP-Energie-Lexikon—Heizgradtage, Heizgradstunden, Heiztage, Gradtagszahl, Heizwärmebedarf (German: RP-Energy Dictionary—Heating Degree Days, Heating Degree Hours, Heat Days, Daily Temperature Figure, Heating Energy Demand). Available online: https://www.energie-lexikon.info/index.html (accessed on 4 May 2016).
  24. Girin, B. Linear Regression in EnergyDeck: How to Make the Most of It. Available online: https://www.energydeck.com/blog/article/linear-regression/ (accessed on 4 May 2016).
  25. Schuetze, T.; Lee, P.-R. Covering the energy demand of domestic buildings in Korea with Renewable Energy. In Proceedings of the 7th International Conference on Sustainable Energy Technologies, Seoul, Korea, 24–27 August 2008; Korea Institute of Ecological Architecture and Environment, World Society of Sustainable Energy Technologies (WSST), Eds.; Korea Institute of Ecological Architecture and Environment/World Society of Sustainable Energy Technologies (WSST): Seoul, Korea, 2008; pp. 2087–2094. [Google Scholar]
  26. BizEE Software Limited Degree Days.net—Heating & Cooling Degree Days—Free Worldwide Data Calculation. Available online: http://www.degreedays.net (accessed on 4 May 2016).
  27. Remund, J.; Müller, S.; Kunz, S.; Studer, C.; Klauser, D.; Schilter, C. Meteonorm Handbook Part II: Theory—Version 7.1/July 2015; Meteotest: Bern, Switzerland, 2015; p. 79. [Google Scholar]
  28. Jenni, J. Das Sonnenhaus: Mit Hohem Deckungsgrad für Warmwasser und Heizung (German: The Solar House: With High Coverage Ratio for Hot Water and Heating), 3rd ed.; Jenni Energietechn.: Oberburg, Germany, 2010; p. 88. [Google Scholar]
  29. DIN Deutsches Institut für Normung e.V. (German: German Standard Organization). DINEN 14511-2:2015-12—Air Conditioners, Liquid Chilling Packages and Heat Pumps with Electrically Driven Compressors for Space Heating and Cooling and Process Chillers, Using Electrically Driven Compressors—Part 2: Test Conditions; Beuth: Berlin, Germany, 2015; p. 20. [Google Scholar]
  30. Valentin Software GmbH PV*Sol—Dynamic Simulation with Our Photovoltaic Planning Program for the Design and Optimization of Photovoltaic Systems, with Storage Systems. Available online: http://www.valentin-software.com/en/products/photovoltaics/55/pvsol (accessed on 4 May 2016).
  31. Valentin Software GmbH T*Sol—Dynamic Thermal Simulation Program for Designing and Optimizing Solar Thermal Systems. Available online: http://www.valentin-software.com/en/products/solar-thermal/14/tsol (accessed on 4 May 2016).
  32. Vela Solaris AG Polysun Simulation Software. Available online: http://www.velasolaris.com/english/home.html (accessed on 4 May 2016).
  33. Läufle, B. Conversation with an engineer of the FRANK GmbH about performance numbers for cooling and heating with waste water in Asia and Europe. Unpublished work. 2014. [Google Scholar]
  34. Nipkow, J. Personal statement on electrical and domestic hot water consumption in Switzerland and Germany. Unpublished work. 2014. [Google Scholar]
  35. Schmidt, M. Personal statement on energy demand for cooling. Unpublished work. 2014. [Google Scholar]
  36. Hubbuch, M. Geothermal Heat Sources; Zurich University of Applied Sciences (ZHAW): Wädenswil, Switzerland, 2012. [Google Scholar]
  37. Afjei, T.; Dott, R.; Huber, A. Heizen und Kühlen mit Erdgekoppelten Wärmepumpen (German: Heating and Cooling with Ground Coupled Heat Pumps); Schweizerische Eidgenossenschaft, Eidgenössisches Department für Umwelt, Verkehr, Energie, Kommunikation: Bern, Switzerland, 2007; pp. 1–76.
  38. Hubbuch, M. Mit zwei Zentimeter Wärmedämmung hin zum Null-Heizenergiehaus: Fassaden-Modernisierung mit Aerogel-Dämmmatten (German: Towards Zero Heating Energy Building with Two Centimeter Thermal Insulation: Facade Refurbishment with Aerogel Insulation Boards); HK-Gebäudetechnik: Aarau, Switzerland, 2014; Volume 3, p. 4. [Google Scholar]
  39. Phillips, R.; Peterhans, S.; Hubacher, P.; Eugster, W.; Freymond, A.; Milelli, A. Wärmepumpen—Häufig Gestellte Fragen (German: Heat Pumps—Frequently Asked Questions); Eidgenössisches Departement für Umwelt, Verkehr, Energie und Kommunikation UVEK & Bundesamt für Energie BFE Abteilung Energieeffizienz und Erneuerbare Energien: Bern, Switzerland, 2010.
  40. Swiss Energy Foundation (SES). Wärmepumpen Müssen noch viel Effizienter Werden! (German: Heat Pumps Have to Get Much More Efiicient!). Available online: http://www.energiestiftung.ch/energiethemen/erneuerbareenergien/umweltwaerme/waermepumpe/ (accessed on 30 May 2016).
  41. Leibundgut, H. viaGialla—Wegbeschreibung für Gebäude in Eine Nachhaltige Energie-Zukunft (German: viaGialla—Roadmap for Buildings towards a Sustainable Energy Future). 2007, p. 58. Available online: https://www.research-collection.ethz.ch/bitstream/handle/20.500.11850/149672/eth-29277-02.pdf (accessed on 26 November 2017).
  42. Heinrich, A.; Huber, S. SIA 380/1: Einfluss der Vermeintlich Konstanten Eingabedaten auf den Heizwärmebedarf (German: SIA 380/1: Influence of Assumed Constant Entry Data on the Heating Energy Demand); Fachhochschule Nordwestschweiz, CAS Bauphysik 2011; Institut Energie am Bau: Zurich, Switzerland, 2011; pp. 1–23. [Google Scholar]
  43. Gierga, M.; Staniszewski, A. EnEV 2014—Energie-Einsparverordnung Leitfaden für Wohngebäude (German: EnEV2014—Energy-Saving Directive Guideline for Domestic Buildings); Arbeitsgemeinschaft Mauerziegel im Bundesverband der Deutschen Ziegelindustrie e.V.: Bonn, Germany, 2014; pp. 1–88. [Google Scholar]
  44. Paul, K. Der Einfluss des Gebäudenutzers (German: The influence of the building user). Tec21 2012, 138, 28–31. [Google Scholar]
  45. Schuetze, T. Dezentrale Wassersysteme im Wohnungsbau Internationaler Großstädte am Beispiel der Städte Hamburg in Deutschland und Seoul in Süd-Korea; Books on Demand: Norderstedt, Germany, 2005; p. 496. [Google Scholar]
  46. Linkola, L.; Andrews, C.; Schuetze, T. An Agent Based Model of Household Water Use. Water 2013, 5, 1082–1100. [Google Scholar] [CrossRef]
  47. Co2online Gemeinnützige GmbH Stromverbrauch im Haushalt: Durchschnitt & Einspartipps (German: Electricity Consumption in Households: Average and Tips for Saving). Available online: http://www.die-stromsparinitiative.de/stromkosten/stromverbrauch-pro-haushalt/ (accessed on 30 May 2017).
  48. Nipkow, J. Typischer Haushalt-Stromverbrauch; Eidgenössisches Departement für Umwelt, Verkehr, Energie und Kommunikation UVEK & Bundesamt für Energie BFE Abteilung Energieeffizienz und Erneuerbare Energien: Bern, Switzerland, 2013; p. 29.
  49. TUIK—Turkish Statistical Institute Population and Housing Census. 2011. Available online: http://www.turkstat.gov.tr/PreHaberBultenleri.do?id=15843 (accessed on 30 May 2017).
  50. Schuetze, T.; Luethi, C.; Kurath, S.; Park, C.-S.; Kang, J.-E.; Tschudi, F.; Regelsberger, M.; Baban, A.; Talmon-Gros, M.; Schmidt, M.; et al. 5th International Symposium ZEBISTIS—Zero Emission Building—Integrating Sustainable Technologies and Infrastructure Systems; Richmond, K., Ed.; Institute of Natural Resource Sciences, ZHAW: Wädenswil, Switzerland, 2014. [Google Scholar]
  51. Buehler, D. Best Practices of Zero Emission Buildings in Switzerland. Bachelor’s Thesis, Zuerich University of Applied Sciences, Waedenswil, Switzerland, 2013. [Google Scholar]
  52. Kurnaz, L. Drought in Turkey; Istanbul Policy Center: Istanbul, Turkey, 2012; pp. 1–12. [Google Scholar]
  53. Voss, K.; Goetzberger, A.; Bopp, G.; Häberle, A.; Heinzel, A.; Lehmberg, H. The self-sufficient solar house in Freiburg—Results of 3 years of operation. Sol. Energy 1996, 58, 17–23. [Google Scholar] [CrossRef]
  54. Mathez, S.; Hobi, H. Erste Messergebnisse vom Wetziker Plusenergiehaus (German: First Results from Wetziker Plus Energy Building); Tage der Sonne, Wetzikontakt: Wetzikon, Switzerland, 2014; pp. 1–39. [Google Scholar]
  55. EnFK—Konferenz Kantonaler Energiefachstellen Regionalkonferenz Zentralschweiz Planungshilfen—Energie Zentralschweiz (German: Design Tools—Energy Central Switzerland). Available online: http://www.energie-zentralschweiz.ch/vollzug/planungshilfen.html (accessed on 31 May 2017).
  56. Schuetze, T. Zero Emission Buildings in Korea—History, Status Quo, and Future Prospects. Sustainability 2015, 7, 2745–2767. [Google Scholar] [CrossRef]
  57. Bühler, D.; Schuetze, T.; Junge, R. Towards Development of a Label for Zero Emission Buildings: A Tool to Evaluate Potential Zero Emission Buildings. Sustainability 2015, 7, 5071–5093. [Google Scholar] [CrossRef]
  58. Kang, J.; Ahn, K.; Park, C.; Schuetze, T. Assessment of Passive vs. Active Strategies for a School Building Design. Sustainability 2015, 7, 15136–15151. [Google Scholar] [CrossRef]
  59. Nishihata, H.; Kempener, R.; Simbolotti, G.; Tosato, G. Heat Pumps—Technology Brief; International Energy Agency (IEA)—Energy Technology Systems Analysis Programme (ETSAP)/International Renewable Energy Agency (IRENA): Paris, France; Abu Dhabi, UAE, 2013; p. 24. [Google Scholar]
  60. Sudo, T.; Kajiya, R.; Sakai, K. Energy evaluation by simulation for effective use of sewage heat. In Proceedings of the 13th Conference of International Building Performance Simulation Association, Chambéry, France, 25–28 August 2013; IBPSA International Building Performance Simulation Association: Chambéry, France, 2013; pp. 753–760. [Google Scholar]
  61. Primas, A.; Fotsch, P.; Ruf, N.; Basler & Hofmann AG. Solare Wassererwärmung in Mehrfamilienhäusern (German: Solar Hot Water Production in Multifamily Dwellings); Bundesamt für Energie BFE: Bern, Switzerland, 2005; p. 32.
  62. HSR Hochschule für Technik Rapperswil. SPF Industrietag: Solartechnik für Wärme und Strom (German: SPF Industry Day: Solar Technology for Heat and Electricity); HSR Hochschule für Technik Rapperswil: Rapperswil, Switzerland, 2016. [Google Scholar]
  63. Trier, D. Solar District Heating Guidelines—Solar Collectors—Fact Sheet 7.1; Solites—Steinbeis Research Institute for Solar and Sustainable Thermal Energy Systems: Stuttgart, Germany, 2012; p. 15. [Google Scholar]
  64. Davis, L.W.; Gertler, P.J. Contribution of air conditioning adoption to future energy use under global warming. Proc. Natl. Acad. Sci. USA 2015, 112, 5962–5967. [Google Scholar] [CrossRef] [PubMed]
  65. Schmidt, M. The watergy concept towards a new water paradigm—Energy performance of green roofs and green walls. In Proceedings of the Green Roofs for a Changing Climate—The 2nd London World Green Roof Congress, London, UK, 19–20 September 2010; CIRIA & Livingroofs.org: London, UK, 2010; pp. 1–29. [Google Scholar]
  66. Wong, E.; Hogan, K.; Rosenberg, J.; Denny, A. Reducing Urban Heat Islands: Compendium of Strategies; EPA US Environmental Protaction Agency: Washington, DC, USA, 2008; p. 177.
  67. Schoof, J. Haus ohne Heizung: Bürogebäude von Baumschlager Eberle in Lustenau (German: House without Heating: Office Building by Baumschlager Eberle in Lustenau). Available online: http://www.detail.de/artikel/haus-ohne-heizung-buerogebaeude-von-baumschlager-eberle-in-lustenau-11703/ (accessed on 25 May 2016).
  68. Lütkemeyer, I.; Krause, J.; Löhnert, G.; König, H.; Hennings, D.; Sick, F. Energy-Plus Primary School, Hohen Neuendorf, Germany; iiSBE International Initiative for a Sustainable Built Environment: Helsinki, Finland, 2011; pp. 1–8. [Google Scholar]
  69. Reichmann, B.; Claus, S.; Schmidt, M.; Manfred, K.; Ines, H. Konzepte der Regenwasserbewirtschaftung—Leitfaden für Planung, Bau, Betrieb und Wartung (German: Concepts for Rainwater Management—Guideline for Planning, Construction, Operation and Maintenance); Berlin Senatsverwaltung für Stadtentwicklung & Technical University Berlin: Berlin, Germany, 2010; p. 73. [Google Scholar]
  70. Kravcík, M.; Pokorný, J.; Kohutiar, J.; Kovác, M.; Tóth, E. Water for the Recovery of the Climate—A New Water Paradigm; People and Water, Association of Towns and Municipalities of Slovakia, ENKI, Foundation for the Support of Civic Activities: Bratislava, Slovakia, 2007; p. 94. [Google Scholar]
  71. Menerga GmbH. Comfort Air Conditioning Unit with Double Plate Heat Exchanger and "Adiabatic" Evaporative Cooling System—Comfort Air Conditioning Adsolair 56/58; Menerga GmbH: Mülheim an der Ruhr, Germany, 2014; pp. 1–8. [Google Scholar]
  72. Hui, S.C.M.; Chan, S.C. Integration of green roof and solar photovoltaic systems. In Proceedings of the Joint Symposium 2011: Integrated Building Design in the New Era of Sustainability, Hong Kong, China, 22 November 2011; pp. 1.1–1.10. [Google Scholar]
  73. New, J.; Miller, W.A.; Huang, Y.; Levinson, R. Comparison of software models for energy savings from cool roofs. Energy Build. 2016, 114, 130–135. [Google Scholar] [CrossRef]
  74. Bevilacqua, P.; Mazzeo, D.; Bruno, R.; Arcuri, N. Surface temperature analysis of an extensive green roof for the mitigation of urban heat island in southern Mediterranean climate. Energy Build. 2017, 150, 318–327. [Google Scholar] [CrossRef]
  75. Coma, J.; Pérez, G.; de Gracia, A.; Burés, S.; Urrestarazu, M.; Cabeza, L.F. Vertical greenery systems for energy savings in buildings: A comparative study between green walls and green facades. Build. Environ. 2017, 111, 228–237. [Google Scholar] [CrossRef]
  76. Mazzeo, D.; Oliveti, G.; Arcuri, N. A Method for Thermal Dimensioning and for Energy Behavior Evaluation of a Building Envelope PCM Layer by Using the Characteristic Days. Energies 2017, 10, 659. [Google Scholar] [CrossRef]
  77. Mazzeo, D.; Oliveti, G.; Arcuri, N. Definition of a new set of parameters for the dynamic thermal characterization of PCM layers in the presence of one or more liquid-solid interfaces. Energy Build. 2017, 141, 379–396. [Google Scholar] [CrossRef]
  78. Stiebel Eltron GmbH & Co. KG. Product Information Product Nr.: 233514—LWZ 504 Central Ventilation; Stiebel Eltron GmbH & Co. KG: Holzminden, Germany, 2016; pp. 1–4. [Google Scholar]
  79. Zhuang, Z.; Li, G.; Zhang, Y.; Li, Y. Optimization Study on the Heat Transfer Area of the Sewage Source Heat Pump System Based on Year-round Coefficient of Performance. Procedia Eng. 2015, 121, 1535–1543. [Google Scholar] [CrossRef]
  80. Heinz, A.; Lerch, W.; Breidler, J.; Wagner, W. Wärmerückgewinnung aus Abwasser im Niedrigenergie-und Passivhaus: Potenzial und Konzepte in Kombination mit Solarthermie und Wärmepumpe WRGpot (German: Heat Recovery from Sewage in Lowenergy- and Passive-House: Potential and Concepts in Combination with Solarthermal and Heatpumps Heat Recovery Potential); Bundesministerium für Verkehr, Innovation und Technologie: Vienna, Austria, 2013; pp. 1–93.
Figure 1. Energy (heat) flux diagram according to the Swiss standard SIA 380/1 [14]: 1, system boundary for heat demand; 2, system boundary for domestic hot water (DHW); 3, system boundary for heating and DHW; and 4, system boundary for the building. Ehww, Energy demand for heating and DHW; EE, Electricity requirement.
Sustainability 09 02244 g001
Figure 2. Diagram of the Microsoft Excel Based ETB with Parts 1 and 2, and with the building site as system border. Heat balance of a building = ETB Part 1; Energy balance of a building = ETB Part 2.
Sustainability 09 02244 g002
Figure 3. Average monthly global solar radiation in Berlin, Zurich, Istanbul, and Seoul over the period of one year based on data generated with the program Meteonorm [21].
Sustainability 09 02244 g003
Figure 4. Electric energy consumption in a conventional household in Switzerland occupied by two persons (2350 kWh/a for two person = 1175 kWh/a for one person) (after [48]).
Sustainability 09 02244 g004
Figure 5. Two Functional sections (A,B) of a mechanical ventilation system with double plate air-to-air heat exchanger. The directions of airflows are illustrated from and to indoors (RA = return air; SA = supply air) and from and to outdoors: OA = outside air; EA = exhaust air). (A) illustrates the indirect adiabatic cooling mode. (B) illustrates the heat recovery mode with active standard heating coil for compensation of ventilation heat losses [40].
Sustainability 09 02244 g005
Table 1. Most important energy (heat) fluxes in the energy behavior of a building according to the Swiss standard SIA 380/1 [14].
EhwwEnergy Required to Meet the Remaining Heat Demand (Final Energy Demand) [all in Joule]
QhHeat demand for heating production.
QwwHeat demand for domestic hot water (DHW) production.
QhwwHeat demand for heating and domestic hot water (DHW) production.
QtTotal heat loss: Transmission heat loss (QT) and ventilation heat loss (QV).
QLHeat loss due to storage and distribution of DHW.
QugUsable heat gains (Qg) from: Solar (Qs), internal (Qi), human (Qip), and heat gains from electrical equipment (QiE).
QrHeat from the environment.
WRGHeat recovery (HRC) from exhaust air.
Table 2. Climate parameters for the calculation of the energy demand of a building according to EN ISO 13790 [13].
ParameterDefinition
Heat Days (HT)The number of days per year when the mean ambient temperature is below the heating limit and the heating system needs to maintain room temperature. The heating limit (base temperature) is set to be below 10 °C for Passive Houses in EU, and can drop below 0 °C when intensive solar radiation is present [23,24]. In Korea, the heating limit is set to 15 °C [25].
Heating/Cooling Degree Days (HDD/CDD) A measure of the temperature (in °C) and specific period (number of days) at which the outside air temperature is below the specified “base temperature” [26]. CDD is analogous to HDD with temperatures above the specified base temperature [26].
Base temperature tht/tcttht is the base temperature (°C) and is defined as the lowest temperature before heating is required. It depends on the thermal properties of the building, the heating schedule, and the external influences such as solar gains [26]. Most standards set the base temperatures between 15.5 °C and 17 °C for heating. In a PH, the base temperature can be set to 10 °C [24]. tct is the base temperature (°C) for cooling, tct is usually set to 24–26 °C [25].
Norm ambient temperature θneThe lowest temperature (°C) during a cold spell, occurring 10 times in 20 years over a length of at least two consecutive days. The capacity of the heating system must be adjusted to this temperature [26].
Solar radiation IhorizontalHeat gains due to solar radiation on the façade (W/m2) is calculated by using horizontal solar radiation, and the radiation incident on the façade [27].
Table 3. Input, output, and calculation characteristics for technologies applied in Part 2 of the ETB.
InputsTechnologyInput(s) → Output(s)Outputs ETBETB Parameters for the calculation
ElectricityDynamic electric lighting controlElectricity → Heat and LightReduction of the electricity demand for lightingReduction of the required kWh for electric appliances in %
Solar RadiationPV Panel ST CollectorSolar radiation → Electricity Solar radiation → HeatPV area on site ST area on sitekWh/m2
Dynamic adaptive shading controlHeat Solar radiation → Heat and LightReduction of the electricity demand for coolingReduction of the required kWh for electronic applications in %
HeatHPHeat and Electricity → HeatKWh → m2 PVAPFheating; SEERcooling/EERcooling
Thermal StorageHeat → Heat(ST) area storage capacity on sitem3 buffer tank m2 ST area
Evaporative adiabatic CoolingHeat → HeatStorage capacity on-site for (rain) waterkWh/m3
Heat recovery from greywaterHeat → HeatReduction of the energy demand for DHW productionReduction of the required kWh for electronic applications in %
Table 4. Overview of the key climate characteristics that need to be considered in the Energy Tool Box for the four investigated cities (Data from [12,56,57]).
CityClimatic Basic Conditions
Zurich (Switzerland), Berlin (Germany)Temperate climate: Cold winters with overcast skies and limited solar radiation (Figure 3) result in heating demand for buildings during the cold months from October to April. Extreme high outdoor temperatures during the summer months that require cooling are rare. However, long summer days with intensive solar radiation (Figure 3) require control of solar radiation and application of passive cooling strategies in order to avoid overheating of indoors and to provide active cooling. Humidification and dehumidification of indoor air are generally not required [12,57].
Istanbul (Turkey)Subtropical/Mediterranean climate: Wet and cold winters with considerable solar radiation (Figure 3) and the location at the Mediterranean Sea result in a relatively short heating period from December to March. The summers are relatively dry with strong solar radiation (Figure 3). The highest temperatures are measured in July and August. Buildings require both heating and cooling. Humidification and Dehumidification of indoor air is generally not required [12].
Seoul (Korea)Temperate climate with subtropical and continental climate influences: Cold and dry winters with cold northwestern winds from Siberia result in heating demand for buildings from November to March. Clear skies and relatively strong available solar radiation (Figure 3) facilitate the effective passive and active use of solar radiation. Hot and humid summer months with significant rainfall and reduced radiation due to overcast skies limit the active use of solar radiation (such as PV) in the period from June to August [25]. Summer days with intensive solar radiation require control of solar radiation and application of passive cooling strategies in order to avoid overheating of indoors. Due to the very high outdoor temperatures and high relative humidity, the application of passive cooling strategies is essential, whereby active cooling and dehumidification of indoor air is required in order to meet the indoor comfort criteria of PHs [12,56].
Table 5. Climate data applicable in the ETB for the four investigated cities with values for CDD (Cooling Degree Days), HDD (Heating Degree Days), θne (Norm Ambient Temperature), HD (Heating Days), and I, global solar radiation incident on specifically oriented facades (ISouth, IEast/West, INorth) and on a horizontal plane (Ihorizontal) [21,27]. The indices associated with HD denote the number of days when the temperature falls below a certain degree.
CityCDDHDDθneHDISouthIEast/WestINorthIhorizontal
K · d a °CD k W h m 2 a
Zurich221655−8HD20/12 2128076803881127
Berlin261615−14HD20/12 2128266503601041
Seoul8812432−18HD20/15 1818646944391185
Istanbul101588−1HD20/12 1219658384361367
Table 6. Measures to reduce the electric energy consumption in households [48].
Type of Appliance/TechnologyMethod of Electric Energy Reduction and Potential Savings
Washing machines (laundry, dishwasher)Cold wash should be used preferably and direct connection to the DHW circuit of the building, to avoid high electricity consumption of the washing machine for hot water production.
Tumble dryer with integrated HP systemReduction of up to 50% compared with condenser tumble dryers.
Avoidance of standby modeUp to 20% reduction is possible.
PC/Laptops with solid state disc (SSD) and organic light emitting diodes (OLED) Monitors Reduction up to 50% compared to conventional systems.
Building servicesControlled operation of energy efficient circulation pumps.
Lighting together with intelligent lighting methodsMaximization of daylight use. LEDs can save up to 90% of the electric energy compared with conventional light bulbs.
Table 7. Example of the average electricity demand of a Swiss household occupied by two persons in kWh per person and year, for a conventional household (top) and an energy efficient household (bottom), and quantification of measures for the reduction of electricity demand in households [48].
Designation of Influences on Electrical FacilitieskWh/a per Person
Electricity consumption of a conventional (standard) Swiss household1175
Methods for the Reduction of Electricity Demand in Households
• Lighting with an energy efficiency of more than 80% (e.g., LED)−188
• No tumble dryer−130
• Washing machine/Dishwasher connected to DHW circuit−60
Electricity consumption of an energy efficient Swiss household 797
Table 8. Coefficient of Performance (COP) for different HP systems for the provision of heat used in the ETB.
Heat Pump SystemPerformance (COP)Remarks
Conventional Air-source heat pumps (ASHPs)2Usually with limited application for PH standard, due to a low COP, and comparable high primary energy demand, which increases with higher outdoor air temperatures [22].
Efficient ASHPs3Better efficiency due to combination with exhaust air from controlled ventilation system with air-to-air heat exchanger and an HRC efficiency of up to 90%. Can also be used for hot DHW production [59].
Ground-source heat pumps (GSHPs)3.5–4.5Higher temperatures and heat capacity of soil or groundwater result in higher COPs than ASHPs. COP numbers are based on simulations with the programs T*SOL [31] and Polysun [32].
Sewage-Source heat pumps (SSHPs)4–5.5Higher temperatures and heat capacity of domestic wastewater originating and processed in the building result in higher COPs compared with ASHPs or GSHPs [60].
Table 9. Basic estimated layout parameters for ST systems in the ETB, including specification of collector type, volume of the seasonal storage tank, and level of thermal insulation in order to achieve high yearly cover rates for the ST provision of DHW and heating energy [28].
ST Technology ComponentRemarks~Qualitative and Quantitative Criteria
Collector typeNon-concentrating high efficiency vacuum tube or flat plate collectors. Specific component selection should be evaluated in conjunction with specific basic conditions and system setup.
Volume seasonal storage tank175 L to 200 L and maximum 1000 L per m2 collector area.
Thermal insulation seasonal storage tankInsulation thickness 20–30 cm (λ: 0.02–0.03 W/mK)
Table 10. Overview of some specifications and benefits of adiabatic cooling applicable in the ETB [69].
Field of applicationAt outside temperatures up to 30 °C, the supply air can be cooled to between 20 °C and 22 °C. Energy savings up to 70% at an ambient temperature of 38 °C can be achieved compared to conventional systems.
PerformanceThe evaporation of one cubic meter water generates 680 kWh of cold energy at 30 °C (at 100 °C it is 630 kWh/m3).
Benefits compared to other cooling systems The cost of adiabatic cooling is up to eight times less in terms of installation, operation, and maintenance costs, than that of solar cooling. Lower circulation losses (50% at conventional systems) and energy savings can be made per year of up to 70–90% compared to the use of electricity or district heating to cool buildings.
Table 11. Coefficient of Performance (COP) for different HP cooling systems used for the provision of cold in the ETB.
Heat Pump SystemPerformance (COP)Remarks
Efficient Air-source heat pumps (ASHPs)1.5–2Active cooling can be realized with efficient ASHP system. Some reversible ASHP systems facilitate cooling, dehumidification of air, heating, and DHW production, as well as in combination with mechanical ventilation system with HRC up to 90% in one unit (Table 9). Cooling can be provided via both fresh air supply and water born radiative systems [78].
Ground-source heat pumps (GSHPs)3.5–4.5Lower temperatures and heat capacity of soil or groundwater result in higher COPs compared with ASHPs. An advantage of GSHP is the regeneration of the soil while storing heat during summer. Simulations showed that with passive cooling, and floor heating, the temperature inside the building can be reduced by 2 °C to 4 °C, or 70% of the heat probe’s heating power (for example, in Switzerland approximately 50 W/m or 100 kWh/(m*a) for heating) [37]
Sewage-Source heat pumps (SSHPs)3.5–3.8Wastewater reaches a temperature of about 25–28°C in summer. With this source temperature, COP of about 3.5 to 3.8 can be achieved for cooling [60,79].
Table 12. Technologies for the reduction of a building’s energy demand and to increase efficiency of buildings.
TechnologyReduction Parameters Included in the ETB
Adaptive shading (controlled external blinds)7% reduction of energy demand for cooling compared with buildings without external blinds [58].
Dynamic adaptive lighting28% reduction of the electric energy demand for lighting [58].
Heat recovery from domestic waste water (in the building)Heat demand reduction for the production of DHW by approximately 30% [80].
Building component activationThermal storage capacity of 3m3 concrete in building components is equal to the capacity of 1 m3 water. Accordingly, the (seasonal) volume of the water storage tank for heating and cooling can be reduced [54].
Table 13. Building characteristics of Buildings 1 and 3 (Low Energy House) and Buildings 2 and 4 (Passive House). Values in grey cells indicate differences between Buildings 1 and 2. The u-value of the building envelope and the g-value of the windows are lower in Buildings 2 and 4 than of Buildings 1 and 3. Buildings 3 and 4 are modifications of Buildings 1 and 2. Compared with Buildings 1 and 2 the wall to window ratio on the north façade has been reduced from 0.13 to 0.06.
Building CharacteristicsUnitBuilding 1 Low Energy HouseBuilding 2 Passive HouseBuilding 3 Low Energy HouseBuilding 4 Passive House
Reference (Ref.)MWWR (Modified Wall to Window Ratio)
Window-to-wall area ratio South Façade 0.25
North Façade 0.130.06
East Façade 0.25
West Façade 0.06
u-value of the building envelope W Km 2 0.350.130.350.13
Specific heating power demand W Km 2 55305530
Specific heating energy demand kWh m 2 30153015
Specific cooling power demand W Km 2 50255025
Specific cooling energy demand kWh m 2 30153015
Air exchange rate 1 h 0.30.40.30.4
Air infiltration rate 1 h 0.3
Internal heat gain (light) W m 2 0
Internal heat gain (inventory) W m 2 0
Internal heat gain (people) W m 2 2
Internal heat gain (inventory) W m 2 240
Heat capacity of the building kJ Km 2 75010007501000
g-value (solar energy transmittance coefficient of windows) 0.70.50.70.5
Table 14. Summary of the main simulation results regarding the energy demand and energy productivity of Buildings 1, 2, 3 and 4 for the locations Seoul, Istanbul, Berlin, and Zurich. Gains are indicated by a + and losses are indicated by a − in front of the numbers.
City Building UnitSpecific Heating Energy Demand (Without Warm Water)Total Energy ConsumptionTotal Solar Thermal Collector Energy (to the System)Total Photovoltaic Energy (AC Converted)Total Energy Balance (Electric)
Seoul
Building 1Gains/Losses(kWh/a) −11,346 +4410 +10,082 +2539
Specific Gains/Losses(kWh/m2a)39−75.7 +29.4 +67.3 +16.9
Building 2Gains/Losses(kWh/a) −7516 +4268 +10,082 +3951
Specific Gains/Losses(kWh/m2a)14−50 +28.5 +67 +26.4
Building 3Gains/Losses(kWh/a) −11,668 +4421 +10,082 +2412
Specific Gains/Losses(kWh/m2a)39−77.9 +29.5 +67.3 +16.1
Building 4Gains/Losses(kWh/a) −7690 +4279 +10,082 +3883
Specific Gains/Losses(kWh/m2a)15−51.3 +28.6 +67.3 +25.9
Istanbul
Building 1Gains/Losses ((kWh/a) −7566 +4826 +12,682 +6816
Specific Gains/Losses(kWh/m2a)15−50.5 +32.2 +84.7 +45.5
Building 2Gains/Losses (kWh/a) −5728 +4761 +12,684 +7435
Specific Gains/Losses(kWh/m2a)2.4−38.2 +31.8 +84.7 +50
Building 3Gains/Losses (kWh/a) −7734 +4842 +12,682 +6763
Specific Gains/Losses(kWh/m2a)15−51.6 +32.3 +84.7 +45.1
Building 4Gains/Losses(kWh/a) −5792 +4768 +12,684 +7413
Specific Gains/Losses(kWh/m2a)2.9−38.7 +31.8 +84.7 +49.5
Berlin
Building 1Gains/Losses(kWh/a) −14,929 +4070 +8962 −75
Specific Gains/Losses(kWh/m2a)63−99.6 +27.2 +59.8 −0.5
Building 2Gains/Losses(kWh/a) −9575 +4019 +8962 +1828
Specific Gains/Losses(kWh/m2a)27−63.9 +26.8 +59.8 +12.2
Building 3Gains/Losses((kWh/a) −15,141 +4090 +8962 −136
Specific Gains/Losses(kWh/m2a)64−101 +26.8 +59.8 −0.9
Building 4Gains/Losses(kWh/a) −9698 +4022 +8962 +1772
Specific Gains/Losses(kWh/m2a)28−64.7 +26.8 +59.8+11.8
Zurich
Building 1Gains/Losses(kWh/a) −13,834 +4104 +9653 +738
Specific Gains/Losses(kWh/m2a)56−92.3 +27.4 +64.4 +4.9
Building 2Gains/Losses(kWh/a) -8949 +4136 +9653 +2688
Specific Gains/Losses(kWh/m2a)23−59.7 +27.6 +64.4 +17.9
Building 3Gains/Losses(kWh/a) −14,080 +4121 +9653 +662
Specific Gains/Losses(kWh/m2a)57−94.0 +27.5 +64.4 +4.4
Building 4Gains/Losses(kWh/a) −9064 +4129 +9653 +2624
Specific Gains/Losses(kWh/m2a)24−60.5 +27.6 +64.4 +17.5

