Article

Demand Forecasting for Heavy-Duty Diesel Engines Considering Emission Regulations

Department of Information & Industrial Engineering, Yonsei University, 134 Shinchon-dong, Seoul 120-749, Korea
*
Author to whom correspondence should be addressed.
Sustainability 2017, 9(2), 166; https://doi.org/10.3390/su9020166
Submission received: 15 December 2016 / Revised: 17 January 2017 / Accepted: 19 January 2017 / Published: 24 January 2017

Abstract

:
Makers of heavy-duty diesel engines (HDDEs) need to reduce their inventory of old-generation products in preparation for the demand for next-generation products that satisfy new emission regulations. In this paper, a new demand forecasting model is proposed to reflect special conditions raised by the technological generational shift owing to new emission regulation enforcement. In addition, sensitivity analyses are conducted to better accommodate uncertainty involved at the time of prediction. Our proposed model can help support manufacturers’ production and sales management for a series of products in response to new emission regulations.

1. Introduction

Environmental issues have become an important topic of discussion globally, and many policies aimed at reducing exhaust emissions have been enforced in many countries [1,2,3,4,5,6,7]. The exhaust gas from heavy duty diesel engines (HDDEs) includes toxic substances, such as nitrogen oxide (NOx), hydrocarbons (HC), carbon monoxide (CO), and particulate matter (PM), which negatively impact human visual and respiratory systems [8]. In addition, diesel exhaust gases include carbon dioxide (CO2), the most important contributor to the greenhouse effect; some researchers have found that “the excessive emissions of greenhouse gas cause the frequent occurrence of extreme weather on Earth, which threatens the safety of human society and the natural system” [9].
These toxic emission materials are regulated by law in most countries. In Europe, EURO 5, an exhaust gas regulation for HDDEs, was instituted in 2009 and imposed in 2011. Subsequently, EURO 6 was instated in 2014 and imposed in 2015. The stricter emission regulations induce technological competition and innovation [10] in the HDDE market, and in this situation, HDDE companies have to control the production of past-generation and new-generation HDDEs for the management of inventory and efficient operation of limited production facilities.
When a new emission regulation is enforced, the stock of prior-generation goods must be depleted while enough next-generation goods must be produced to meet the anticipated demand. A company that continues to produce a prior-generation engine without preparing to produce a new engine that can satisfy new emission regulations will suffer significant losses from both overstocks of the old engine and shortage of the new engine. To determine a suitable time to initiate production of the new engine, forecasted demand is needed by the HDDE manufacturer.
In general, the Norton and Bass model [11] and Speece and Maclachlan model [12] have been utilized to predict the demand for a technological product or service with more than two generations. Following these models, many models of demand forecasting have been developed. However, the earlier models are not suitable for HDDE manufacturers owing to two unique features of the HDDE market, which is controlled by governmental regulations.
First, the HDDE market is characterized by a product generation shift that is affected by the adoption of a governmental policy rather than customer choice. Therefore, if a new emission regulation is enforced, sales of the old-generation HDDE should stop. In addition, two generations of HDDEs can coexist for only a very short time period and, accordingly, a radical generation shift has to be reflected in the new demand forecasting model. The market’s second unique feature is related to the announcement of a new emission regulation enforcement plan. The effective date for an emission regulation is typically reported to the public at least one year prior to enforcement. Therefore, customers can anticipate the release of new-generation HDDEs that can efficiently reduce toxic substances, specifically exhaust gas, by combustion optimization and the engine’s fuel economy. When customers have high expectations from follow-up products, they often stop purchasing the current model and wait for the release of the next model. In this case, demand for the old product begins to decrease prior to the release date of the new product. Empirical examples can be readily found in the case of popular “series products,” such as new smartphones and computer parts (CPUs and graphics cards) of popular brands. However, the previous demand forecasting models assume that the demand for old-generation technology would steadily decrease right after the release of next-generation technology, but these models also cannot explain these empirical circumstances.
In this paper, we aim to propose a new forecasting model that reflects these two unique features of the HDDE market. Before forecasting demand, we explore how HDDE sales were affected by emission regulations by using past HDDE sales data of Company D, a top-tier HDDE manufacturer in Korea. The new model considers the forced phase out of current products to forecast the demand for a new HDDE so that the manufacturer can prepare for the regulated market. A factor that reflects the attraction of next-generation technology, which can affect customer propensity to purchase both old and new products, is suggested. In addition, a scenario analysis is conducted to help determine how the manufacturer can better prepare for regulation under various conditions using the proposed model.
The organization of the rest of this paper is as follows: In Section 2, the related literature is reviewed. In Section 3, a new model is proposed and the scenario analysis is described. Finally, in Section 4, the findings are discussed and areas for further research are suggested.

2. Related Literature

2.1. Technology Diffusion Model

There are many models to represent technology diffusion processes. Mansfield [13] proposed a simple model using several factors, such as the market share of a product at a given time, the upper limit of the market share, and the coefficient of imitation related to the word-of-mouth communication between the adopters and potential adopters. Since then, many researchers have suggested new diffusion models or extended Mansfield’s model [14,15,16,17,18,19].
The Bass model, which was inspired by Roger’s [20] book on the diffusion of innovations, was derived from the “conditional likelihood of adoption (now called a hazard function)” [15]. The innovation diffusion theory has been applied to various research areas investigating consumer behavior, marketing, and management science, and the Bass model is the main impetus underlying studies that use this diffusion theory [21].
Dodds [22] predicted the long-term sales behavior of a product based on early sales data of cable television adoption using the Bass model. Tigert and Farivar [23], also using the Bass model, forecasted the demand of supermarket optical scanning equipment in the United States. They gave careful consideration to the question of how many monthly or quarterly periods of data are required for stable and robust estimations. Easingwood et al. [24] proposed an extension of the Bass model; they argued that word-of-mouth effect can increase, decrease, or remain constant over time and suggested a non-uniform influence innovation diffusion model using δ, the non-uniform word-of-mouth coefficient.
The stream of innovation diffusion research dramatically changed after Norton and Bass [11] published the first multigenerational diffusion model of sales [25]. The model provided a more complete interpretation of the decreasing end position of a technology demand curve by using a multigeneration technology concept. Many researchers have proposed extended models applicable to a unique situation and environment based on the Norton and Bass model [26].
Speece and Maclachlan [12] applied the multi-generation diffusion model proposed by Norton and Bass to milk container technology and performed fitting tests for two sizes: gallons and half-gallons. In the half-gallon market, the original Norton and Bass model was not successfully applied, and, therefore, the authors proposed an extension model that includes pricing and growth terms, which allowed for improved forecasts.
Islam and Meade [27] showed that the coefficients of innovation and imitation are not constant in the general situation using a full information maximum likelihood procedure. Krishnan et al. [28] proposed a brand-level diffusion model to accompany the product category level Bass model. The brand-level diffusion model reflects additional concepts, such as the competition among brands and the company’s market share.
Becker et al. [29] used the Bass model to forecast customers’ adoption of electronic vehicles because “it works well for pre-production products and accounts for network effects” [30]. Lamberson [31] estimated the rate of adoption of hybrid electric vehicles by applying the Bass diffusion model and Gompertz model. Park et al. [32] utilized the generalized Bass diffusion model on historical time series data to forecast the market penetration of hydrogen fuel cell vehicles. The generalized Bass diffusion model considers external variables, including marketing effort and cost reduction. Qian and Soopramanien [33] forecasted sales and composition change in the Chinese car market using car ownership data and five diffusion models: the Gompertz model, logistic model, Bass model, extended Gompertz model, and extended logistic model. In addition, they used a rolling forecast approach instead of a fixed horizon approach. Qian and Soopramanien [34] also forecasted the market share of hybrid and electric cars in China using a segmentation diffusion model.
There have been many studies on the demand forecasting of various vehicles, but none of them have investigated it in terms of vehicle parts complying with emission standards and using field data.

2.2. HDDE Emission Regulations

In 1996, the US Environmental Protection Agency (EPA) announced the first emission regulations, known as Tier 1, for HDDEs used in mobile off-highway operations in the United States. Three years later, in Europe, the EU Stage I regulations were initiated. Recently, the reduction of PM, NOx, CO, and HC has been controlled by regulatory agencies of nearly all governments [35]. Meanwhile, East Asian countries, who are latecomers in HDDE technology, presently require at least EURO 4 emission limit values for their new vehicles. China, one of the world’s largest markets, has introduced emission regulations that are comparable with EURO 3 [36].
NOx accounts for the highest proportion of HDDE pollutant emissions. NOx leads to environmental issues such as acid rain, ozone destruction, nutrient enrichment, and smog. Among NOx emissions, NO2 contributes to lung-related diseases in humans [37]. CO enters through a person’s lungs and hinders hemoglobin’s ability to supply oxygen by combining with it. The amount of HC emissions is affected by irregular operating conditions, and unburned HC can also contribute to respiratory diseases and cancer. PM, which is produced by incomplete burning of HC in fuel and lube oil, causes asthma, lung cancer, and cardiovascular diseases. Accordingly, EURO emission standards for HDDE have regulated the limits for NOx, CO, HC, and PM as follows:
  • NOx limits: 8.0 g/kWh in EURO 1, 7.0 g/kWh in EURO 2, 5.0 g/kWh in EURO 3, 3.5 g/kWh in EURO 4, 2.0 g/kWh in EURO 5, and 0.4 g/kWh in EURO 6.
  • CO limits: 4.5 g/kWh in EURO 1, 4.0 g/kWh in EURO 2, 2.1 g/kWh in EURO 3, and 1.5 g/kWh in EURO 4–6.
  • HC limits: 1.1 g/kWh in EURO 1–2, 0.66 g/kWh in EURO 3, 0.46 g/kWh in EURO 4–5, and 0.13 g/kWh in EURO 6.
  • PM limits: 0.61 g/kWh in EURO 1, 0.15 g/kWh in EURO 2, 0.13 g/kWh in EURO 3, 0.02 g/kWh in EURO 4–5, and 0.01 g/kWh in EURO 6.
In recent years, several researchers have predicted that emission regulations could accelerate. For example, California tightened 70% of criteria pollutant standards in 2009. In Europe, emission regulations for the HDDE market have continually tightened. The criteria regarding pollutant and efficiency mandates will push HDDE development [38]. Ligterink et al. [39] measured a direct estimate of real-world NOx emissions for modern common EURO 5 trucks using a portable emission measurement system. They estimated that the NOx emissions from trucks in common urban settings are three times higher than the corresponding emission limit and much higher than limits in laboratory tests. Therefore, they argued for the need to include real-world emissions in the new EURO 6 legislation.
Under these circumstances in which emission regulations have tightened, demand forecasting for new compliant HDDEs is very timely and meaningful; such research can help companies estimate optimal investment or development timing for new HDDEs.

3. New Model

As mentioned, companies consider in their production schedule how much they must reduce production of the old engine, which meets existing emission regulations, and how much they must increase production of the new engine, which must meet upcoming emission regulations. This problem can be resolved by more careful demand forecasting of the new-generation HDDEs.

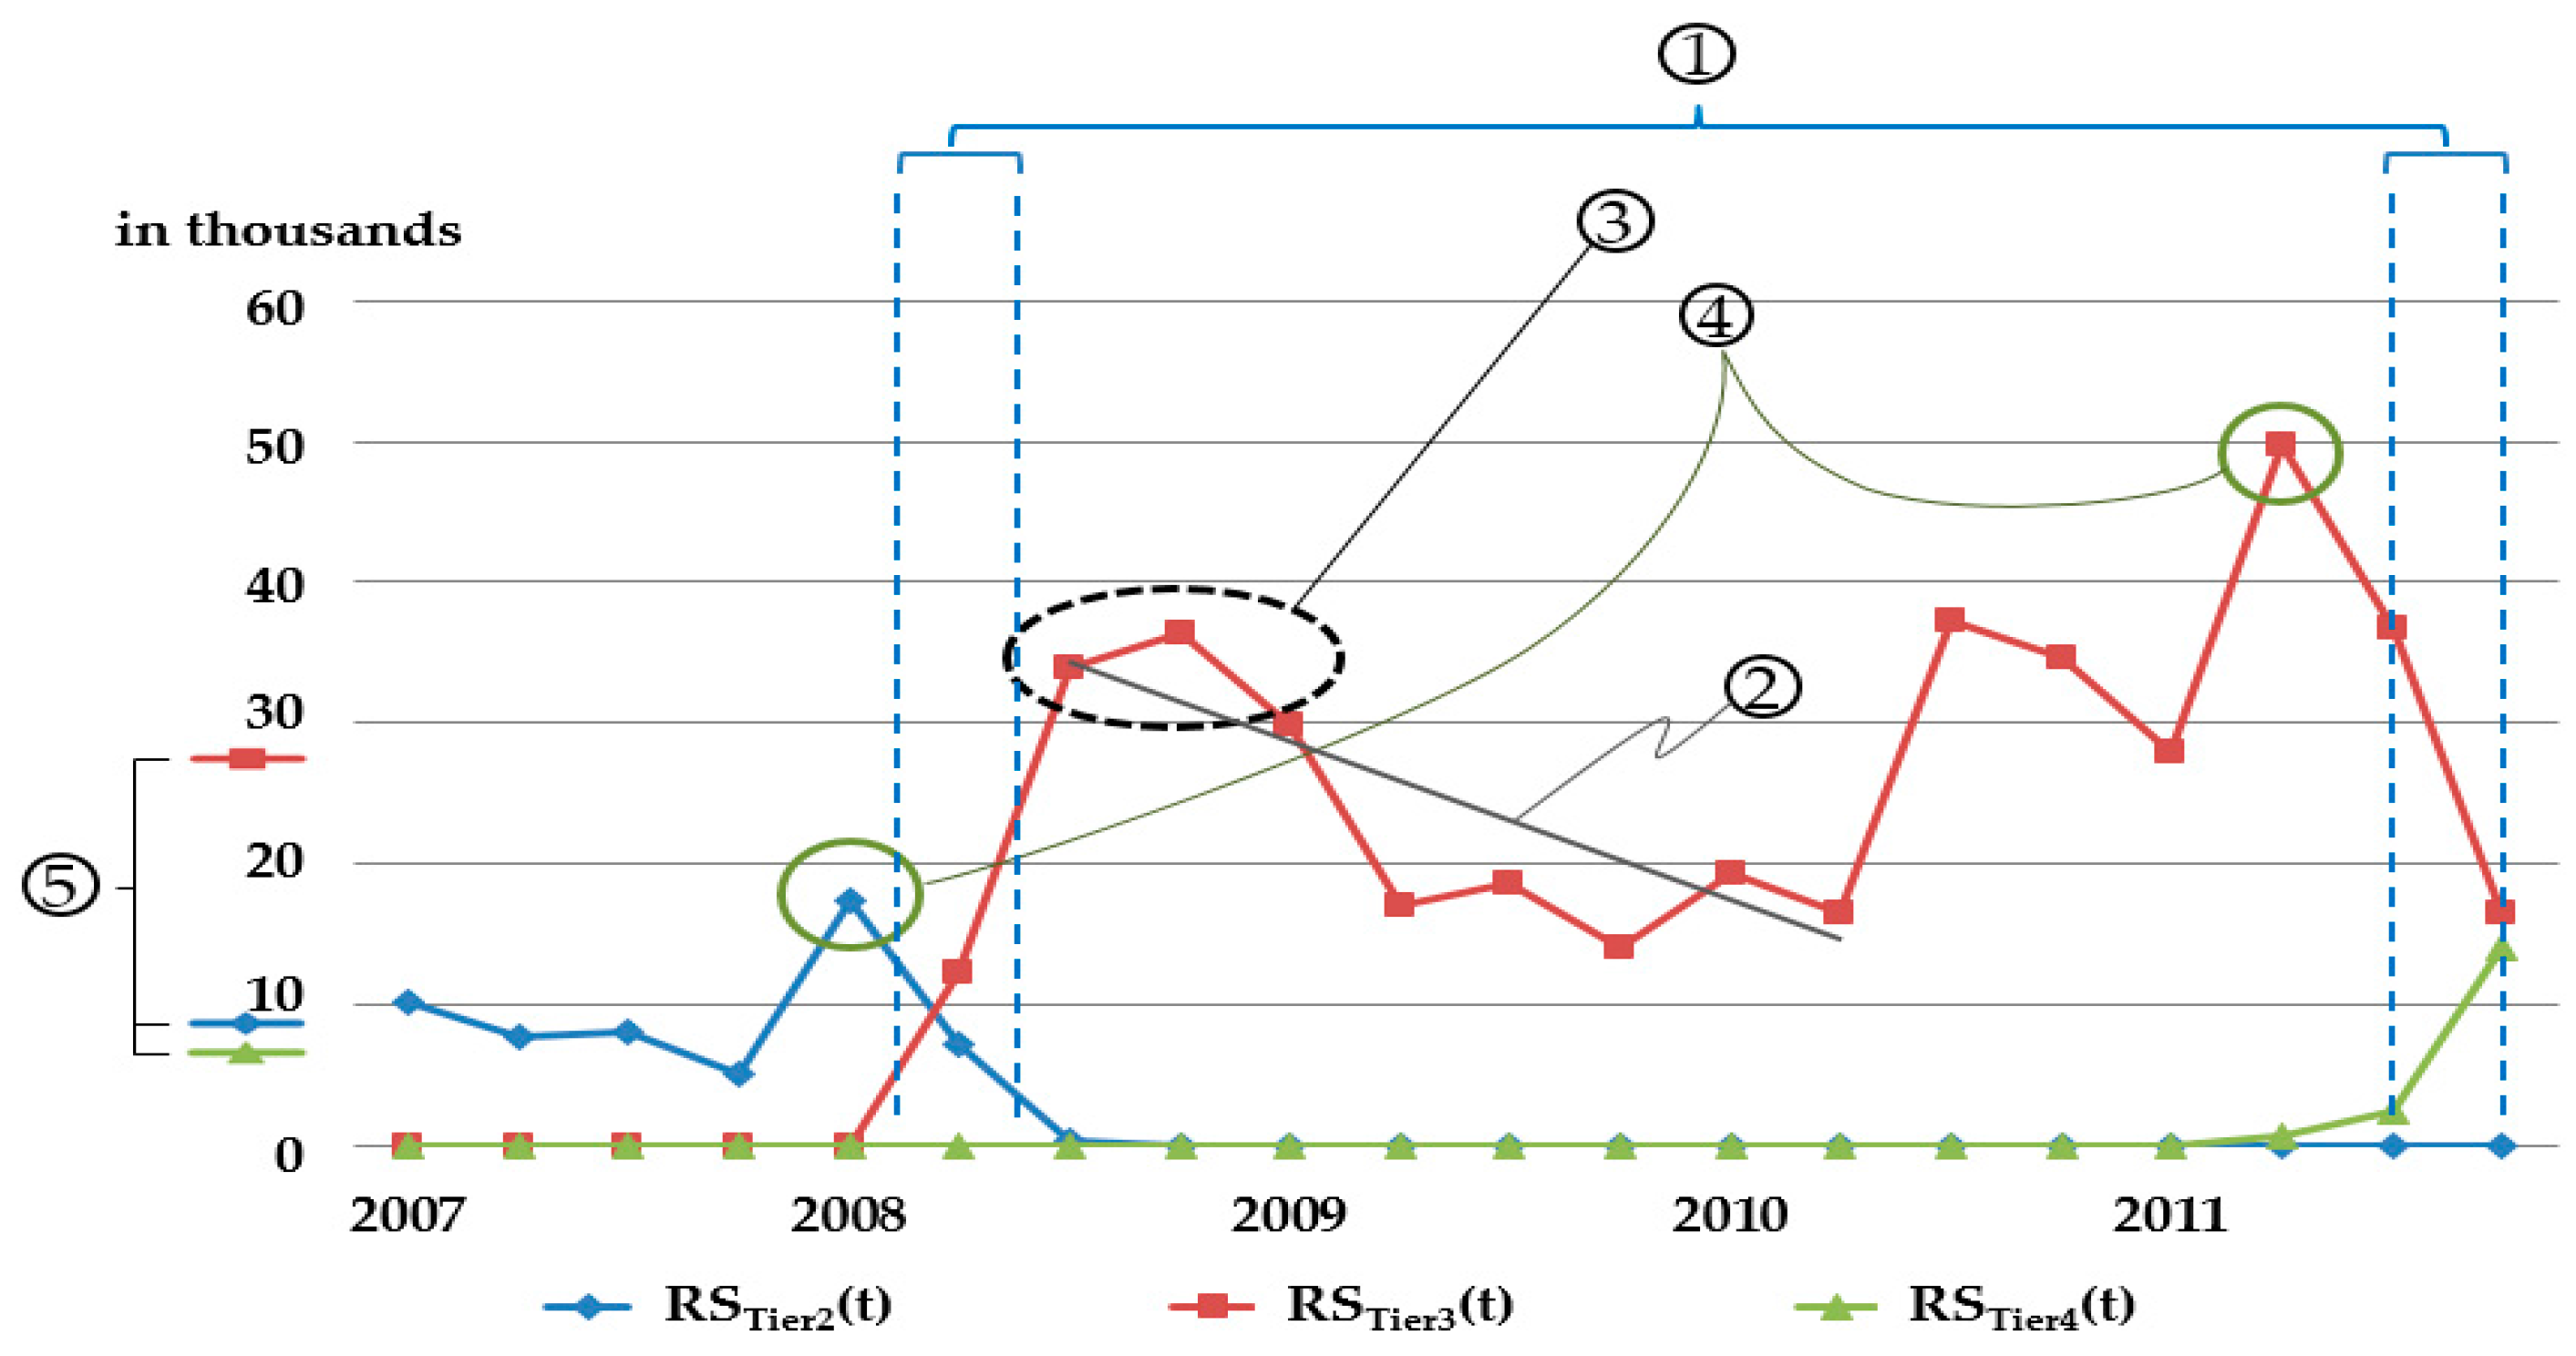
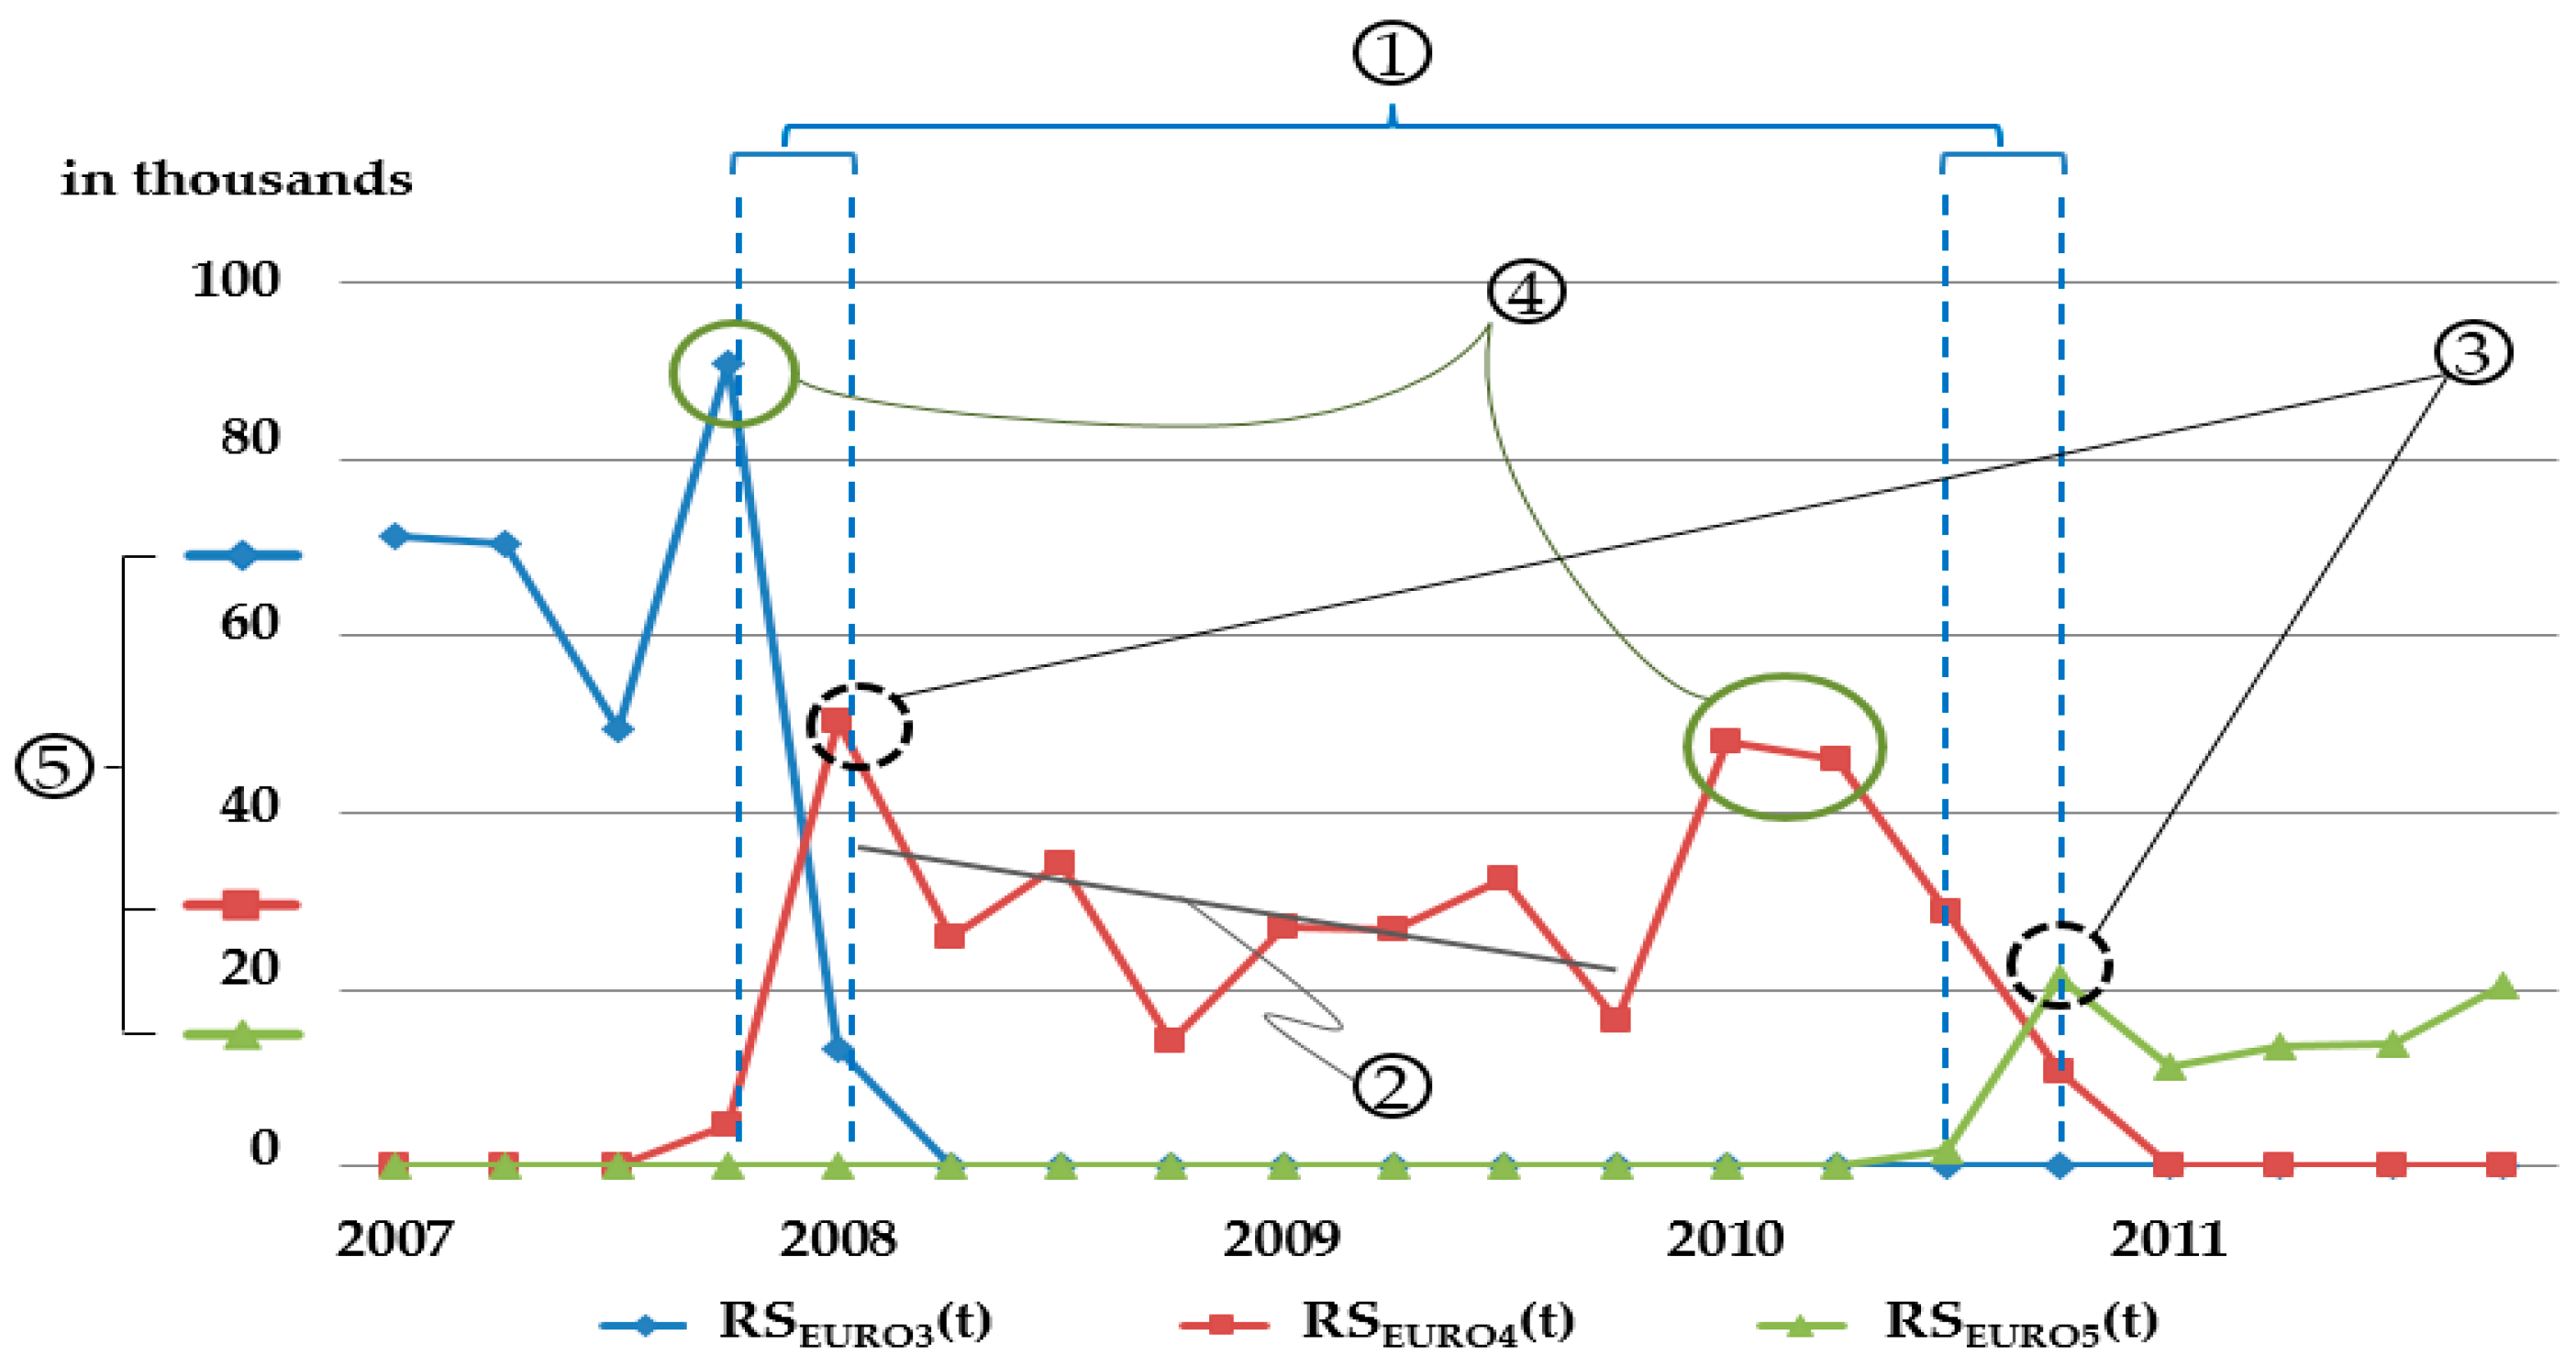
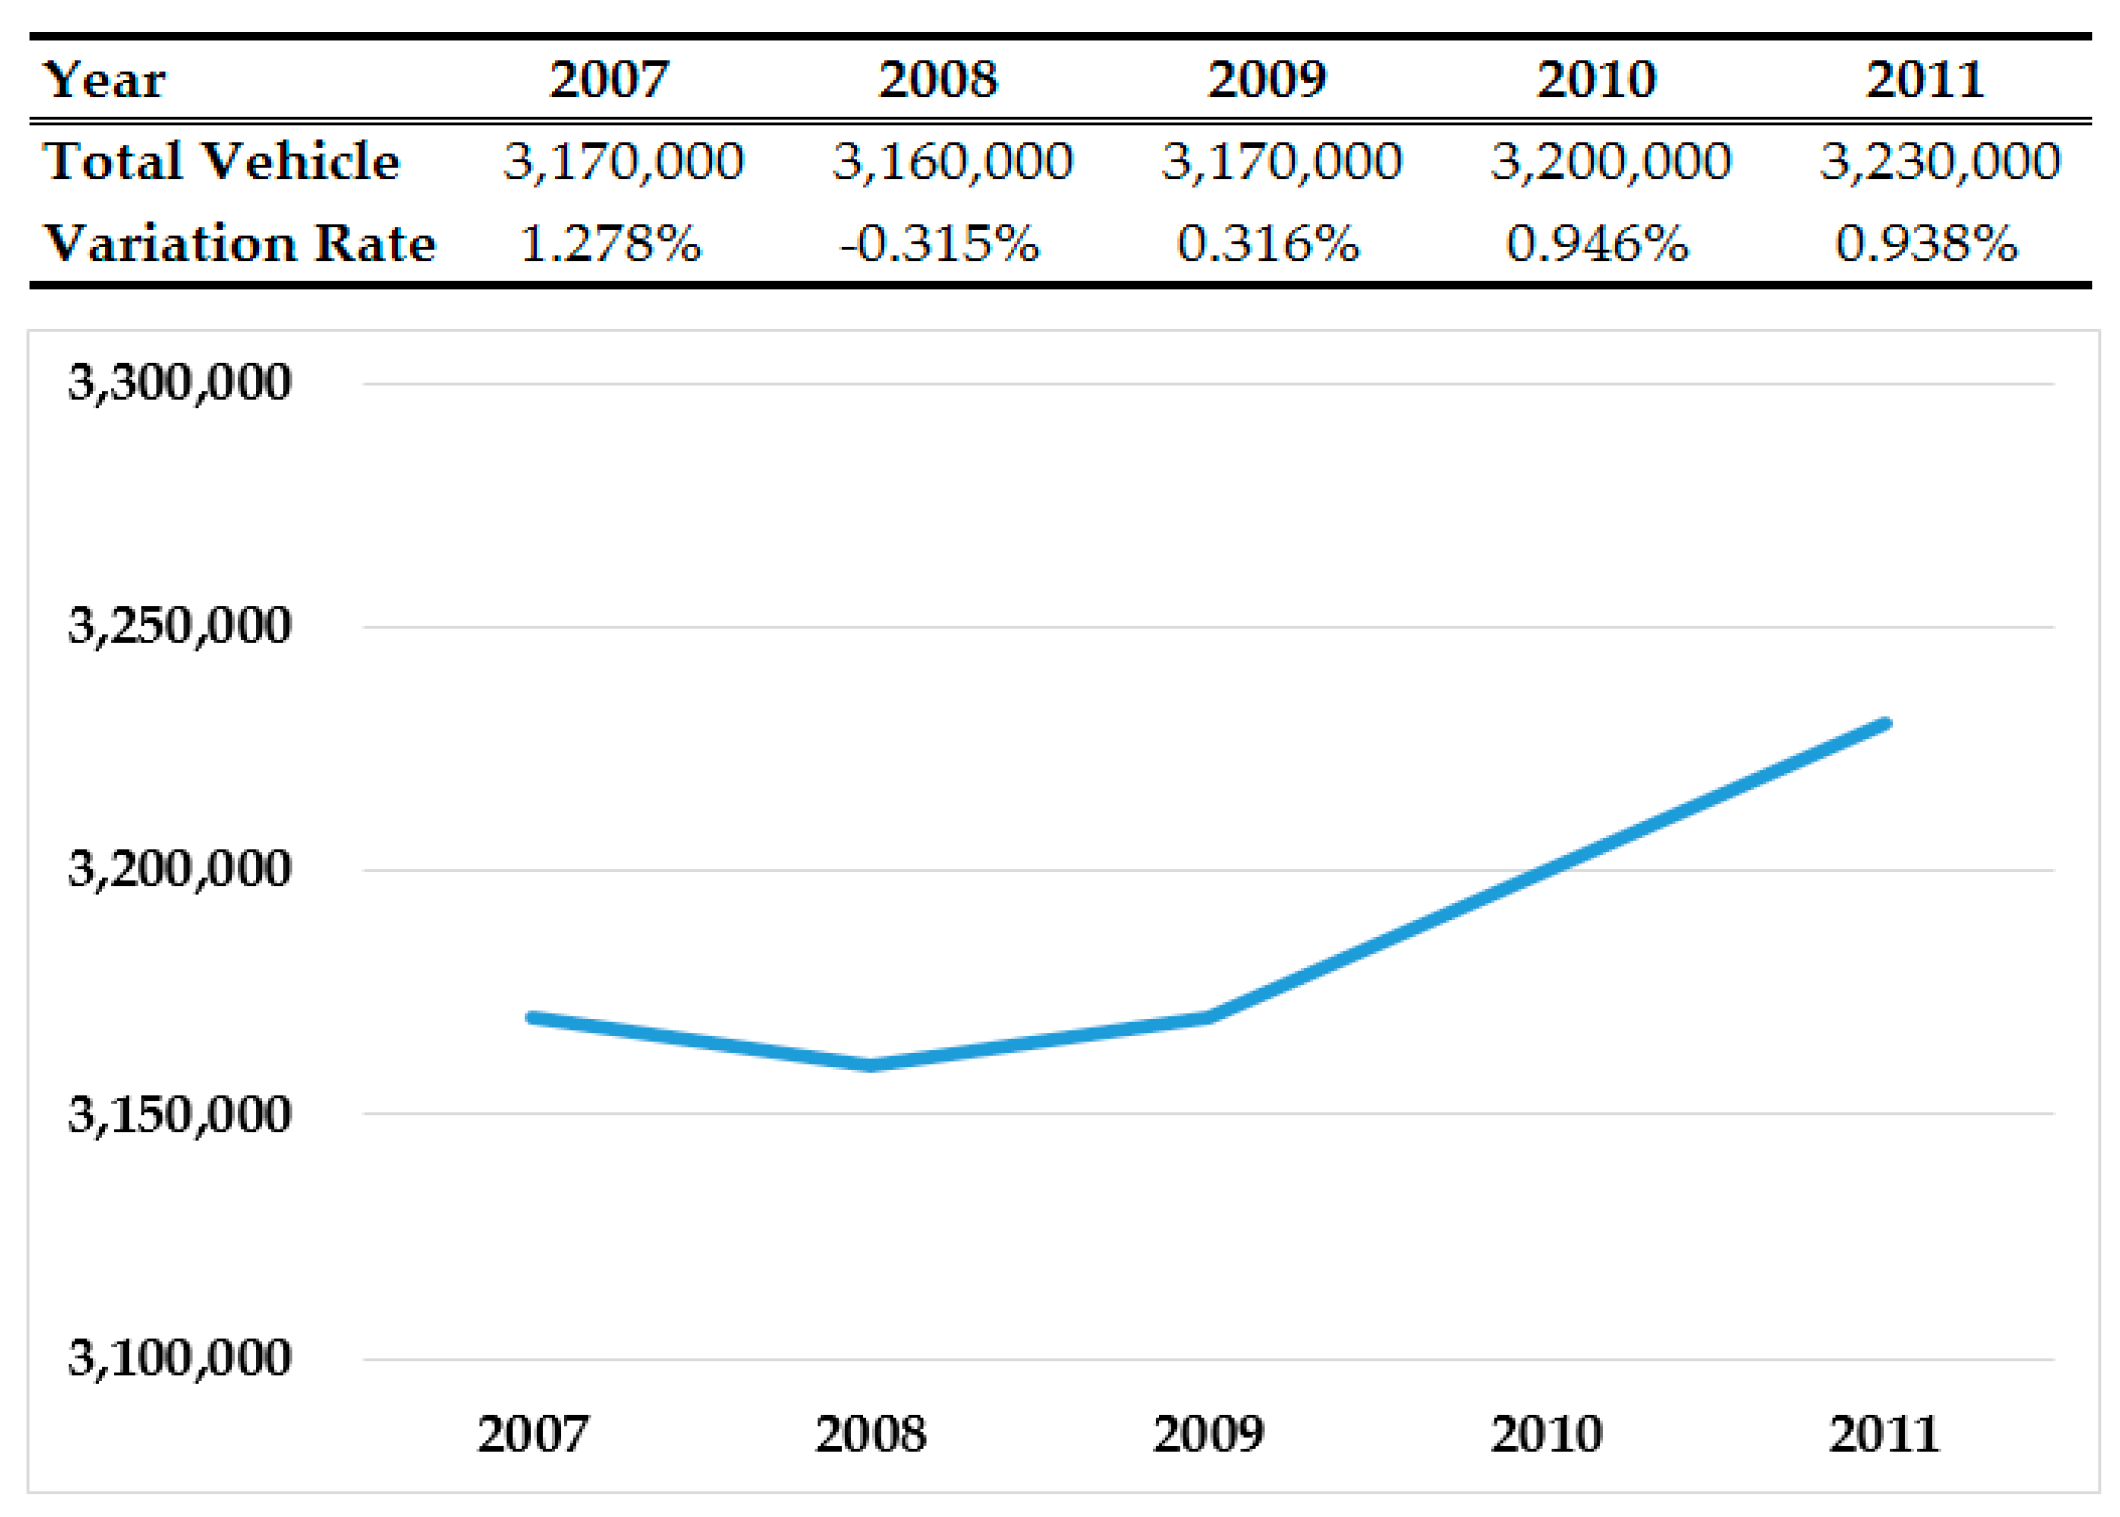
3.1. HDDE Sales Data
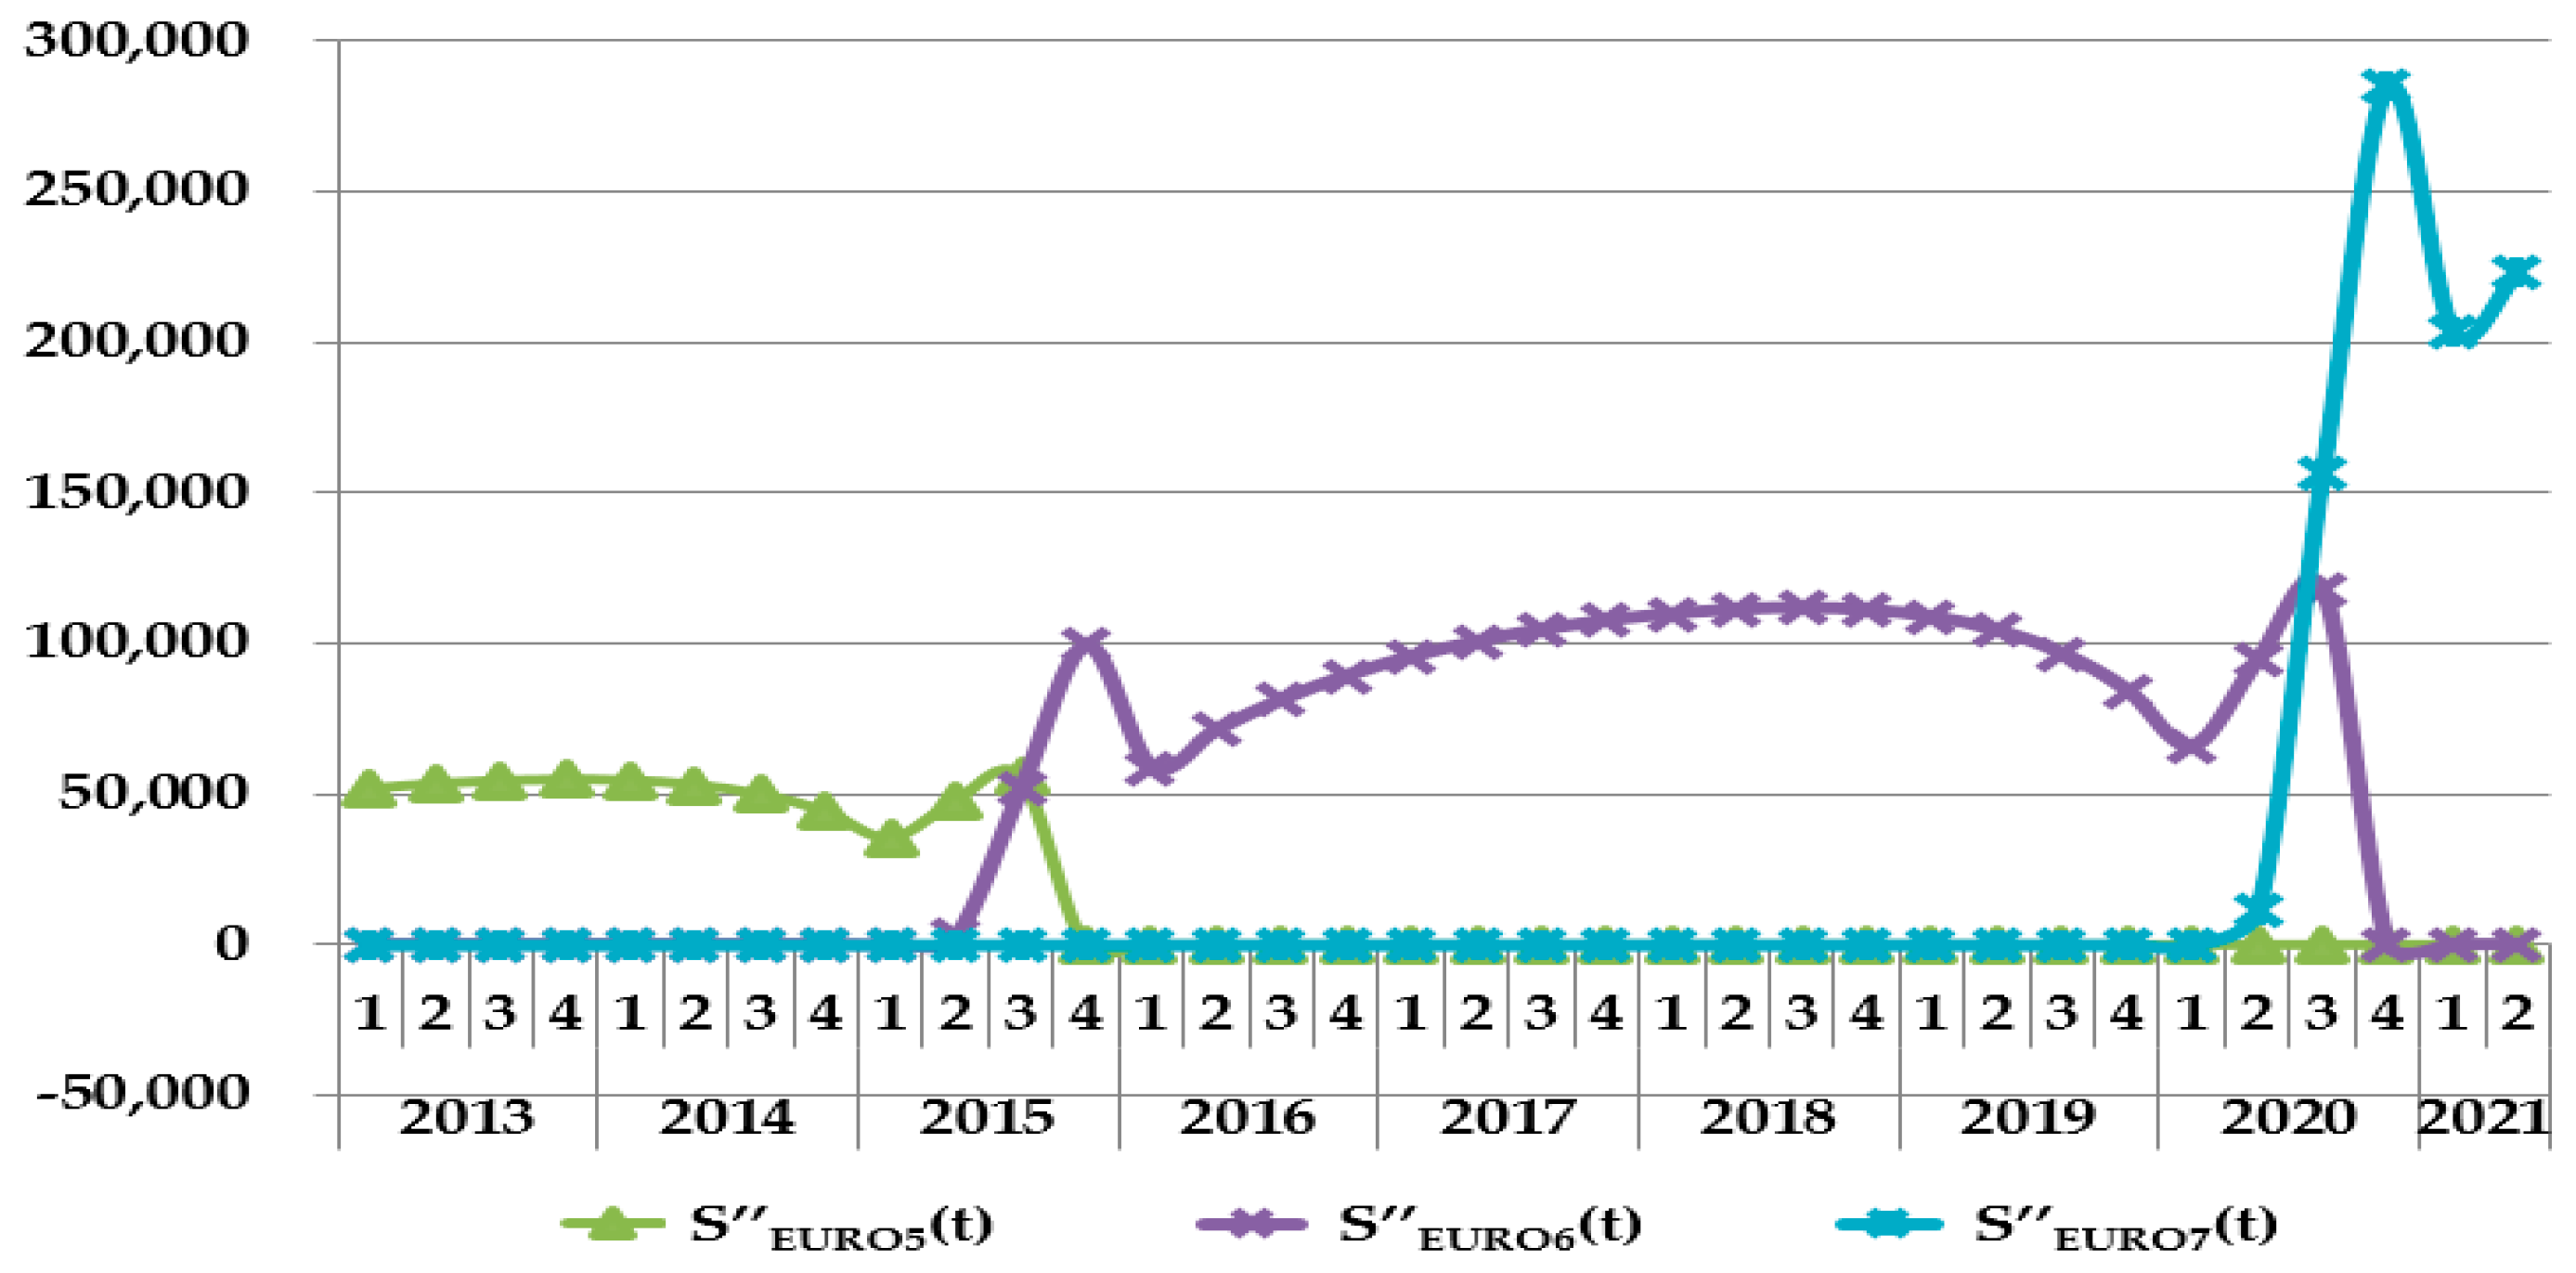
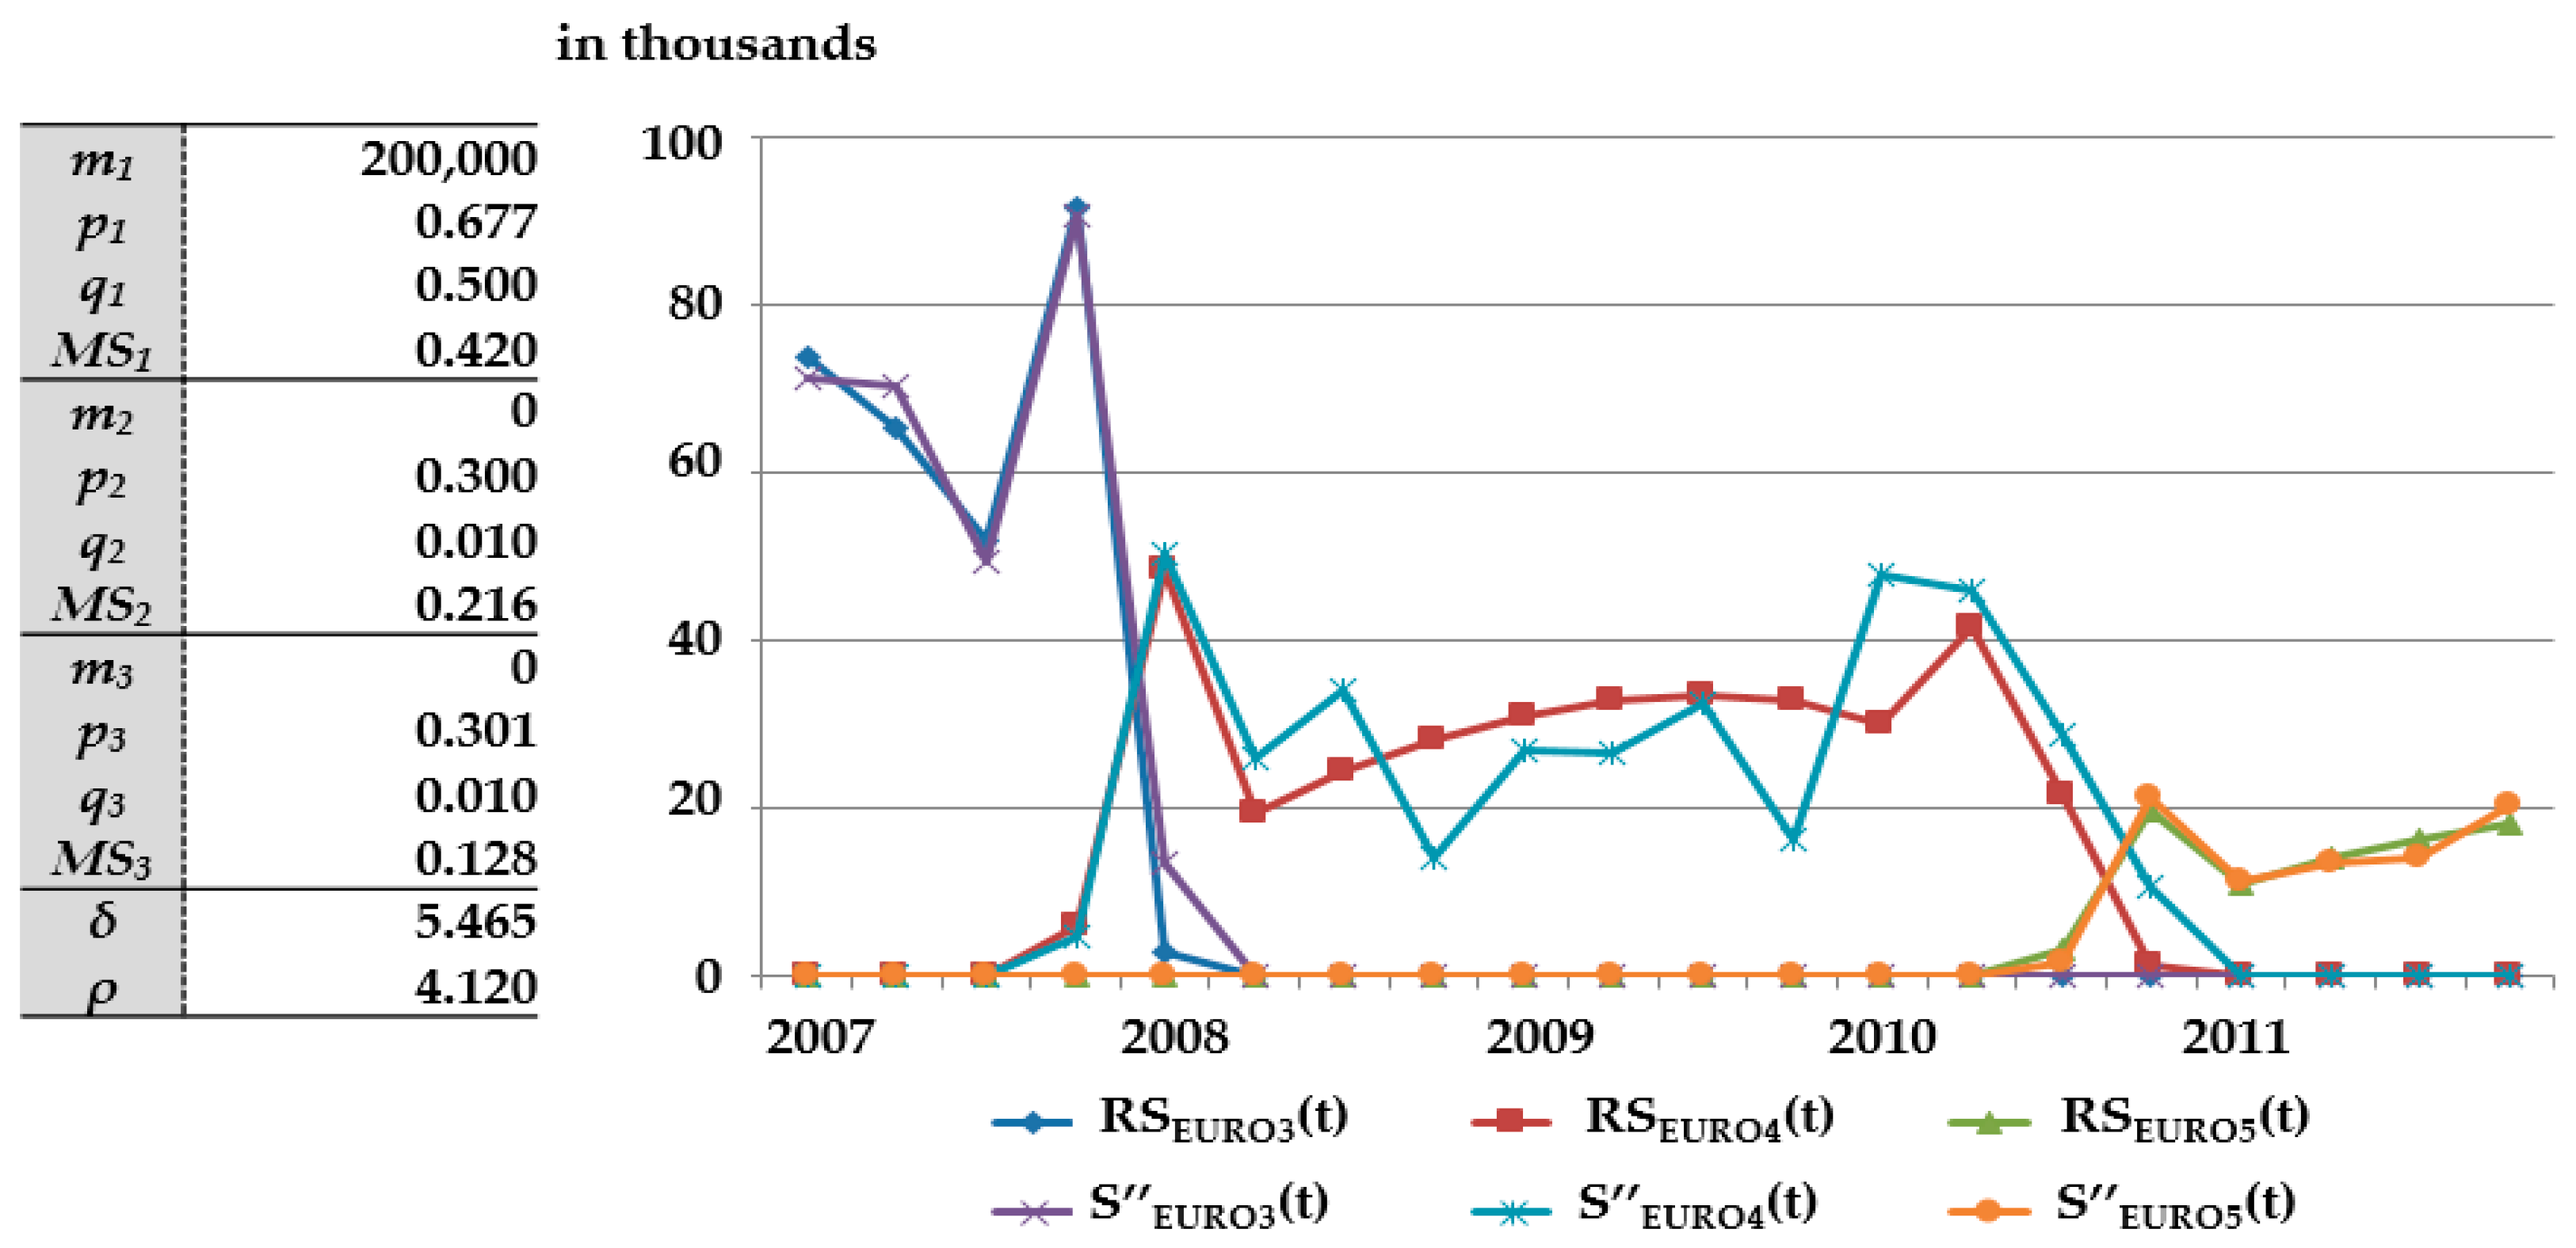
Table 1 reflects emission regulations and their effective period in Korea. The HDDE emission regulations of the European Union and United States are well known globally, and many countries have applied the same standards. In Korea, vehicles and commercial trucks with diesel engines have to meet the EURO emission regulations. The emission regulation, Tier, applies to heavy equipment.
Before forecasting demand, the past HDDE sales data of company D were explored, particularly in terms of how they were affected by the EURO regulations, which motivated this research. The data included quarterly sales of 8 L HDDE in Korea from 2007 to 2011 by company D, a heavy machinery and engine maker. In Figure 1, RS EURO   3 ( t ) represents the real sales amount of HDDEs that meet EURO 3, and RS EURO   4 ( t ) and RS EURO   5 ( t ) are the real sales amounts of HDDEs that meet EURO 4 and EURO 5, respectively. These HDDEs are made by Company D and sold in the Korean market. Likewise, in Figure 2, RS Tier   2 ( t ) , RS Tier   3 ( t ) , and RS Tier   4 ( t ) are the real sales amounts of HDDEs under Tier 2, Tier 3, and Tier 4, respectively.
Figure 1 and Figure 2 show the common characteristics of the sales amounts of HDDEs in the Korean market. The common characteristics are marked from ① to ⑤, and Figure 2 includes the emergence of a third-generation HDDE for Tier 3. The Norton and Bass model, in general, represents the considerable overlap periods of first- and second- as well as second- and third-generation technologies. However, the coexistence periods, ①, of the two technologies (old- and next-generation technologies) in Figure 1 are much shorter than that described by the Norton and Bass model. This pattern was affected by the adoption time of emission regulations that affect the life of the older-generation technology.
The attraction of the next-generation product also influences the shapes of ② and ③; this is related to the customer delay in purchasing an old-generation product. A large attraction of the next-generation product indicates that many customers are waiting for the next-generation product. For instance, if the attraction of the third-generation HDDE is large, then the sales of the second-generation HDDE, as represented by ②, decline even before the third-generation HDDE becomes available in the market. The peak sales for the next generation, ③, are influenced by the decreased sales of the previous generation, ②. A customer who does not purchase the second-generation product to wait for the third-generation product may buy the latter at its initial release. In addition, ④ represents the effect of a company’s promotion to dispose of prior-generation product stock. Finally, ⑤ represents the company’s average HDDE sales. The mature market’s potential in period t is uncertain, and the average sales represent the market share of a company. In addition, fluctuation due to exogenous factors and random error is observed.

3.2. Proposed Model

The Norton and Bass model [11] is broadly used for demand forecasting of new technological innovations. In addition, after the Norton and Bass model, many researchers have extended this technology diffusion model to reflect various situations of various markets. The original Norton and Bass model, which considers three generations of technology, is as follows.
S 1 ( t ) = F 1 ( t ) m 1 F 2 ( t τ 2 ) F 1 ( t ) m 1 = F 1 ( t ) m 1 [ 1 F 2 ( t τ 2 ) ] ,
S 2 ( t ) = F 2 ( t τ 2 ) [ m 2 + F 1 ( t ) m 1 ] [ 1 F 3 ( t τ 3 ) ] ,
S 3 ( t ) = F 3 ( t τ 3 ) { m 3 + F 2 ( t τ 2 ) [ m 2 + F 1 ( t ) m 1 ] } ,
f ( t ) [ 1 F ( t ) ] = p + qF ( t )
where:
  • S i ( t ) is the i-th generation’s sales at time t;
  • F i ( t ) is the fraction of the ultimate potential of the i-th generation that has been adopted at time t;
  • f i ( t ) is the probability distribution function of adoption time t of the i-th generation;
  • m i is the market’s maximum sales per unit life period of the i-th generation;
  • τ i is the introduction time of the i-th generation;
  • t is the accumulated quarter from τ 1 ;
  • p is the coefficient of innovation; and
  • q is the coefficient of imitation.
However, it is difficult to apply this model to the case of new HDDEs that comply with emission regulations because the HDDE case has unique characteristics. The emission regulations require that the next-generation HDDE replace the old-generation of HDDE within a specified period. If new emission regulations are enforced in a country, construction and transportation vehicles, including excavators, roaders, forklifts, buses, and trucks, which are embedded with old-generation HDDEs, cannot be sold. Therefore, in the HDDE case, the next-generation technology quickly and completely replaces previous-generation technology, and the follow-up HDDE gains the whole market potential previously available to the prior-generation technology. Generally, however, the past-generation technology coexists with the next-generation technology in the contemporary market as long as the two technologies are able to retain customers.
For instance, a mobile phone is a next-generation technology that incorporates all of the functions of a pager. Although mobile phones have been wildly popular for almost 30 years, pagers are still used by people who have a specific purpose for the device. The HDDE is a special case because early studies have not considered a shift in technology generations motivated by regulatory policy, but rather reflected consumer choice, producer choice, or production cost, and have not considered a complete shift in technological generation due to regulation within one year, at the longest.
Additionally, the “effects of expectations for next-generation products” are derived by promulgating emission regulations on the HDDEs. The plan for an emission regulation is issued at least two or three years before the regulation is enforced by the government. Note that emission regulations imposed by the government provides customers with two pieces of important information. The first piece of information is the approximate release date of vehicles equipped with the new HDDE, and the second piece of information is that such vehicles have higher fuel efficiency and engine performance because toxic substances, specifically exhaust gas, are reduced, which is closely related to the combustion efficiency of the HDDE.
As the next-generation model becomes more attractive, consumers may postpone their purchase of old-generation HDDE vehicles, if possible, such that they may purchase the new models. Thus, the potential consumer expectation for the next-generation model affects the purchasing decision for the old model even before the next-generation model is released. Actually, this phenomenon is not limited to the diesel engine market, but can also often be observed in other areas. For instance, sales of older-model products dramatically decreased as the release date of the new iPhone neared; consumers delayed their purchases because of the pending release of a next-generation product. However, earlier studies have not considered the possibility of decreased demand for older-generation technology due to this phenomenon.
From this perspective, S i ( t ) is defined as a company’s i-th generation sales at time t as follows.
S i ( t ) = S i ( t ) MS i ( 1 R i ( t ) )
R i ( t ) = { 0 [ ( t φ i ) ( T i φ i ) ] δ i 1   t < φ i , φ i t T i ,   δ i > 1 , t > T i ,
where:
  • R i ( t ) is the fraction of the ultimate potential of the i-th generation technology that has decreased due to the attraction of the (i + 1)-th generation technology at time t before the (i + 1)-th generation technology release date;
  • φ i is the quarter in which news of the regulation requiring the (i + 1)-th generation technology is released;
  • T i is the phase-out quarter of the i-th generation technology due to the regulation;
  • δ i is the inverse of the degree of expected attraction of the (i + 1)-th generation technology; and
  • MS i is the market share of the company’s i-th generation product.
In Equation (6), if news of the regulation that requires the (i + 1)-th generation technology is not yet released ( t < φ i ), the modified sales amount is the same as the sales amount of the Norton and Bass model ( S i ( t ) = S i ( t ) ). When the i-th generation HDDE is phased out by the emission regulations ( t > T i ), the modified sales amount is zero ( S i ( t ) = 0 ). The anticipation of the (i + 1)-th generation technology can also influence the demand for the i-th generation technology. Therefore, the sales of the i-th generation HDDE decreases until such sales are suspended by the HDDE emission regulation ( φ i t T i ). As the release date of the next-generation HDDE approaches, the trend increasingly factors in. Additionally, if the attraction of the (i + 1)-th generation technology (k, 0 < k < 1) is high, δ i   ( = 1 / k ) is close to 1 and R i ( t ) has a high value.
The individual engine maker’s market share, MS i , was also considered and was found to suitably explain the expected amount of demand. Many prior studies of the technology diffusion model have considered company activities from the point of view of competition among various brands [28,40,41,42,43]. However, Korea has an oligopolistic market for HDDEs, where a few large corporations dominate the supply and competition using temporary sales promotions does not overthrow opponents. That is why large companies in an oligopolistic market compete strictly on market share. Thus, it was determined that there is no need to reflect the acute tension of the competition among HDDE companies for market share and to use the average market share of individual engine manufacturers.
On the other hand, companies usually apply a discount to the price of older-model products to clear the stock as the release date of a new product approaches. This type of company activity can re-attract customers who have postponed their purchases to wait for next-generation products. The final model for the company’s i-th generation sales at time t is defined as follows:
S i ( t ) = { S i ( t ) S i ( t ) + ( SD ( i 1 ) ) ( 1 G ( i 1 ) ρ ) p ( t ) S i ( t ) + ( SD i × G i ρ ) / pp t = τ i , τ i + 1 t < T i , ρ > 1 , t   i n   promotion   period ,
where:
SD i = t = τ i T i S i ( t ) MS i R i ( t )
where:
  • τ i is the time when the regulation associated with the i-th generation is imposed;
  • p ( t ) is the portion of SD i consumed at time t;
  • G i is the discount rate for the i-th generation product;
  • ρ is a sensitivity parameter of the sales price; and
  • pp is the promotion period.
To reflect the situation of re-attracting customers, the ideas of Speece and Maclachlan [12] were incorporated into the extension model. First, the sensitivity parameter for the sales price was defined as ρ . If customers are not sensitive to the sales price, ρ is greater than 1, and if customers are sensitive to the sales price, ρ is close to 1; G i ρ is the re-attraction rate of the customers who have postponed their purchases in favor of the (i + 1)-th generation HDDE. The term SD i represents the total number of customers who have postponed their purchases in order to buy the (i + 1)-th generation HDDE. Therefore, ( SD i × G i ρ ) represents the number of re-attracted customers for the i-th generation HDDE, and ( SD ( i 1 ) ) ( 1 G ( i 1 ) ρ ) represents the number of customers who transfer from the (i − 1)-th generation HDDE to the i-th generation HDDE by postponing their purchases.
The term p ( t ) represents the portion of SD i that is consumed when the (i + 1)-th generation product is available. Customers often wait for news of the market reaction to a new product, as there is frequent coverage of the new product’s reliability and performance when it is first released in the market. Thus, the initial p ( t ) would be typically low but would increase quickly due to the effect of the regulations. These characteristics of the HDDE market, namely a quick and complete shift of technology generations, effects of expectations for new-generation products, company market share, and company marketing activities, are considered simultaneously in the proposed model.

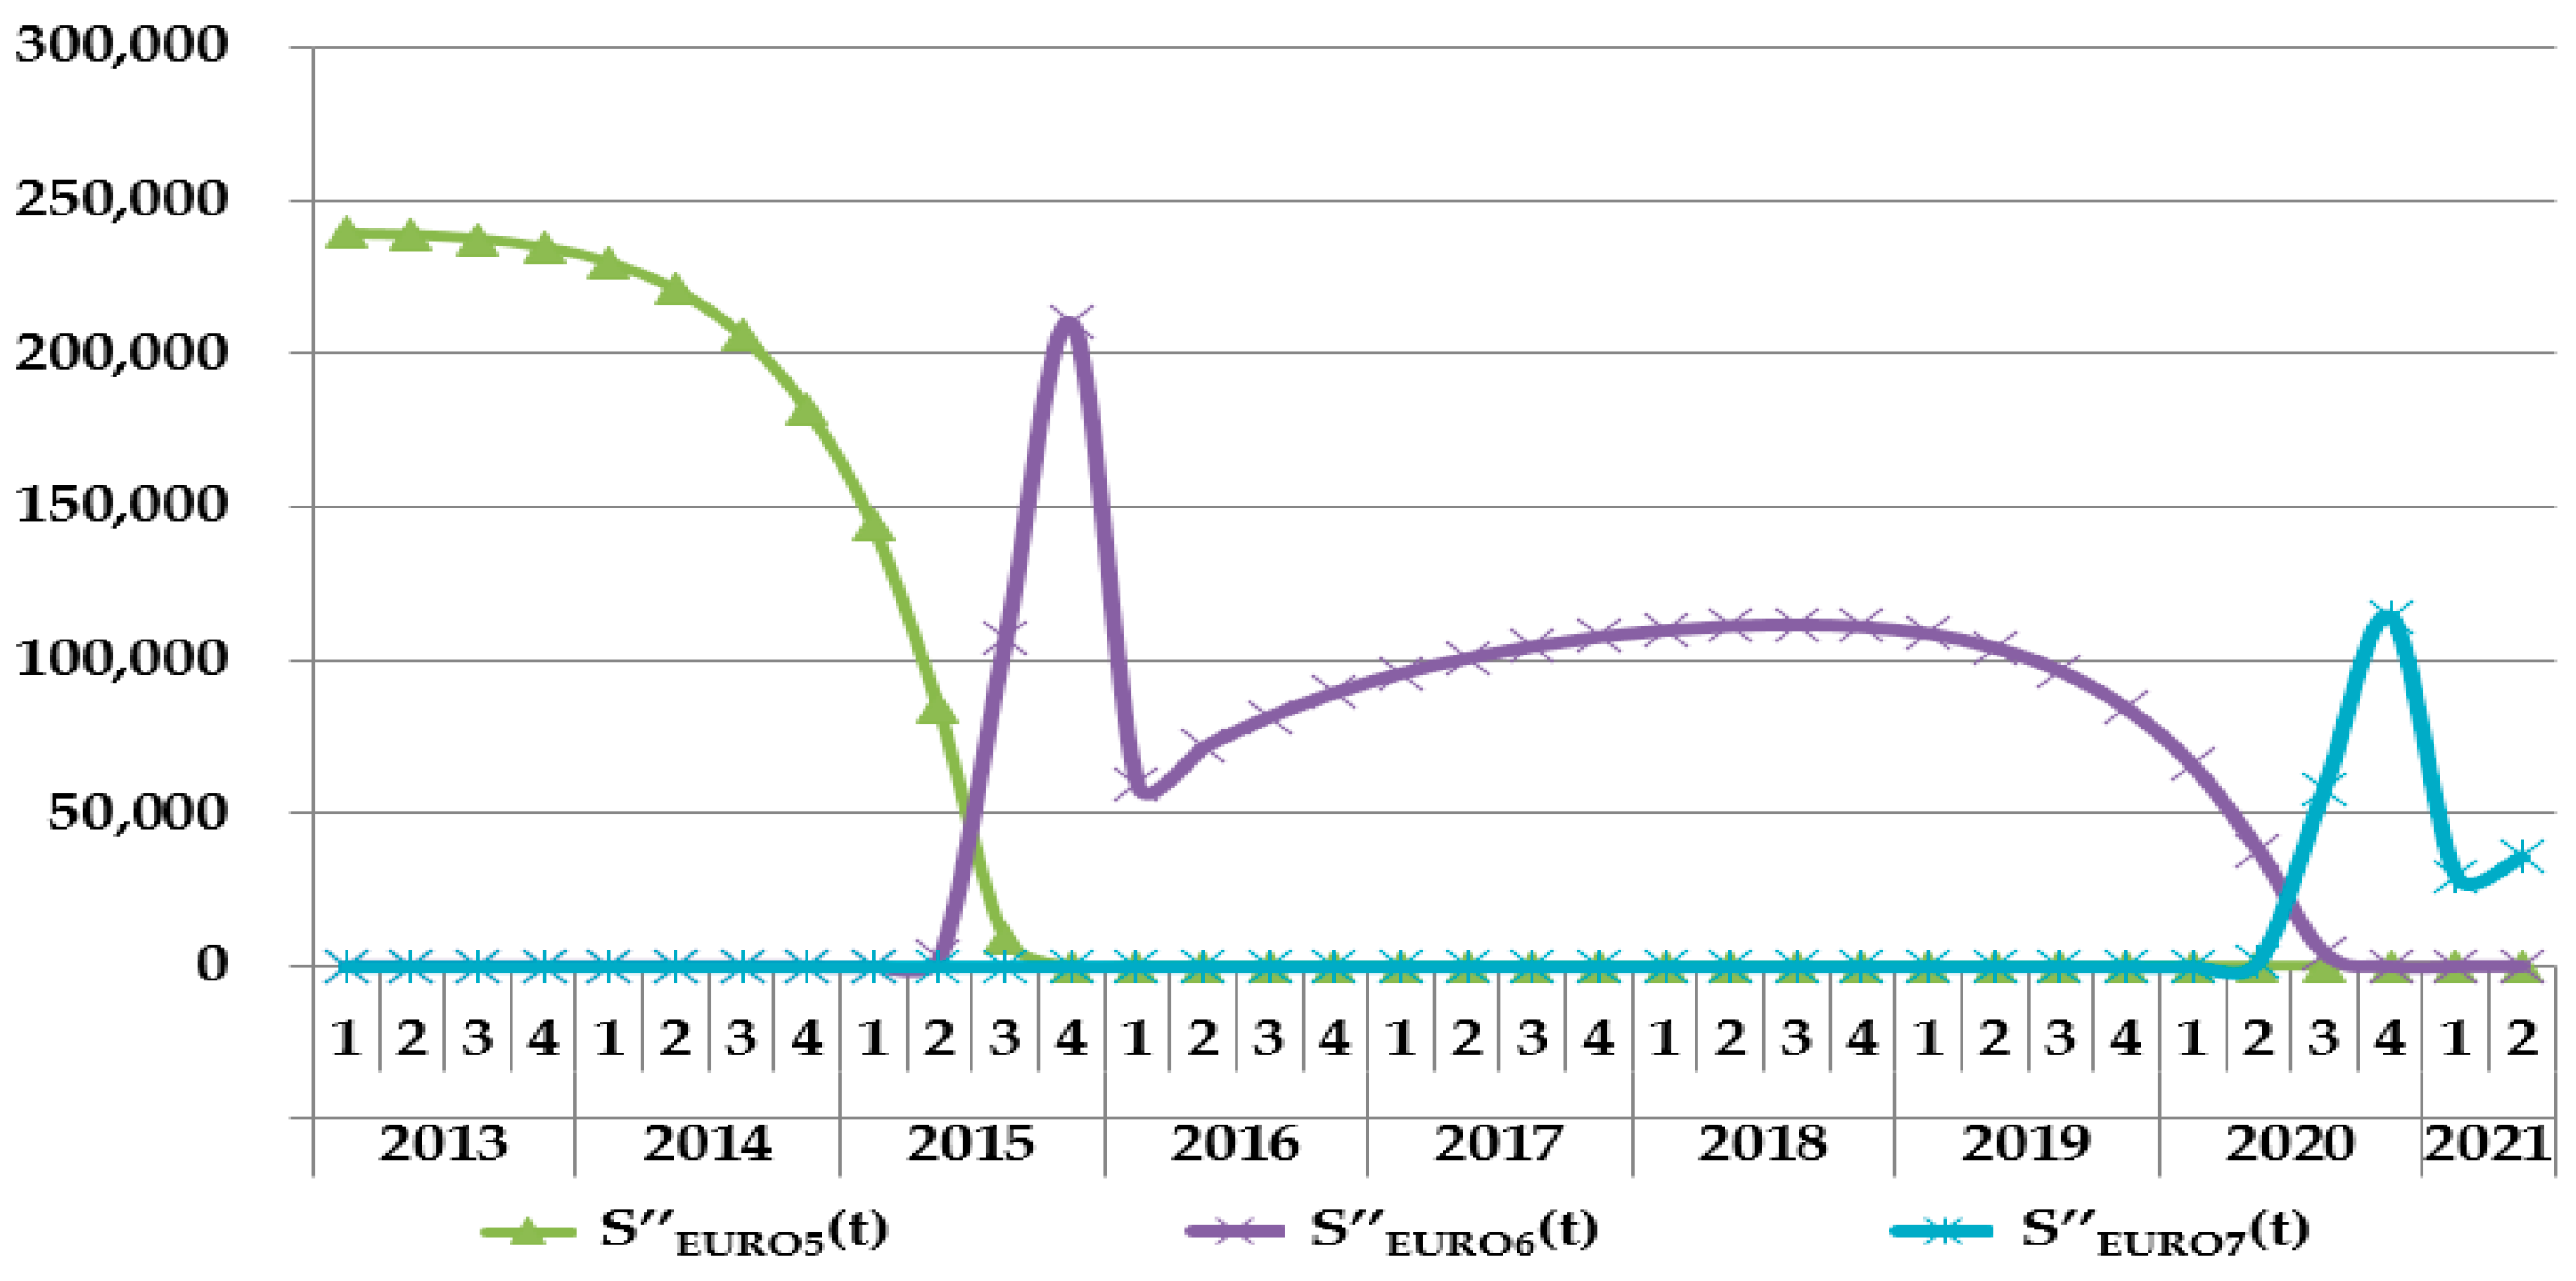
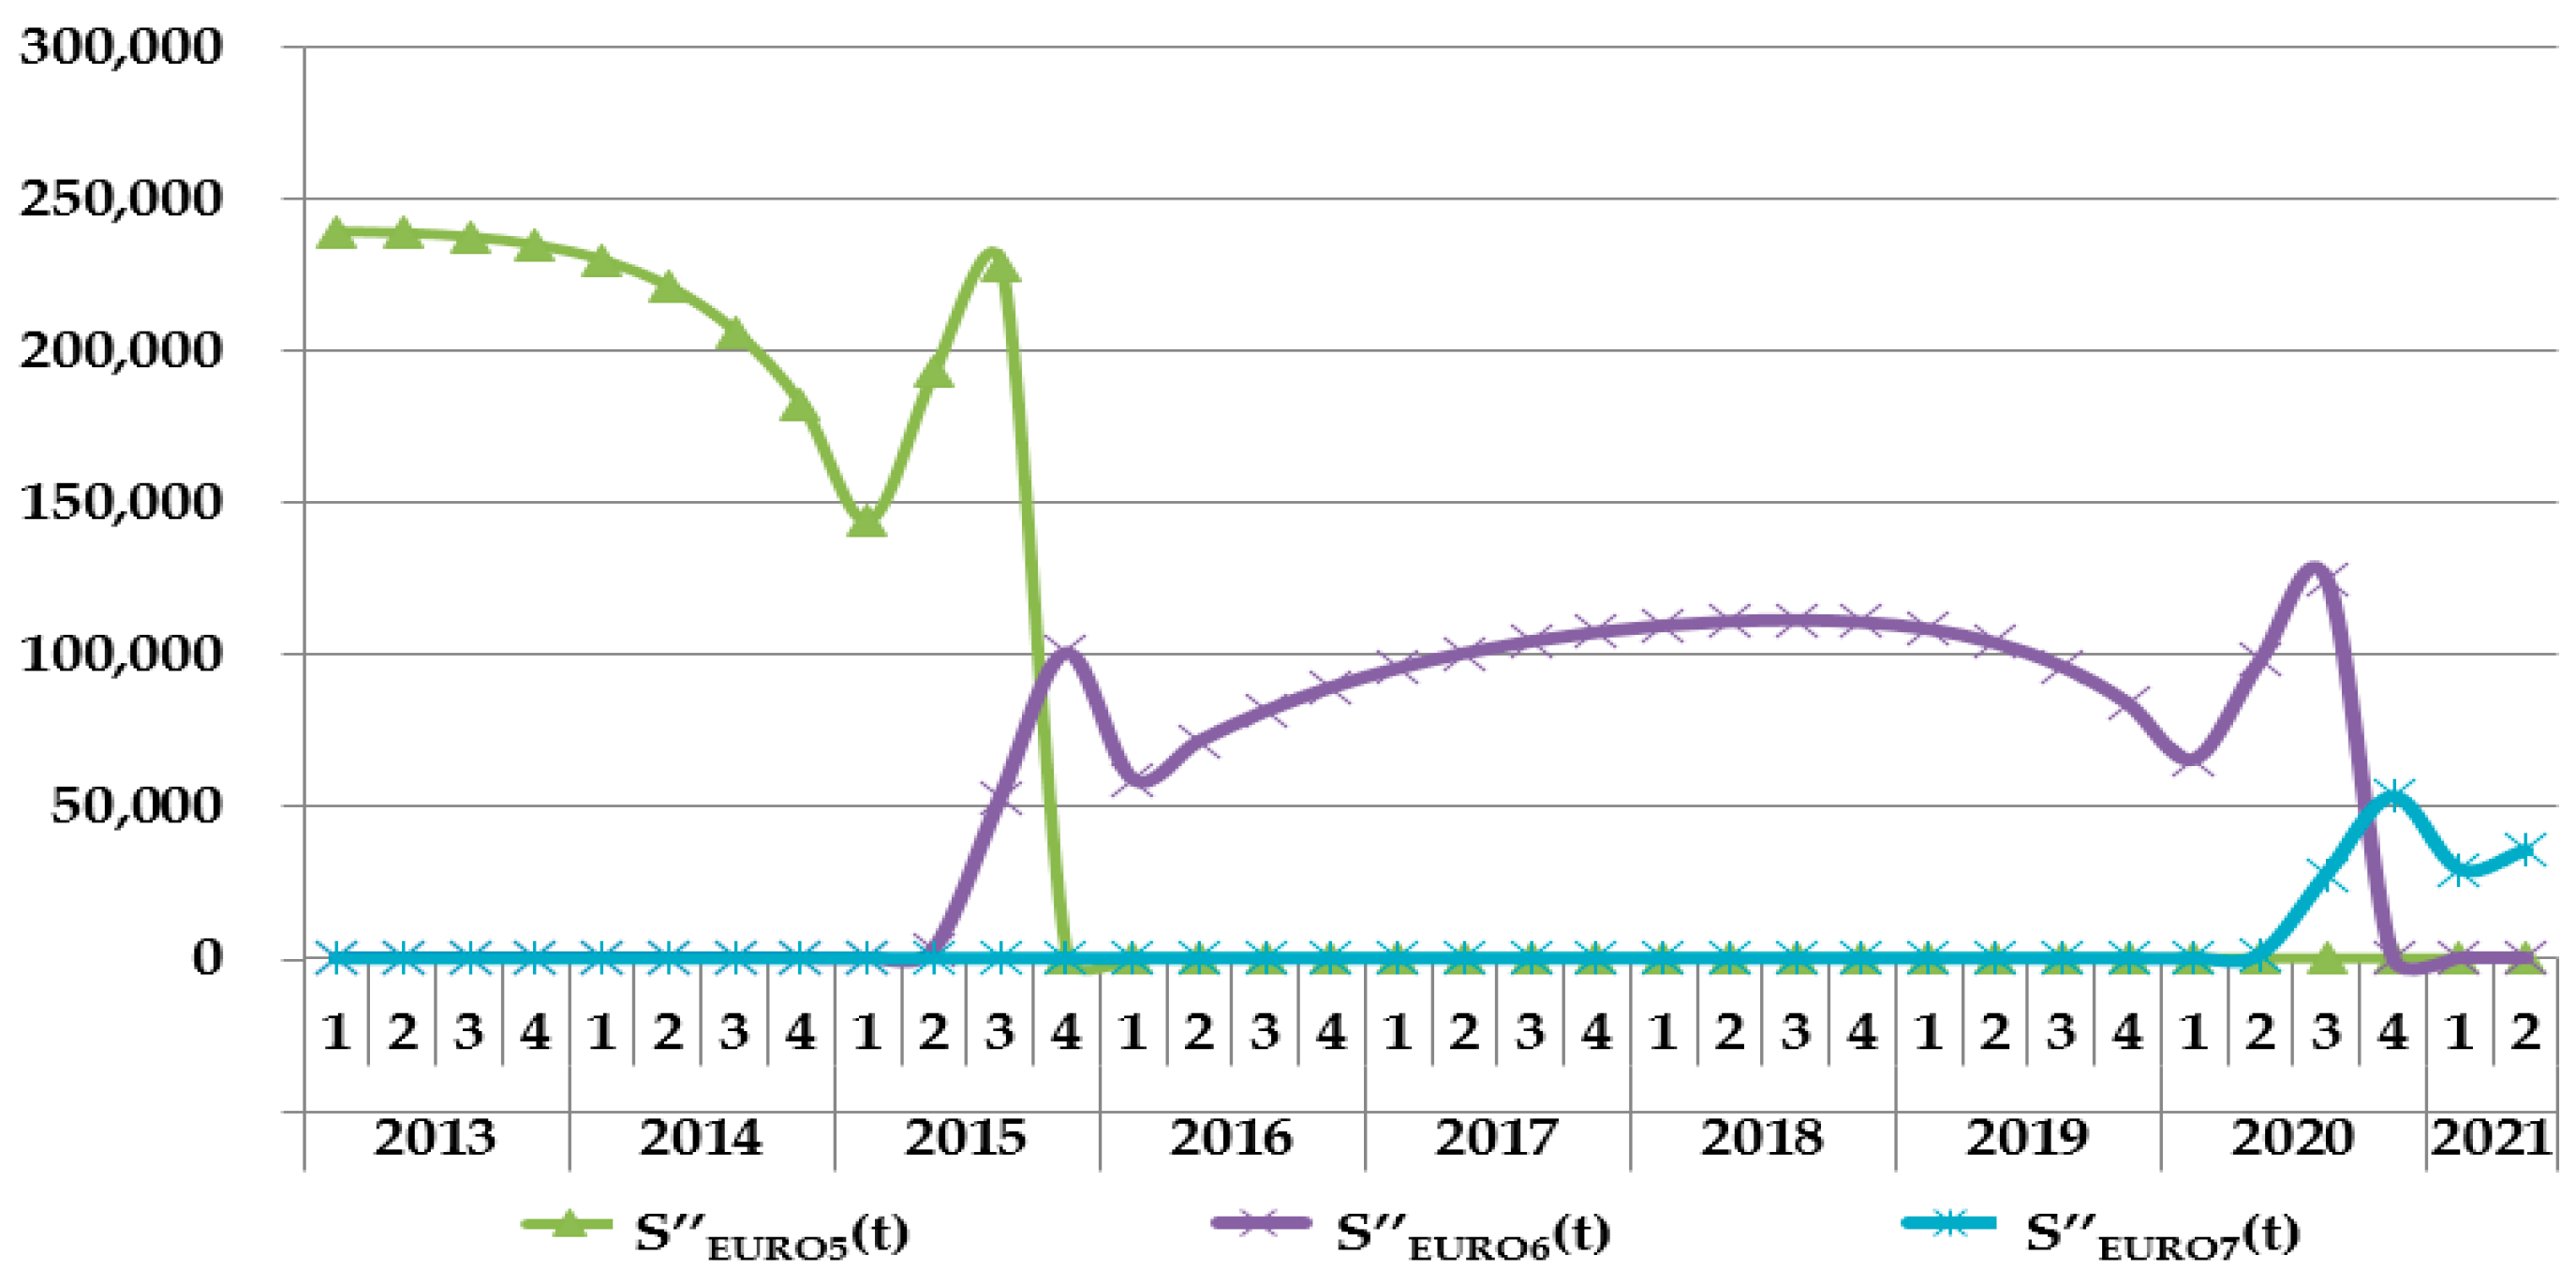
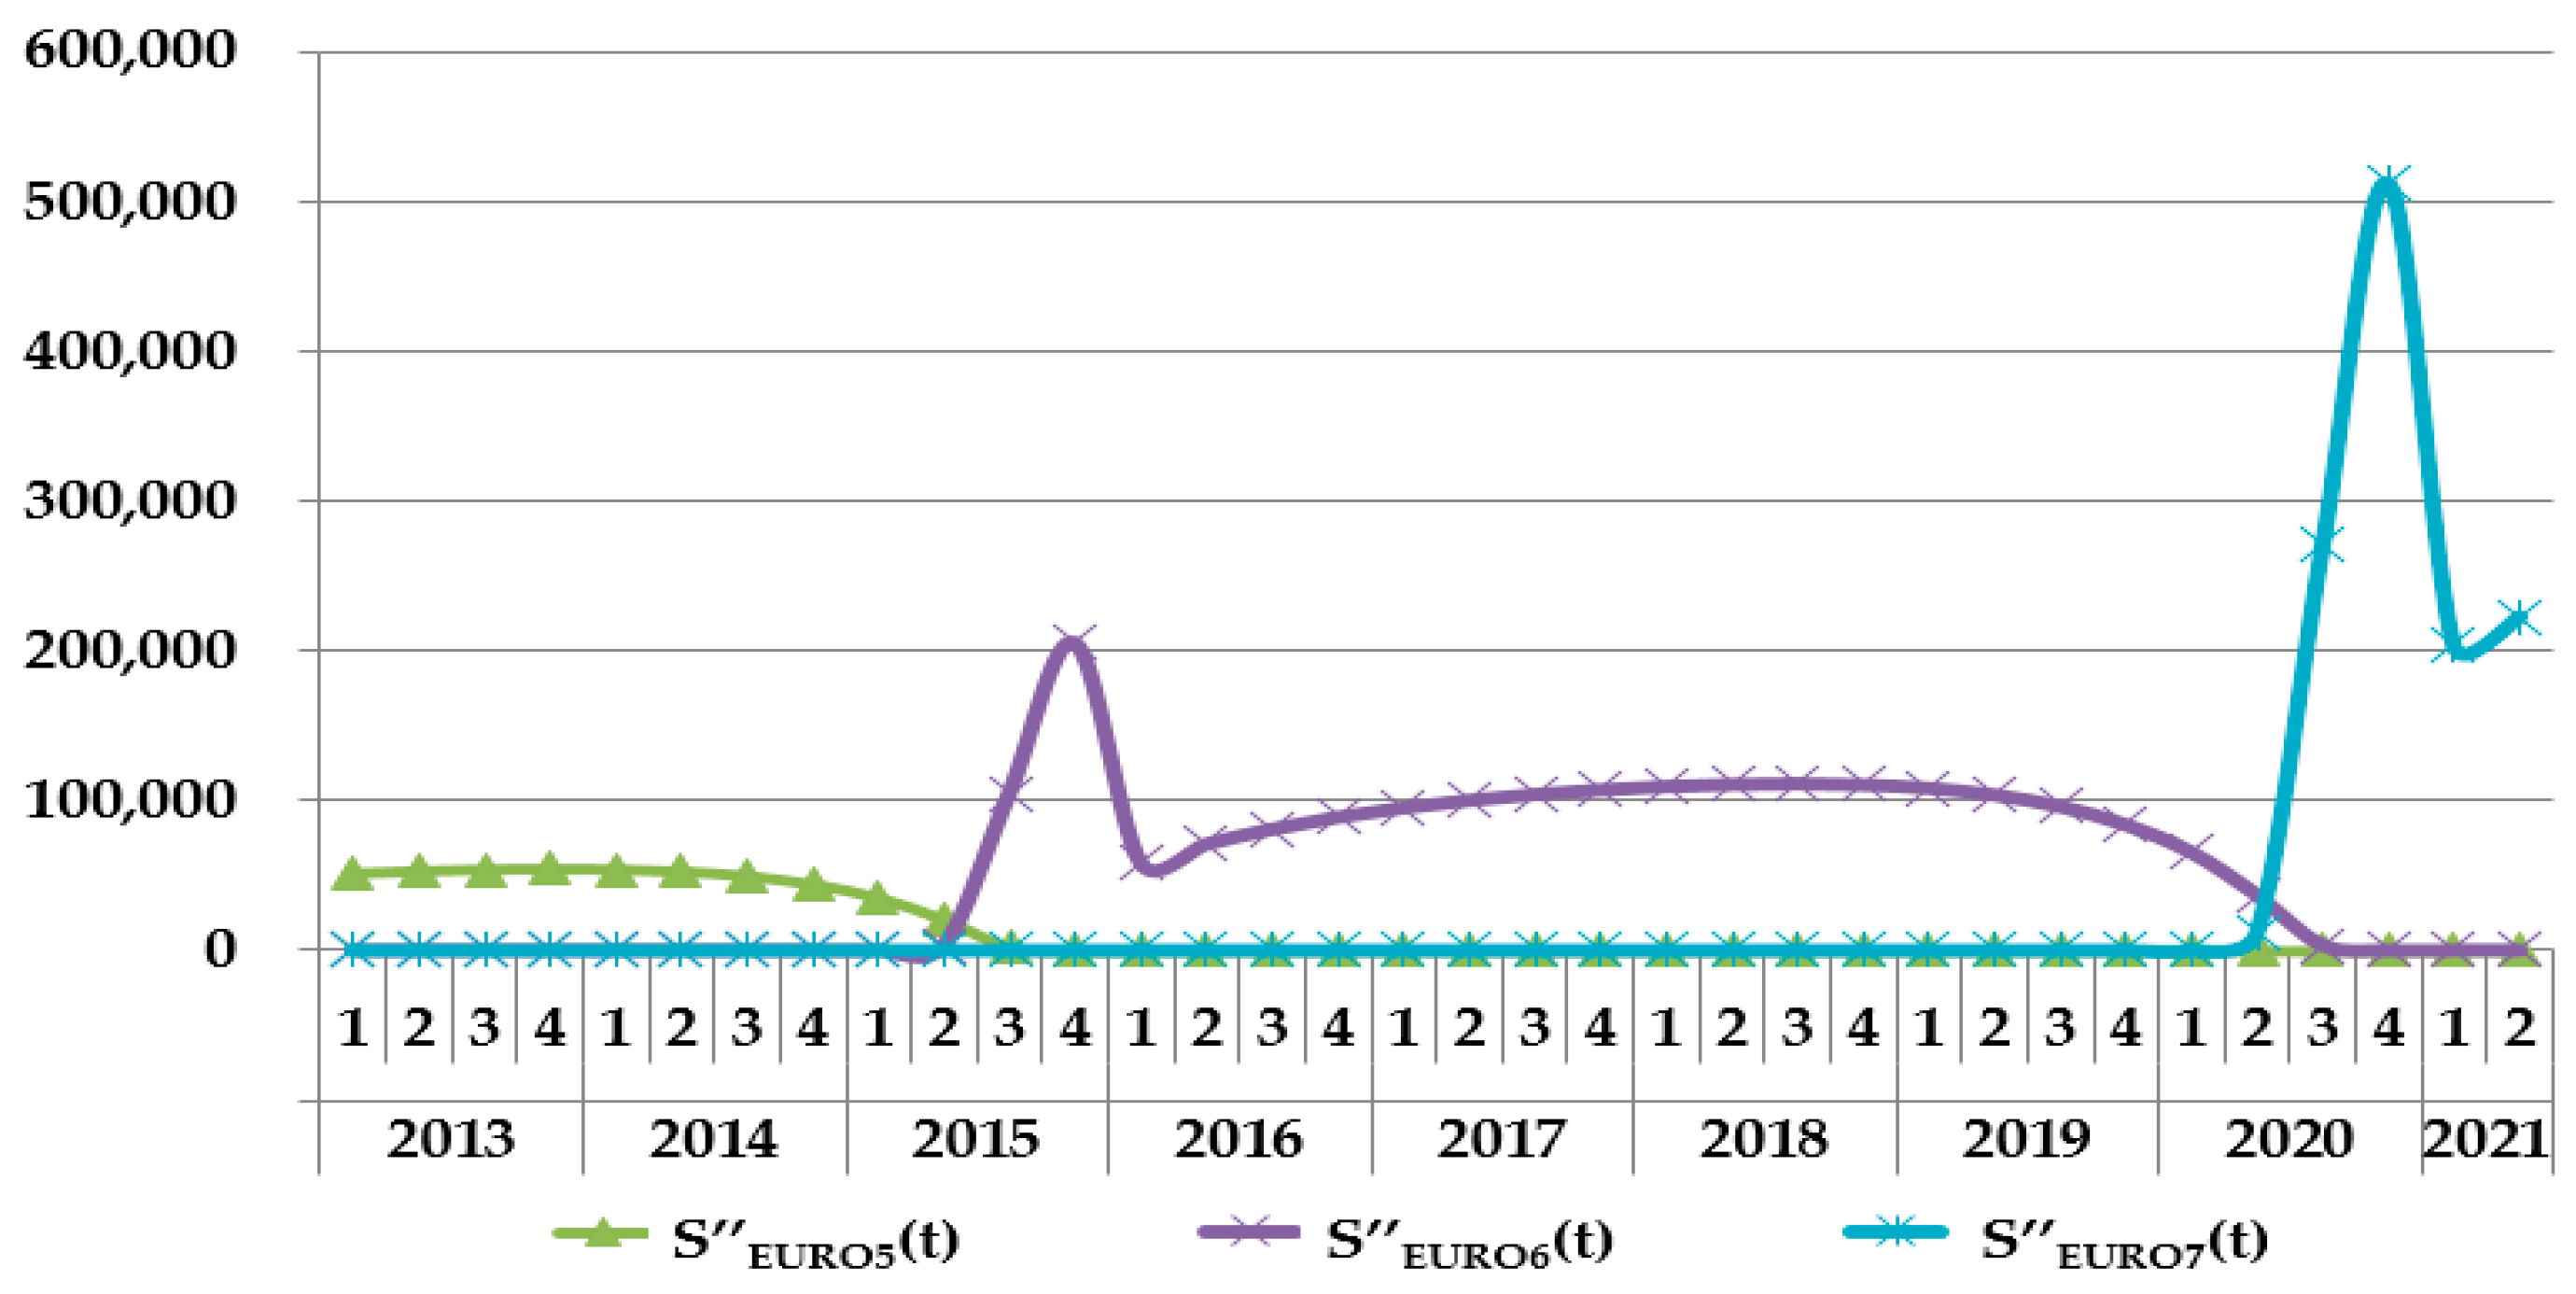
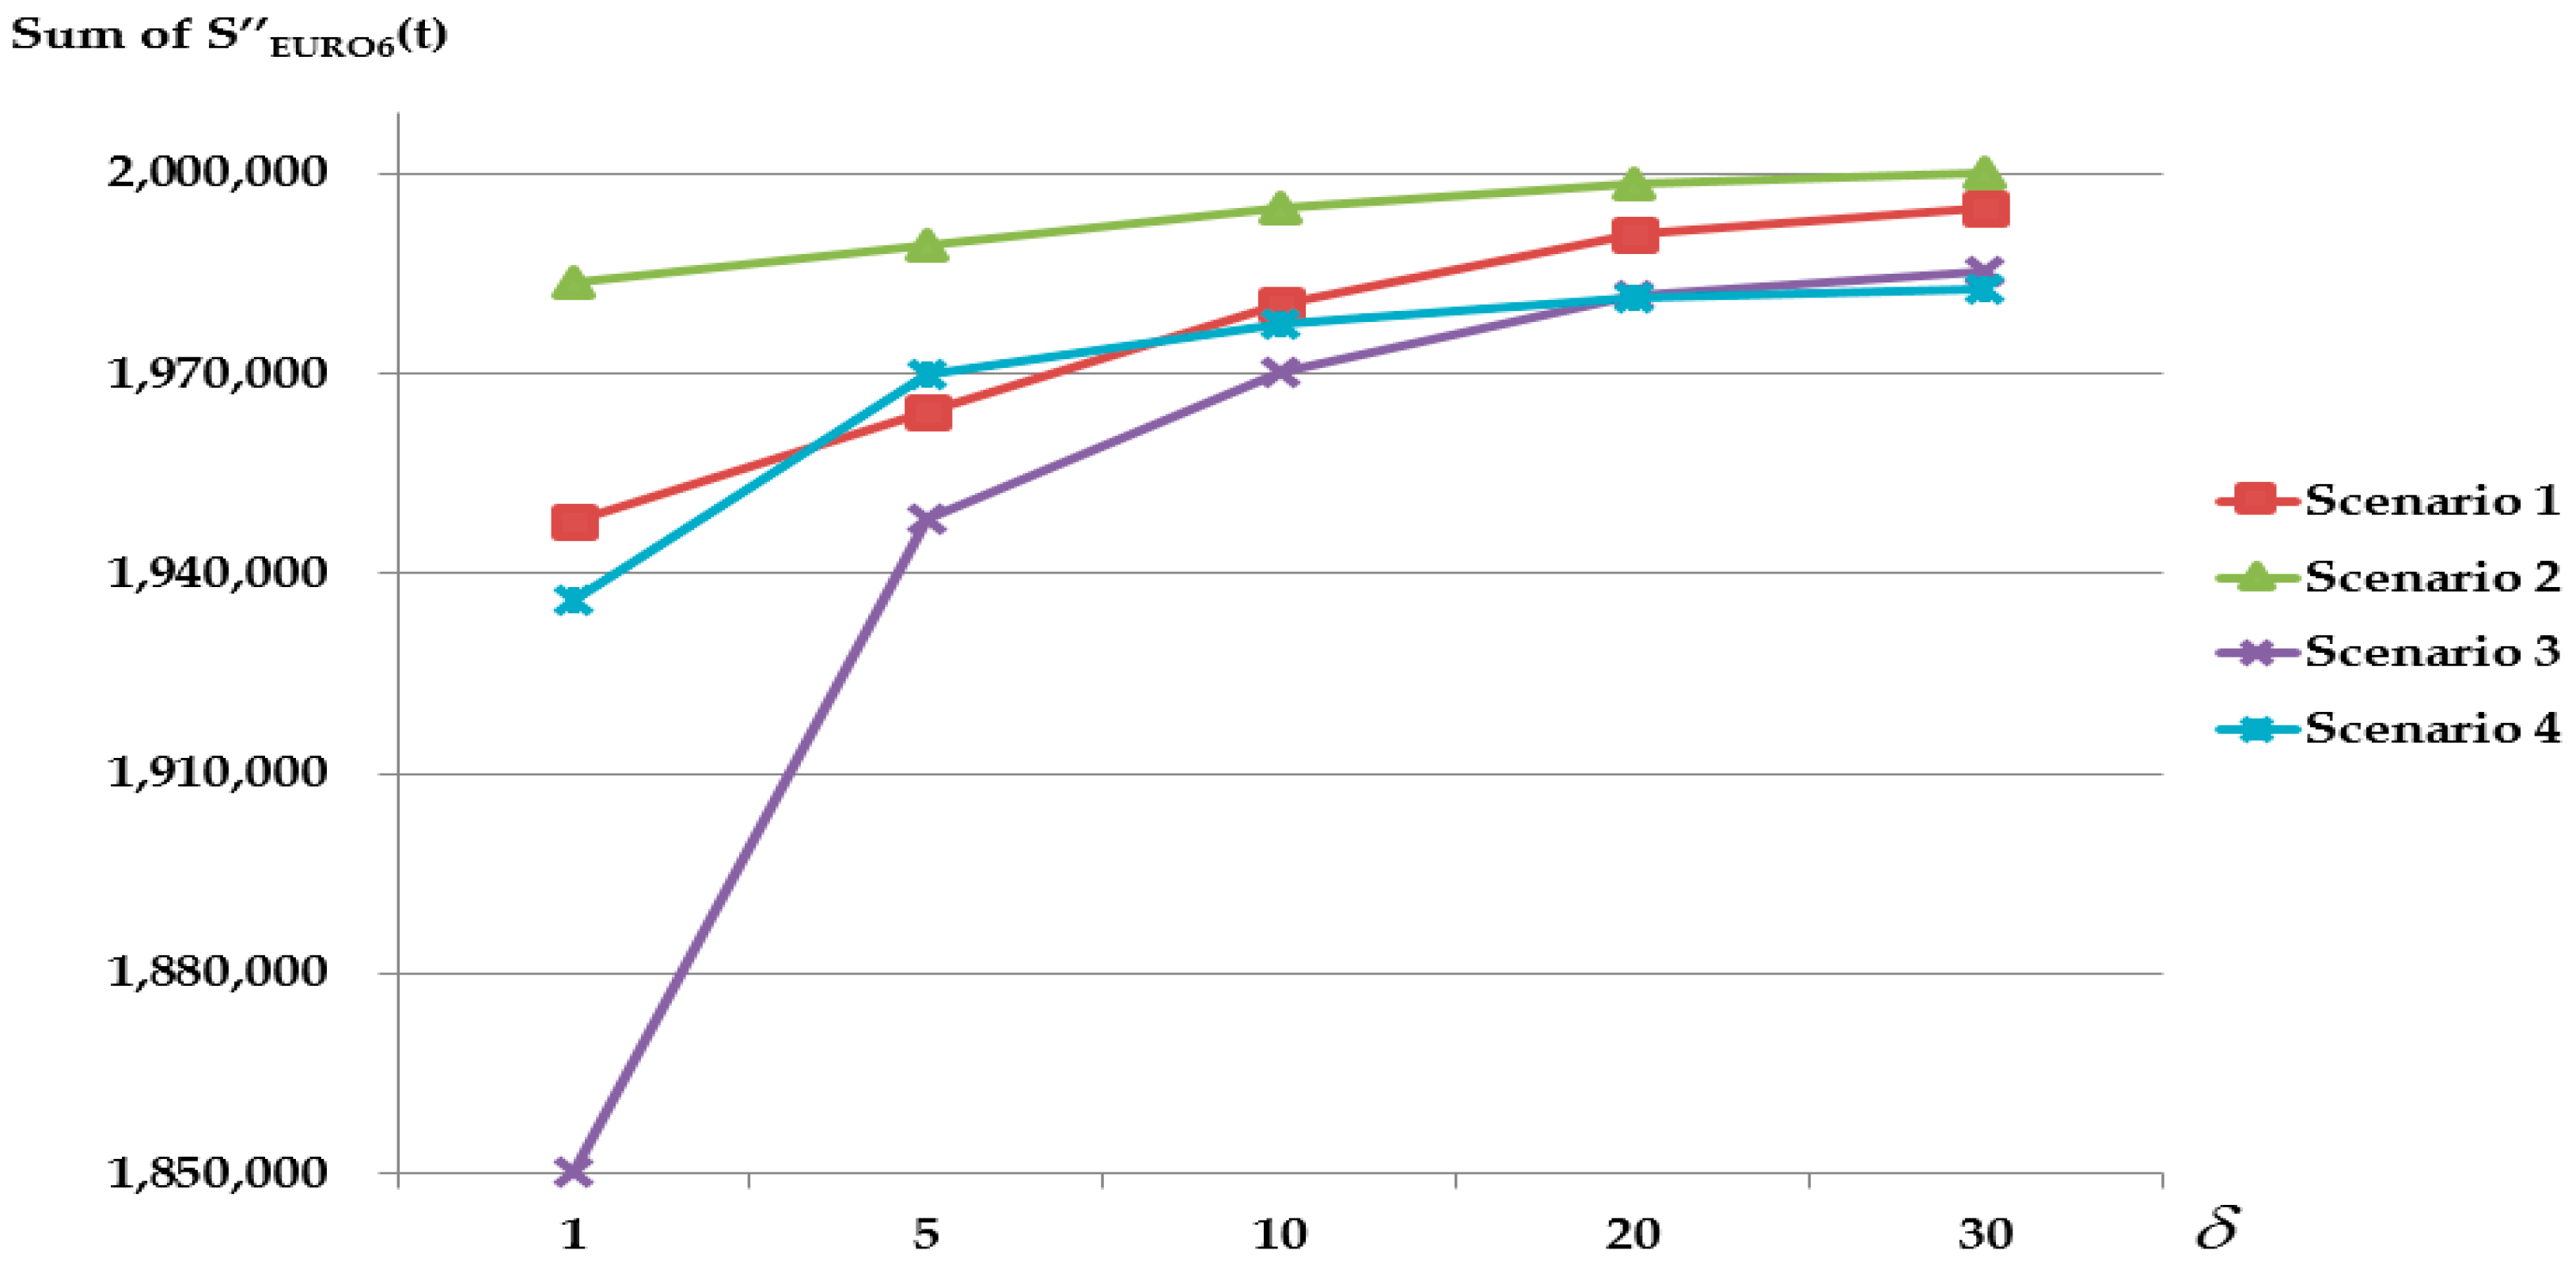
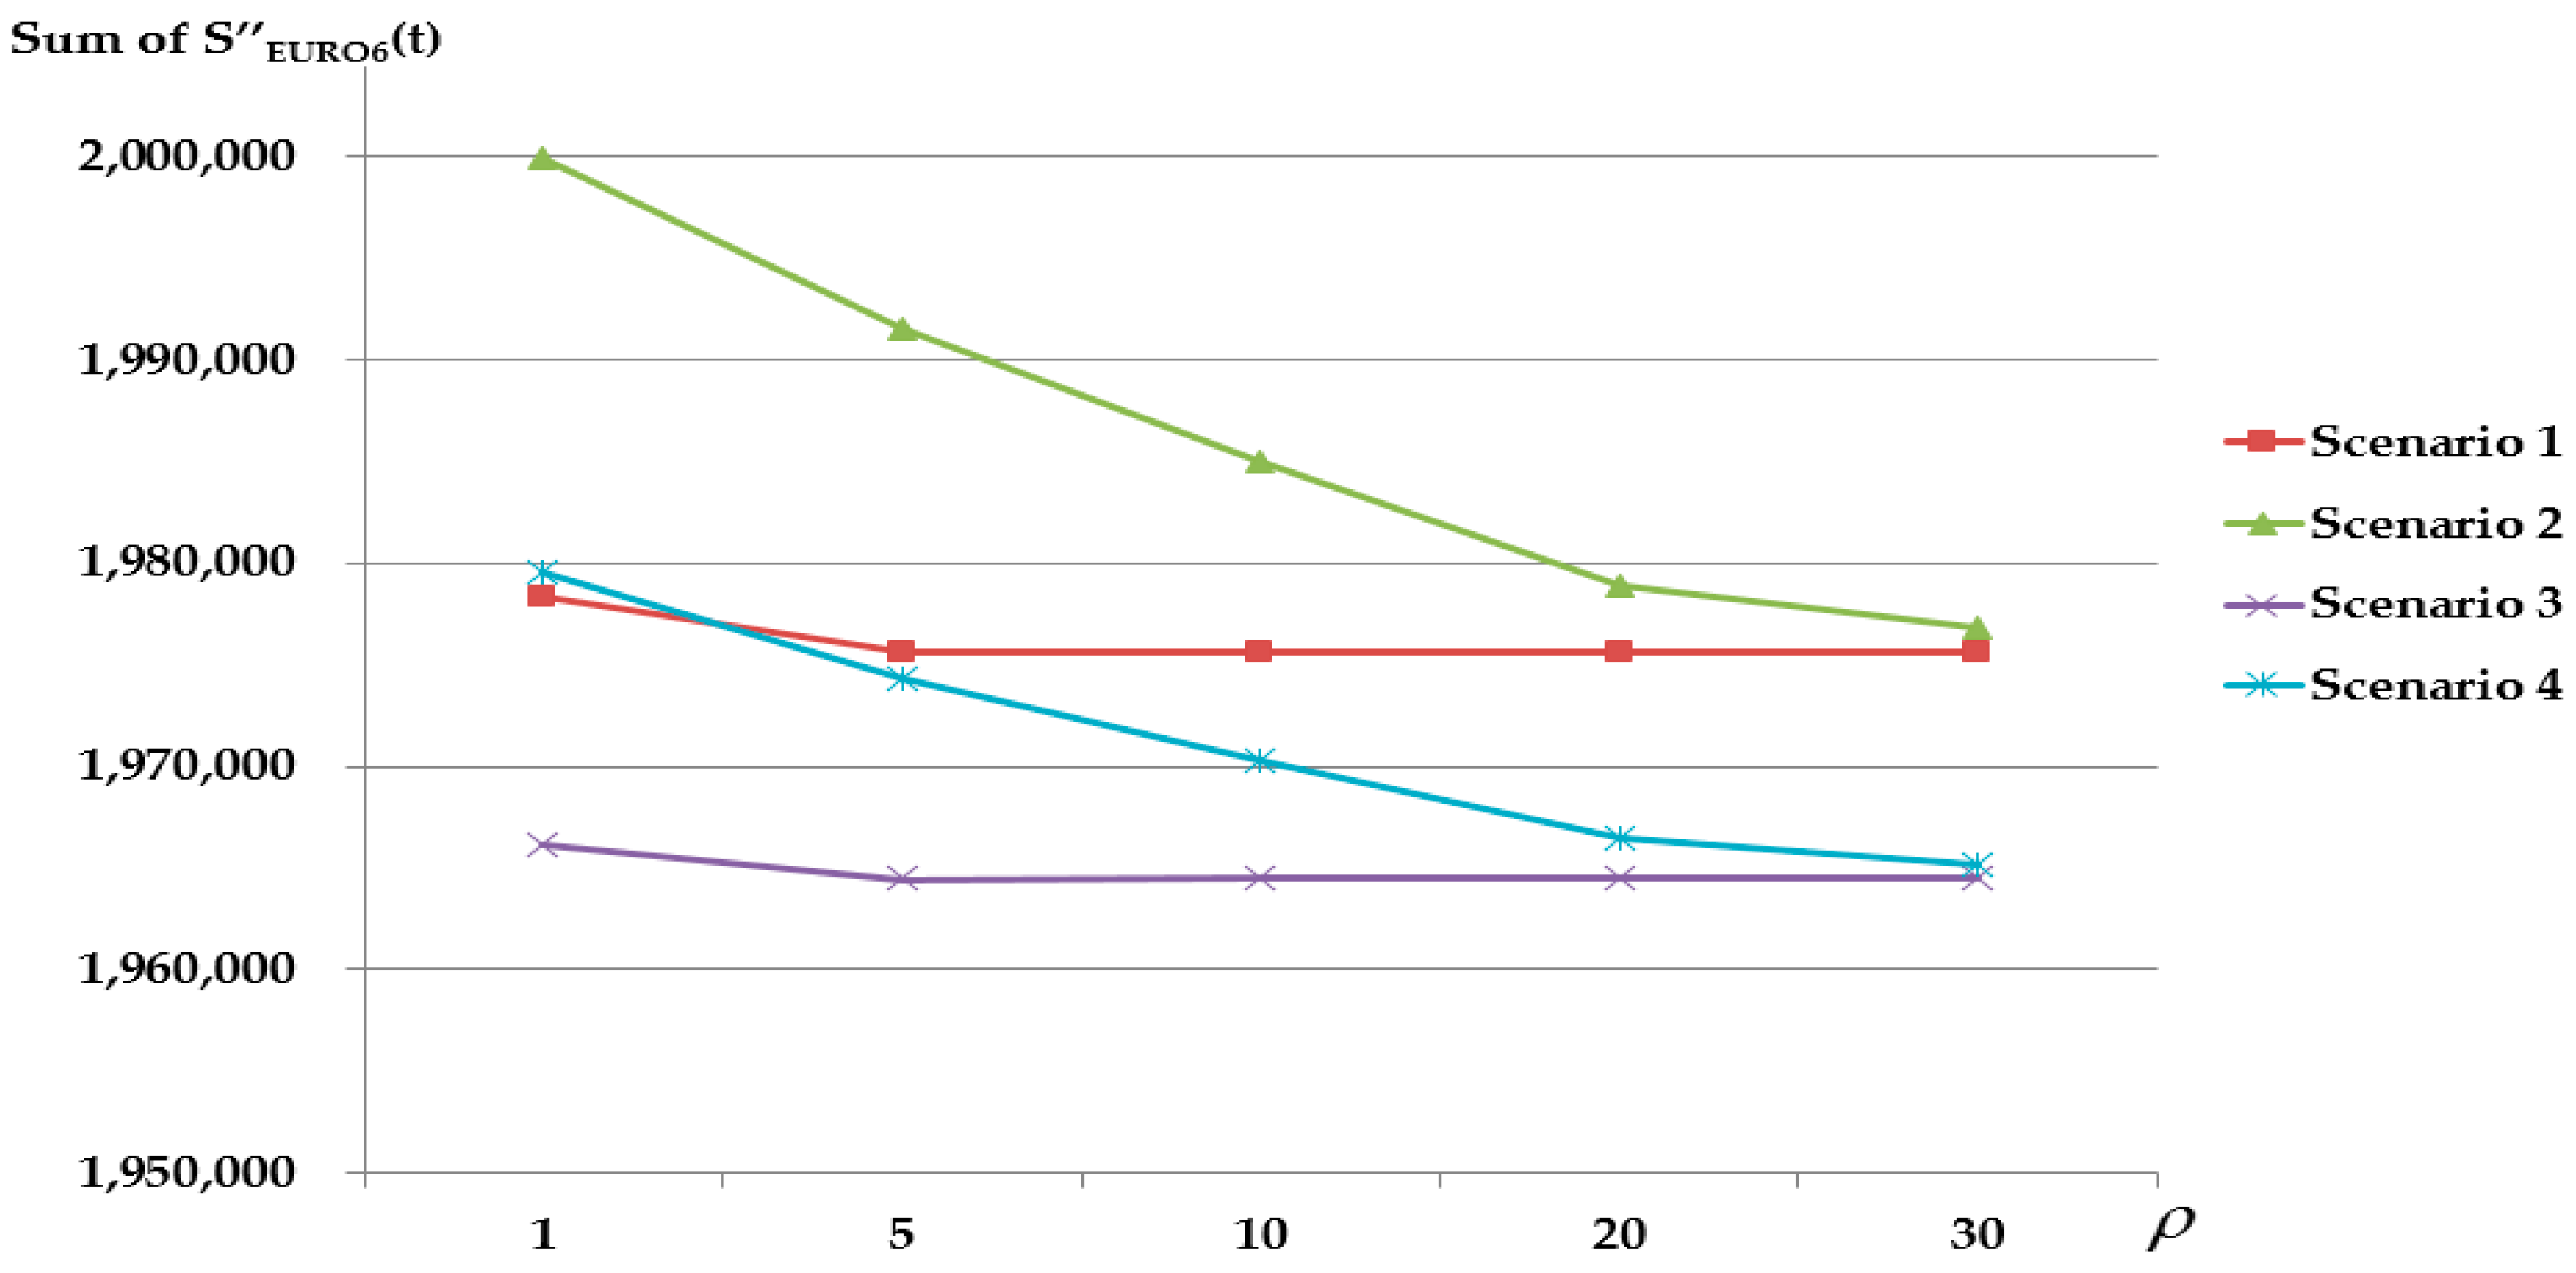
3.3. Scenario Analysis

In Section 3.1, the attraction of the (i + 1)-th generation technology and sales promotion for the i-th generation technology were mentioned. The attraction of the (i + 1)-th generation HDDE can affect the sales of the i-th generation HDDE, whereas the sales promotion of the i-th generation HDDE can support that of the i-th generation HDDE. As for the notation δ , or the degree of attraction of the (i + 1)-th generation technology, reflects the motivation for customers to delay the purchase of a vehicle with the i-th generation HDDE. Meanwhile, ρ , the sensitivity parameter of the sales price, affects the sales of the i-th generation HDDE owing to sales promotions.
In this section, we forecast the demand for new-generation HDDEs that will be affected by EURO 6 and EURO 7 by considering scenarios reflecting various situations of the emission regulations. To provide reasonable values for MS i , p i , q i , δ , and ρ for our scenario analysis, the proposed model was first applied to fit the quarterly HDDE sales data of Company D in Korea from 2007 to 2011 as shown in Figure 1. From Figure 1, one can see that the market share decreases as the regulations imposing the new generation progressed. This may be due to the mature HDDE market in Korea, as well as the decreased company market share.
We set p ( 2 ) = 1 , and otherwise p ( t ) = 0 to represent the situation that SD i is completely consumed in the second quarter after spending 25% to design the new product. It was assumed that the market potential in any period t of the generation was 200,000 ( m 1 = 200,000), and there was no additional market potential for the next regulation era of the 8 L HDDE ( m 1 = 200,000; m 2 = 0; m 3 = 0) in this scenario analysis owing to the mature transportation vehicles market of Korea. As shown in Figure 3, the number of registered transportation vehicles with 6 L to 15 L HDDEs was up to about 3,300,000, and changes in the registrations of transportation vehicles in the Korean market were not observable. In this study, the market size ( m 1 , m 2 , and m 3 ) was assumed based on the market situation in Korea and the sales of Company D. Therefore, to apply our proposed model to the case of other firms, the market size should be adjusted.
In addition, it was assumed that the engine manufacturer provided a 15% promotional discount during the fourth quarter of 2007 and the second quarter of 2010 until the next-generation emission regulation was enforced. Next, a generic algorithm (GA) was set up to estimate the rest of the parameters, namely MS i , p i , q i , δ , and ρ , of the proposed model in a way that minimizes the sum of squared errors (SSE). EVOLVER software (Palisade Corporation, Ithaca, NY, USA) was used to perform the GA. The mutation rate and crossover rate were set to 0.1 and 0.5, respectively. In addition, the stopping condition rate was 0.01%. The results of this estimation are shown in Figure 4.
The S EURO   3 ( t ) , S EURO   4 ( t ) , and S EURO   5 ( t ) terms are the fitted sales amounts, and RS EURO   3 ( t ) ,   RS EURO   4 ( t ) , and RS EURO   5 ( t ) are the real sales amounts from the data of Company D. The square root SSE is 362.049. Although the predicted sales quantities of EURO 3 and EURO 5 fit the actual sales data well, that of EURO 4 did not because of the economic crisis in 2008 and the company’s product quality problems. The coefficient of innovation of the i-th generation, p i , was high. Consumer satisfaction had a significant effect on repurchase intentions [44,45]. Therefore, there was a good chance that a series of products from the company had a group of loyal customers, and the coefficient of innovation was high. In addition, q 2 and q 3 were much lower than q 1 because Company D suffered negative publicity in the 8 L HDDE market due to serious quality problems related to EURO 4, from January 2008 to November 2009. The market share decreased significantly from 42% to 12.8% during the whole period.
For the scenario analysis, we reflected the enforcement schedules of EURO 6 (September 2015) and EURO 7 (September 2020). In addition, we set the quarter in which news of the regulation requiring the (i + 1)-th generation technology was released ( φ i ) as the time when the regulation associated with i-th generation was imposed ( τ i ), because regulations requiring i-th generation and (i + 1)-th generation technologies were released at the same time as the regulation associated with (i − 1)-th generation technology.
Two market situations were considered: (1) the company gradually lost its market share and (2) the company regained its market share. In addition, the effect of price variation on the sales of i-th and (i + 1)-th generation products were examined. For this analysis, the other parameters were fixed, as given in Table 2, except for MS i , market share, and G i , the discount rate of the i-th generation product.
Market shares were allowed to decrease in Scenario 1 and Scenario 2 as that generation evolved. In Scenario 1, the company provided a lower discount rate than in Scenario 2. Accordingly, the sales amounts, S i ( t ) , of the i-th generation HDDEs at quarter t are shown in Figure 5 (Scenario 1) and Figure 6 (Scenario 2).
Scenario 1 demonstrates that the effect of the attraction of the (i + 1)-th generation technology was larger than the effect of the promotion on the i-th generation technology. In Scenario 1, the customers who delayed the purchase of a vehicle with the i-th generation HDDE, because of the attraction of the (i + 1)-th generation technology, may have bought the new-generation HDDE vehicle at its initial release.
Scenario 2 details a situation that is opposite to that in Scenario 1. In Scenario 2, the promotion strategies effectively stopped the demand for the i-th generation HDDEs from transferring to that for the (i + 1)-th generation HDDEs. Market shares were allowed to increase in Scenario 3 and Scenario 4 as the generation evolved. In Scenario 1 and Scenario 3, the company provided a lower discount rate than in Scenario 2 and Scenario 4, and the resulting sales amount, S i ( t ) , of the i-th generation HDDEs at quarter t is shown in Figure 7 and Figure 8 for Scenario 3 and Scenario 4, respectively.
The relationship between Scenario 3 and Scenario 4 is similar to the difference between Scenario 1 and Scenario 2 in terms of the effect of the discount rate. However, there is a very important point for discussion. The total sales for the whole generation are about 6,435,052 in Scenario 1 and about 6,689,761 in Scenario 2, which means that the aggressive promotion using steep discount rates can increase the overall sales in the situation of decreasing market share. However, in the situation of increasing market share, it is a different story. The total sales for the whole generation are about 6,750,068 in Scenario 3 and about 6,498,678 in Scenario 4. Aggressive promotion using high discount rates might decrease the total sales.
In every scenario, the same coefficient for degree of attraction was used for the next-generation technology and the sensitivity parameter of the sales price (δ = 8; ρ = 4). A sensitivity analysis was conducted to examine the effect of changes in δ and ρ on sales amounts. The total sales of the second-generation technology, which are affected by EURO 6, were computed for the four scenarios.
Similar results were obtained for all scenarios in the sensitivity analysis for δ , which is displayed in Figure 9. As δ increases, R i ( t ) decreases ( 0 < ( t φ i ) ( T i φ i ) < 1 , δ > 1 ) , and accordingly the total sales of the second-generation technology increase. That is, if the attraction of next-generation technology decreases, then the total sales of the current-generation technology increase. In particular, Scenario 3 and Scenario4, in the situation of increasing market share, showed a steeper increase in the sensitivity analysis with respect to the attraction coefficient of the next-generation technology. When δ is close to 1, there is a large difference among the total sales of the scenarios. If the degree of attraction of next-generation technology is high, the high promotion discount rate is an effective strategy to re-attract customers who have postponed the purchase of current-generation technology to wait for the next-generation technology, especially when the next-generation technology’s market share increases.
In the sensitivity analysis for ρ which is displayed in Figure 10, Scenario 2 and Scenario 4, which have a high discount rate ( G i = 0.90), showed a steeper decline in the sensitivity analysis with respect to the sensitivity parameter of the sales price. As ρ increases, G i ρ decreases ( 0 < G i < 1 , ρ > 1 ) . When the customers are very sensitive to the sales price (ρ is close to 1), the promotional discount strategy helps increase the sales of current-generation technology.

4. Conclusions

We proposed a new demand forecasting model that can consider external regulations set by government entities in the HDDE market. Many conditions reflecting the specific environment of the HDDE market were considered in the proposed model. Primarily, the new model accommodates a shift in technology generation that was preceded by strong outside influences in the HDDE market, such as emission regulations imposed by the government. This kind of unique feature has not been covered in existing technology diffusion models. In prior research, consumer choice was considered as the primary factor of the acceptance of an innovative technology. The new proposed model reflects the facts that the period of shifts in technology generation can be very short and that the demand for the next-generation technology overtakes that of the old-generation technology immediately after the emission regulations are enforced.
Additionally, the effect of the anticipation of the next-generation technology on the purchase intention of customers is included in our proposed model. The attractive next-generation product can decrease customer motivation to purchase the older-generation product. Therefore, the new proposed model, unlike previous models, includes the declining sales of the older-generation product even before the next-generation product is released, and the next-generation product describes the initially high peak of demand. Such situations may not be exclusive to the HDDE market. The proposed model may provide a more effective expectation of performance in cases for which there are external market restrictions or where customers have high expectations of the next-generation product.
The demand for the old-generation product decreases as the quarter when the next-generation product will be released approaches. Therefore, companies can utilize sales promotions for stock clearance. The level of the sales promotion is determined by the price sensitivity. Consumers are susceptible to changes in product prices on items that have a high price elasticity of demand. In addition, a promotional discount strategy is effective in cases (1) when the degree of attraction of the next-generation technology is high and (2) when the market share of the corresponding technology increases. Therefore, the new model is useful to forecast demand for products that have a high price elasticity of demand. Finally, the market share of a company was also considered in the model, and it was proposed that the model considers all of the aforementioned conditions.
The market environment can also be considered for the demand forecasting of a company. Aspects of the market environment, such as market tendency, business fluctuations, and media coverage, both positive and negative, can affect the purchase tendencies of customers in the market. The purchase tendencies of construction companies, which are the primary purchasers of construction heavy equipment, can be easily impacted by fluctuations in the construction market. Just as HDDEs may be affected by the construction market, the transportation and passenger vehicle sector may have products that are influenced by multifarious market tendencies. Therefore, the correlation between each market environment and the sales of a product needs to be elucidated prior to developing a demand forecasting model to help ensure that it is adapted for that particular market environment. When this correlation is made clear, the proposed model can be extended to forecast the demand for other products; as such, the model needs to be further examined in the context of other products and sectors.
Our study was conducted based on an oligopolistic market for HDDEs and considered the average market share of an individual engine manufacturer. The study can be replicated for various firms around the world, considering the market share of each firm and depending on the availability of the necessary data. Although we applied the proposed model to sales data from company D, it does not mean that the model can be adopted only by company D. Two unique features of the HDDE market can affect the sales not only of company D but also of other companies in the HDDE market. Therefore, our proposed model can be adopted by other companies in the HDDE market and other markets that are affected by emission regulation changes. Moreover, we used the quarterly sales data for the period 2007–2011. Had more data been available, and had we been able to use such data, higher forecasting accuracy could have been achieved. In addition, the effect of an exogenous factor, the global financial crisis in 2008, on demand for HDDEs needs to be identified. Lastly, further study is needed on the performance of diesel fuels or on the comparative performance of various diesel fuels using three-stage data envelopment analysis [46,47,48].

Acknowledgments

This work was supported by the National Research Foundation of Korea (NRF) grant funded by the Korea government (MSIP) (2016R1A2A1A05005270). This paper is a revised and expanded version of a paper entitled “Demand Forecasting of Heavy Duty Diesel Engine Technology Considering Emission Regulations” presented at the European Operations Management Association (EurOMA), Neuchatel, Switzerland, 26 June–1 July 2015.

Author Contributions

Yoon Seong Kim designed the study, outlined the methodology, conducted the scenario analysis, and wrote the manuscript. Eun Jin Han reviewed the related literature, conducted the scenario analysis, interpreted the results, and modified the manuscript. So Young Sohn implemented the research, designed the study, outlined the methodology, and helped draft the paper. All authors have read and approved the final manuscript.

Conflicts of Interest

The authors declare no conflict of interest.

References

  1. Degraeve, Z.; Koopman, G.J. Achieving air quality standards in the European Union. Oper. Res. 1998, 46, 643–654. [Google Scholar] [CrossRef]
  2. Hirota, K. Comparative studies on vehicle related policies for air pollution reduction in ten Asian countries. Sustainability 2010, 2, 145–162. [Google Scholar] [CrossRef]
  3. Sohn, S.Y.; Jeon, J.; Han, E.J. A new cost of ownership model for the acquisition of technology complying with environmental regulations. J. Clean. Prod. 2015, 100, 269–277. [Google Scholar] [CrossRef]
  4. Su, B.; Ang, B.W. Multi-region comparisons of emission performance: The structural decomposition analysis approach. Ecol. Indic. 2016, 67, 78–87. [Google Scholar] [CrossRef]
  5. Zeng, S.; Chen, J. Forecasting the Allocation Ratio of Carbon Emission Allowance Currency for 2020 and 2030 in China. Sustainability 2016, 8, 650. [Google Scholar] [CrossRef]
  6. Zeng, S.; Hu, M.; Su, B. Research on investment efficiency and policy recommendations for the culture industry of China based on a three-stage DEA. Sustainability 2016, 8, 324. [Google Scholar] [CrossRef]
  7. Chen, R.H. Effects of green operations and green innovation on firm’s environmental performance. Ind. Eng. Manag. Syst. 2014, 13, 118–128. [Google Scholar] [CrossRef]
  8. Brijesh, P.; Sreedhara, S. Exhaust emissions and its control methods in compression ignition engines: A review. Int. J. Automot. Technol. 2013, 14, 195–206. [Google Scholar] [CrossRef]
  9. Jiang, W.; Liu, J.; Liu, X. Impact of Carbon Quota Allocation Mechanism on Emissions Trading: An Agent-Based Simulation. Sustainability 2016, 8, 826. [Google Scholar] [CrossRef]
  10. Lou, G.X.; Xia, H.Y.; Zhang, J.Q.; Fan, T.J. Investment strategy of emission-reduction technology in a supply chain. Sustainability 2015, 7, 10684–10708. [Google Scholar] [CrossRef]
  11. Norton, J.A.; Bass, F.M. A Diffusion Theory Model of Adoption and Substitution for Successive Generations of High-Technology Products. Manag. Sci. 1987, 33, 1069–1086. [Google Scholar] [CrossRef]
  12. Speece, M.W.; Maclachlan, D.L. Application of a Multi-Generation Diffusion Model to Milk Container Technology. Technol. Forecast. Soc. Chang. 1995, 49, 281–295. [Google Scholar] [CrossRef]
  13. Mansfield, E. Technical Change and the Rate of Imitation. Econometrica 1961, 29, 741–766. [Google Scholar] [CrossRef]
  14. Floyd, A. A Methodology for Trend Forecasting of Figures of Merit. In Technological Forecasting for Industry and Government: Methods and Applications; Bright, J., Ed.; Prentice-Hall: Englewood Cliffs, NJ, USA, 1968; pp. 95–109. [Google Scholar]
  15. Bass, F.M. Comments on “A New Product Growth for Model Consumer Durables”: The Bass Model. Manag. Sci. 2004, 50, 1833–1840. [Google Scholar] [CrossRef]
  16. Fisher, J.C.; Pry, R.H. A Simple Substitution Model for Technological Change. Technol. Forecast. Soc. Chang. 1971, 2, 75–88. [Google Scholar] [CrossRef]
  17. Blackman, A.W. A Mathematical Model for Trend Forecasts. Technol. Forecast. Soc. Chang. 1971, 3, 441–452. [Google Scholar] [CrossRef]
  18. Sharif, M.N.; Kabir, C. A generalized model for forecasting technological substitution. Technol. Forecast. Soc. Chang. 1976, 8, 353–364. [Google Scholar] [CrossRef]
  19. Chun, S.Y.; Hahn, M. A diffusion model for products with indirect network externalities. J. Forecast. 2008, 27, 357–370. [Google Scholar] [CrossRef]
  20. Rogers, E. Diffusion of Innovations; Free Press: New York, NY, USA, 1962. [Google Scholar]
  21. Mahajan, V.; Muller, E.; Bass, F.M. New Product Diffusion Models in Marketing: A Review and Directions for Research. J. Mark. 1990, 54, 1–26. [Google Scholar] [CrossRef]
  22. Dodds, W. An Application of the Bass Model in Long-Term New Product Forecasting. J. Mark. Res. 1973, 10, 308–311. [Google Scholar] [CrossRef]
  23. Tigert, D.; Farivar, B. The Bass New Product Growth Model: A Sensitivity Analysis for a High Technology Product. J. Mark. 1981, 45, 81–90. [Google Scholar] [CrossRef]
  24. Easingwood, C.J.; Mahajan, V.; Muller, E. A Nonuniform Influence Innovation Diffusion Model of New Product Acceptance. Mark. Sci. 1983, 2, 273–295. [Google Scholar] [CrossRef]
  25. Meade, N.; Islam, T. Modelling and forecasting the diffusion of innovation—A 25-year review. Int. J. Forecast. 2006, 22, 519–545. [Google Scholar] [CrossRef]
  26. Sohn, S.Y.; Ahn, B.J. Multigeneration diffusion model for economic assessment of new technology. Technol. Forecast. Soc. Chang. 2003, 70, 251–264. [Google Scholar] [CrossRef]
  27. Islam, T.; Meade, N. The diffusion of successive generations of a technology: A more general model. Technol. Forecast. Soc. Chang. 1997, 56, 49–60. [Google Scholar] [CrossRef]
  28. Krishnan, T.V.; Bass, F.M.; Kumar, V. Impact of a Late Entrant on the Diffusion of a New Product/Service. J. Mark. Res. 2000, 37, 269–278. [Google Scholar] [CrossRef]
  29. Becker, T.A.; Sidhu, I.; Tenderich, B. Electric Vehicles in the United States: A New Model with Forecasts to 2030; Center for Entrepreneurship & Technology (CET) Technical Brief, University of California: Berkeley, CA, USA, 2009. [Google Scholar]
  30. Bass, F.M. A New Product Growth for Model Consumer Durables. Manag. Sci. 1969, 15, 215–227. [Google Scholar] [CrossRef]
  31. Lamberson, P.J. The Diffusion of Hybrid Electric Vehicles; Center for the Study of Complex Systems, University of Michigan: Ann Arbor, MI, USA, 2009. [Google Scholar]
  32. Park, S.Y.; Kim, J.W.; Lee, D.H. Development of a market penetration forecasting model for Hydrogen Fuel Cell Vehicles considering infrastructure and cost reduction effects. Energy Policy 2011, 39, 3307–3315. [Google Scholar] [CrossRef]
  33. Qian, L.; Soopramanien, D. Using diffusion models to forecast market size in emerging markets with applications to the Chinese car market. J. Bus. Res. 2014, 67, 1226–1232. [Google Scholar] [CrossRef]
  34. Qian, L.; Soopramanien, D. Incorporating heterogeneity to forecast the demand of new products in emerging markets: Green cars in China. Technol. Forecast. Soc. Chang. 2015, 91, 33–46. [Google Scholar] [CrossRef]
  35. Cummins Inc. Mobile Off-Highway Emissions: Choosing the Right Technology for TIER 4; Cummins Inc.: Columbus, IN, USA, 2009. [Google Scholar]
  36. Klimont, Z.; Cofala, J.; Schopp, W.; Amann, M.; Streets, D.G.; Ichikawa, Y.; Fujita, S. Projections of SO2, NOx, NH3 and VOC emissions in East Asia up to 2030. Water Air Soil Pollut. 2001, 130, 193–198. [Google Scholar] [CrossRef]
  37. Resitoglu, I.A.; Altinisik, K.; Keskin, A. The pollutant emissions from diesel-engine vehicles and exhaust aftertreatment systems. Clean Technol. Environ. Policy 2015, 17, 15–27. [Google Scholar] [CrossRef]
  38. Johnson, T. Diesel Emission Control in Review. SAE Int. J. Fuels Lubr. 2009, 1, 68–81. [Google Scholar] [CrossRef]
  39. Ligterink, N.; de Lange, R.; Vermeulen, R.; Dekker, H. On-Road NOx Emissions of Euro-V Trucks; Tech. Report, Report MON-RPT-033-DTS-2009-03840; TNO Science and Industry: Delft, The Netherlands, 2009. [Google Scholar]
  40. Padmanabhan, V.; Bass, F.M. Optimal pricing of successive generations of product advances. Int. J. Res. Mark. 1993, 10, 185–207. [Google Scholar] [CrossRef]
  41. Kim, J.; Lee, D.; Ahn, J. A dynamic competition analysis on the Korean mobile phone market using competitive diffusion model. Comput. Ind. Eng. 2006, 51, 174–182. [Google Scholar] [CrossRef]
  42. Zhang, C.; Song, P.; Xu, Y.; Xue, L. Understanding Dynamic Competitive Technology Diffusion in Electronic Markets, Designing E-Business Systems. Mark. Serv. Netw. 2009, 22, 14–24. [Google Scholar]
  43. Song, P.; Zhang, C.; Xu, Y.; Xue, L.; Wang, K.; Zhang, C. Asymmetric Interaction in Competitive Internet Technology Diffusion: Implications for the Competition between Local and Multinational Online Vendors. J. Glob. Inf. Manag. 2011, 19, 45–64. [Google Scholar] [CrossRef]
  44. Cronin, J.J., Jr.; Taylor, S.A. Measuring Service Quality: A Reexamination and Extension. J. Mark. 1992, 56, 55–68. [Google Scholar] [CrossRef]
  45. Anderson, E.W.; Fornell, C.; Lehmann, D.R. Customer Satisfaction, Market Share, and Profitability: Findings from Sweden. J. Mark. 1994, 58, 53–66. [Google Scholar] [CrossRef]
  46. Li, K.; Lin, B. Impact of energy conservation policies on the green productivity in China’s manufacturing sector: Evidence from a three-stage DEA model. Appl. Energy 2016, 168, 351–363. [Google Scholar] [CrossRef]
  47. Meng, F.; Su, B.; Thomson, E.; Zhou, D.; Zhou, P. Measuring China’s regional energy and carbon emission efficiency with DEA models: A survey. Appl. Energy 2016, 183, 1–21. [Google Scholar] [CrossRef]
  48. Zeng, S.; Xu, Y.; Wang, L.; Chen, J.; Li, Q. Forecasting the Allocative Efficiency of Carbon Emission Allowance Financial Assets in China at the Provincial Level in 2020. Energies 2016, 9, 329. [Google Scholar] [CrossRef]
Figure 1. Sales of 8 L HDDE for transportation vehicles made by Company D.
Sustainability 09 00166 g001
Figure 2. Sales of 8 L HDDE for excavators made by Company D.
Sustainability 09 00166 g002
Figure 3. Number of registrations for 6 L to 15 L HDDE transportation vehicles in Korea.
Sustainability 09 00166 g003
Figure 4. Estimation results.
Sustainability 09 00166 g004
Figure 5. Sales of three technology generations (Scenario 1).
Sustainability 09 00166 g005
Figure 6. Sales of three technology generations (Scenario 2).
Sustainability 09 00166 g006
Figure 7. Sales of three technology generations (Scenario 3).
Sustainability 09 00166 g007
Figure 8. Sales of three technology generations (Scenario 4).
Sustainability 09 00166 g008
Figure 9. Results of the sensitivity analysis of δ.
Sustainability 09 00166 g009
Figure 10. Results of the sensitivity analysis of ρ.
Sustainability 09 00166 g010
Table 1. Emission regulations in Korea, g/kWh.
Emission RegulationEffective PeriodNOxNMHCCOHCPM
EURO 3January 2003–December 20055.0-2.10.660.10
0.13 a
EURO 4January 2006–August 20083.5-1.50.460.02
EURO 5September 2009–December 20132.0-1.50.460.02
EURO 6January 2014–Present0.4-1.50.130.01
Tier 2 bJanuary 2005–December 2008NOx + NMHC ≤ 6.63.5-0.2
Tier 3 bJanuary 2009–December 2014NOx + NMHC ≤ 4.03.5-0.2
Tier 4 bJanuary 2015–Present0.40.193.5-0.02
a For engines of less than 0.75 dm3 swept volume per cylinder and a rated power speed of more than 3000 min−1; b Engine Power, 130 ≤ kW < 225.
Table 2. Scenario parameters.
m1p1q1MS1m2p2q2MS2m3p3q3MS3δGiρ
Scenario 1200,0000.60.50.400.30.010.200.30.010.180.104
Scenario 2200,0000.60.50.400.30.010.200.30.010.180.904
Scenario 3200,0000.30.010.100.30.010.200.60.50.480.104
Scenario 4200,0000.30.010.100.30.010.200.60.50.480.904

