
Effects of Land Use Change for Crops on Water and Carbon Budgets in the Midwest USA


Abstract
:1. Introduction
2. Methods
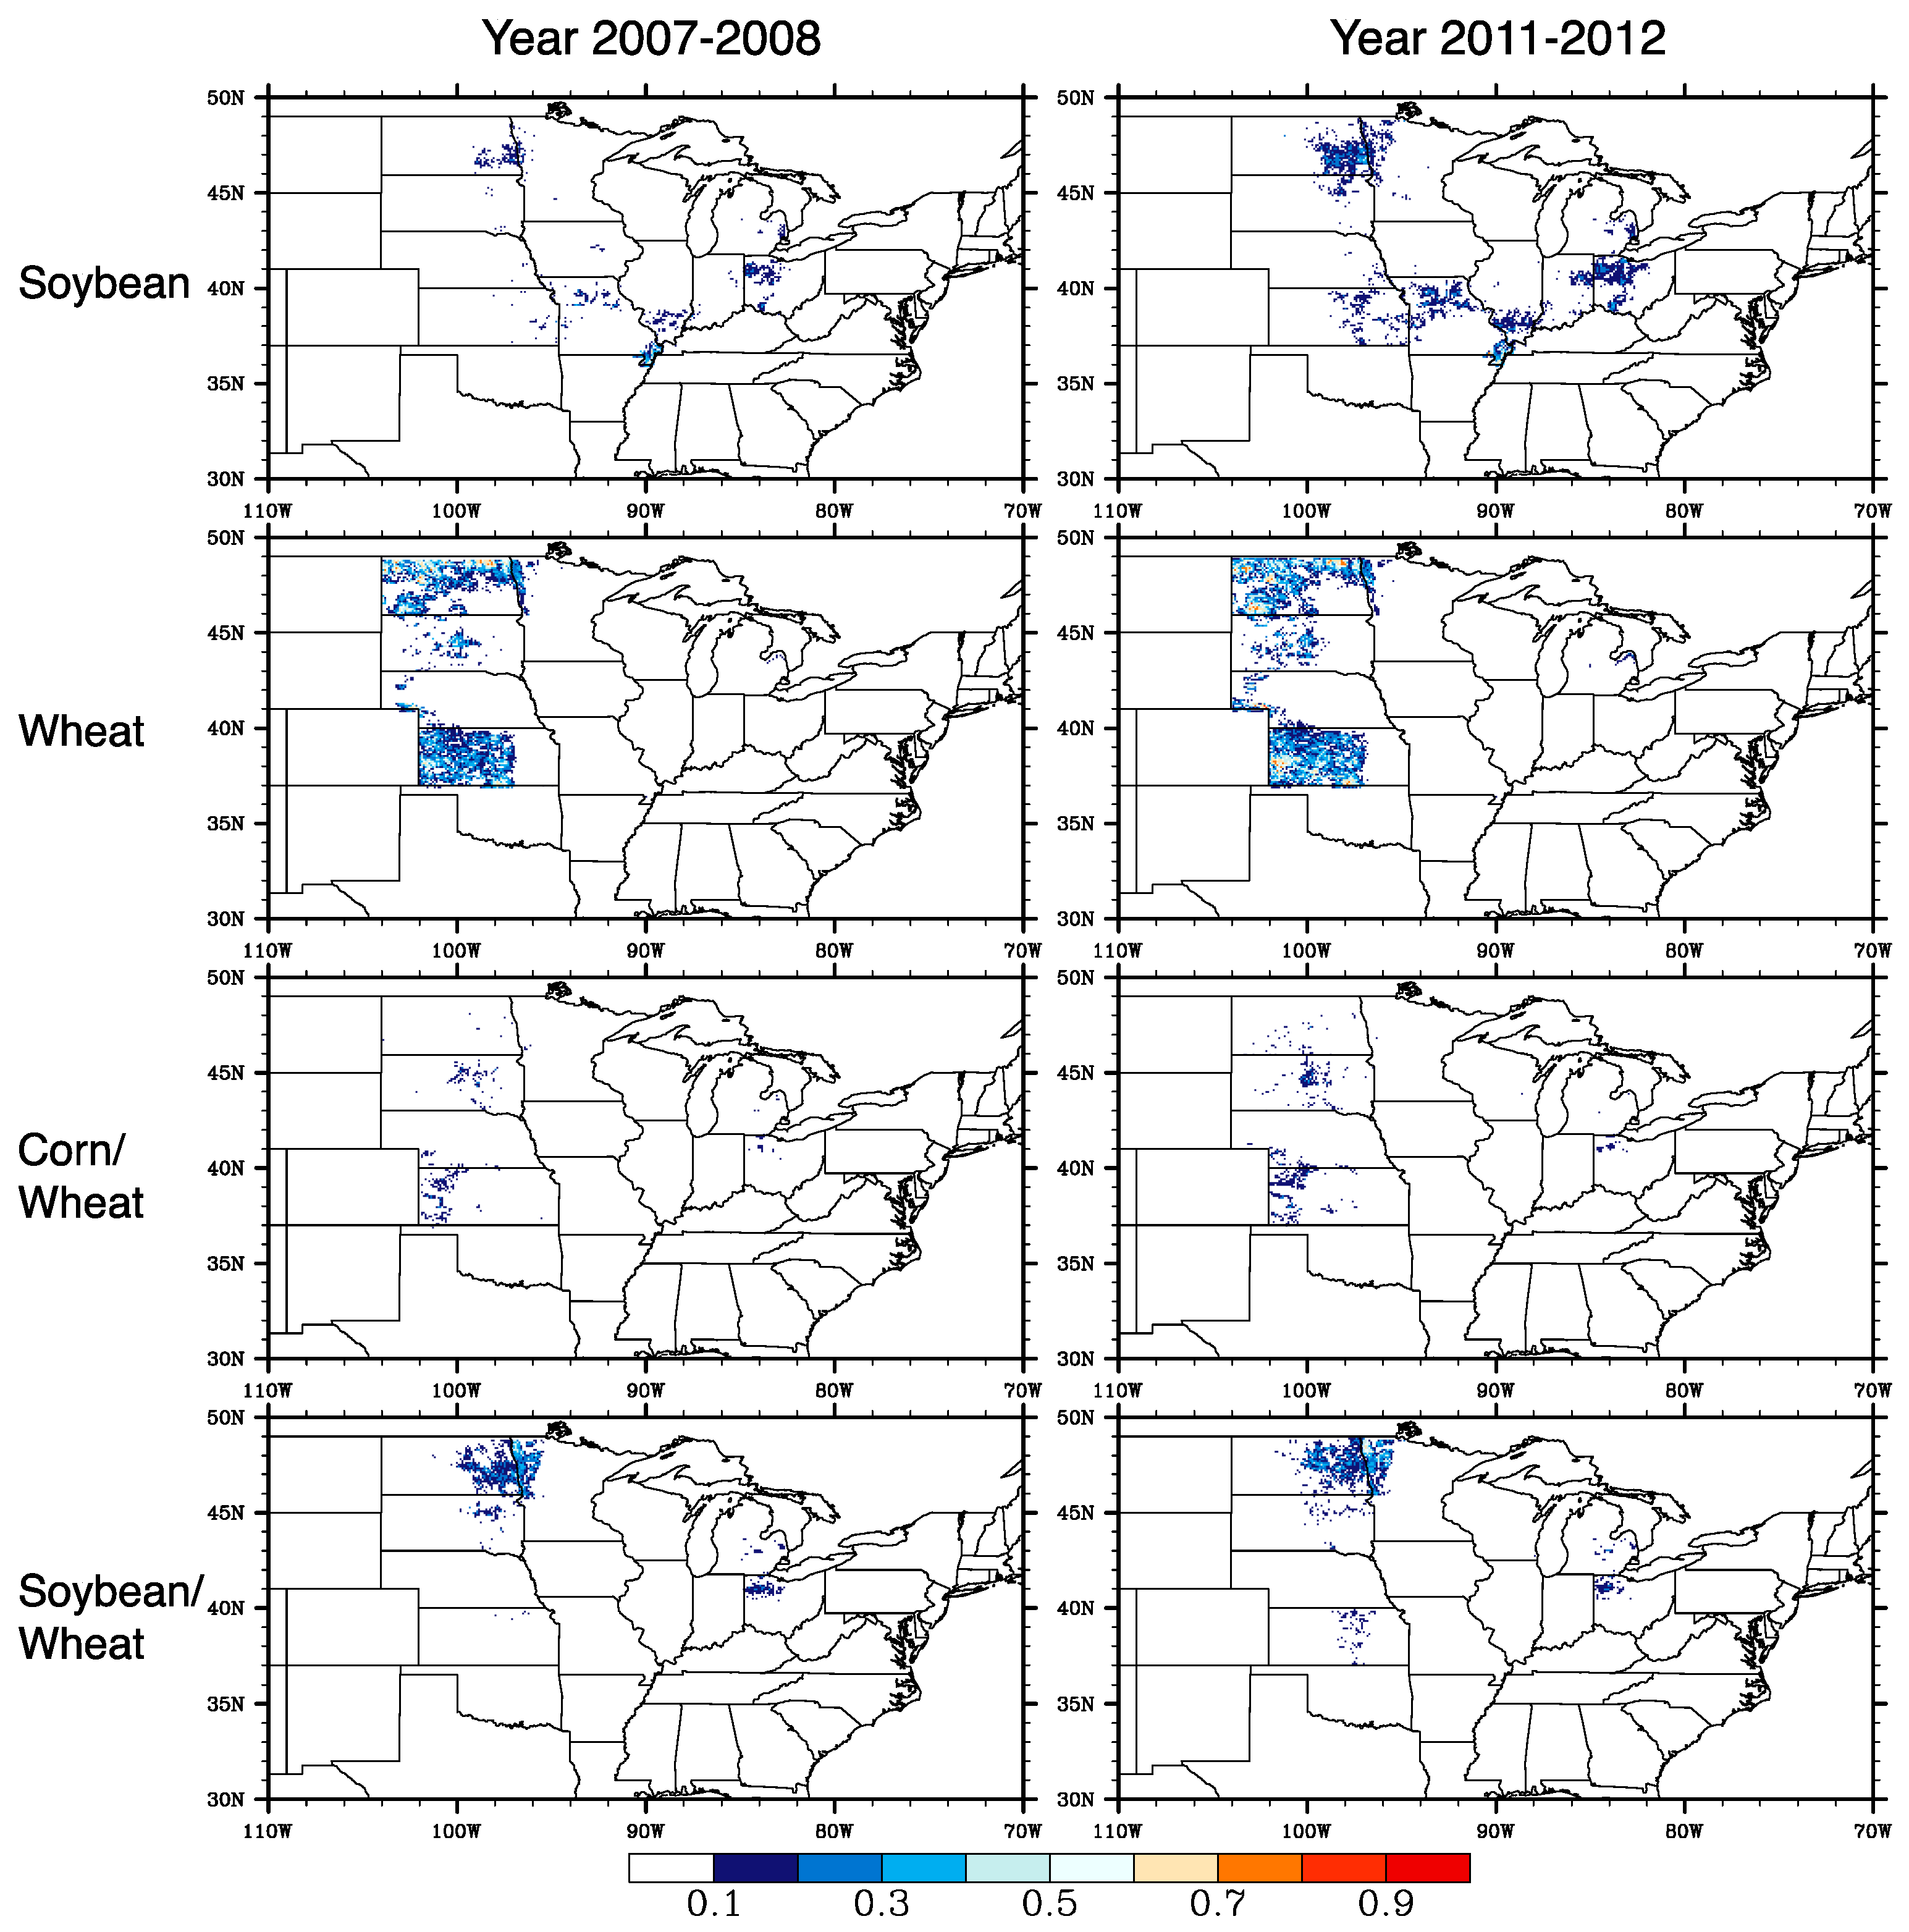
2.1. Study Domain and Land Cover Scenarios
2.2. Agro-IBIS Model
2.3. Data and Regional Simulation
3. Results
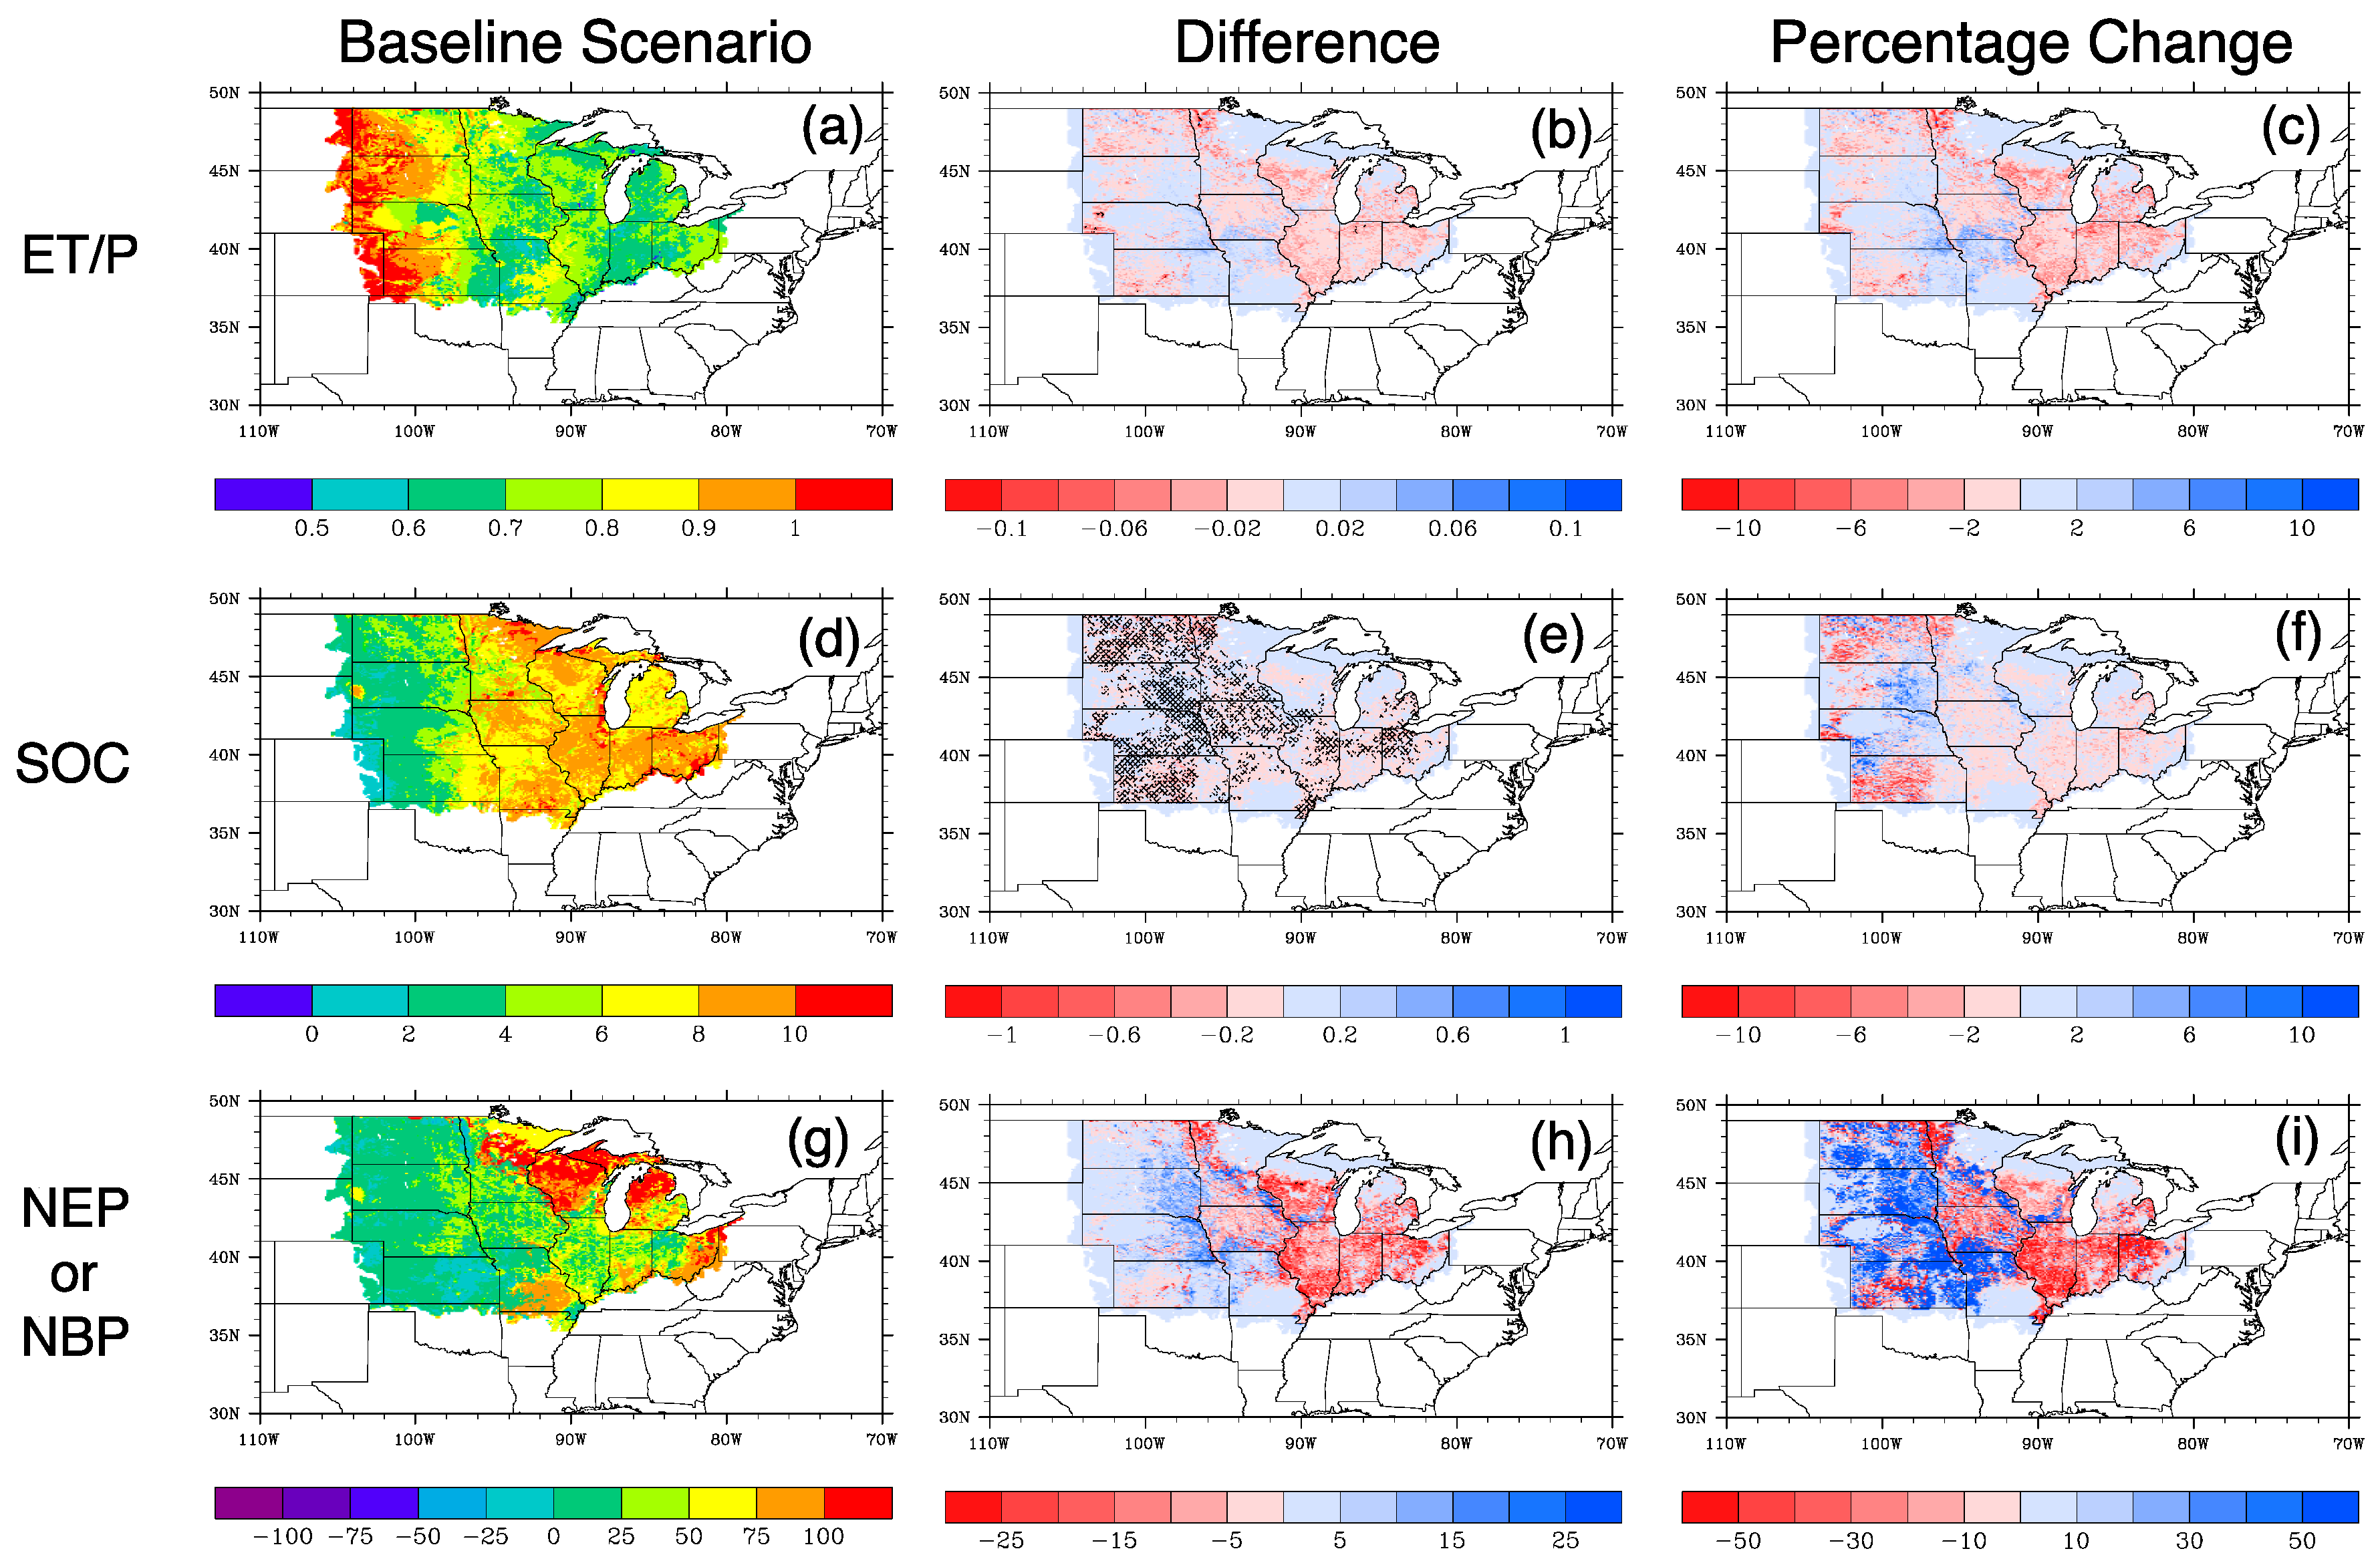
3.1. Water Budget Change
3.2. Soil Carbon Change
3.3. Carbon Flux Change
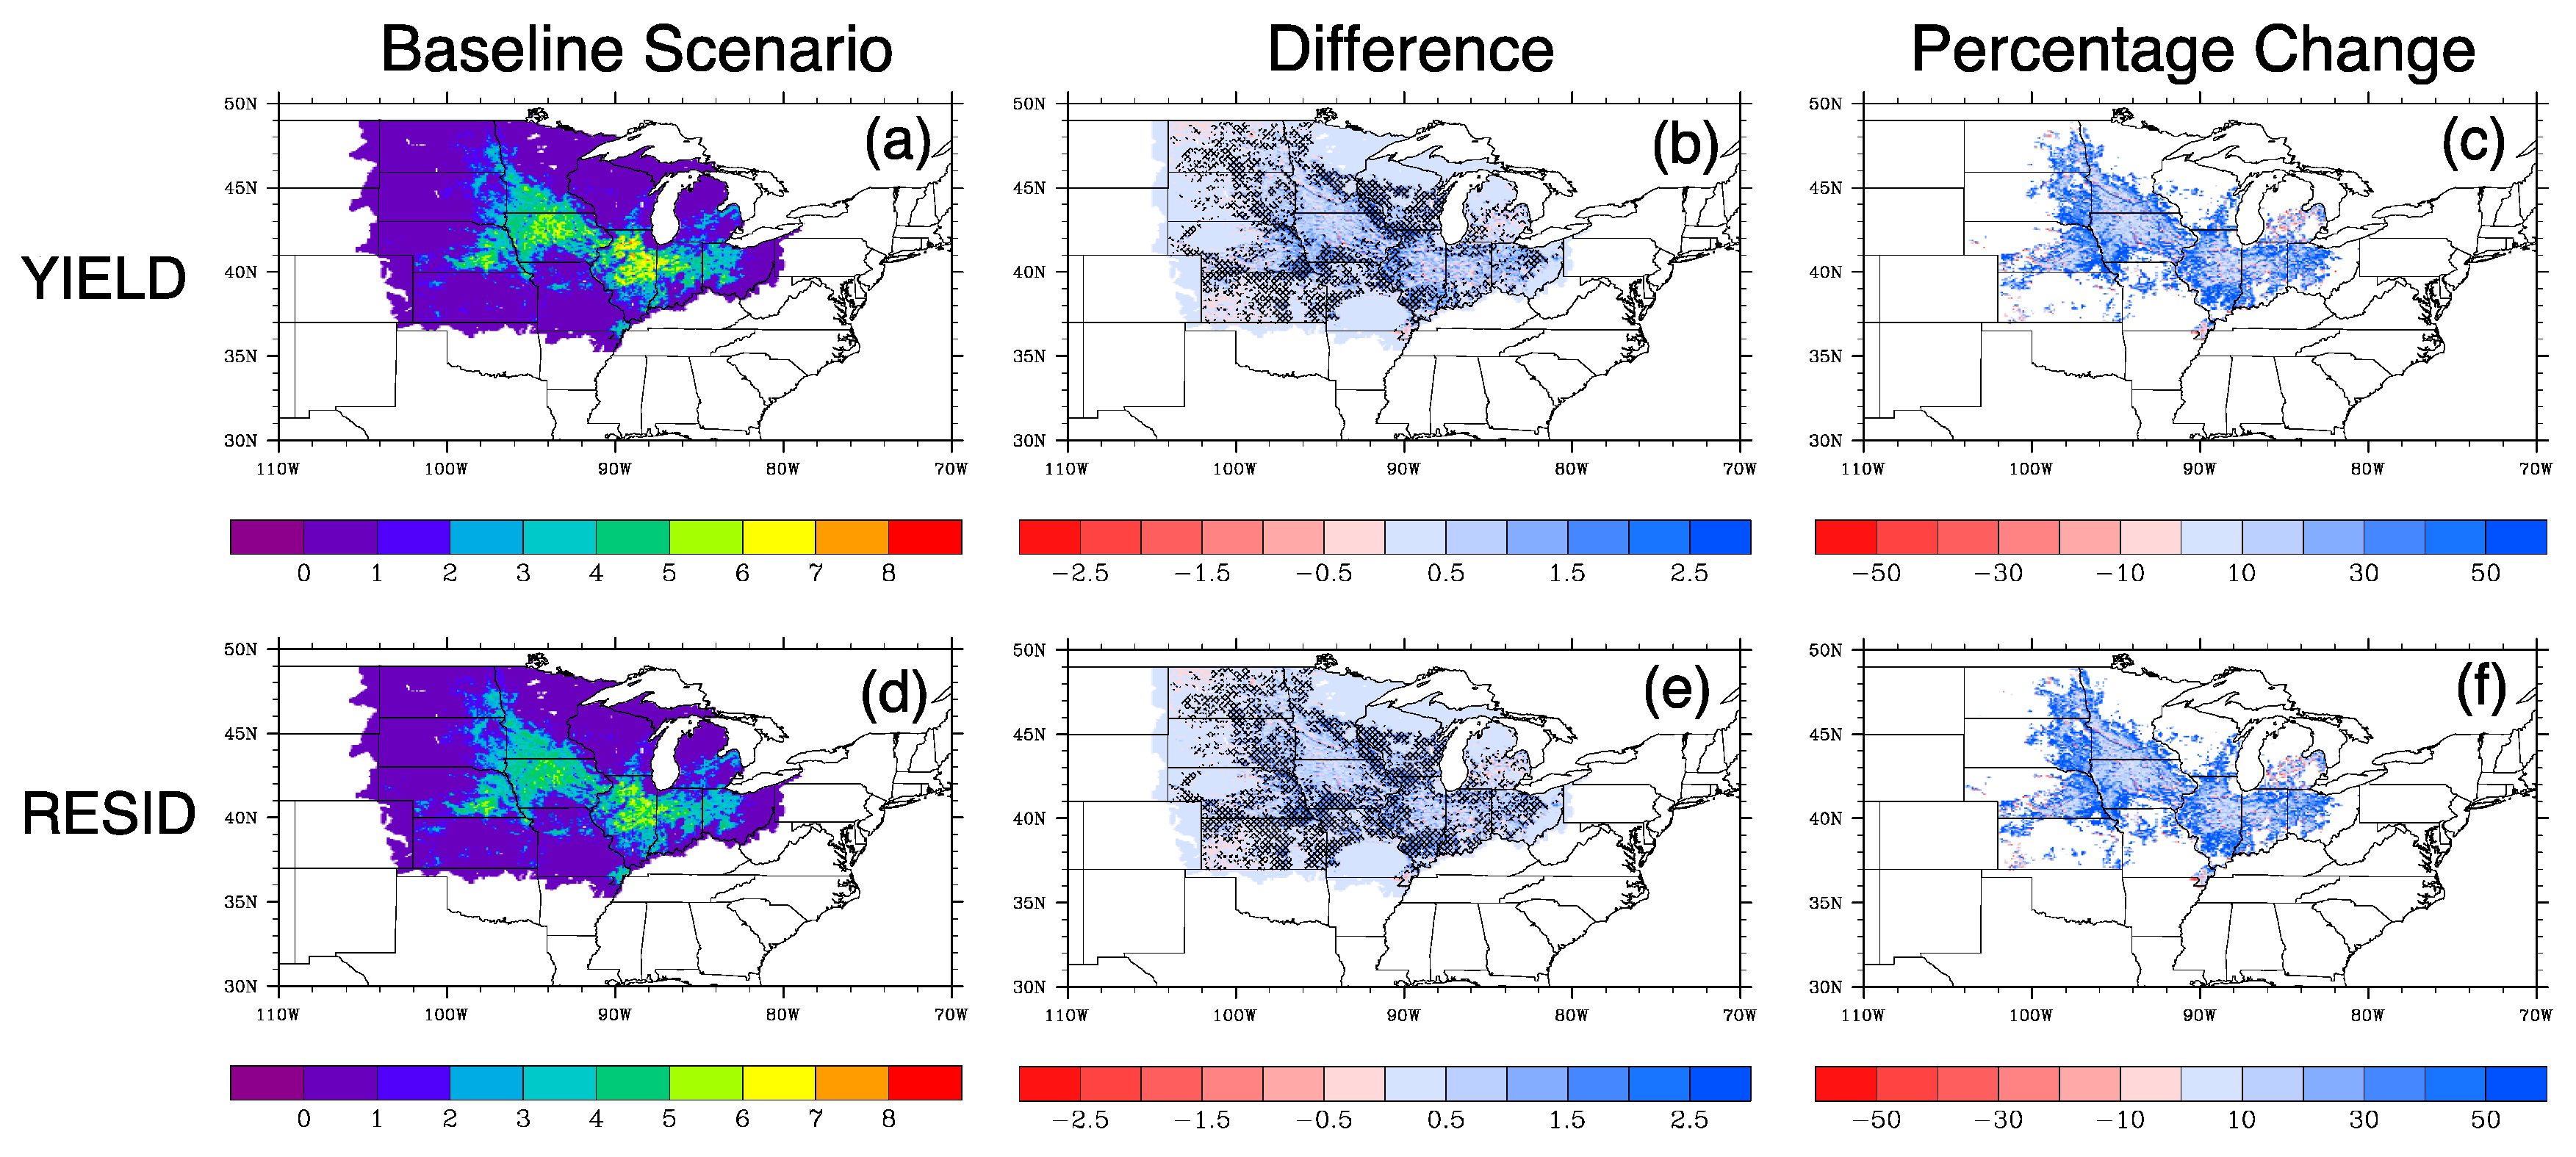
3.4. Crop Production Change
4. Discussion
5. Conclusions
Acknowledgments
Author Contributions
Conflicts of Interest
References
- Donner, S. The impact of cropland cover on river nutrient levels in the Mississippi River Basin. Glob. Ecol. Biogeogr. 2003, 12, 341–355. [Google Scholar] [CrossRef]
- Schilling, K.E.; Jha, M.K.; Zhang, Y.K.; Gassman, P.W.; Wolter, C.F. Impact of land use and land cover change on the water balance of a large agricultural watershed: Historical effects and future directions. Water Resour. Res. 2008, 44, 1–12. [Google Scholar] [CrossRef]
- Hatfield, J. Agriculture in the Midwest. In U.S. National Climate Assessment Midwest Technical Input Report; The Great Lakes Integrated Sciences and Assessments (GLISA) Center: Ann Arbor, MI, USA, 2012; Available online: http://glisa.msu.edu/docs/NCA/MTIT_Agriculture.pdf (accessed on 7 December 2016).
- Mishra, V.; Cherkauer, K.A.; Niyogi, D.; Lei, M.; Pijanowski, B.C.; Ray, D.K.; Yang, G. A regional scale assessment of land use/land cover and climatic changes on water and energy cycle in the upper Midwest United States. Int. J. Climatol. 2010, 30, 2025–2044. [Google Scholar] [CrossRef]
- Biro, K.; Pradhan, B.; Buchroithner, M.; Makeschin, F. Land use/land cover change analysis and its impact on soil properties in the northern part of Gadarif region, Sudan. Land Degrad. Dev. 2013, 24, 90–102. [Google Scholar] [CrossRef]
- Arevalo, C.B.; Bhatti, J.S.; Chang, S.X.; Sidders, D. Land use change effects on ecosystem carbon balance: From agricultural to hybrid poplar plantation. Agric. Ecosyst. Environ. 2011, 141, 342–349. [Google Scholar] [CrossRef]
- Don, A.; Osborne, B.; Hastings, A.; Skiba, U.; Carter, M.S.; Drewer, J.; Lanigan, G.J. Land-use change to bioenergy production in Europe: Implications for the greenhouse gas balance and soil carbon. GCB Bioenergy 2012, 4, 372–391. [Google Scholar] [CrossRef]
- Aanerson-Teixeira, K.J.; Davis, S.C.; Masters, M.D.; DeLucia, E.H. Changes in soil organic carbon under biofuel crops. GCB Bioenergy 2009, 1, 75–96. [Google Scholar] [CrossRef]
- Le, P.V.; Kumar, P.; Drewry, D.T. Implications for the hydrologic cycle under climate change due to the expansion of bioenergy crops in the Midwestern United States. Proc. Natl. Acad. Sci. USA 2011, 108, 15085–15090. [Google Scholar] [CrossRef] [PubMed]
- Qin, Z.; Zhuang, Q.; Chen, M. Impacts of land use change due to biofuel crops on carbon balance, bioenergy production, and agricultural yield, in the conterminous United States. GCB Bioenergy 2012, 4, 277–288. [Google Scholar] [CrossRef]
- Kwon, H.Y.; Mueller, S.; Dunn, J.B.; Wander, M.M. Modeling state-level soil carbon emission factors under various scenarios for direct land use change associated with United States biofuel feedstock production. Biomass Bioenergy 2013, 55, 299–310. [Google Scholar] [CrossRef]
- Vanloocke, A.; Bernacchi, C.J.; Twine, T.E. The impacts of Miscanthus × giganteus production on the Midwest US hydrologic cycle. GCB Bioenergy 2010, 2, 180–191. [Google Scholar] [CrossRef]
- VanLoocke, A.; Twine, T.E.; Zeri, M.; Bernacchi, C.J. A regional comparison of water use efficiency for miscanthus, switchgrass and maize. Agric. For. Meteorol. 2012, 164, 82–95. [Google Scholar] [CrossRef]
- Kucharik, C.J.; Brye, K.R. Integrated BIosphere Simulator (IBIS) yield and nitrate loss predictions for Wisconsin maize receiving varied amounts of nitrogen fertilizer. J. Environ. Qual. 2003, 32, 247–268. [Google Scholar] [CrossRef] [PubMed]
- Mehaffey, M.; Smith, E.; Van Remortel, R. Midwest US landscape change to 2020 driven by biofuel mandates. Ecol. Appl. 2012, 22, 8–19. [Google Scholar] [CrossRef] [PubMed]
- U.S. Department of Agriculture. U.S. Department of Agriculture, National Agriculture Statistics Service, Research and Development Division. Available online: http://www.nass.usda.gov/research/Cropland/SARS1a.htm (accessed on 7 December 2016).
- Foley, J.A.; Prentice, I.C.; Ramankutty, N.; Levis, S.; Pollard, D.; Sitch, S.; Haxeltine, A. An integrated biosphere model of land surface processes, terrestrial carbon balance, and vegetation dynamics. Glob. Biogeochem. Cycles 1996, 10, 603–628. [Google Scholar] [CrossRef]
- Kucharik, C.J.; Foley, J.A.; Delire, C.; Fisher, V.A.; Coe, M.T.; Lenters, J.D.; Gower, S.T. Testing the performance of a dynamic global ecosystem model: Water balance, carbon balance, and vegetation structure. Glob. Biogeochem. Cycles 2000, 14, 795–825. [Google Scholar] [CrossRef]
- Cuadra, S.V.; Costa, M.H.; Kucharik, C.J.; Rocha, H.R.; Tatsch, J.D.; Inman-Bamber, G.; Rocha, R.P.; Leite, C.C.; Cabral, O.M.R. A biophysical model of Sugarcane growth. Glob. Chang. Biol. Bioenergy 2012, 4, 36–48. [Google Scholar] [CrossRef]
- Kucharik, C.J. Evaluation of a process-based agro-ecosystem model (Agro-IBIS) across the US corn belt: Simulations of the interannual variability in maize yield. Earth Interact. 2003, 7, 1–33. [Google Scholar] [CrossRef]
- Xu, H.; Twine, T.E.; Girvetz, E. Climate change and maize yield in Iowa. PLoS ONE 2016, 11, e0156083. [Google Scholar] [CrossRef] [PubMed]
- Webler, G.; Roberti, D.R.; Cuadra, S.V.; Moreira, V.S.; Costa, M.H. Evaluation of a dynamic agroecosystem model (Agro-IBIS) for soybean in southern Brazil. Earth Interact. 2012, 16, 1–15. [Google Scholar] [CrossRef]
- Kucharik, C.J.; Twine, T.E. Residue, respiration, and residuals: Evaluation of a dynamic agroecosystem model using eddy flux measurements and biometric data. Agric. For. Meteorol. 2007, 146, 134–158. [Google Scholar] [CrossRef]
- Donner, S.D.; Coe, M.T.; Lenters, J.D.; Twine, T.E.; Foley, J.A. Modeling the impact of hydrological changes on nitrate transport in the Mississippi River Basin from 1955 to 1994. Glob. Biogeochem. Cycles 2002, 16, 1–19. [Google Scholar] [CrossRef]
- Donner, S.D.; Kucharik, C.J. Evaluating the impacts of land management and climate variability on crop production and nitrate export across the Upper Mississippi Basin. Glob. Biogeochem. Cycles 2003, 17, 1–11. [Google Scholar] [CrossRef]
- Coe, M.T.; Costa, M.H.; Botta, A.; Birkett, C. Long-term simulations of discharge and floods in the Amazon Basin. J. Geophys. Res. Atmos. 2002, 107, LBA 11-1–LBA 11-17. [Google Scholar] [CrossRef]
- Vano, J.A.; Foley, J.A.; Kucharik, C.J.; Coe, M.T. Evaluating the seasonal and interannual variations in water balance in northern Wisconsin using a land surface model. J. Geophys. Res. Biogeosci. 2006, 111. [Google Scholar] [CrossRef]
- Kucharik, C.J.; VanLoocke, A.; Lenters, J.D.; Motew, M.M. Miscanthus establishment and overwintering in the Midwest USA: A regional modeling study of crop residue management on critical minimum soil temperatures. PLoS ONE 2013, 8, e68847. [Google Scholar] [CrossRef] [PubMed]
- Motew, M.M.; Kucharik, C.J. Climate-induced changes in biome distribution, NPP, and hydrology in the Upper Midwest US: A case study for potential vegetation. J. Geophys. Res. Biogeosci. 2013, 118, 248–264. [Google Scholar] [CrossRef]
- Campbell, G.S.; Norman, J.M. An Introduction to Environmental Biophysics; Springer: New York, NY, USA, 1998. [Google Scholar]
- Miller, D.A.; White, R.A. A conterminous United States multilayer soil characteristics dataset for regional climate and hydrology modeling. Earth Interact. 1998, 2, 1–26. [Google Scholar] [CrossRef]
- Ozdogan, M.; Gutman, G. A new methodology to map irrigated areas using multi-temporal MODIS and ancillary data: An application example in the continental US. Remote Sens. Environ. 2008, 112, 3520–3537. [Google Scholar] [CrossRef]
- Homer, C.; Huang, C.; Yang, L.; Wylie, B.; Coan, M. Development of a 2001 National Land-cover Database for the United States. Photogramm. Eng. Remote Sens. 2004, 70, 829–840. [Google Scholar] [CrossRef]
- LANDFIRE. Available online: http://www.landfire.gov/index.php (accessed on 7 December 2016).
- Guo, L.B.; Gifford, R.M. Soil carbon stocks and land use change: A meta analysis. Glob. Chang. Biol. 2002, 8, 345–360. [Google Scholar] [CrossRef]
- Wang, Z.P.; Han, X.G.; Li, L.H. Effects of grassland conversion to croplands on soil organic carbon in the temperate Inner Mongolia. J. Environ. Manag. 2008, 86, 529–534. [Google Scholar] [CrossRef] [PubMed]
- Wilk, J.; Andersson, L.; Plermkamon, V. Hydrological impacts of forest conversion to agriculture in a large river basin in northeast Thailand. Hydrol. Process. 2001, 15, 2729–2748. [Google Scholar] [CrossRef]
- Ellison, D.; Futter, N.M.; Bishop, K. On the forest cover–water yield debate: From demand-to supply-side thinking. Glob. Chang. Biol. 2012, 18, 806–820. [Google Scholar] [CrossRef]
- Paix, M.J.; Lanhai, L.; Xi, C.; Ahmed, S.; Varenyam, A. Soil degradation and altered flood risk as a consequence of deforestation. Land Degrad. Dev. 2013, 24, 478–485. [Google Scholar]
- Coe, M.T.; Costa, M.H.; Soares-Filho, B.S. The influence of historical and potential future deforestation on the stream flow of the Amazon River-Land surface processes and atmospheric feedbacks. J. Hydrol. 2009, 369, 165–174. [Google Scholar] [CrossRef]
- Hayhoe, S.J.; Neill, C.; Porder, S.; Mchorney, R.; Lefebvre, P.; Coe, M.T.; Elsenbeer, H.; Krusche, A.V. Conversion to soy on the Amazonian agricultural frontier increases streamflow without affecting stormflow dynamics. Glob. Chang. Biol. 2011, 17, 1821–1833. [Google Scholar] [CrossRef]
- D’Almeida, C.; Vorosmarty, C.J.; Hurtt, G.C.; Marengo, J.A.; Dingman, S.L.; Keim, B.D. The effects of deforestation on the hydrological cycle in Amazonia: A review on scale and resolution. Int. J. Climatol. 2007, 27, 633–647. [Google Scholar] [CrossRef]
- Stickler, C.M.; Coe, M.T.; Costa, M.H.; Nepstad, D.C.; McGrath, D.G.; Dias, L.C.P.; Rodrigues, H.O.; Soares-Filho, B.S. Dependence of hydropower energy generation on forests in the Amazon Basin at local and regional scales. Proc. Natl. Acad. Sci. USA 2013, 110, 9601–9606. [Google Scholar] [CrossRef] [PubMed]
- Zhang, L.; Wylie, B.K.; Ji, L.; Gilmanov, T.G.; Tieszen, L.L.; Howard, D.M. Upscaling carbon fluxes over the Great Plains grasslands: Sinks and sources. J. Geophys. Res. Biogeosci. 2011, 116. [Google Scholar] [CrossRef]
- Desai, A.R.; Bolstad, P.V.; Cook, B.D.; Davis, K.J.; Carey, E.V. Comparing net ecosystem exchange of carbon dioxide between an old-growth and mature forest in the upper Midwest, USA. Agric. For. Meteorol. 2005, 128, 33–55. [Google Scholar] [CrossRef]
- Kutsch, W.L.; Aubinet, M.; Buchmann, N.; Smith, P.; Osborne, B.; Eugster, W.; Ceschia, E. The net biome production of full crop rotations in Europe. Agric. Ecosyst. Environ. 2010, 139, 336–345. [Google Scholar] [CrossRef]
- Wright, C.K.; Wimberly, M.C. Recent land use change in the Western Corn Belt threatens grasslands and wetlands. Proc. Natl. Acad. Sci. USA 2013, 110, 4134–4139. [Google Scholar] [CrossRef] [PubMed]
- Wilhelm, W.W.; Johnson, J.M.; Hatfield, J.L.; Voorhees, W.B.; Linden, D.R. Crop and soil productivity response to corn residue removal. Agron. J. 2004, 96, 1–17. [Google Scholar] [CrossRef]
- Perlack, R.D.; Stokes, B. Billion-Ton Update: Biomass Supply for a Bioenergy and Bioproducts Industry. Available online: https://www.ornl.gov/ (accessed on 7 December 2016).
- Pennington, D. Harvest Index: A Predictor of Corn Stover Yield; Michigan State University Extension: Michigan, MI, USA, 2013. [Google Scholar]
- Doran, J.W.; Wilhelm, W.W.; Power, J.F. Crop residue removal and soil productivity with no-till corn, sorghum, and soybean. Soil Sci. Soc. Am. J. 1984, 48, 640–645. [Google Scholar] [CrossRef]
- Koga, N.; Tsuji, H. Effects of reduced tillage, crop residue management and manure application practices on crop yields and soil carbon sequestration on an Andisol in northern Japan. Soil Sci. Plant Nutr. 2009, 55, 546–557. [Google Scholar] [CrossRef]
- Tarkalson, D.D.; Brown, B.; Kok, H.; Bjorneberg, D.L. Impact of removing straw from wheat and barley fields: A literature review. Better Crops 2009, 93, 17–19. [Google Scholar]
- Liska, A.J.; Yang, H.; Milner, M.; Goddard, S.; Blanco-Canqui, H.; Pelton, M.P.; Suyker, A.E. Biofuels from crop residue can reduce soil carbon and increase CO2 emissions. Nat. Clim. Chang. 2014, 4, 398–401. [Google Scholar] [CrossRef]
- Weil, R.R.; Magdoff, F. Significance of soil organic matter to soil quality and health. In Soil Organic Matter in Sustainable Agriculture; CRC: New York, NY, USA, 2004; pp. 1–43. [Google Scholar]
- Blanco-Canqui, H.; Lal, R. Corn stover removal for expanded uses reduces soil fertility and structural stability. Soil Water Manag. Conserv. 2009, 73, 418–426. [Google Scholar] [CrossRef]
- Lambin, E.F.; Meyfroidt, P. Global land use change, economic globalization, and the looming land scarcity. Proc. Natl. Acad. Sci. USA 2011, 108, 3465–3472. [Google Scholar] [CrossRef] [PubMed]


| Natural vegetation | tropical evergreen forest/woodland |
| tropical deciduous forest/woodland | |
| temperate evergreen broadleaf forest/woodland | |
| temperate evergreen conifer forest/woodland | |
| temperate deciduous forest/woodland | |
| boreal evergreen forest/woodland | |
| boreal deciduous forest/woodland | |
| mixed forest/woodland | |
| savanna | |
| grassland/steppe | |
| dense shrubland | |
| open shrubland | |
| tundra | |
| desert | |
| Crops | corn |
| soybean | |
| wheat |
| Vegetation Class/Variables | ET (m3·Year−1) | SOC (kg) | NBP (g·Year−1) | ||||||
|---|---|---|---|---|---|---|---|---|---|
| 2007–2008 | 2011–2012 | Difference | 2007–2008 | 2011–2012 | Difference | 2007–2008 | 2011–2012 | Difference | |
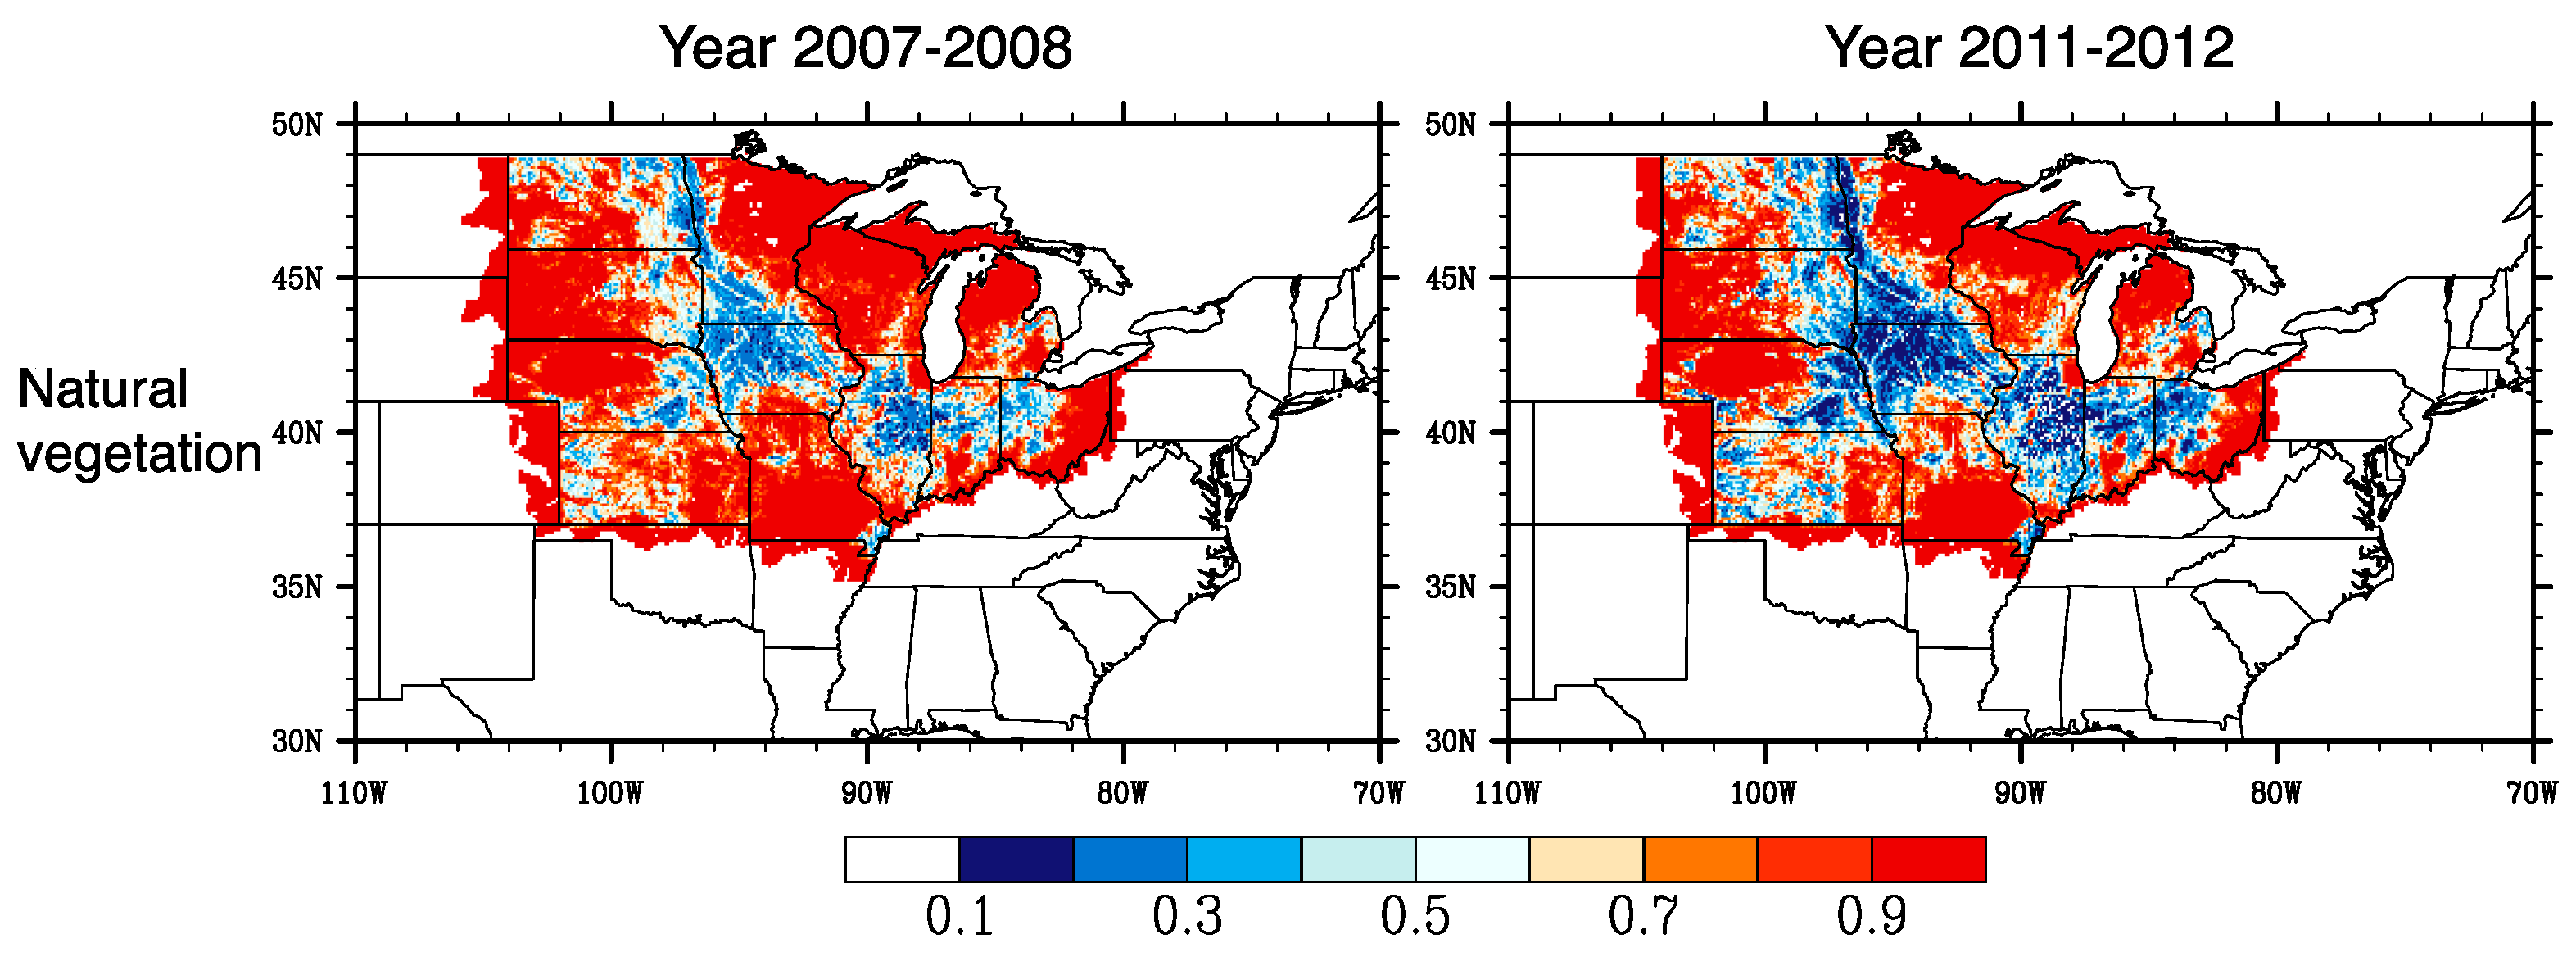
| Natural vegetation | 9.48 × 10¹¹ | 8.36 × 10¹¹ | −1.12 × 10¹¹ | 1.07 × 10¹³ | 9.39 × 10¹² | −1.28 × 10¹² | 7.29 × 10¹³ | 6.57 × 10¹³ | −7.23 × 10¹² |
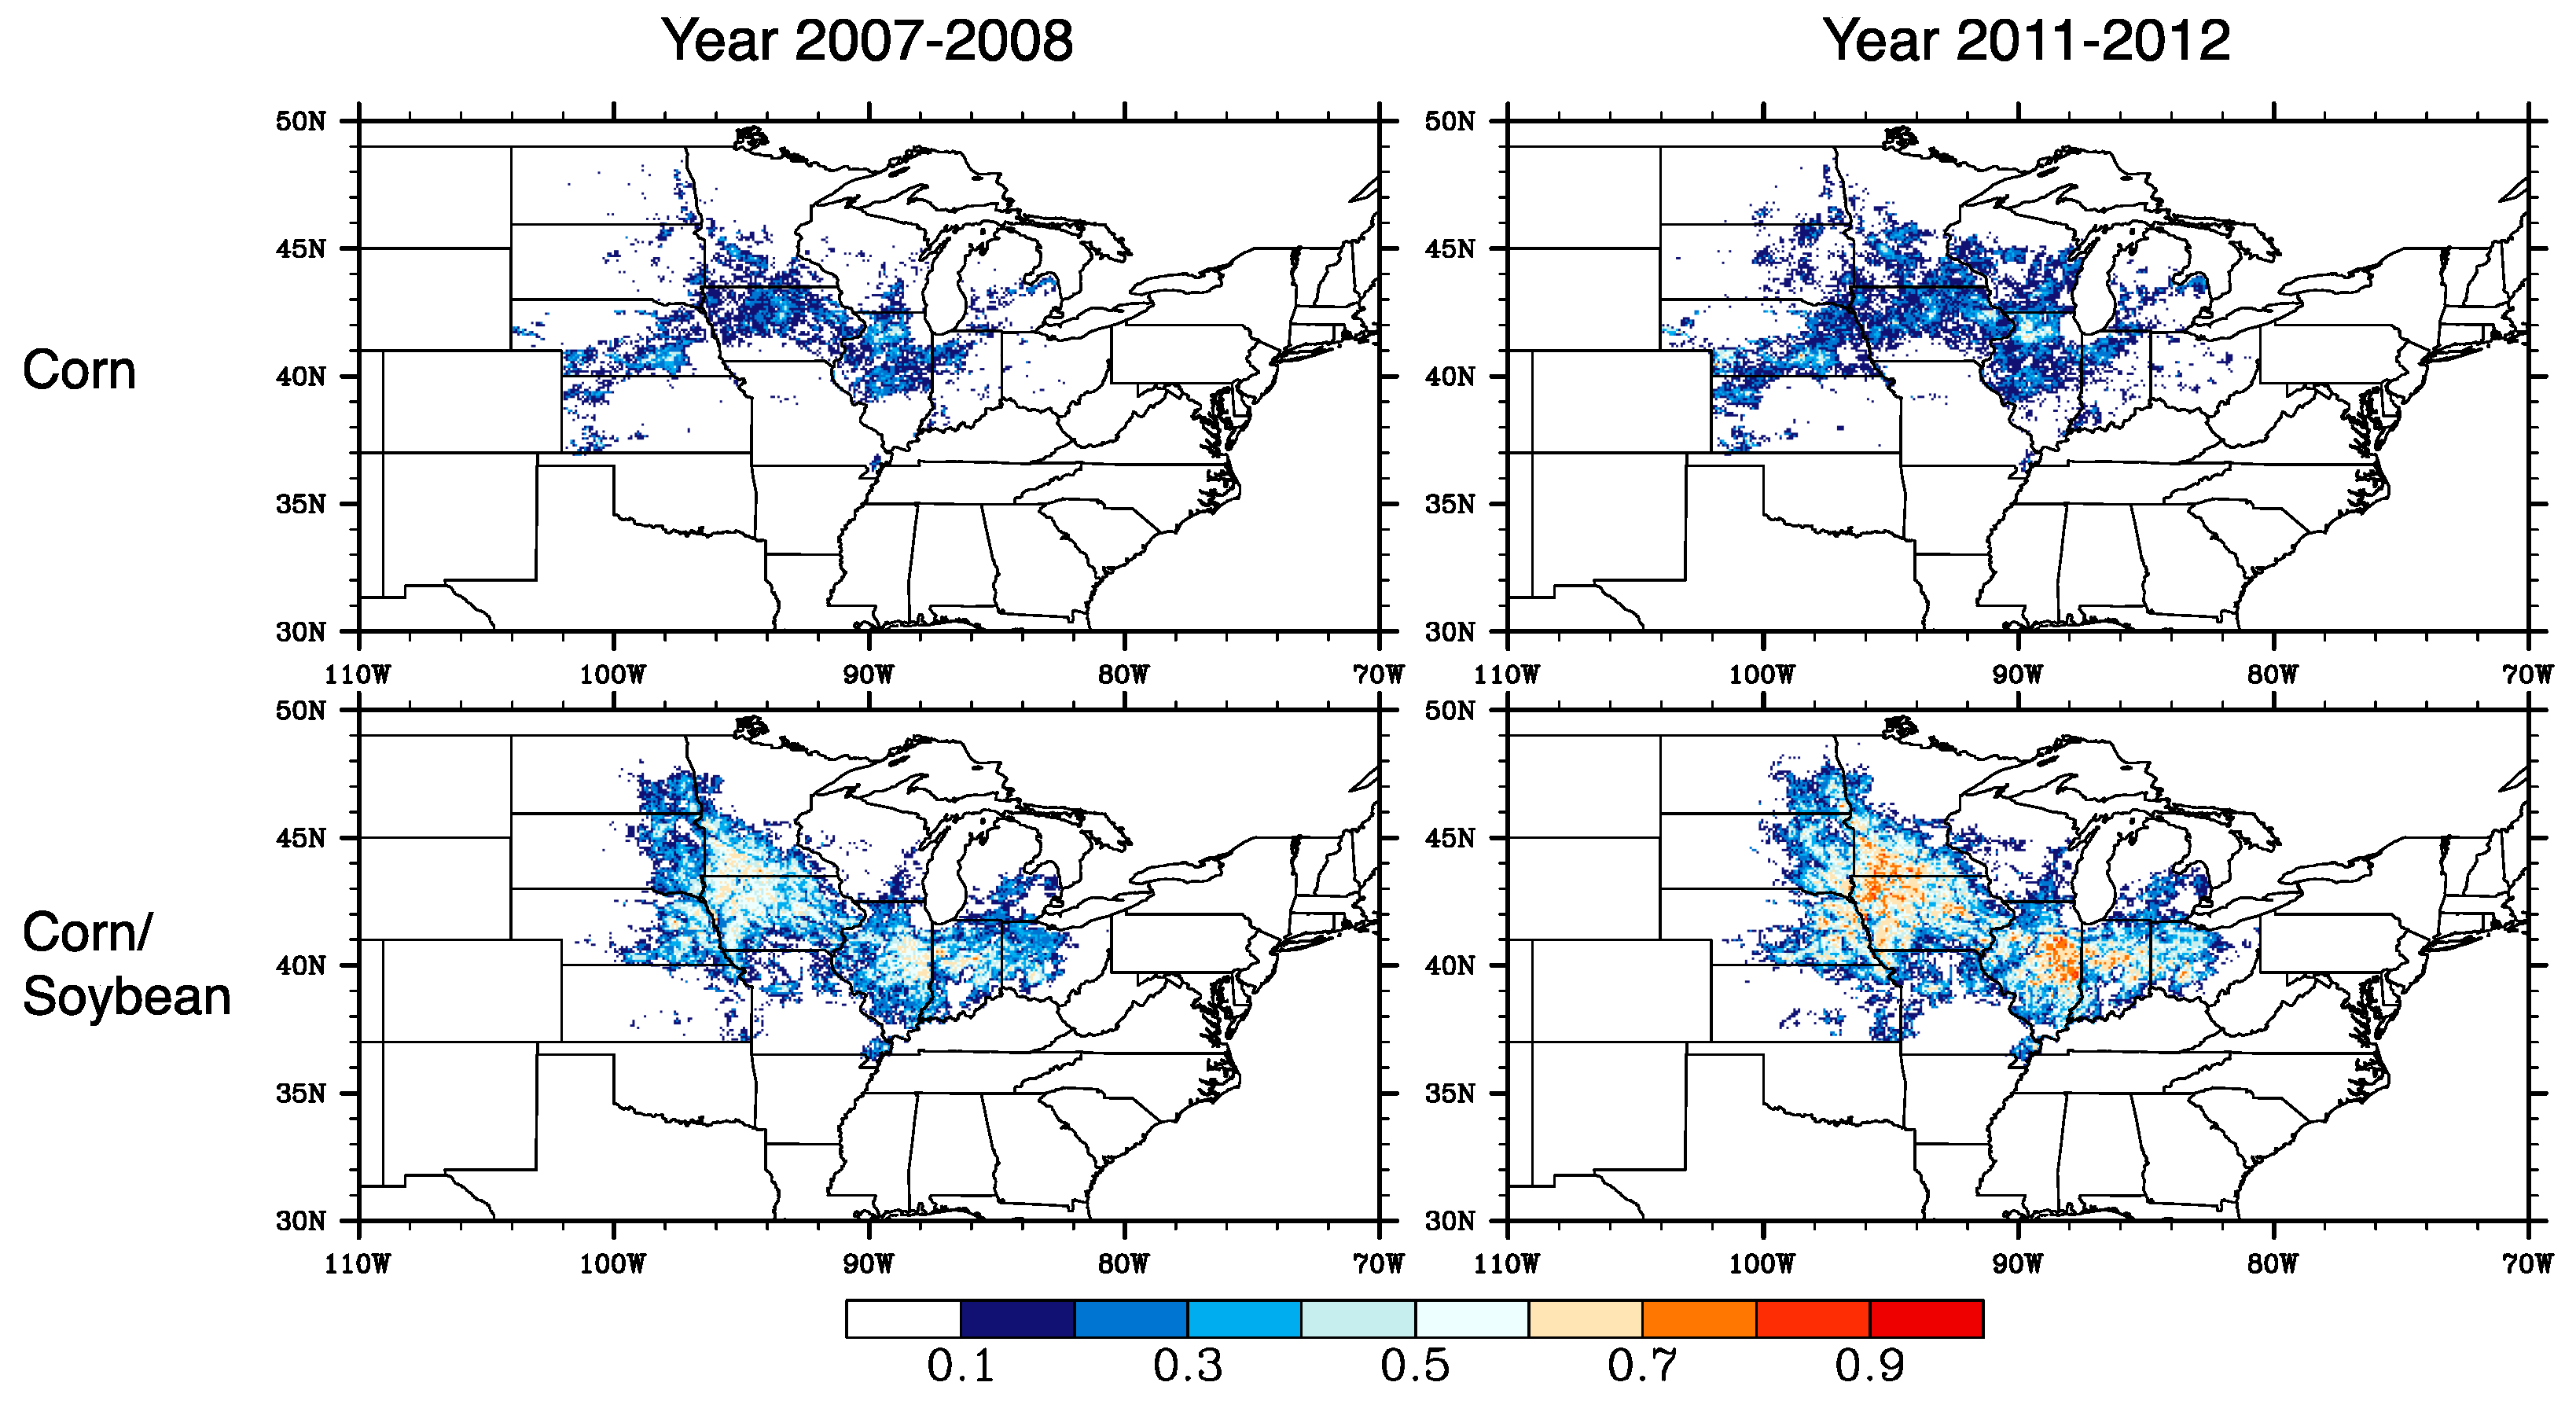
| Corn | 5.20 × 10¹⁰ | 7.79 × 10¹⁰ | 2.58 × 10¹⁰ | 6.96 × 10¹¹ | 1.04 × 10¹² | 3.42 × 10¹¹ | 4.68 × 10¹² | 7.18 × 10¹² | 2.50 × 10¹² |
| Soybean | 1.83 × 10¹⁰ | 3.26 × 10¹⁰ | 1.43 × 10¹⁰ | 2.16 × 10¹¹ | 3.75 × 10¹¹ | 1.59 × 10¹¹ | −1.02 × 10¹² | −1.45 × 10¹² | −4.27 × 10¹¹ |
| Spring wheat | 1.31 × 10¹⁰ | 1.53 × 10¹⁰ | 2.17 × 10⁹ | 1.20 × 10¹¹ | 1.35 × 10¹¹ | 1.49 × 10¹⁰ | −3.67 × 10¹¹ | −3.16 × 10¹¹ | 5.15 × 10¹⁰ |
| Winter wheat | 1.71 × 10¹⁰ | 2.11 × 10¹⁰ | 3.96 × 10⁹ | 8.27 × 10¹⁰ | 1.02 × 10¹¹ | 1.90 × 10¹⁰ | −2.52 × 10¹¹ | −3.36 × 10¹¹ | −8.45 × 10¹⁰ |
| Corn-soybean | 1.33 × 10¹¹ | 1.85 × 10¹¹ | 5.23 × 10¹⁰ | 1.72 × 10¹² | 2.38 × 10¹² | 6.52 × 10¹¹ | 2.49 × 10¹² | 3.93 × 10¹² | 1.43 × 10¹² |
| Corn-spring wheat | 2.86 × 10⁹ | 3.60 × 10⁹ | 7.44 × 10⁸ | 3.10 × 10¹⁰ | 3.84 × 10¹⁰ | 7.33 × 10⁹ | 2.47 × 10¹¹ | 3.10 × 10¹¹ | 6.32 × 10¹⁰ |
| Corn-winter wheat | 4.84 × 10⁹ | 5.64 × 10⁹ | 8.02 × 10⁸ | 4.46 × 10¹⁰ | 5.02 × 10¹⁰ | 5.60 × 10⁹ | −6.62 × 10¹⁰ | −3.89 × 10¹⁰ | 2.74 × 10¹⁰ |
| Soybean-spring wheat | 6.46 × 10⁹ | 7.62 × 10⁹ | 1.16 × 10⁹ | 8.04 × 10¹⁰ | 9.58 × 10¹⁰ | 1.54 × 10¹⁰ | −3.35 × 10¹¹ | −3.98 × 10¹¹ | −6.22 × 10¹⁰ |
| Soybean-winter wheat | 3.77 × 10⁹ | 4.36 × 10⁹ | 5.94 × 10⁸ | 4.18 × 10¹⁰ | 4.39 × 10¹⁰ | 2.08 × 10⁹ | −3.74 × 10¹¹ | −3.53 × 10¹¹ | 2.15 × 10¹⁰ |
| Total | 1.20 × 10¹² | 1.19 × 10¹² | −1.04 × 10¹⁰ | 1.37 × 10¹³ | 1.36 × 10¹³ | −6.03 × 10¹⁰ | 7.79 × 10¹³ | 7.42 × 10¹³ | −3.70 × 10¹² |
© 2017 by the authors. Licensee MDPI, Basel, Switzerland. This article is an open access article distributed under the terms and conditions of the Creative Commons Attribution (CC BY) license ( http://creativecommons.org/licenses/by/4.0/).
Share and Cite
Sun, J.; Twine, T.E.; Hill, J.; Noe, R.; Shi, J.; Li, M. Effects of Land Use Change for Crops on Water and Carbon Budgets in the Midwest USA. Sustainability 2017, 9, 225. https://doi.org/10.3390/su9020225
Sun J, Twine TE, Hill J, Noe R, Shi J, Li M. Effects of Land Use Change for Crops on Water and Carbon Budgets in the Midwest USA. Sustainability. 2017; 9(2):225. https://doi.org/10.3390/su9020225
Chicago/Turabian StyleSun, Jian, Tracy E. Twine, Jason Hill, Ryan Noe, Jiancheng Shi, and Minmin Li. 2017. "Effects of Land Use Change for Crops on Water and Carbon Budgets in the Midwest USA" Sustainability 9, no. 2: 225. https://doi.org/10.3390/su9020225