Article

Can Australia Power the Energy-Hungry Asia with Renewable Energy?

School of Energy Systems, Lappeenranta University of Technology, Skinnarilankatu 34, 53850 Lappeenranta, Finland
*
Author to whom correspondence should be addressed.
Sustainability 2017, 9(2), 233; https://doi.org/10.3390/su9020233
Submission received: 20 December 2016 / Revised: 1 February 2017 / Accepted: 3 February 2017 / Published: 8 February 2017
(This article belongs to the Special Issue Renewable Electricity)

Abstract

:
The Paris Agreement points out that countries need to shift away from the existing fossil-fuel-based energy system to limit the average temperature rise to 1.5 or 2 °C. A cost-optimal 100% renewable energy based system is simulated for East Asia for the year 2030, covering demand by power, desalination, and industrial gas sectors on an hourly basis for an entire year. East Asia was divided into 20 sub-regions and four different scenarios were set up based on the level of high voltage grid connection, and additional demand sectors: power, desalination, industrial gas, and a renewable-energy-based synthetic natural gas (RE-SNG) trading between regions. The integrated RE-SNG scenario gives the lowest cost of electricity (€52/MWh) and the lowest total annual cost of the system. Results contradict the notion that long-distance power lines could be beneficial to utilize the abundant solar and wind resources in Australia for East Asia. However, Australia could become a liquefaction hub for exporting RE-SNG to Asia and a 100% renewable energy system could be a reality in East Asia with the cost assumptions used. This may also be more cost-competitive than nuclear and fossil fuel carbon capture and storage alternatives.

1. Introduction

In December 2015, the annual Conference of Parties (COP) 21 held in Paris, also known as the Paris Agreement [1] was an action-driven event with several concreate achievements [2]. The conference presented several political and business leaders with the opportunity to take the critical decisions needed to keep the average global temperature rise to no more than 1.5 or 2 °C, which finally requires net zero greenhouse gas emissions shortly after the middle of this century [1]. According to Schellnhuber et al. [
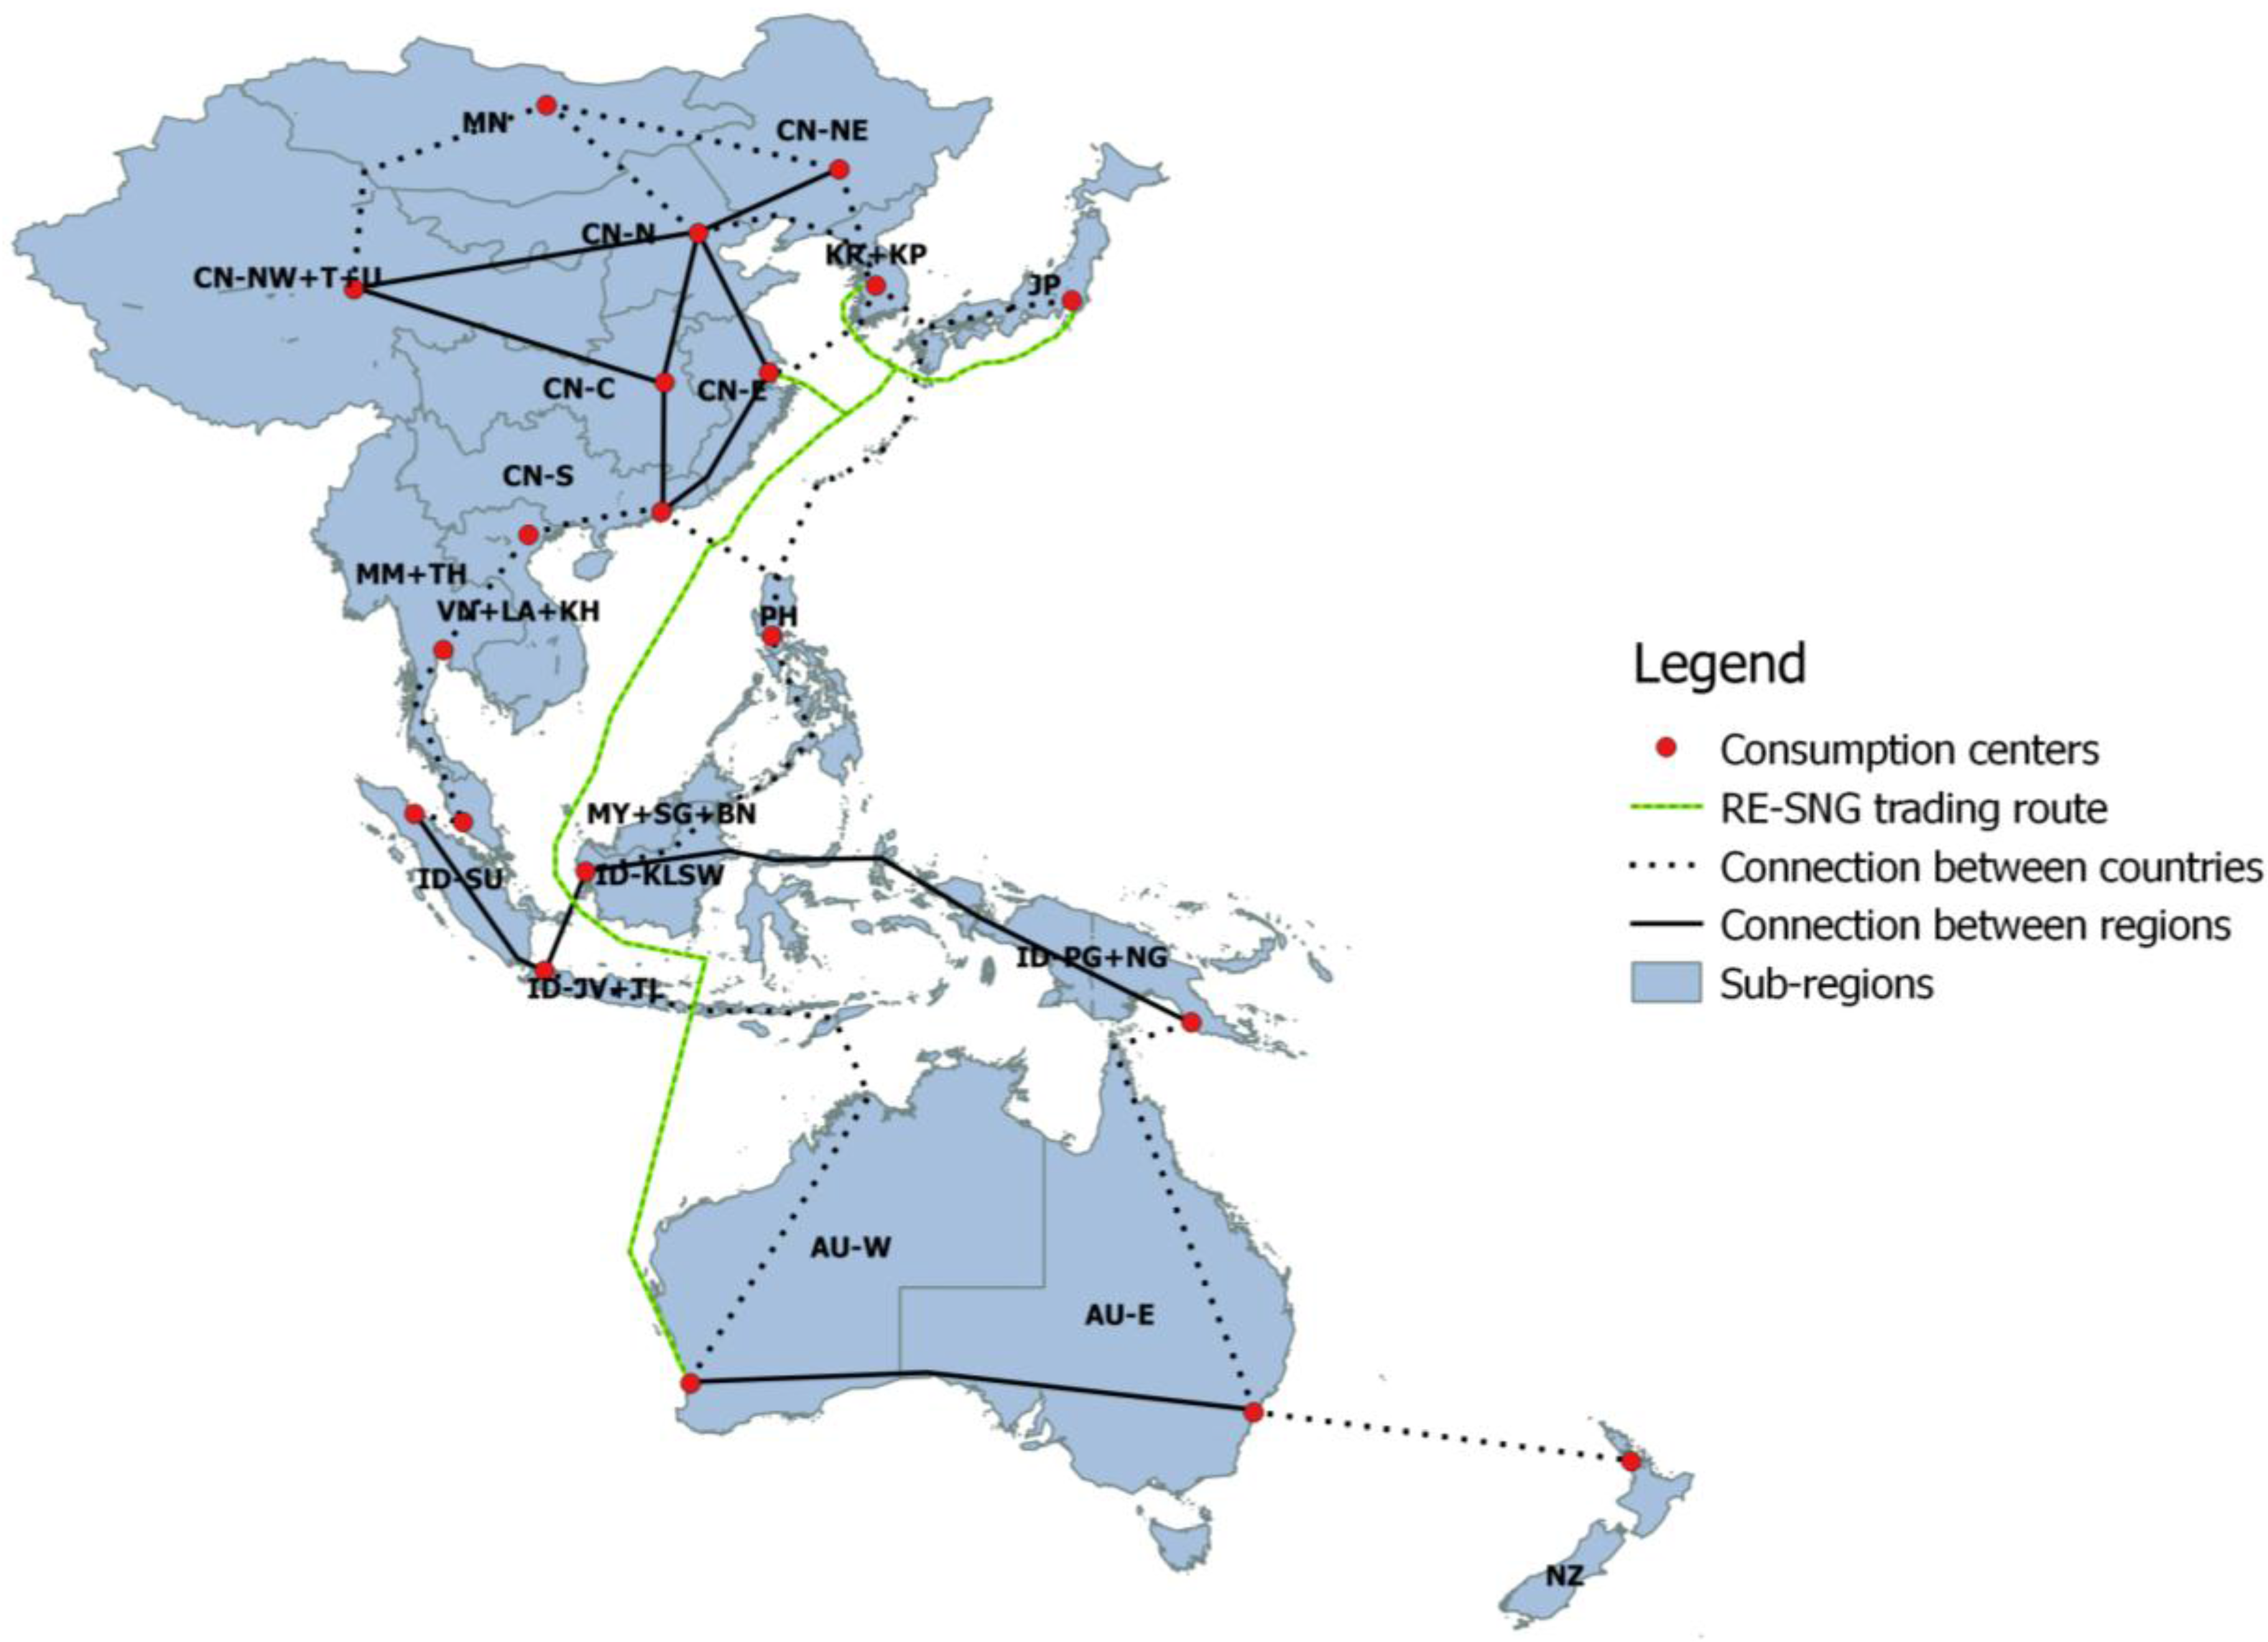
3], the 2 °C limit is economically achievable due to rapidly falling costs of renewable energy, particularly solar PV, but is constrained by politics. It is observed that change is happening in energy supply for a lot of countries, but this needs to happen faster. The region of interest for this research is East Asia, which is comprised of Northeast Asia and Southeast Asia, the latter including Australia and New Zealand.
Energy is a key driver for social and economic development, particularly in developing countries where many people have no access to basic forms of energy. Many developing countries have programs to electrify the non-electrified population and at the same time maintain a high level of economic development. Thus, the demand for electricity is growing very fast, particularly in East Asia. According to Taggart [4], leading up to 2050, East Asia—comprised of China, Japan, the ASEAN states, and Australia—will become the world’s largest economy. To keep up with economic development and improve living conditions, there will be a rapid increase in energy needs, which will put our climate at risk, as the energy sector is one of the main sources of greenhouse gas emissions [5]. The effects of greenhouse gas emissions will be dramatic in Southeast Asia as it is one of the most vulnerable regions and also least prepared to deal with the impacts of climate change [5]. Coal has been the dominating fossil fuel in the energy mix of most East Asian countries [6,7]. Coal-fired power plants are associated with high health costs and heavy metal emissions [8,9,10,11], which are rarely taken into account in optimizing the societal cost of energy supply in a region. Therefore, in the future, East Asia will hold the key for minimizing the impacts of climate change.
The abovementioned issues account for the necessity of a fully sustainable energy system that will be mainly based on solar and wind, with other technologies complementing these two technologies. The global competitiveness of a 100% renewable-energy-based system has been discussed by Hoffman [12]. According to Pleßmann et al. [13], a 100% renewable energy system can mainly be developed in a decentralized manner. The discussion regarding the construction of an East Asian and Pacific supergrid has been introduced before, based on the EU-MENA Desertec vision [14,15] and discussed further for Northeast Asia [16,17]. Large-scale connectivity via the HVDC lines of different countries from Australia to China, Japan, and Korea can partially cancel out the regional intermittencies of the renewables, are easier to manage without the potential need of storage technologies, and help to transmit low emission energy across countries [18]. For East Asia, there is not yet much research on sustainable energy transition pathways into future. The Energy [R]evolution scenario of Greenpeace [19] proposes a pathway to 100% sustainable energy supply in the East Asian and Oceania regions, ending CO2 emissions and phasing out nuclear energy. It also demonstrates that this transformation increases employment in the energy sector. A list of various future scenarios for East Asia with key findings is given in Table 1. However, none of them considered the approaches applied in this study, such as an hourly-based model that guarantees that the hourly total electric energy supply in an entire year in the sub-regions covers the local demand from all sectors; different transmission grid development levels that are able to reduce the need for energy storage and total costs; and an integrated scenario that assumes electricity demand, water desalination, industrial gas demand, and a renewable energy (RE)-based synthetic natural gas (SNG) trading.
Individual major region modeling for Southeast Asia and Pacific (SEA) [22] and Northeast Asia (NEA) [23] has already been performed. However, the modelling of the integration of the two major regions has not yet been done before or, if presented, not all energy sectors that incorporate a spatial and temporal resolution of energy supply and demand, and that fully consider energy infrastructure or the constraints of sustainability criteria, were taken into account. For the modeling of real-world conditions, all this has to be taken into account to obtain a comprehensive low-cost energy system that will be based on 100% renewable energy. Australia is well endowed with renewable energy resources; in particular, it has immense solar resources in the center and northwest and no land constraint as Australia has one of the lowest population densities per square kilometer [21]. Also, the rapidly falling costs of solar photovoltaic (PV) [3,24,25,26] and the high availability in Australia can help fulfill a vision of connecting Australia with ASEAN, China, and Japan via HVDC lines for a fully sustainable energy system.
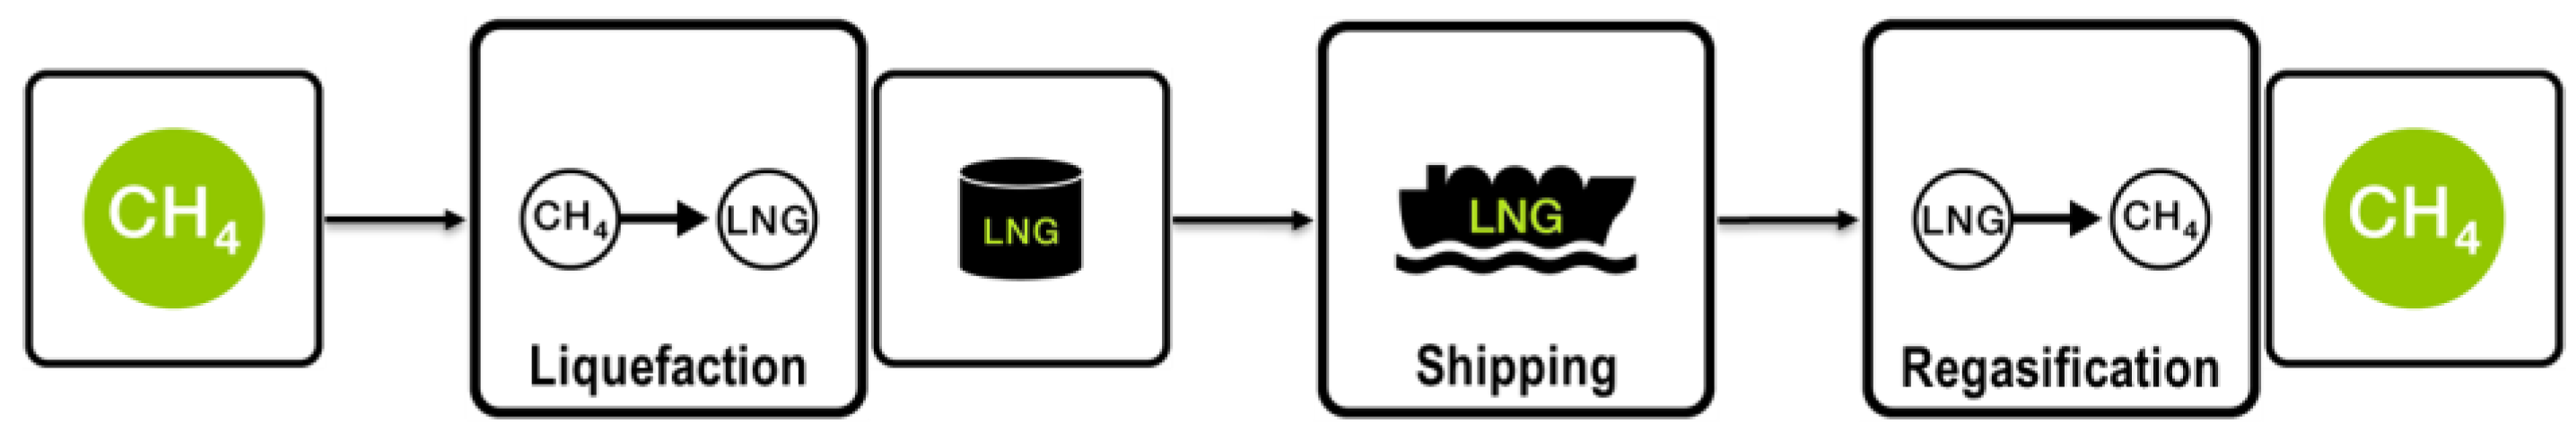
This paper discusses the results of the simulation for East Asia for the year 2030 for a 100% renewable energy system. The possibility of the supply of renewable electricity, especially from solar and wind resources, with the help of HVDC power lines from Australia to ASEAN countries, China, Japan, and Korea, is touched upon and discussed. Also, there is a discussion of whether local RE-based SNG production or RE-based SNG trading between countries is more beneficial [27]. Here a scenario with Australia as a RE-based SNG production hub composed of hybrid PV-Wind and Power-to-Gas (PtG) plants and delivering RE-based SNG to Korea and Japan is simulated and discussed. The LNG value chain (SNG liquefaction, LNG shipping, and LNG regasification) can be applied to transfer the RE-SNG generated in Australia to Asian countries. Despite the efficiency losses and additional cost of the LNG value chain, the re-gasified SNG in Asia could still be cheaper than local production to balance the power system or answer the industrial gas demand. LNG technology is already in use in Australia, Korea, and Japan, in some cases for decades [28]. Other scenario setups are: region-wide, area-wide, and integrated scenarios. The area-wide scenario is compared with the two separated NEA and SEA regions to extract the benefit, if any, gained by the geographical energy system integration of the two individual regions.
The paper is organized as follows: 
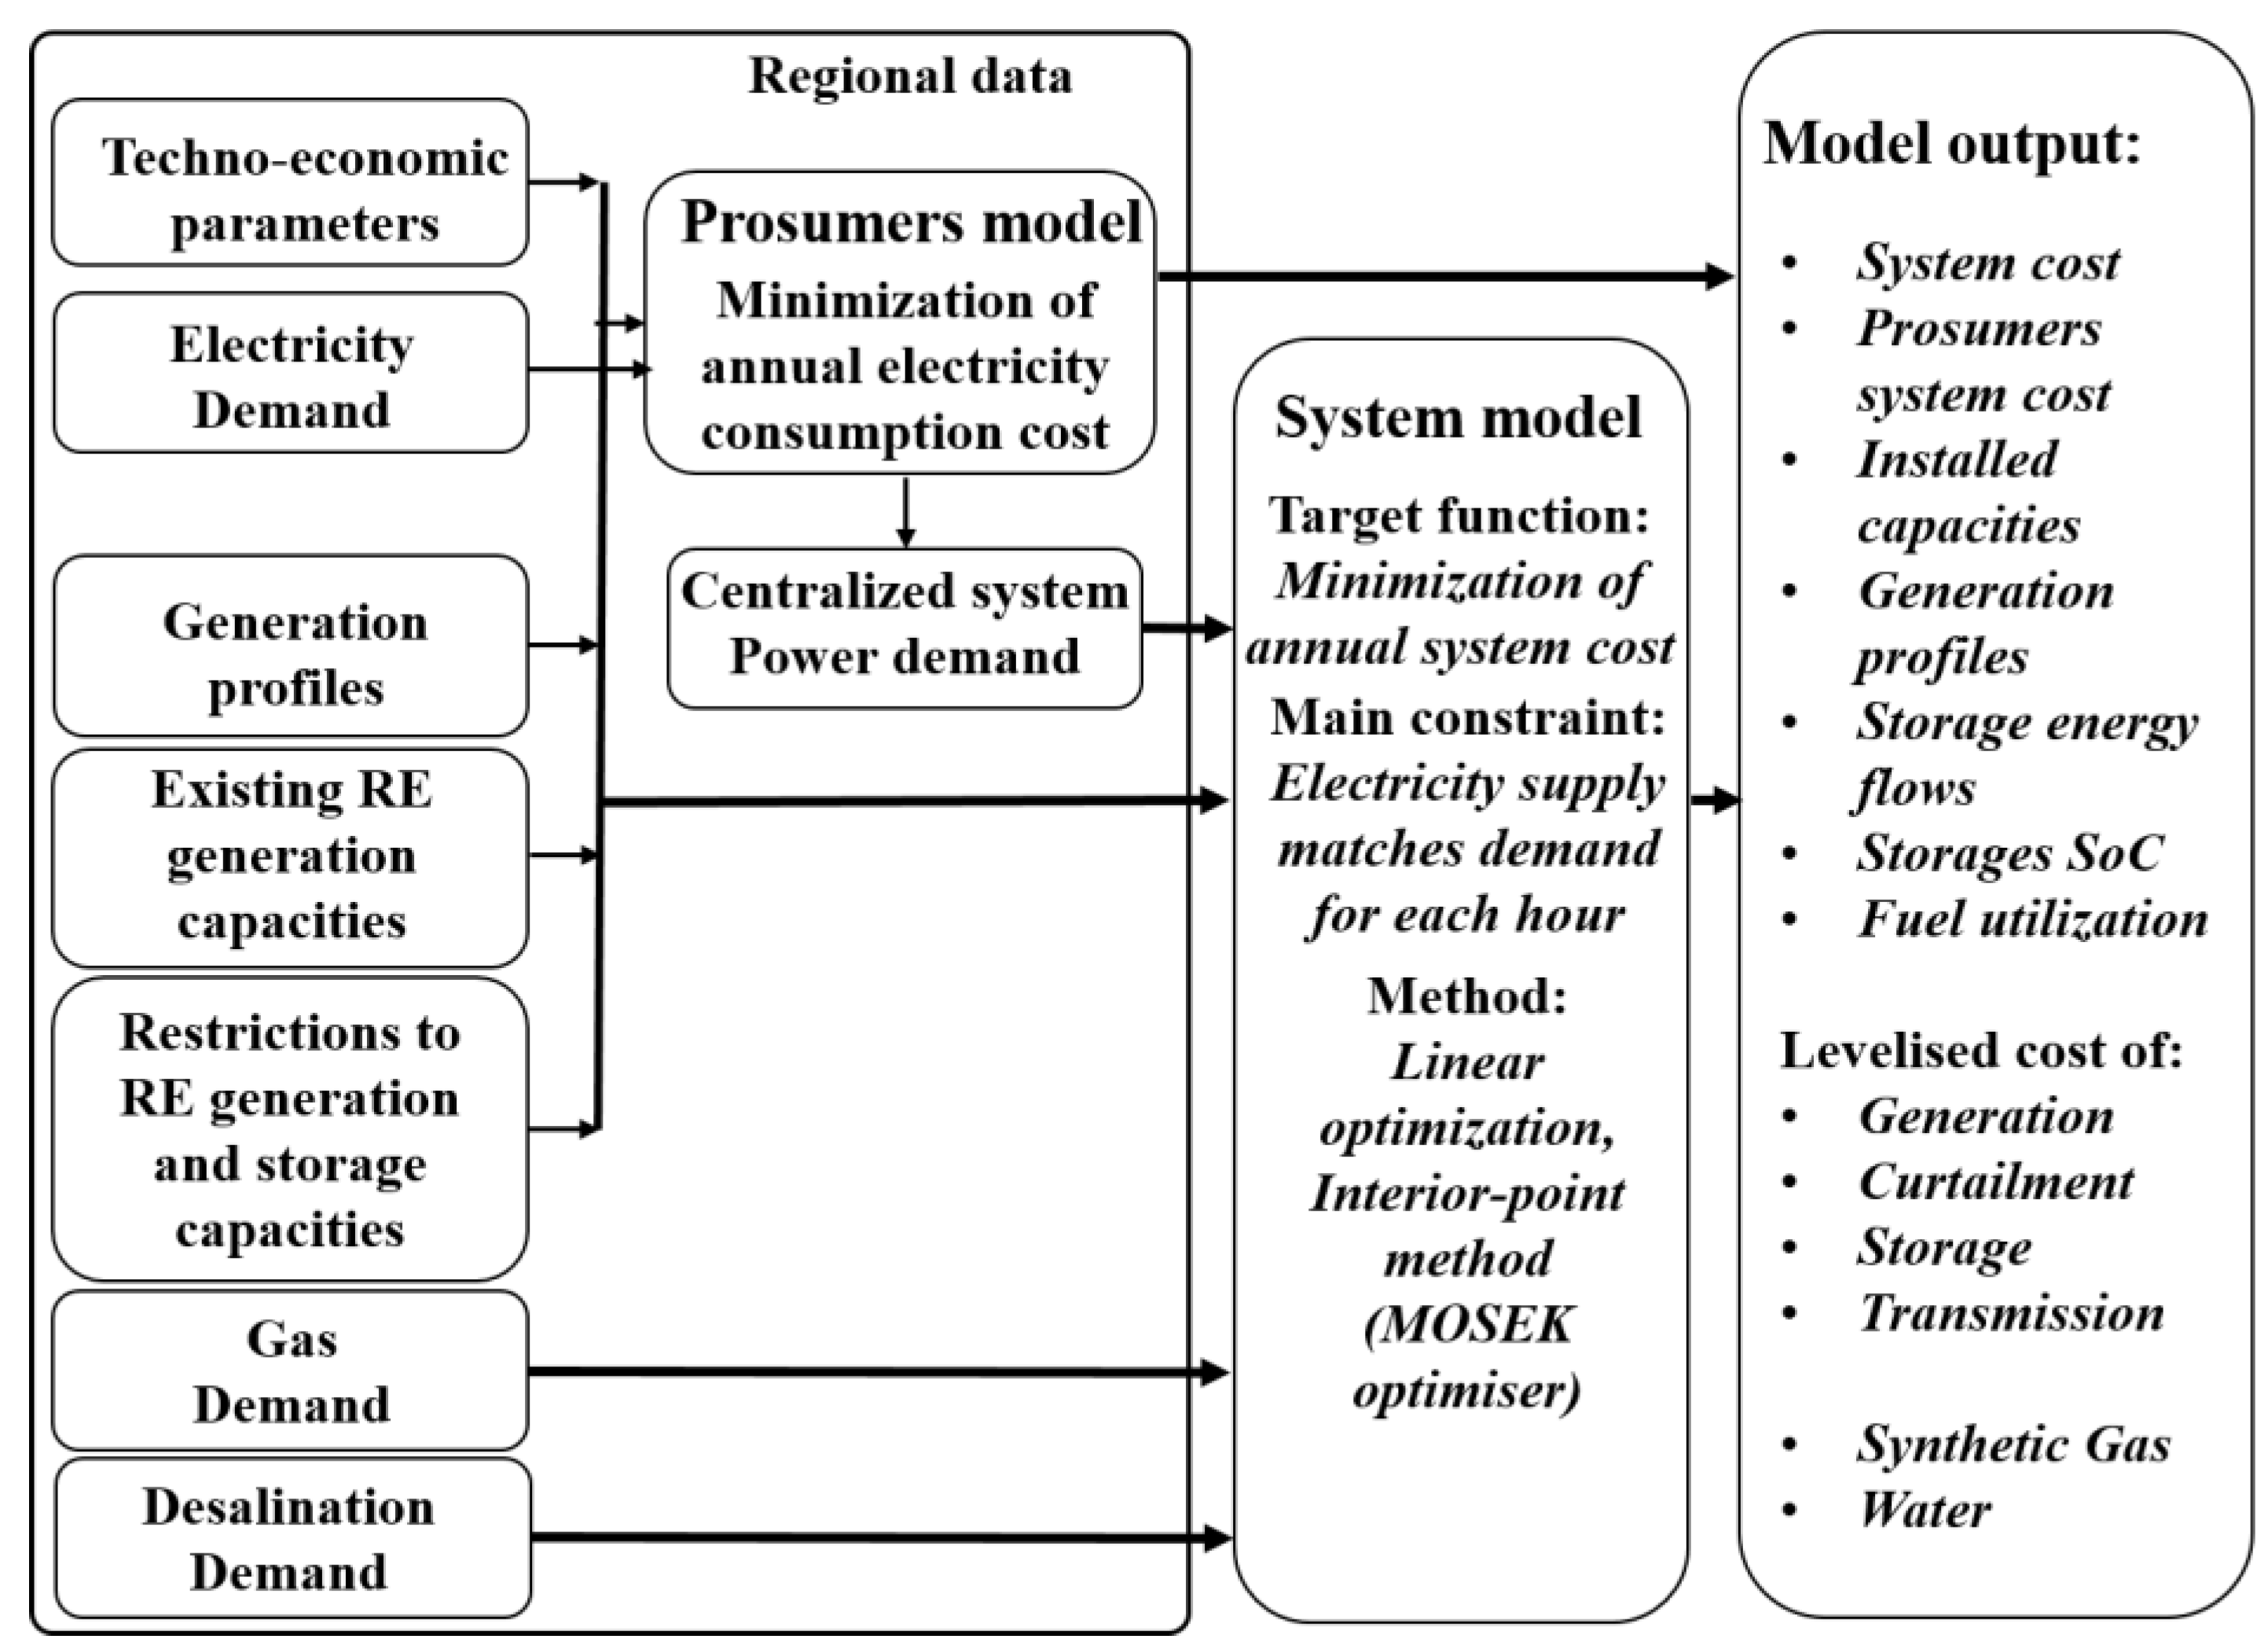
Section 2 provides the methodology, the input data, and the technologies used for the simulations. Section 3 provides the assumptions and a description of the different scenarios used for the simulations. The results of the simulations are presented in Section 4. Section 5 discusses the results of the simulations. Finally, conclusions are drawn in Section 6.

2. Methodology

In this study, the model used [23] is based on linear optimization of energy system parameters under previously defined constraints that are applied to the system. There are also assumptions regarding future RE power generation, demand, and required storage technologies. Also included in the model are the flexible demand of water desalination and synthetic natural gas generation. One of the important constraints of the system optimization is matching of power generation and demand on an hourly basis for a particular year. The key target of the system optimization is the minimization of the total annual energy system costs. This cost is the sum of the costs of all the installed capacities of the different technologies, energy generation, generation ramping, the annualized capital expenditures, the operational expenditures, and the cost of capital. Also, the system consists of prosumers for residential, commercial, and industrial sectors. These prosumers install the individual capacities of rooftop PV systems and batteries. The target function for the prosumers is the minimization of the cost of consumed energy, calculated as a sum of self-generation, annual cost, and cost of electricity consumed from the grid. However, the extra benefits from selling excess electricity are not included in the study. The flowchart of the model is presented in Figure 1. The main feature of this model is its flexibility and its expandability with use of additional technologies.

2.1. Input Data for System Optimization

The energy model is built on various types of datasets and constraints [23]:
  • Historical dataset in the spatial resolution of 0.45° × 0.45° and hourly time resolution for direct and diffuse solar radiation, precipitation amounts, and wind speeds taken from NASA databases [30,31] and reprocessed by the German Aerospace Center [32].
  • For every sub-region, synthetic load data is available on an hourly basis and is based on local data such as gross domestic product, population, temperature, and power plant structure.
  • The required technical characteristics of all the used energy generation, storage, and transmission technologies.
  • Financial assumptions such as capital expenditures, operational expenditures, and generation ramping costs of all the technologies.
  • The cost of electricity for residential, commercial, and industrial consumers.
  • Constraints for the minimum and maximum installed capacities for all technologies.
  • Configuration of regions and interconnections.
According to Gerlach et al. [33] and Huld et al. [34], the feed in time series was calculated for fixed optimally tilted solar photovoltaic (PV) systems. For single-axis north–south-oriented continuous horizontal tracking, the calculation was based on Duffie and Beckmann [35]. The calculations for the feed-in time series of wind power plants is analogous to Gerlach et al. [33], for a standard 3 MW wind turbine (E-101 [36]) and hub height of 150 m. Additionally, the method for calculating geothermal energy potential in the sub-regions can be found in Gulagi et al. [37]. For the additional flexible demand sector of seawater desalination, detailed calculations for the technical constraints and financial cost of seawater reverse osmosis (SWRO) desalination are described in Caldera et al. [38]. Data for industrial gas demand were derived for every sub-region. The industrial gas demand data are taken from IEA statistics [39].

2.2. Applied Technologies

All the applied technologies for the simulation of East Asia can be found in the block diagram for the model, which is presented in Figure 2. These technologies are divided into four different categories, which are described below:
  • Technologies for converting renewable energy sources into electricity are ground-mounted (optimally tilted and single-axis north–south-oriented horizontal continuous tracking) and rooftop solar PV systems, concentrating solar thermal power (CSP), onshore wind turbines, hydro power (run-of-river and dams), biomass plants (solid biomass and biogas), waste-to-energy power plants, and geothermal power plants.
  • For the generated renewable energy there are different storage solutions used in this model, from short-term to long-term storage. They are batteries, pumped hydro storage (PHS), adiabatic compressed air energy storage (A-CAES), thermal energy storage (TES), and power-to-gas technology. For the synthesis of SNG, PtG includes: water electrolysis, methanation, CO2 scrubbing from air, gas storage, and both combined and open cycle gas turbines (CCGT, OCGT). The process technologies for SNG synthesis have to be operated in synchronization due to the absence of hydrogen and CO2 storage. Additionally, there is a 48-hour biogas buffer storage and part of the biogas can be upgraded to biomethane and injected into the gas storage.
  • The energy bridging technologies used in this model provide the required flexibility to the energy system, thus decreasing the overall cost by reducing curtailment and the use of storage technologies. For example, the gas produced from PtG can be used for industrial gas demand rather than storage for the electricity sector. Similarly, seawater reverse osmosis (SWRO) desalination provides clean water with the use of renewable electricity.
  • The power transmission between the sub-regions is assumed to be based on high-voltage direct current (HVDC) lines and cables, which are included in the model. However, power transmission within the sub-regions is based on alternating current (AC) and not included in the model. The major component of the power losses in the HVDC lines is due to the length of the transmission lines and in converter stations at the interconnection with the AC grids.

2.3. LNG Value Chain

Hybrid PV-Wind based SNG generated by PtG plants in Australia can be transferred to Japan or Korea via a LNG value chain. In this scenario, a natural gas storage tank is needed to balance the availability of SNG for the liquefaction plant, in order to minimize the costs of the system. As shown for the LNG value chain in Figure 3, SNG is firstly cooled down to −162 °C at atmospheric pressure in a liquefaction plant in order to convert it to a liquid phase [40]. The liquefied SNG (also called LNG) has 600 times less volume, which makes the shipping easier and cheaper. For that matter, specially designed LNG carriers are used, which can keep the LNG in a liquid phase for the long trips with an evaporation (boil-off gas) rate of about 0.1% of volume per day. The boil-off gas can be used in power production on the LNG carriers. At the destination, the LNG is heated up by seawater to bring it back to the gaseous phase. An availability of 95% is assumed for all three parts of the LNG value chain. The regasified SNG is then injected into the pipelines to get it transported to industrial sites or power plants where gas turbines are located.
Typically, the liquefaction plant represents the major cost in this value chain, due to costs of NG pre-treatments and the corresponding efficiency losses. However, an SNG-based liquefaction plant is significantly higher in efficiency and lower in cost [27]. In general, for a SNG cost of about €80–90/MWhth and a moderate sea distance of about 8000 km, the SNG value chain would add about 17% to the cost of delivered re-gasified SNG at destination. This could still be considerably cheaper than locally generated SNG in Japan or Korea, where there are fewer excellent solar and wind resources and additional land availability constraints.

3. Assumptions for East Asian Regions

3.1. Structure of the Grid and Subdivision of the Region

East Asia is divided into 20 sub-regions. The criteria for the creation of sub-regions are population distribution, electricity consumption, and national electricity grid structures. The sub-regions are formed by combining different countries, regions, and provinces, as shown in Table 2. The different sub-regions and the grid connection between them are shown in Figure 4, which includes interconnections within the countries (shown by solid lines) and between the countries (shown by dotted lines). Also included is the RE-SNG shipping connection between West Australia and Korea (Seoul), Japan (Tokyo), and East China (Shanghai).

3.2. Scenarios for East Asia

The different scenarios are chosen based on energy system development options and level of grid integration:
  • Region-wide scenario, in which the regions are independent of each other and have no interconnections so that the demand for electricity is covered by the respective region’s own generation capacity.
  • Area-wide scenario, in which the energy systems of the regions are fully interconnected.
  • Integrated scenario, area-wide scenario plus SWRO desalination and industrial gas demand, where PtG technology is used not only as a storage option but also for covering the industrial gas demand. This increases the flexibility of the system. In addition to the full geographic integration scenario, individual regions separated according to the limits of NEA and SEA were simulated for studying geographic integration benefits.
  • RE-SNG trading scenario, connection lines between West Australia (liquefaction hub) and East China, Korea, and Japan.

3.3. Financial and Technical Assumptions

The model optimization for the year 2030 is carried out on an assumed cost basis and the state of technology for that particular year. The financial assumptions are given in the Supplementary Materials (Table S1) for all the energy system components. The HVDC transmission lines and converter stations are given as net transmission capacity (NTC) for the year 2030. The weighted average cost of capital (WACC) is set to 7% for all scenarios, but for residential PV prosumers WACC is set to 4% due to lower financial return requirements.
The technical assumptions for the simulation are presented in the Supplementary Materials (Tables S2–S4). The numbers are related to energy to power ratios for storage technologies, efficiency for generation and storage technologies, and power losses in HVDC power lines [41] and converters. Electricity prices for residential, commercial, and industrial consumers for all the countries are taken from Gerlach et al. [42]. The electricity prices for Mongolia and North Korea are assumed to be similar to China. The prices for South Korea are assumed to be similar to Japan. The electricity prices for 2030 are calculated according to the assumption from Gerlach et al. [42] that grid electricity prices rise by 5% per annum for <€0.15/kWh, by 3% per annum for €0.15–0.30/kWh, and by 1% per annum for >€0.30/kWh. The excess electricity generated by the prosumers is assumed to be fed into the grid for a transfer selling price of €0.02/kWh. The prosumers have to satisfy their own annual demand before they can sell electricity to the grid. The financial and technical assumption for the RE-SNG value chain including liquefaction, LNG shipping, and regasification are given in the Supplementary Materials (Table S5).
The potential for biomass resources are taken from the German Biomass Research Centre [43] and divided into three categories: biogas, solid waste, and solid biomass [23]. The costs related to all the biomass resources are calculated using the data from the International Energy Agency [44] and Intergovernmental Panel on Climate Change [45]. The lower heating values of all the biomass fuels are considered. The calculated potentials for biogas, solid waste, solid biomass, and respective costs are provided in the Supplementary Materials (Tables S6 and S7). For the solid fuels used for waste incineration, a gate fee of €50/ton is assumed, which is reflected in the negative cost for the solid waste (Supplementary Materials Table S7).

3.4. Feed-In for Solar and Wind Energy

The feed-in profiles for single-axis tracking PV, optimally tilted PV, solar CSP, and wind energy were calculated according to Bogdanov and Breyer [23]. The calculated full load hours for single-axis tracking PV, optimally tilted PV, solar CSP, and wind power plants are presented in the Supplementary Materials (Table S8). The aggregated profiles of solar PV single-axis tracking and wind energy power generation, normalized to maximum capacity and averaged for East Asia, are presented in Figure 5.

3.5. Upper and Lower Limits on Installed Capacities

The lower and upper limits on all the RE technologies, optimally tilted PV, wind turbines, hydro power, and for pumped hydro storage were calculated according to Bogdanov and Breyer [23]. The data for already installed capacities (lower limits) for optimally tilted PV, wind turbines, hydro power, and pumped hydro storage for East Asian sub-regions are taken from Farfan and Breyer [7]. The summary of the lower limits on already installed capacities in the East Asian sub-regions is given in the Supplementary Materials (Table S9). For hydro power plants and pumped hydro storage, the upper limits on capacities are assumed to be 150% and 200% of the already installed capacities, respectively. The upper limits of all technologies are given in the Supplementary Materials (Table S10). The upper limits for all the other technologies are not specified. However, for biomass residues, biogas, and waste-to-energy plants it is assumed, due to energy efficiency reasons, that the available and specified amount of the fuel, as summarized in the Supplementary Materials (Table S6), is utilized during the year.

3.6. Load

The power load profile for each region in East Asia is calculated as a fraction of the total demand in that particular country based on synthetic load data weighted by the region’s population. The area aggregated load profile for all the sub-regions in East Asia is presented in Figure 6. Solar PV prosumers have a significant impact on the residual load as observed from overall energy demand and maximum load, which are reduced by 17.7% and 9.6%, respectively. The demand for gas in industries and desalination water demand for the regions in East Asia is given in the Supplementary Materials (Table S11).

4. Results

4.1. Cost of an Optimized Energy System

An optimized energy system is obtained for each scenario assumed in this study, which is characterized by optimized installed capacities for RE electricity generation, storage, and transmission for every technology used in the model, which in turn leads to hourly generation of electricity, charging and discharging of storage technologies, import and export of electricity between regions or countries, and curtailment. The key average financial results for the different scenarios are presented in Table 3. The key numbers represent total system levelized cost of electricity (LCOE) (including PV self-consumption and the centralized system), levelized cost of electricity for primary generation (LCOE primary), levelized cost of curtailment (LCOC), levelized cost of storage technologies (LCOS), levelized cost of transmission (LCOT), total annualized cost, total capital expenditures, total renewables capacity, and total primary generation.
From Table 3, the regional integration benefit can be observed by the reduction of LCOE and total annual costs of the system from the region-wide to area-wide scenario, accounting for 8.3%. The decrease in the LCOE from region-wide to integrated scenario is 20%. The RE-SNG trading scenario gives the lowest cost of electricity and reduces the price by 21% from the region-wide scenario. The RE installed capacities show an increase in the integrated scenarios due to additional demand by the desalination and gas sectors. However, the integrated scenario with SNG trading shows a decrease in installed capacities of RE sources by 2.6% from the integrated scenario due to re-allocation at sites of higher yield that also have to cover the energy demand for the SNG trading, reflected by an increase in generated electricity by 0.7%. The decrease in LCOE is due to the decrease in demand for local storage technologies and importing lower cost energy resources, which also contributes to the slightly lower primary LCOE. The cost of transmitting electricity with HVDC power lines is small in comparison to the cost of storage. Therefore, the total system cost and LCOE are reduced. The LCOE components and the import/export share in the region-wide, area-wide, and integrated scenarios are presented in the Supplementary Materials (Table S12). The share of export is defined as the ratio of net exported electricity to the generated primary electricity of a sub-region and the share of import is defined as the ratio of imported electricity to the electricity demand. The area average is composed of sub-regional values weighted by the electricity demand. The transmission lines decrease the need for storage technologies, since energy shifted in time (storage) can be partially substituted by energy shift in the location. Also, the cost of curtailment is reduced when electricity is transmitted to other sub-regions, as seen in Table 3. Integration of the additional demand sectors for desalination, industrial gas, and RE-SNG trading leads to a decrease in energy storage utilization and a further decrease in primary LCOE. This is observed due to the high flexibility provided by the coupling of different sectors and a decrease in the cost of storage technologies and curtailment. In the case of RE-SNG trading scenario, there is also a decrease in the cost of transmission of electricity, as transmission of electricity is substituted by shipping of gas (Table 3).

4.2. Installed Capacities of All Technologies in an Optimized Energy System

An overview of the installed capacities of all major energy generation and storage technologies can be found in Table 4. The installed capacities of all the renewable energy technologies show a decrease with interconnection via HVDC lines. The increase observed in the integrated scenarios is due to the demand from additional energy sectors. The total installed capacities of PV decrease by 21% from region-wide to area-wide scenario due to efficient use of solar resources available in the region and grid interconnection. The installed capacity for wind shows an increase, as in NEA, due to excellent wind conditions and being the least cost energy source. Comparing the two integrated scenarios, RE-SNG trading reduces demand for PV particularly in Japan and East China due to substitution of local gas production by the gas imports. The increase in wind capacities in the RE-SNG trading scenario, particularly in West Australia is due to the utilization of available excellent wind resources and to overcome the solar PV unavailability at night time. Hydro dams provide the system additional supply side flexibility for balancing intermittent solar PV and wind energy generation and it is observed that the capacities of hydro dams reach the upper limits assumed in this study. However, hydro run-of-river being a rather expensive technology compared to solar PV and wind energy with the assumptions in this study, installed capacities do not increase and stay almost equal to the lower limits. Decrease in utilization of storage technologies is observed as the sub-regions are interconnected. The most significant impact can be observed on A-CAES with installed capacities dropping to zero as the grids are connected; these grids provide a lower cost flexibility to the system than A-CAES to balance the variation of the wind on weekly basis [46]. However, increased wind resources in the RE-SNG scenario and a decrease in electricity imports trigger some utilization of A-CAES.
The installed capacities for all the RE generation and storage technologies for the East Asian sub-regions for the region-wide, area-wide, and integrated scenarios are shown in Figure 7. The total installed capacities of PV exceed 50% of the total RE installed capacities in all the scenarios because of excellent solar resources all over the region and PV is the least cost source of electricity. This can be seen from the hourly profile diagrams for Eastern China and Western Australia regions, where PV generation is quite stable also in winter weeks (Supplementary Materials, Figures S3 and S5). In the northern and southern parts of China, wind turbines are the next preferred choice of technology, due to excellent wind conditions. Export of this wind energy to high-demand centers is cost-effective as wind is the second-cheapest source of electricity. As seen in Figure 7, battery storage dominates in East Asia, particularly in Southeast Asia and the Pacific Rim. It can be seen that in regions with high electricity prices, it is cheaper to install PV and battery systems on residential, commercial, and industrial rooftops and consume the produced electricity. In regions with high wind penetration, long-term gas storage is used to cover the demand in periods of low solar and wind resource availability. The interconnection of different sub-regions has a significant effect on total storage output, with A-CAES playing no role in the area-wide scenario. HVDC lines decrease the need for storage technologies due to the efficient use of low-cost RE resources from other sub-regions. An overview of all the capacities, throughput, and full cycles for the storage technologies used is provided in the Supplementary Materials (Table S13). The aggregated yearly state of charge profile diagrams for battery, PHS, hydro dam, and gas storage is provided in the Supplementary Materials (Figure S8).

4.3. Grid Utilization in East Asia

The utilization of the grid in East Asia seems to be restricted to Northeast Asia and Southeast Asia as individual regions. In Northeast Asia, export and import of electricity is prominent due to high electricity demand, short distances between load centers, and proper utilization of renewable energy resources available in the region. An important observation that can be made in Northeast Asia is the export of electricity from Mongolia, which is negligible in comparison to its available vast wind potential. The LCOE for wind is slightly lower in North China than in Mongolia, so it is one of the major exporting regions. In the regions of Southeast Asia, trading of electricity seems to happen only in the Mekong countries, Indonesia, and Malaysia. There seems to be no benefit of HVDC lines connecting Australia with ASEAN, since there is no transmission of electricity despite much lower primary generation costs in Australia. Local storage technologies are more cost competitive than long HVDC power lines [22]. The same is found for the offered HVDC power line connection of the Philippines to Korea, Japan, China, and Malaysia. The total import and export in the sub-regions of East Asia for the area-wide and integrated scenarios are shown in Figure 8 and Figure 9, respectively. The interregional electricity trade profile between the East Asian regions is shown in the Supplementary Materials (Figure S7). It can be seen that most of the electricity trading is in the winter months due to less solar radiation.
The benefit due to grid integration for a region as big as East Asia is very limited due to long distances of power lines and local storage technologies being cost competitive. A comparison of the key parameters is made with the simulation results of individual regions of Southeast Asia [22] and Northeast Asia [23]. This is presented in Table 5, and shows that the total annual cost of the system is reduced by 0.4% in the area-wide scenario and 0.7% in the integrated scenario for fully geographically integrated East Asia, compared to separated Northeast and Southeast Asia. The LCOE for East Asia is €61.1 and 52.9/MWh for the area-wide and integrated scenarios, respectively. The integration of the two regions does not significantly affect the LCOE. It can be seen that the LCOE for the East Asian region is lower than NEA for both the scenarios.
The regions that benefit most from the integration of Southeast Asia and Northeast Asia are South China and the Mekong countries. A reduction of LCOE by 6% is observed, enabled by the HVDC connection between South China and the Mekong region of Vietnam, Laos, and Cambodia. This was due to the efficient use of the generated electricity and decrease in the use of storage technologies. The hourly profile diagrams for a representative week for South China, which is an exporting region with good wind resources, and the region of Vietnam, Laos, and Cambodia, which profits from interconnection with South China, are shown in the Supplementary Materials (Figures S4 and S6), respectively.

4.4. RE-SNG Trading

The cost of the re-gasified SNG for the three regions, with the assumptions from Fasihi et al. [27], is shown in Table 6. It should be noted that Fasihi et al. [27] do not consider additional demand in the system such as power and desalination. This can have an influence on the final cost of the re-gasified SNG.
The key results of the integrated RE-SNG trading scenario are summarized in Table 7 for the importing and exporting regions. These represent LCOE, levelized cost of local gas (LCOG) production, imported gas, blended gas at importing region, total annualized cost, annual import and export of gas, total electricity demand for producing gas, losses due to curtailment of electricity, losses due to use of turbines, losses in the grid due to import and export, total import of electricity, power-to-gas output, total installed capacities of RE technologies, installed capacities of PV, and wind. These results are compared with the integrated scenario to point out the benefits of the RE-SNG trading. The exporting region is West Australia, which is blessed with abundant solar and wind potential, and the importing regions are East China, Korea, and Japan.
The optimized energy system is obtained for the integrated RE-SNG trading scenario, with the assumptions for the RE-SNG value chain, which is characterized by the optimal mix of RE technologies, gas storage and transportation and electricity transmission. The total annualized cost for East Asia in the RE-SNG trading scenario decreases by 1% compared to the integrated scenario. It can be seen that RE-SNG trading does not add any additional cost to the system and it is beneficial in decreasing the cost of electricity. However, on an individual regional basis, the importing regions show an increase in LCOE due to the additional cost of storage and increase in curtailment, hence fair benefit sharing is required. Australia has the lowest local gas production cost due to the availability of abundant low-cost solar and wind resources in the region. East China has the highest local gas production cost due to higher primary electricity production cost. It can be seen from Table 7 that the local gas production cost of Korea is higher than of Australia and it would be beneficial for Korea to import gas from Australia, but due to additional integration of power sector demand in the system and the main constraint of the system optimization being to minimize the cost of the whole system this does not happen. The cost of the LNG imports is similar for all the importing regions. The total LCOG for Korea is the highest, higher than the local production cost. However, for Japan and East China the total LCOG is lower than the local production cost for those regions. The total annual cost of the system for East Asia decreases by approximately €9 billion annually in the RE-SNG trading scenario in comparison to the integrated scenario. The importing regions benefit the most in terms of reduction of the annual cost of the system due to a decrease in PtG output as gas is readily available from West Australia and also due to a decrease in the import of electricity for producing gas from the neighboring regions. It can be observed in Table 7 that Korea does not import any gas due to the availability of cheap electricity from Northeast China. The RE-SNG trading scenario reduces the electricity demand by 0%–76% in the gas sector depending on the importing region due to a reduction in the PtG output, which is replaced by an increase in the use of low-cost electricity in West Australia for producing gas. The curtailment losses in the system for the RE-SNG trading scenario decreases for the gas importing regions due to proper utilization of the resources available in the region. The installed capacities of gas turbines show an increase in the RE-SNG scenario and in turn increase the efficiency losses due to these turbines (Table 7). The losses due to import of electricity are reduced in the RE-SNG trading scenario due to a decrease in import of electricity in the gas-importing regions, as electricity imports are replaced by imports of gas.

4.5. Energy Flow for the Optimized Energy System for East Asia

The findings of this study for an integrated scenario from generation to demand are presented in an energy flow diagram (Figure 10). The energy flow diagram consists of RE resources, storage technologies, and transmission of this energy via HVDC grids. The end use of electricity for the integrated scenario consists of power, desalination, and industrial gas demand. The losses incurred in the system are divided into losses, which are comprised of efficiency and grid losses, and the potential usable heat from biomass, biogas, and waste-to-energy power plants, heat generated from electrolyzers for transforming power to hydrogen, the methanation process transforming hydrogen to methane, and the methane-to-power conversion in gas turbines. The energy flow diagrams for region-wide and area-wide scenarios are presented in the Supplementary Materials (Figures S1 and S2), respectively.

5. Discussion

It is observed that the total levelized cost of electricity in East Asia decreased by 20.2% from the region-wide to integrated scenario and the total annual cost of the system decreased by 8.3% from the region-wide to area-wide scenario. The cost incurred due to installation of HVDC lines in the area-wide scenario is overcompensated for by a decrease in installed capacities of renewable energy generation and storage, which enables a decrease of respective efficiency losses. Import of low-cost electricity from different regions also enables a decrease in curtailment of electricity. The increase in the total system cost in the integrated scenario is due to the additional demand sectors of seawater desalination and industrial gas demand, for which the system installs additional RE capacities. In the case of the integrated RE-SNG trading scenario, the total annualized cost of the system decreased by 1% from the integrated scenario. The RE-SNG value chain cost does not increase the total cost of the total area due to efficient use of available resources, a decrease in electricity imports for gas production, a decrease in the losses in the system, and a decrease in the use of gas storage in the area.
The impact of connecting different regions with HVDC power lines can be observed in the decrease in the total levelized cost of electricity. The integration of SEA and NEA does not create any substantial additional benefit to the system, since the costs are reduced by 0.4%–0.7%, depending on the scenario. The impact is limited to regions that are not far apart and where local storage technologies are more expensive than the transmission of electricity. Due to long distances and local storage technologies being more cost-competitive, low-cost RE from Australia cannot be exported to high demand centers in Indonesia and further into China due to high transmission costs. The increasing cost competitiveness of storage compared to grids had already been found for Northeast Asia [47]. However, according to research done by Taggart et al. [4,18], large scale connectivity of different regions would cancel out the need for large-scale storage technologies, to which the authors of this research agree to some extent, since such an effect can be observed in the decrease in need for storage technologies from the region-wide to the area-wide scenario. Additionally, the storage demand is only reduced by 25% and not substituted entirely. According to Zenya and Blakers et al. and [20,21], transmission of electricity would be beneficial from Australia to China and Asia but the findings from this research contradict these expectations because they have not anticipated the low-cost potential of storage technologies against the cost of transmission of electricity from Australia to China. In addition, a full hourly resolution enables a much better matching of the various flexibility options and the complementarity of the solar and wind resources. Our findings suggest that local storage technologies are more cost-effective than transmission of electricity over distances of thousands of kilometers. A similar finding had been observed for the integration of the regions of Europe, Eurasia and MENA, for which the integration benefit was 1.3% [48]. East Asia and EuropeEurasiaMENA show the same characteristic, that a deep integration from a region-wide to an area-wide integration within a region is highly beneficial in the range of 5%–16%, since this had been found for all five major regions involved: Northeast Asia (11%) [23], Southeast Asia (5%) [22], Europe (11%) [49], Eurasia (16%) [50], and MENA (10%) [51]), but not for an integration of two neighboring major regions. Very long power lines between 1500 and 2000 km or more do not generate financial benefits, as found so far for Northeast Asia [47]. Other limiting factors include an inability to integrate the vast wind resource potential of Northwest Russia for Europe [52], utilize excellent solar and wind resources in the Maghreb region for synthetic fuel production [53], and connect Australia to East Asia, as shown in this article. The main reason in all the above cases is the same: the costs related to the transmission of low-cost solar and wind electricity are too high compared to local energy storage for the case of very long power lines.
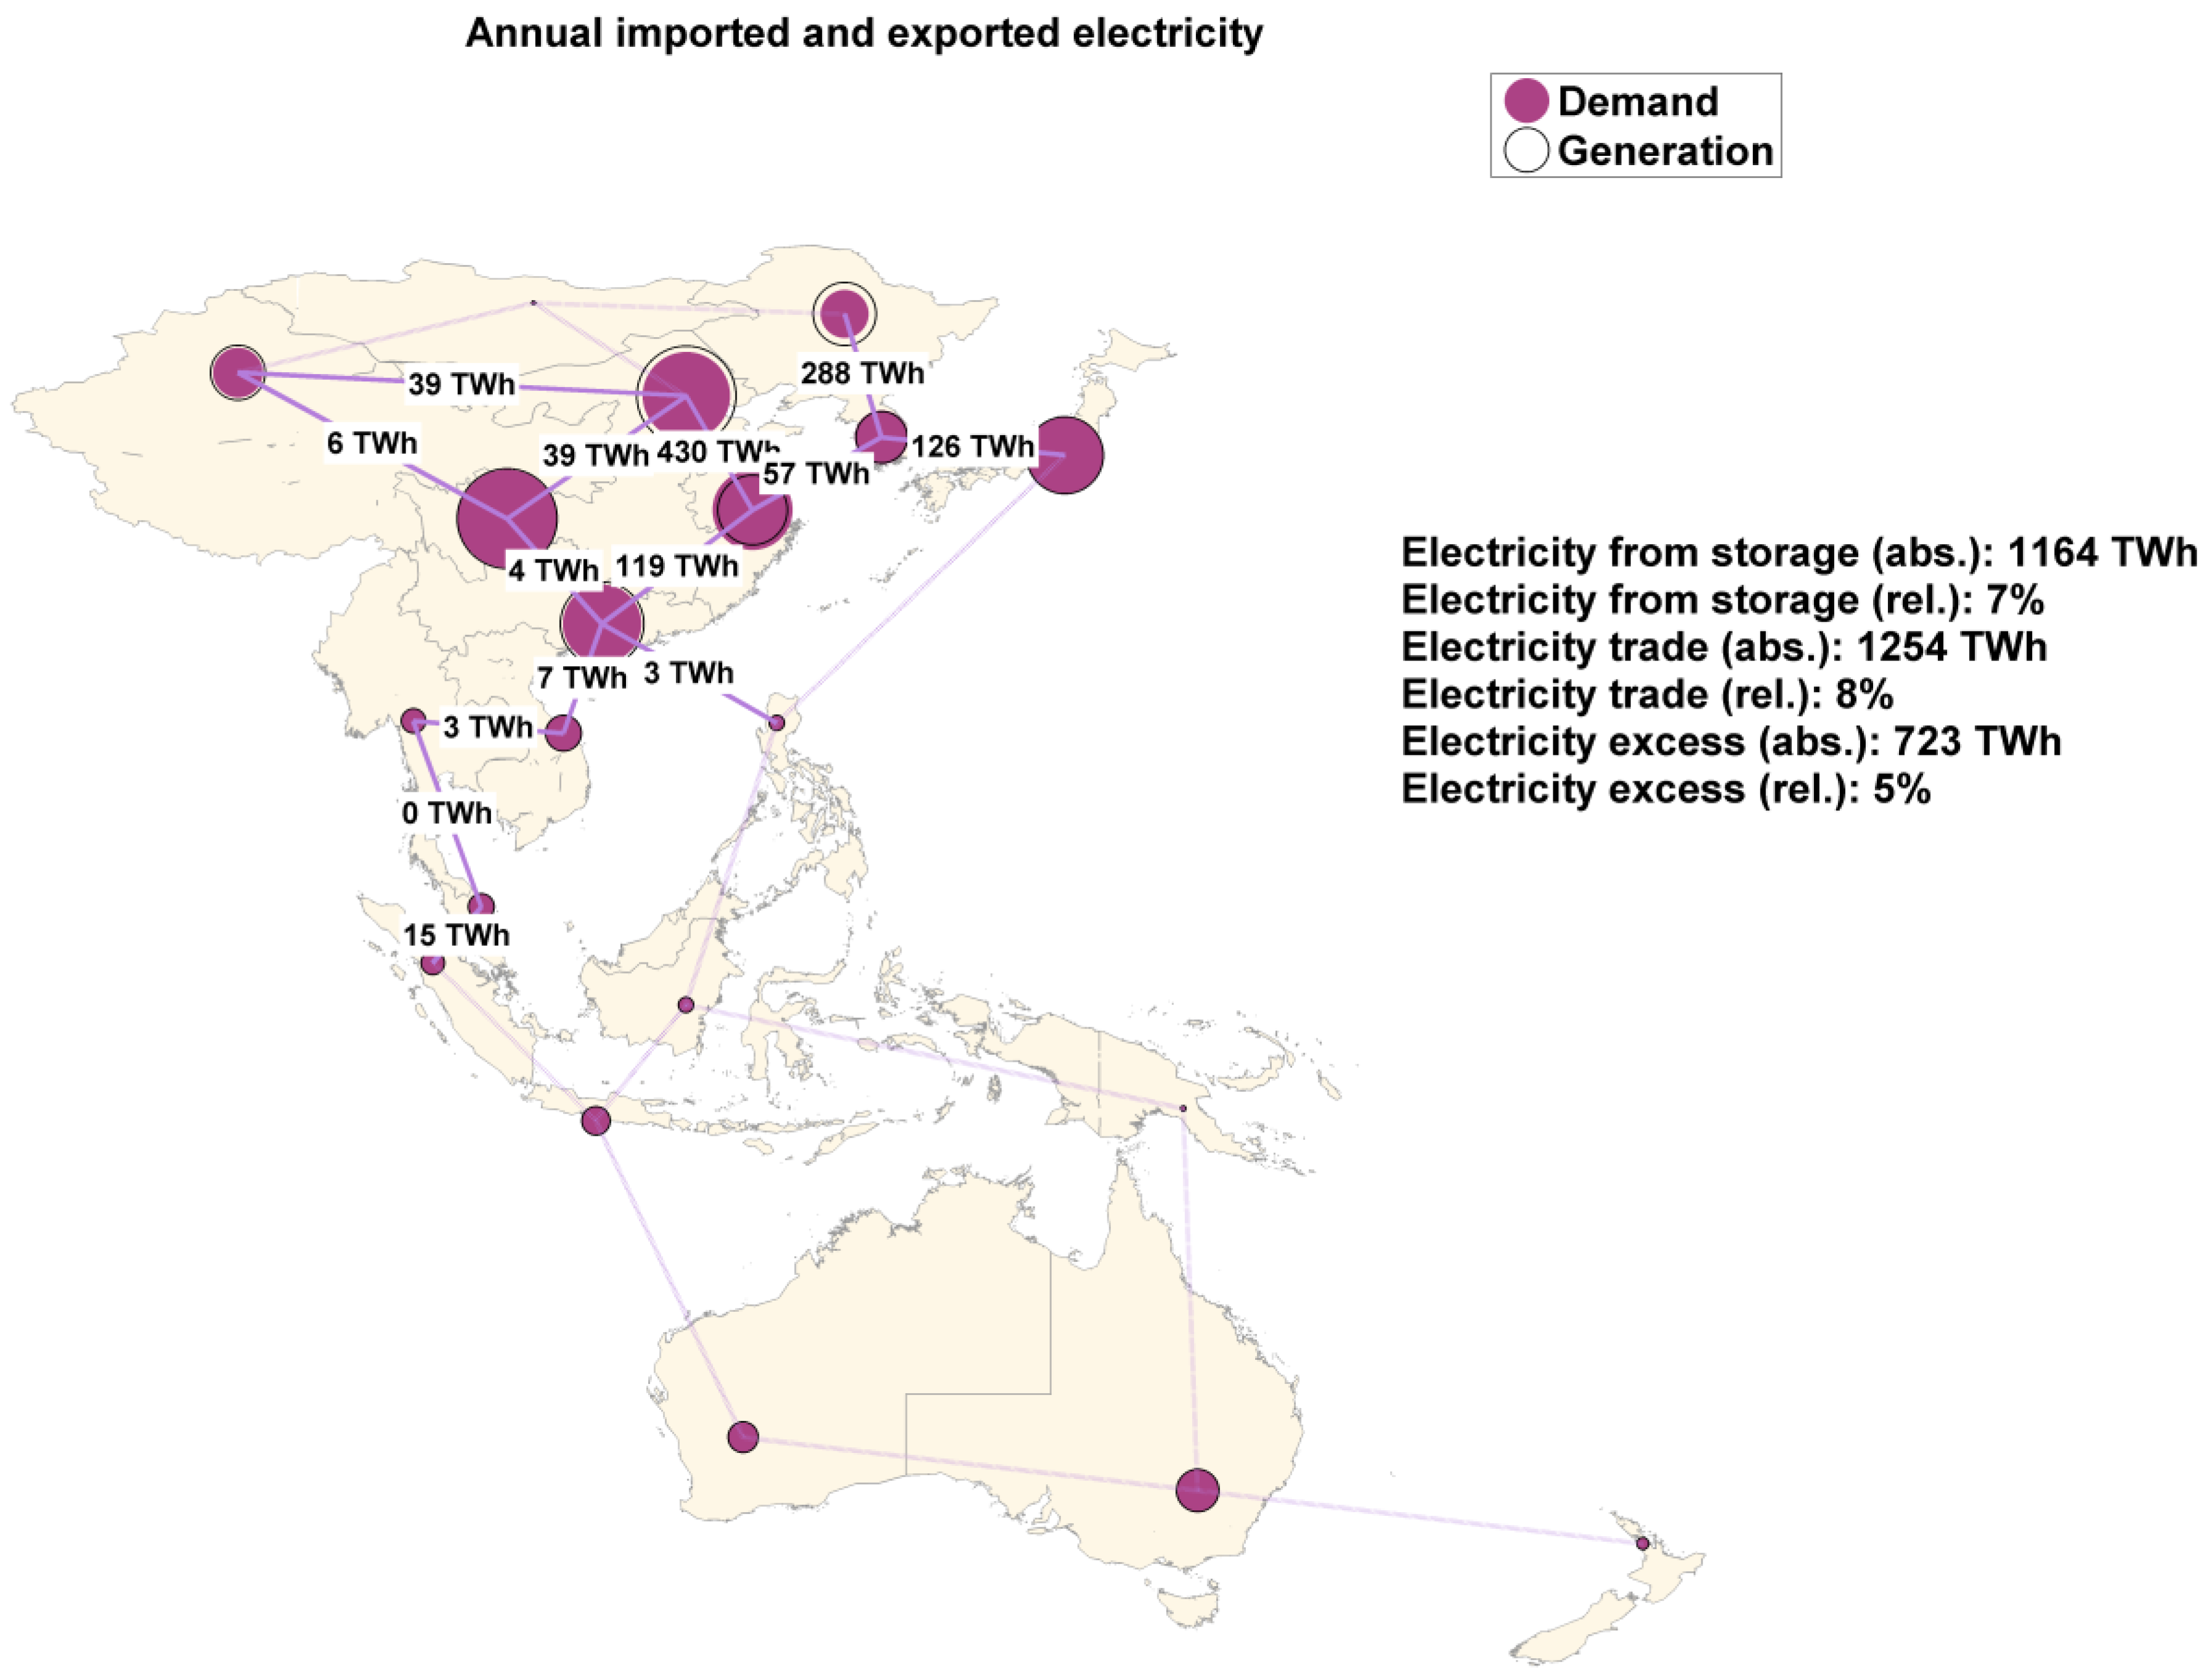
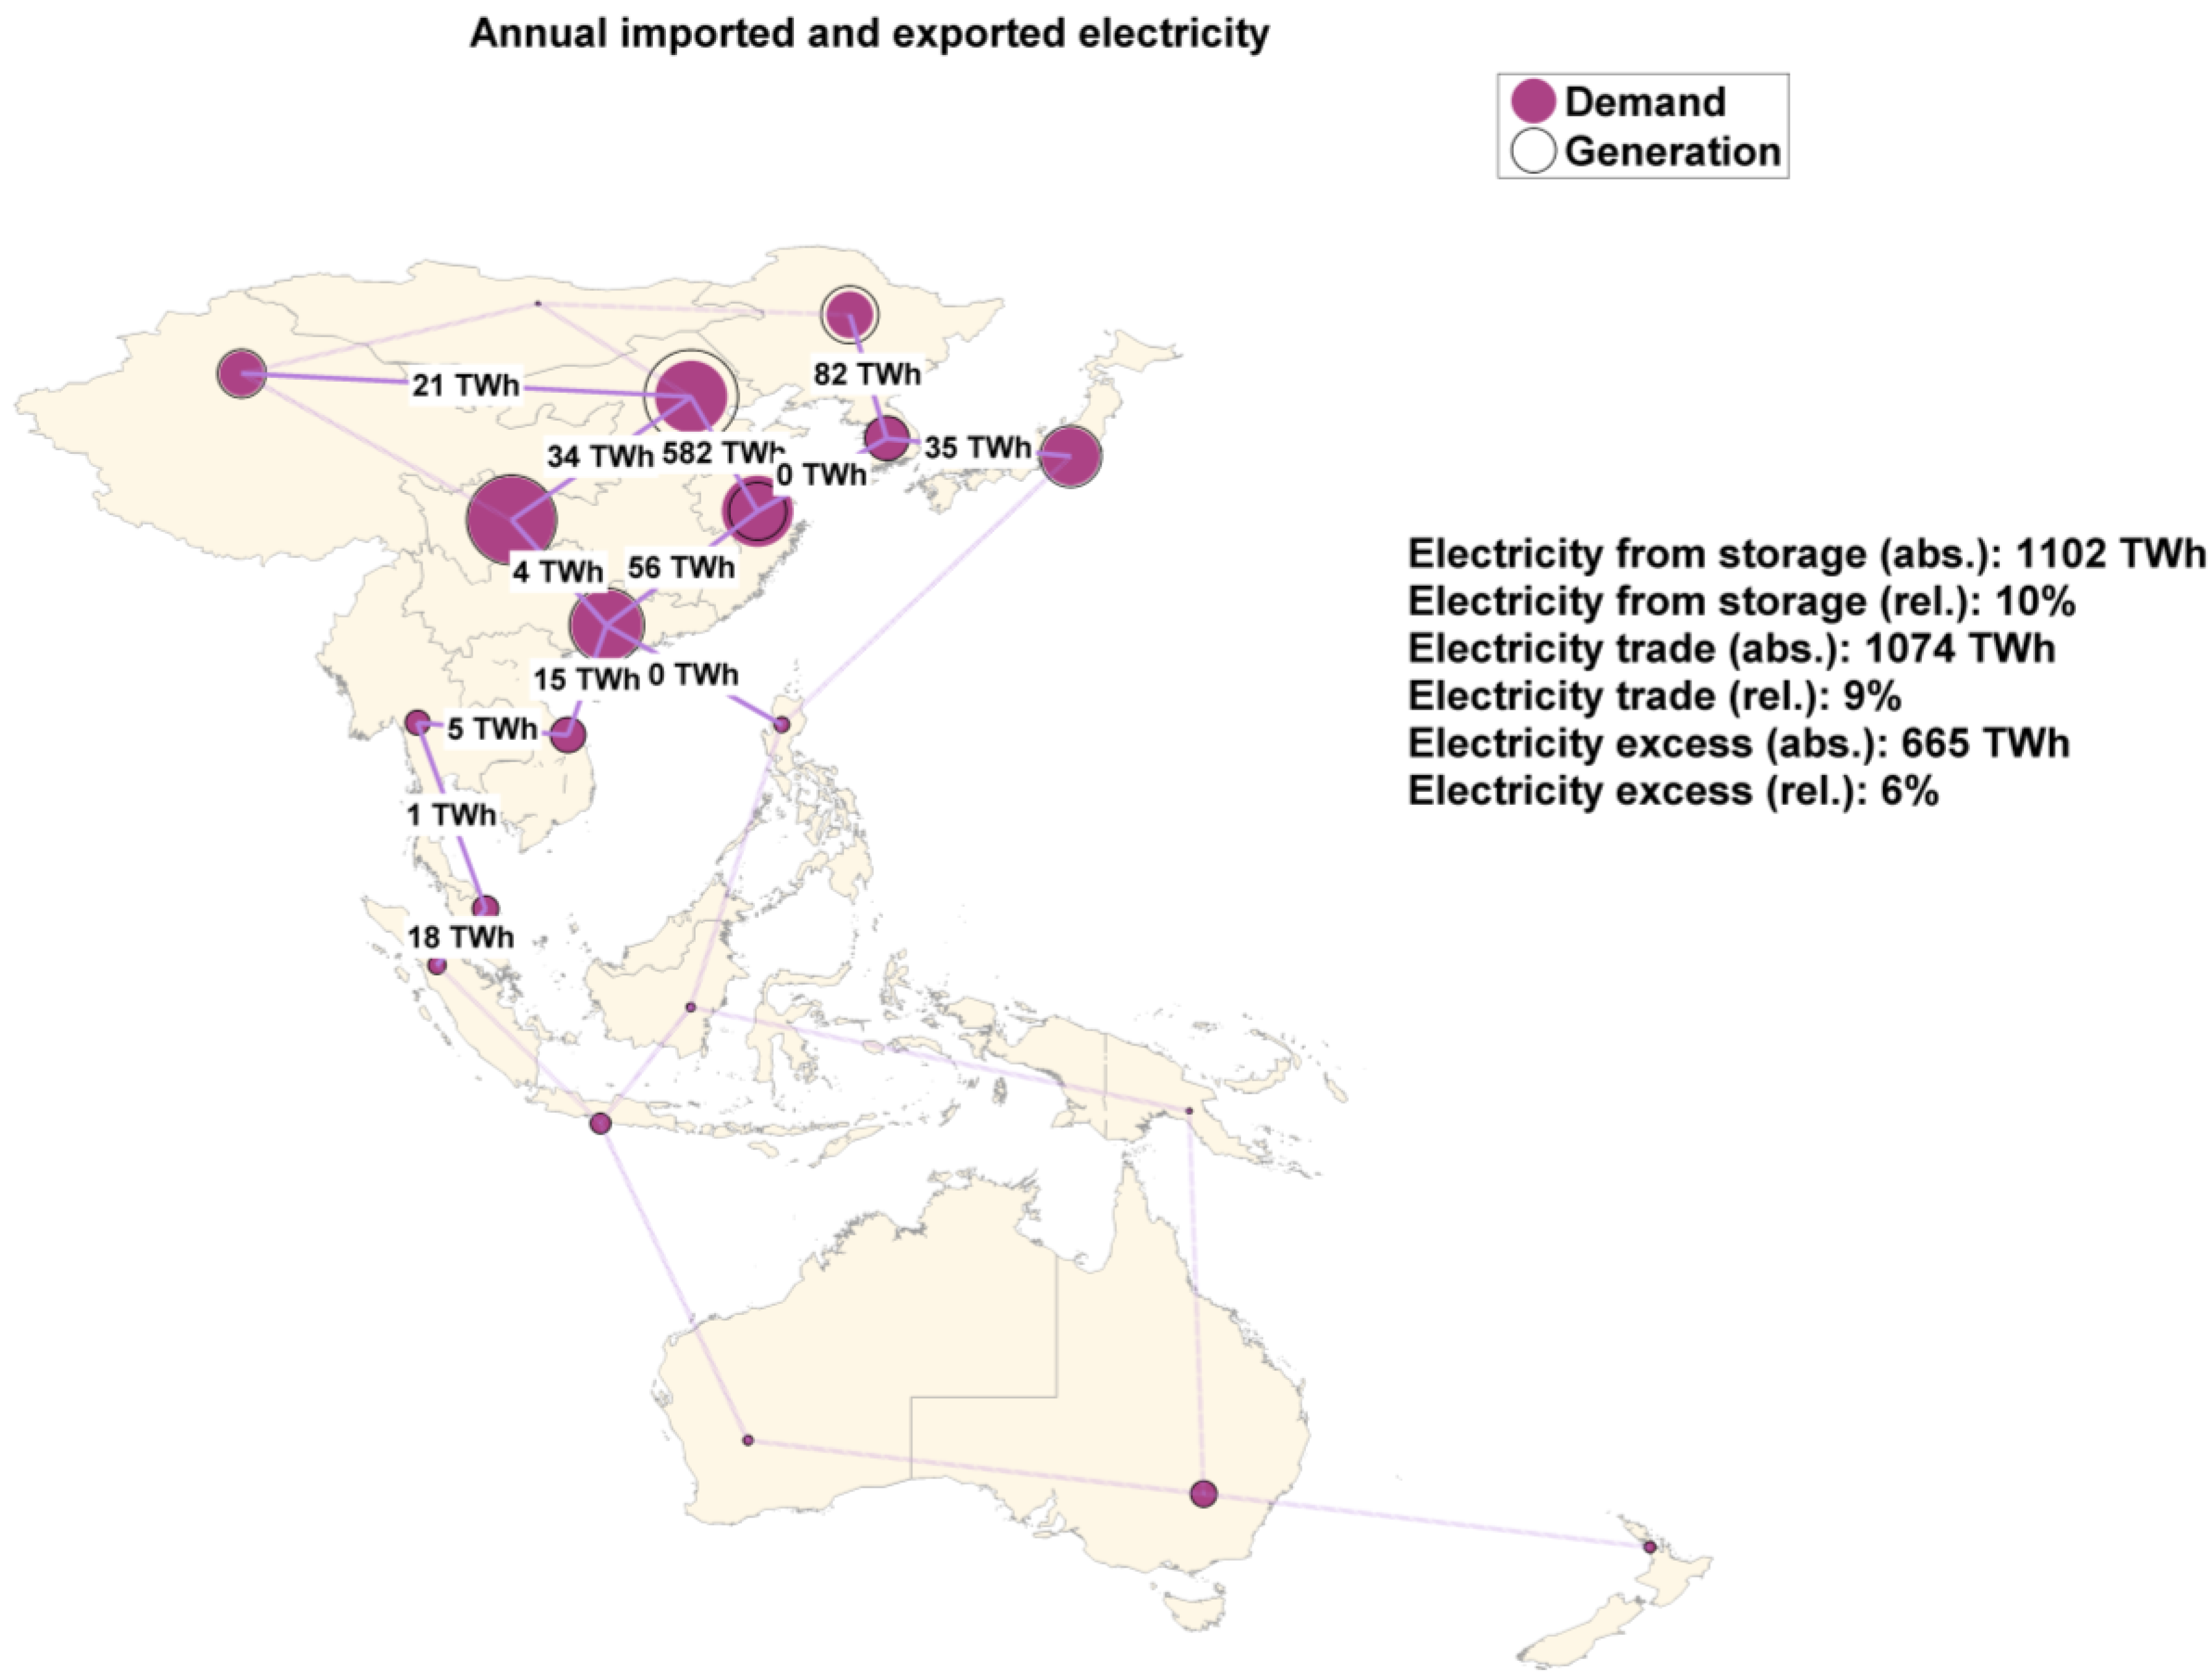
However, from this research the authors have found that long-distance shipping of RE-SNG is cost-effective for some regions, in this case for East China and Japan, due to low primary electricity generation costs in West Australia, the comparably low additional cost of about 17% for the LNG value chain (liquefaction, shipping and re-gasification), and the high cost of local gas production. Some regions, in this case Korea, do not benefit from such a trading connection due to favorable economics for local gas production and electricity imports from neighboring regions. As the main aim of the optimization is to minimize the total annual system cost for the entire area, the least cost system is obtained without imports to Korea and limited imports to East China and Japan.
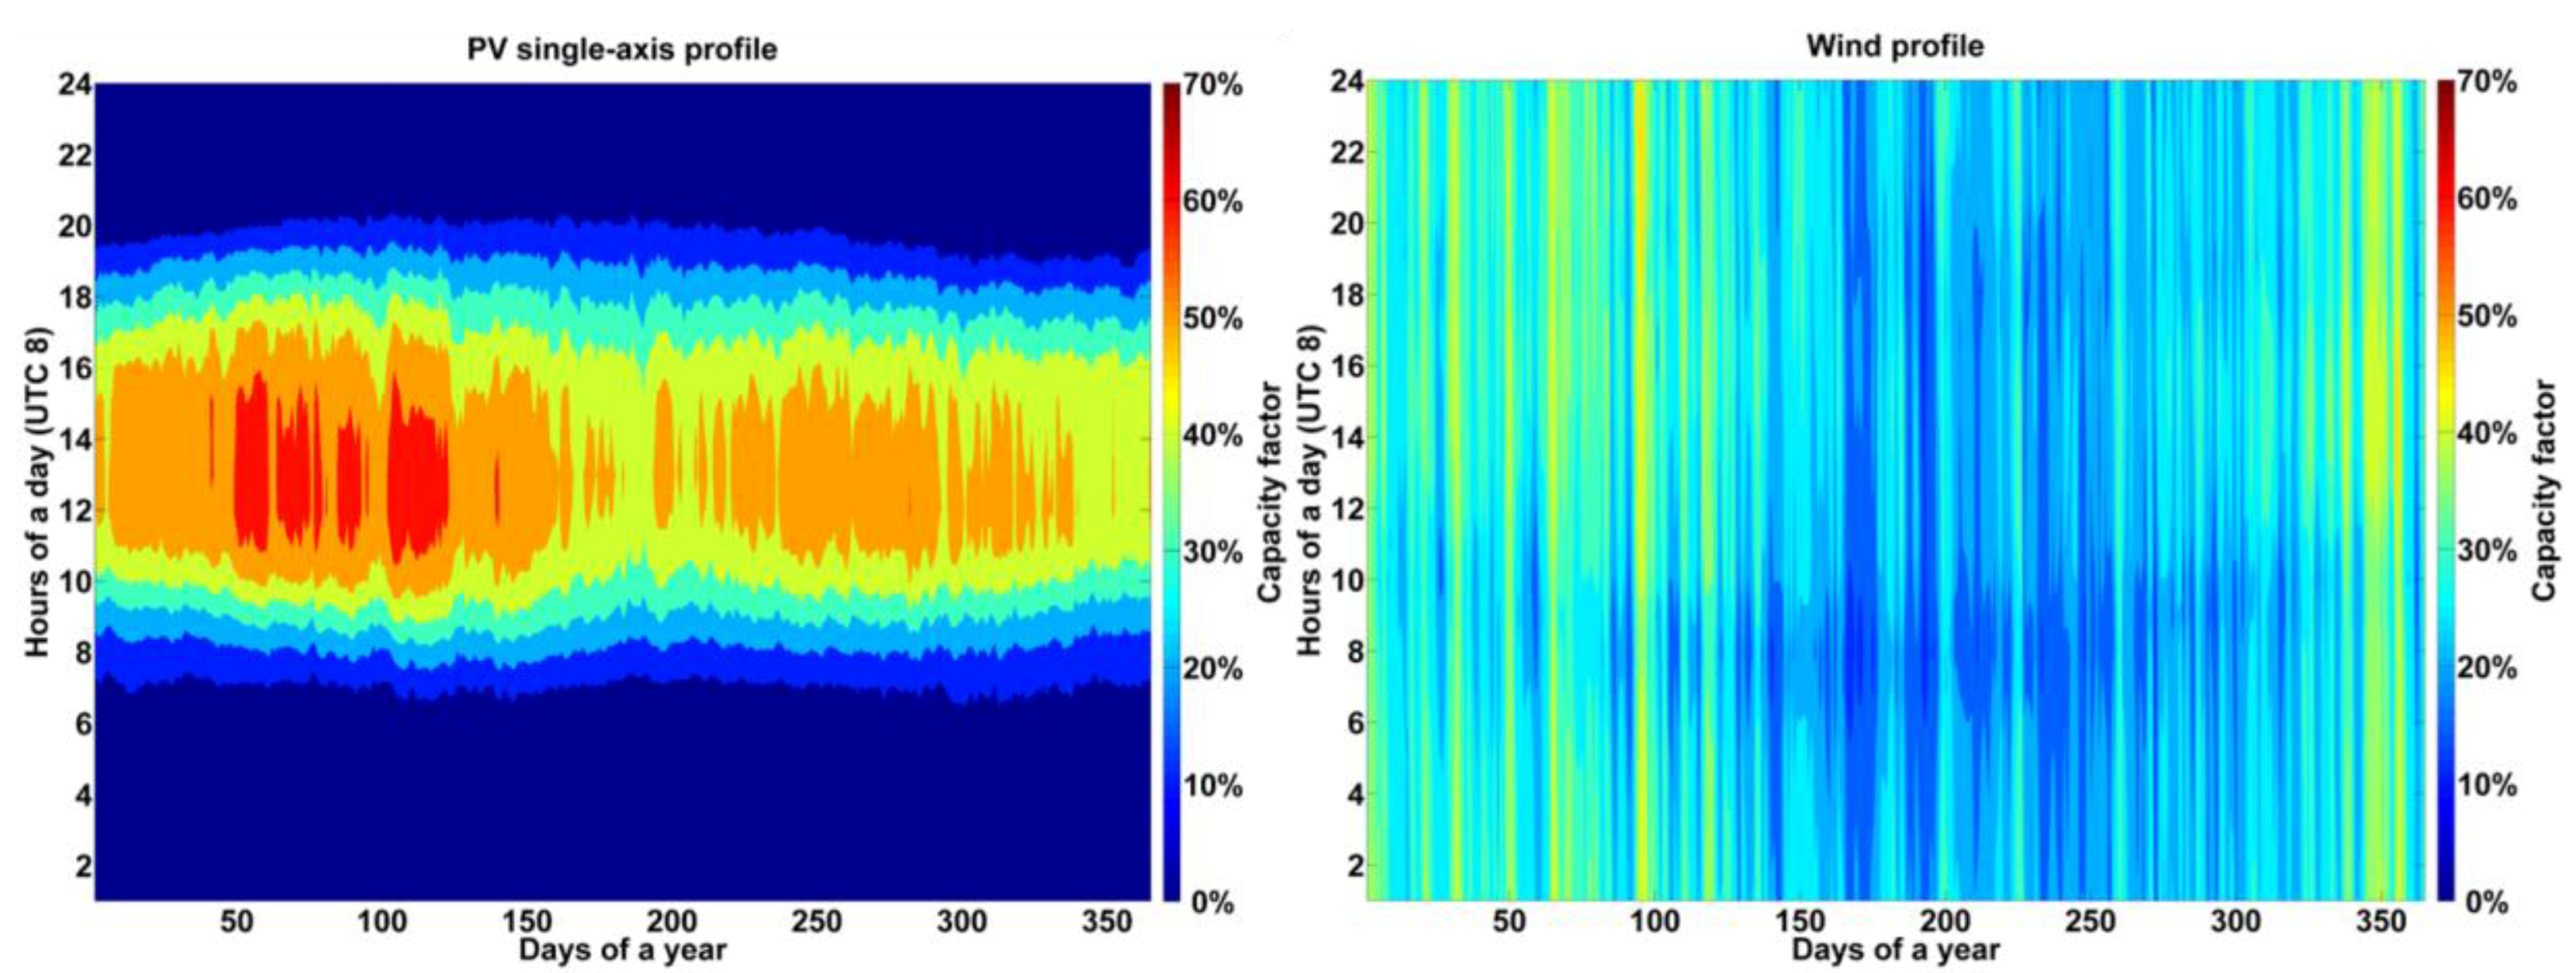
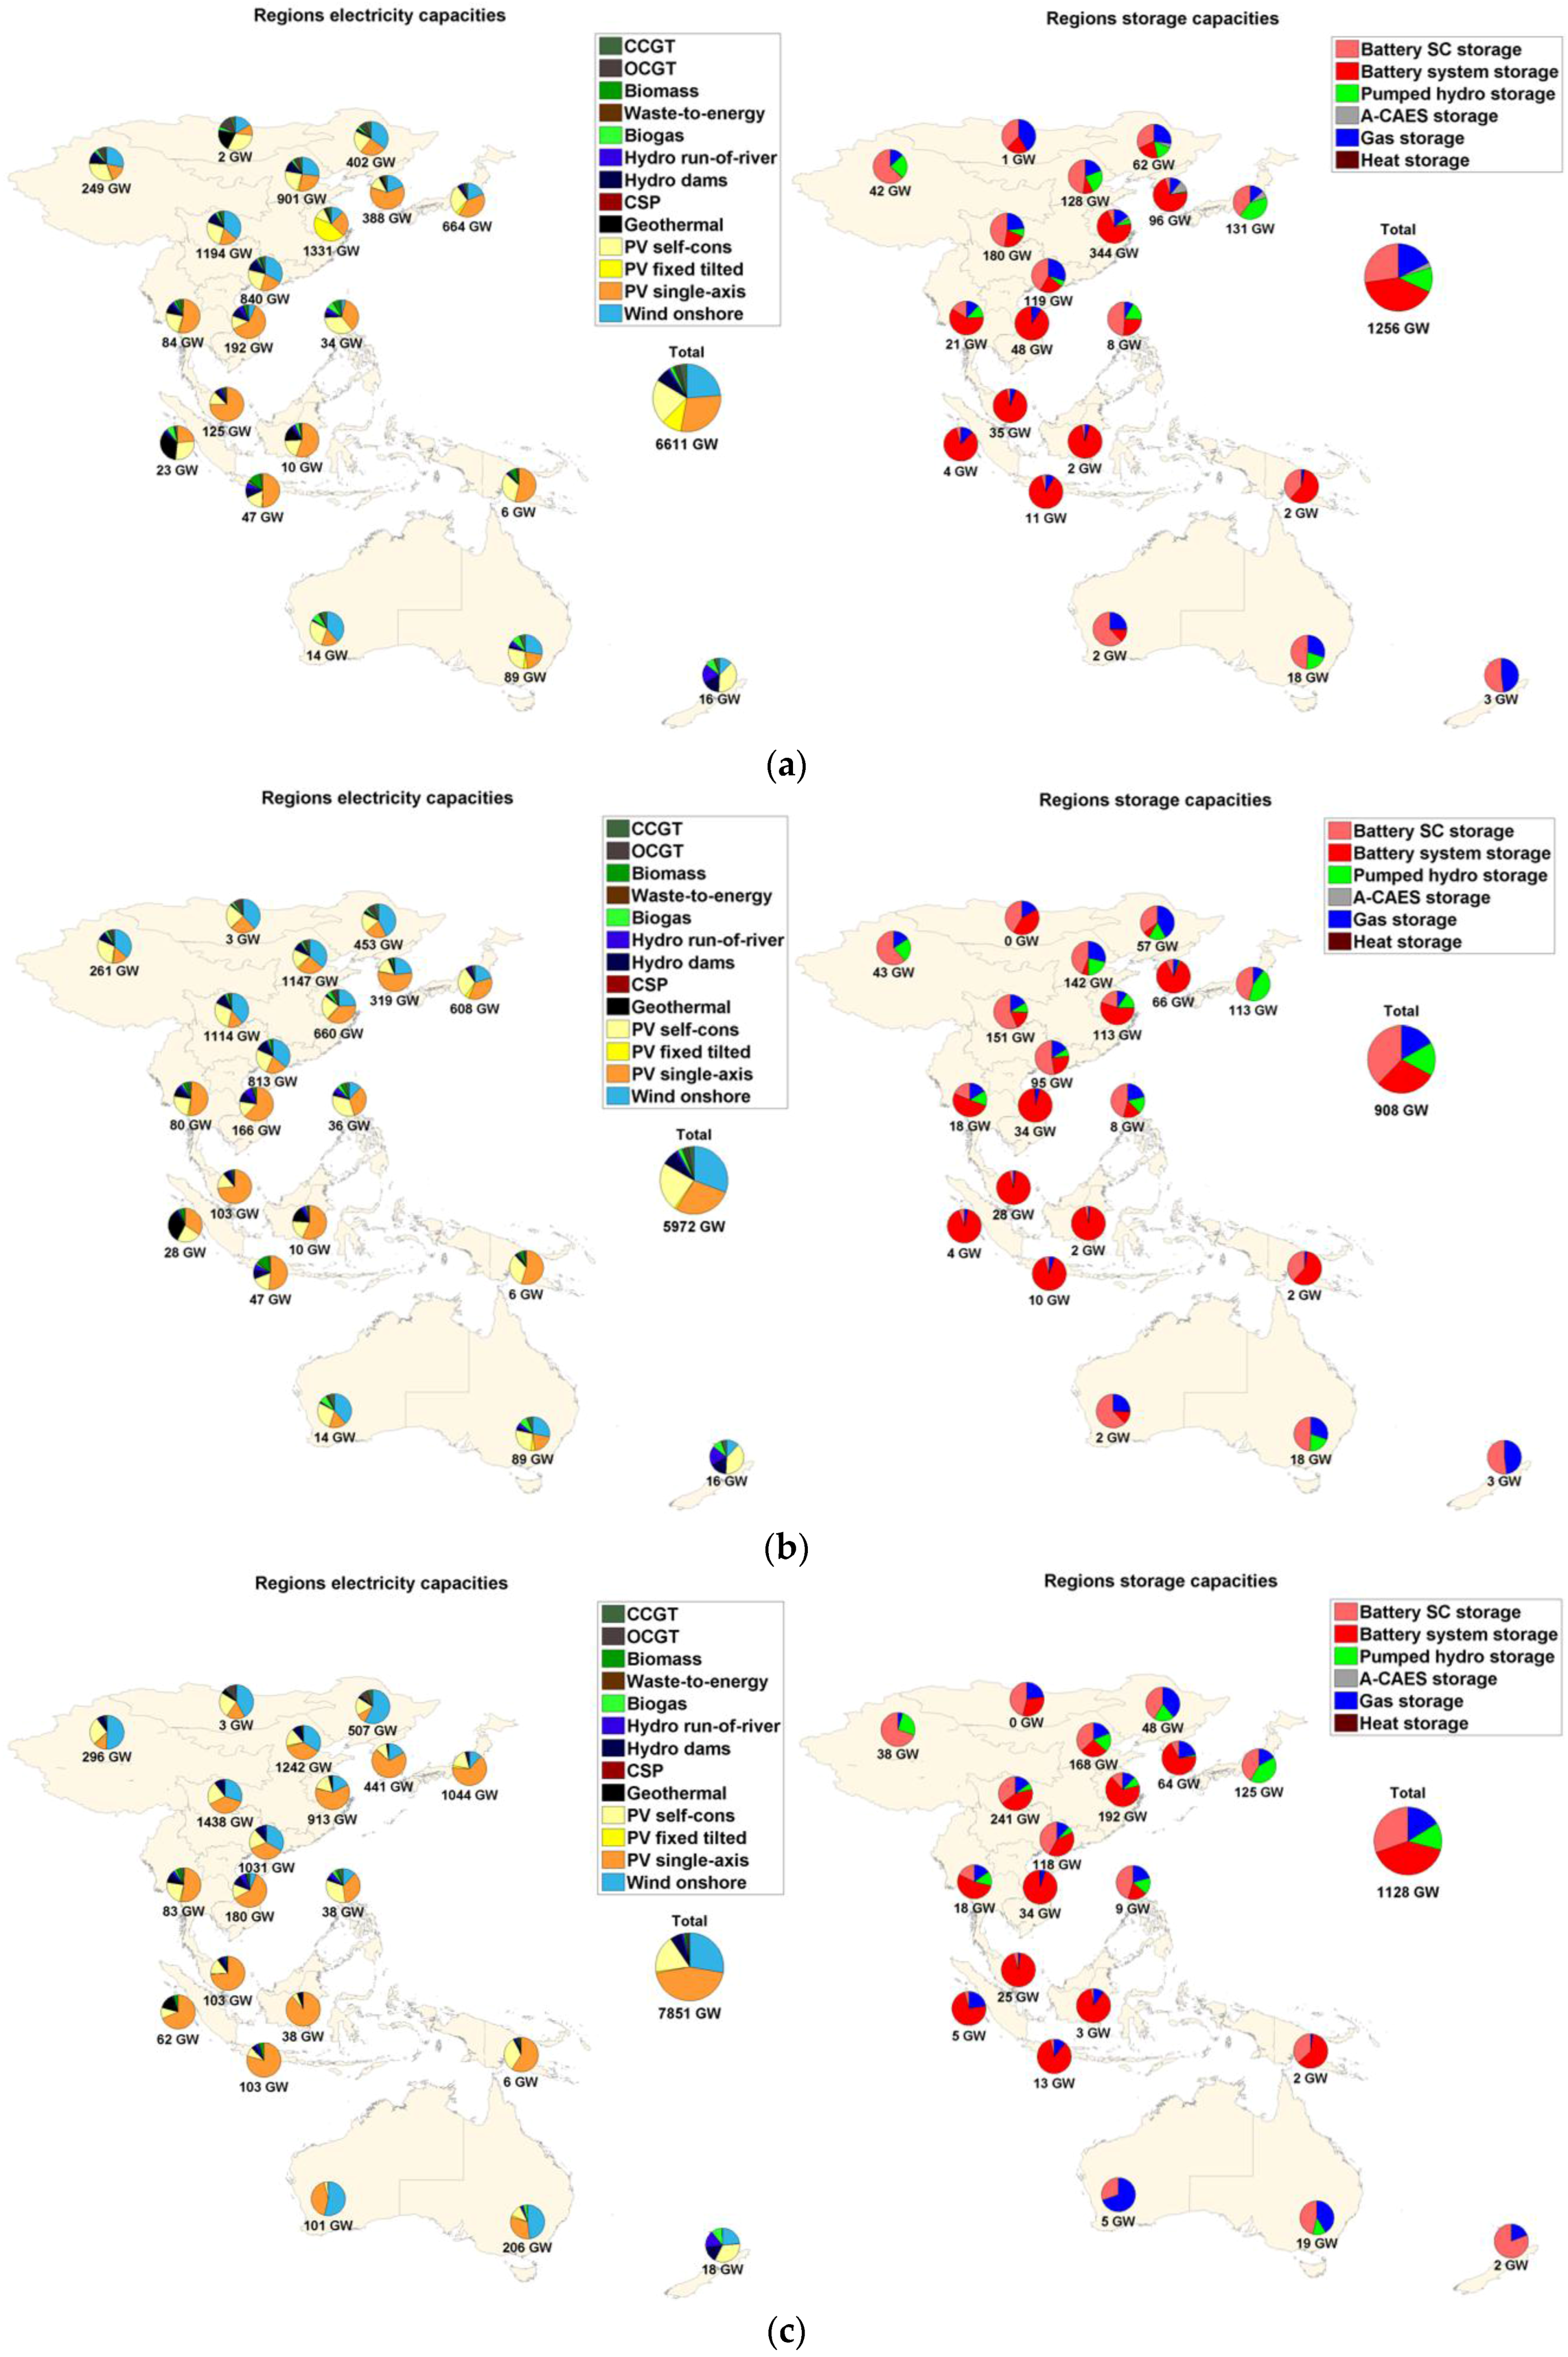
PV technologies play an important role in the East Asian region, especially in Southeast Asia, due to good solar irradiation most of the year and PV being the least cost source of electricity in most of Southeast Asia. In Northeast Asia, wind energy plays an equally important role in periods of low solar irradiation, especially in the northern and eastern parts of China, as wind energy is the second-cheapest electricity source and is ideal for use in winter and periods of low solar radiation. According to the Advanced Energy [R]evolution transition scenario [19] for 2030 by Greenpeace, solar PV will have the highest share of the installed capacities of renewables, with wind complementing during periods of low solar radiation. However, fossil fuels will still be present in the energy generation mix. According to this research, a 100% sustainable low-cost energy system is possible for 2030, with solar PV and wind playing a major role.
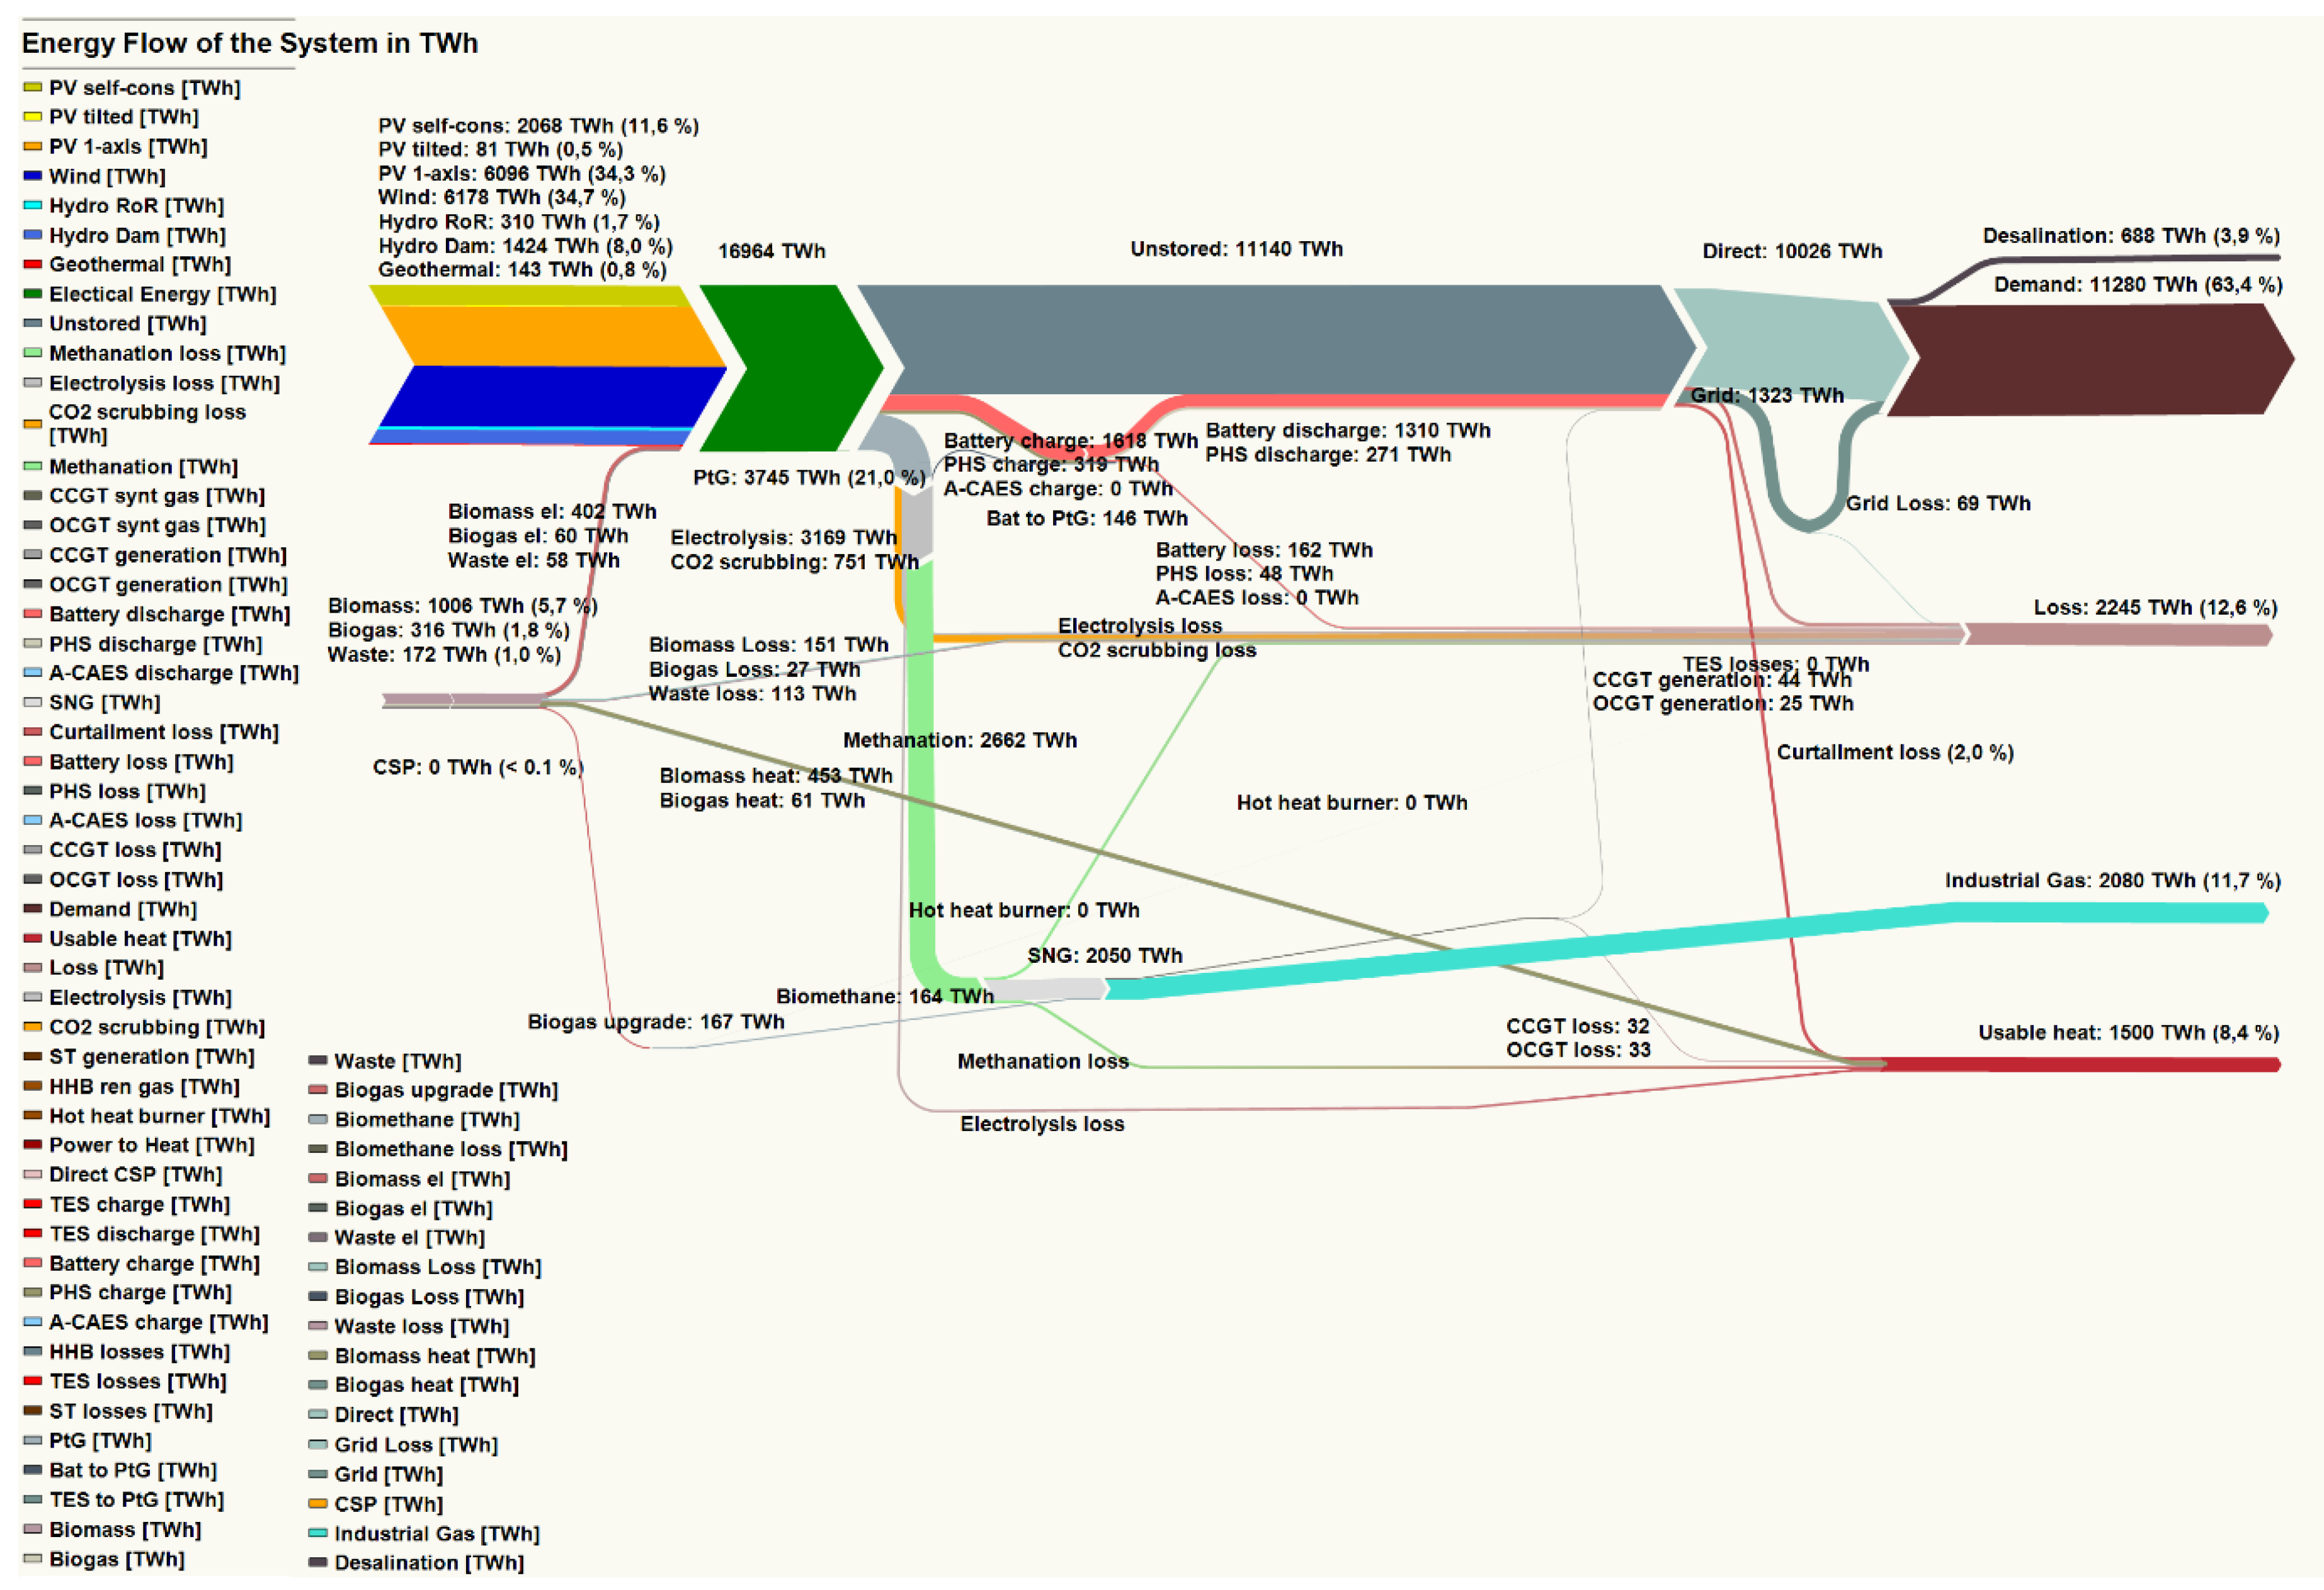
The storage requirements for East Asia are mainly based on batteries (59% of the total storage throughput), with prosumer batteries having a significant share in regions with high prosumer PV installations (41% of the total battery throughput is represented by prosumer batteries). In Southeast Asia, due to a high influence of solar PV into the system, batteries play a vital role on a daily basis, providing electricity for the evening peak load. In Northeast Asia, for regions with high wind energy penetration into the system, gas storage is used as a long-term storage, as it helps store wind energy and discharges in periods of low solar and wind energy resource availability. The output of batteries and gas storage is between 59%–78% and 7%–28% of the total stored electricity, respectively.
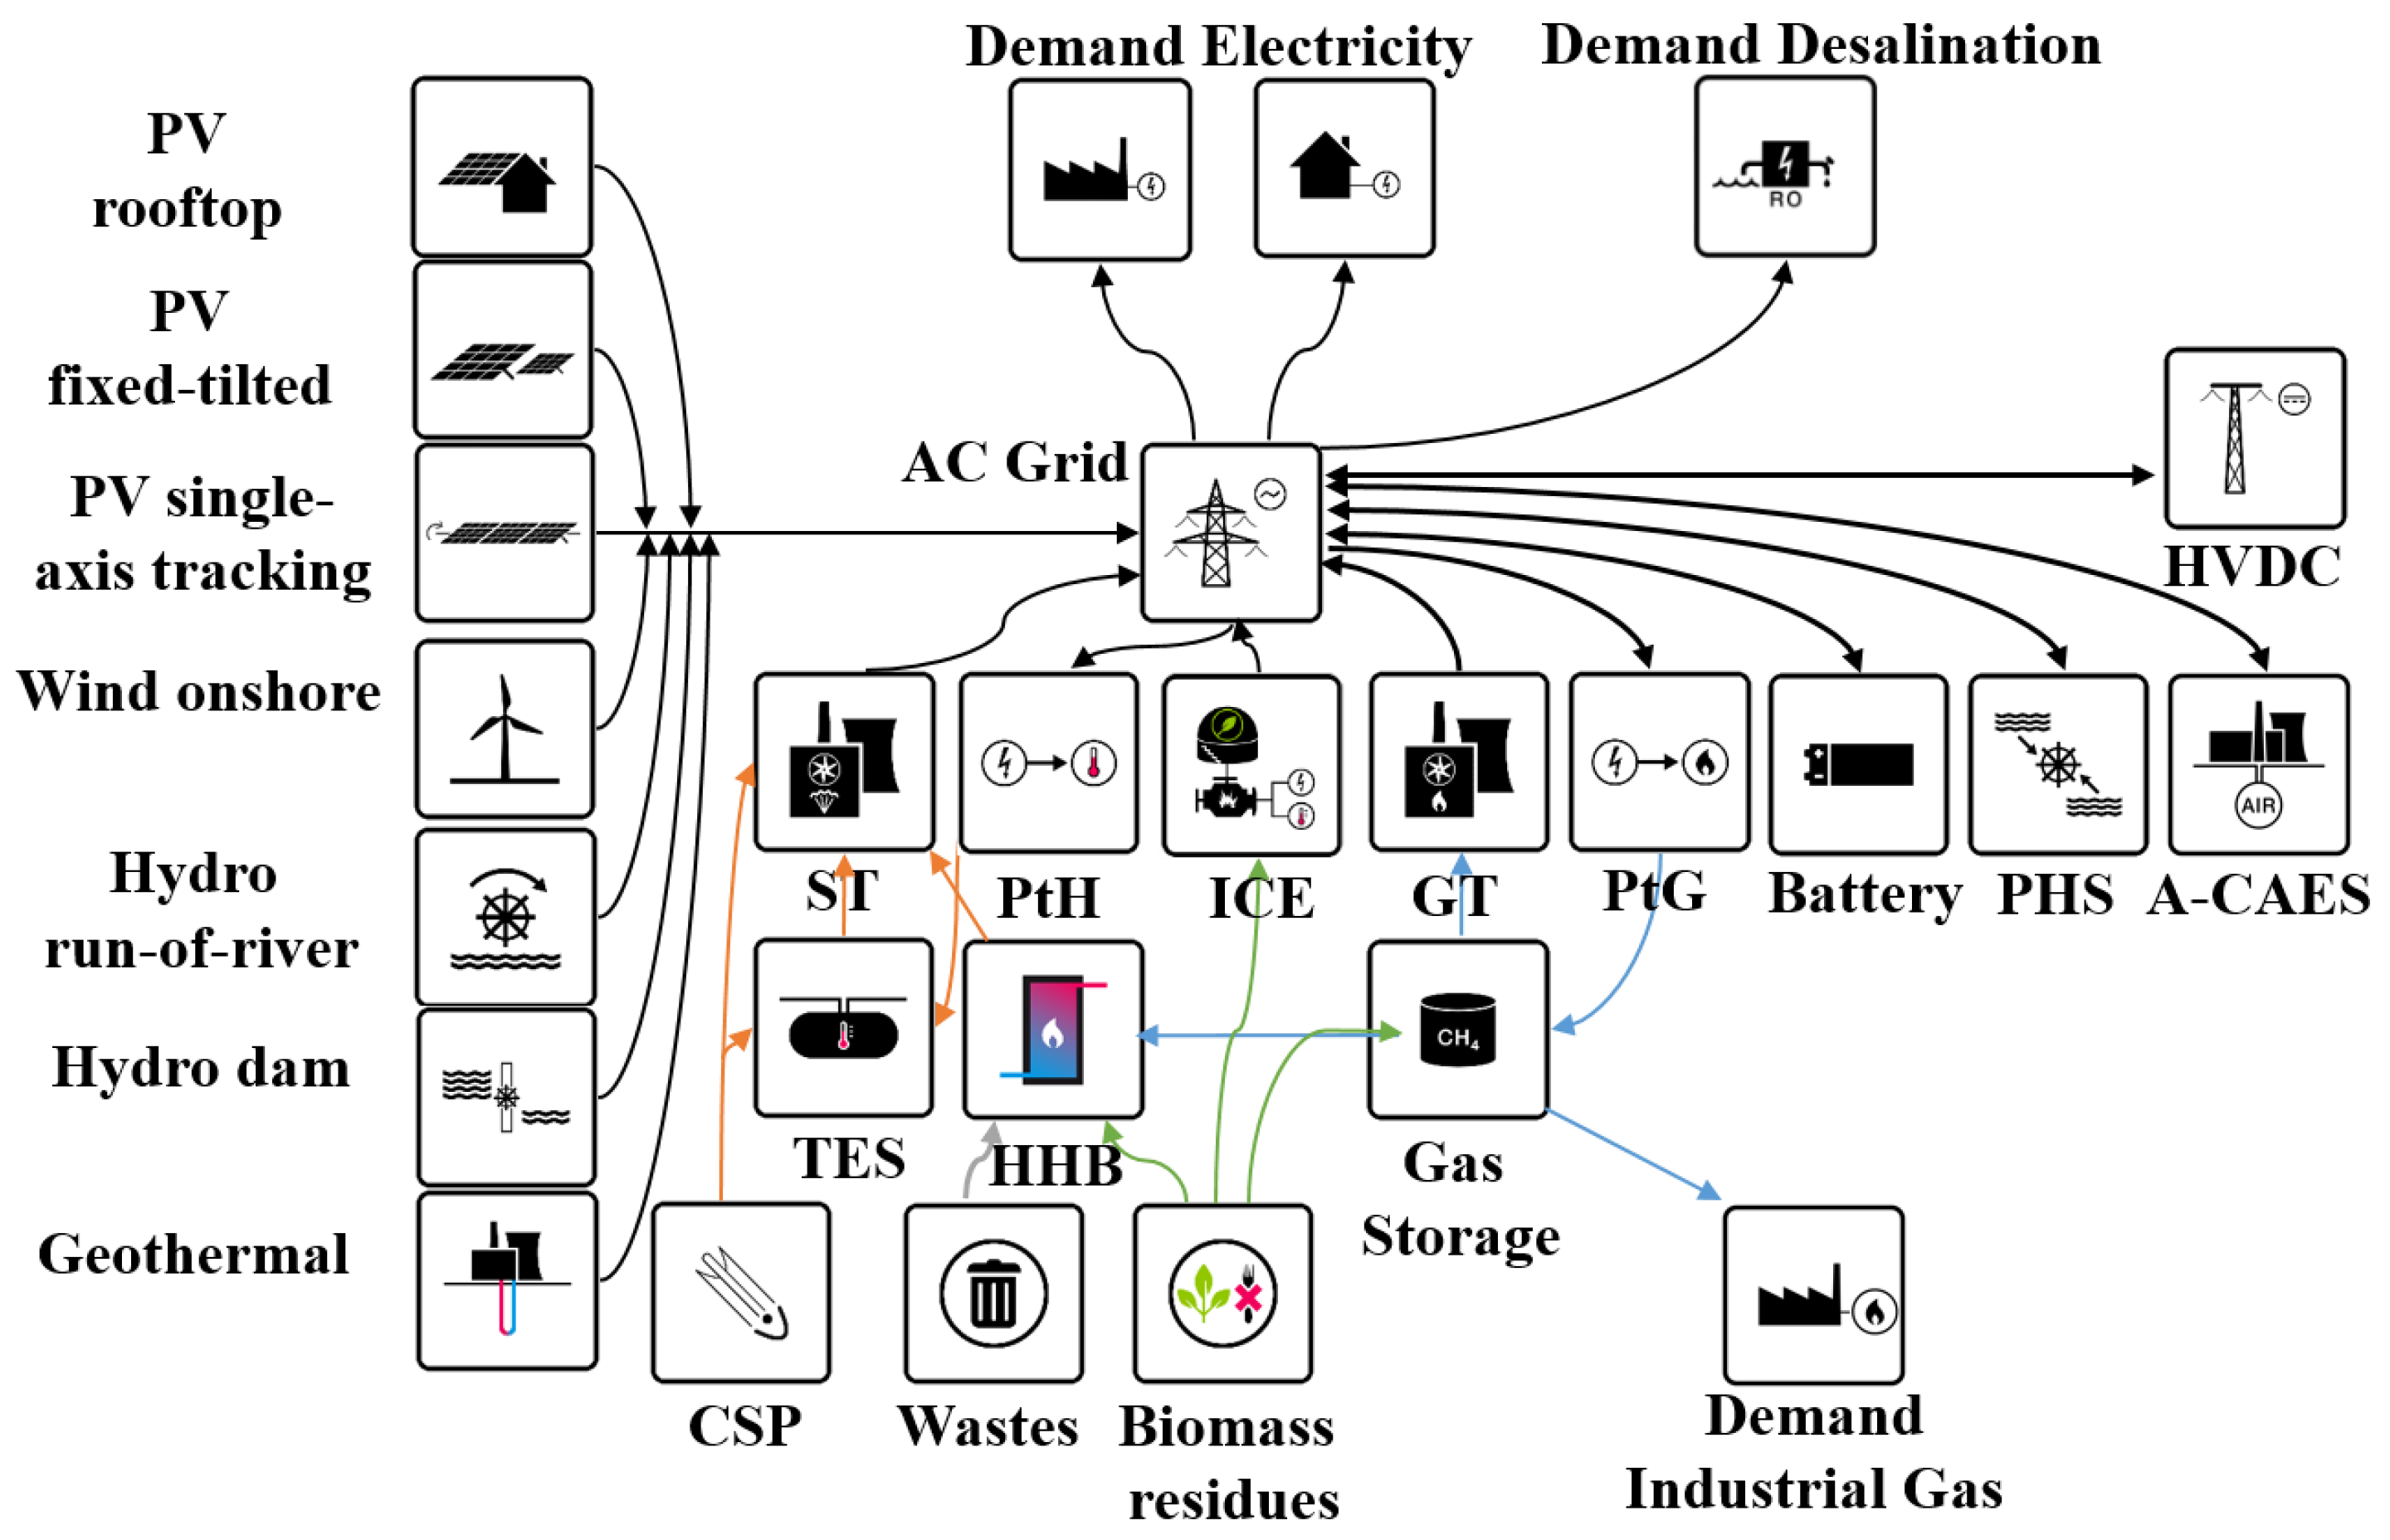
The integrated scenario provides the required flexibility to the system in compensating for seasonal fluctuations. In addition, it can provide the possibility of covering the natural gas demand in the industrial sector by generating synthetic natural gas by power-to-gas technology and providing clean water in water-stressed areas by SWRO desalination. The abundance of solar and wind resources in East Asia does not create any resource constraint for the additional electricity required for producing SNG and renewable water. The more flexibility can be made available for the energy system, the better intermittent RE sources can be integrated. The sources of flexibility are interconnected regions via grids, supply side management (e.g., hydro dams, biomass plants), demand side management, storage, and sector coupling. The hourly simulation for East Asia did not show unsolvable challenges to run a 100% RE system that uses all flexibility options. The applied upper limits for solar and wind resource limitation had been 4% and 6% of the total area for wind and solar energy, respectively. Utilizing both technologies in the same area would reduce the required maximum area. These limits have been utilized in the simulated scenarios by less than 30% and less than 4% for wind and solar energy, respectively. The investigated energy sectors represent about 50% of the total primary energy demand. Thus, a 100% RE system would require areas well below the set upper limits.
In addition, integrated RE-SNG trading allows the possibility of utilizing to a higher extent the abundant solar and wind potential in Australia by converting electricity to gas via the PtG process and shipping it to large industrial gas demand centers in China, Korea, and Japan. It is found that the large-scale transmission of electricity over long distances is not cost-competitive against local storage solutions. The gas imported by East China and Japan is equivalent to 65% and 74% of the total industrial gas demand, respectively. The decrease in PtG output for East China (64%) and Japan (75%) in comparison to the integrated scenario is due to importing cheaper gas from Australia rather than the local production of gas and using the electricity to meet the power demand. The gas import causes a decrease in the electricity imported to East China and Japan. The PtG output remains the same for Korea as it does not import any gas, but it imports electricity from Northeast China and produces its own gas due to favorable economics. Interestingly, not all locally produced gas is substituted by imported gas, despite the lower levelized cost of gas. This indicates a quite high gas sector integration benefit due to the high flexibility of electrolyzer units, which can be activated in hours of highest availability of low-cost resources.
The excess heat generated by the system as a byproduct of various processes such as biogas and biomass CHP plants, waste-to-energy incinerators, gas turbines, electrolyzers ,and methanation plants could be used to meet the heating demand in the industrial sector. Also, the excess electricity curtailed by the system could be converted to heat, stored in heat storage, and utilized to meet the heating demand. For the area-wide scenario the usable heat generated is 1095 TWhth per year, and for the integrated scenario it is 1500 TWhth per year. The higher usable heat in the integrated scenario is due to a higher absolute curtailment of electricity. The waste heat generated as a byproduct of biomass and biogas plants is evenly distributed over the year.
PV prosumers play a vital role in the power sector and influence the system, especially in regions where end-user electricity is higher in cost. For PV self-consumption to make an impact, its LCOE must be lower than the end-user electricity purchasing price, but it can be higher than the total system LCOE. For example, in Australia the cost of electricity is quite high, so wide-scale installation of PV on residential, commercial, and industrial rooftops can be observed here. In East Asia, PV self-consumption constitutes 18%–23% of the total generation mix depending on the scenario.
The results obtained for a 100% renewable energy based system show the available least expensive RE electricity generation option when compared to non-renewable low carbon technology options in Europe such as nuclear energy, natural gas, and coal carbon capture and storage [54], which can only partly comply with the climate change mitigation policy for a low-carbon-based energy system. According to Agora Energiewende [54], the LCOE of the alternatives are €112/MWh for a new nuclear plant (assumed for 2023 in the United Kingdom and Czech Republic), €112/MWh for gas CCS (assumed for 2019 in the United Kingdom, and €126/MWh for coal CCS (assumed for 2019 in the United Kingdom). A report by the European Commission [55] indicates that CCS technology will not be available until 2030, and a report by Citigroup questions whether it will ever be profitable at all [56]. The results obtained are lower in cost than the high-risk options, which have several disadvantages like CO2 emissions from power plants with CCS technology, health risks due to heavy metal emissions from coal fired power plants, diminishing fossil fuel reserves, proliferation risk, nuclear meltdown, and unsolved nuclear waste disposal problems. Also, nuclear fission has limitations similar to those mentioned above. The associated financial and human research and development resources spent will not solve the energy problems in the world [57].

6. Conclusions

In East Asia, a 100% RE-based system is achievable based on the 2030 assumptions applied in this study. The renewable energy sources can cover the electricity demand for power, SWRO desalination, RE-SNG local demand, and exports using the PtG technology. The creation of an integrated East Asian region merging SEA and NEA does not have a significant benefit in terms of the cost of electricity or the total annual cost of the system. Also, utilization of vast renewable energy resources in Australia via HVDC lines to the ASEAN countries and China seems to be non-existent due to long distances and the associated cost of transmission of electricity being higher than the cost of local storage technologies in those regions. The total LCOE of the system for East Asia is €52–61/MWh. The benefit observed by integrating NEA and SEA to East Asia is in the total annual cost of the system, which is lowered by 0.4%–0.7% depending on the scenario. The regions at the border made up of Vietnam, Laos, Cambodia, and South China benefit most due to efficient use of the available renewable energy resources and the decrease in demand for storage due to HVDC connection to high consumption centers in the southern part of China. The energy system in East Asia will be based on around 50% PV and 30% wind given the assumptions of this study. PV is mainly dominant in SEA due to favorable climatic conditions and wind plays a vital part in NEA.
However, production of RE-SNG from the available electricity in West Australia and exporting it to high-demand centers seems to be beneficial for East China and Japan. The cost of electricity and the total annual cost of the system are lowest for the integrated RE-SNG trading scenario among the four scenarios studied. This proves that Australia could become a hub for liquefaction of RE-based SNG by utilizing the abundant solar and wind potential. However, more such cases need to be analyzed around the world for better understanding of RE-SNG trading scenarios. It has been not fully resolved why it does not seem to be beneficial for Korea to import RE-SNG despite a comparably higher local SNG production cost than Japan and East China. However, the sectorial integration benefit of the gas sector seems to be higher in Korea. In addition, neither Japan nor East China has shown the full local SNG production substituted, despite a higher absolute local SNG production cost, most likely due to the high value of gas sector integration.
A 100% renewable energy system for East Asia seems to be highly attractive, in particular due to the fact that it costs less than the subsidies for a coal-based energy system. It also offers a fully sustainable option complying with the climate change mitigation targets.

Supplementary Materials

The following are available online at www.mdpi.com/2071-1050/9/2/233/s1. Table S1. Financial assumptions for energy system component; Table S2. Efficiencies and energy to power ratio of storage technologies; Table S3. Efficiency assumptions for energy system components for the 2030 reference year; Table S4. Efficiency assumptions for HVDC transmission according to Dii; Table S5. Assumptions for RE-SNG value chain; Table S6. Regional biomass potentials; Table S7. Regional biomass costs; Table S8. Average full load hours and LCOE for PV single-axis tracking, PV optimally tilted, solar CSP and wind power plants in East Asian sub-regions; Table S9. Lower limits of installed capacities in the East Asian sub-regions. Data taken from Farfan and Breyer; Table S10. Upper limits on installable capacities in the East Asian sub-regions in units of GWth for CSP and GWel for all other technologies; Table S11. Annual industrial gas demand and water demand Caldera et al. for year 2030 in the East Asian sub-regions; Table S12. Total LCOE components in all sub-regions of East Asian region; Table S13. Overview on storage capacities, throughput, and full cycles per year for the four scenarios; Figure S1. Energy flow of the system in the region-wide scenario; Figure S2. Energy flow of the system in the area-wide scenario; Figure S3. Hourly generation profile for net importer region, China East in a winter week; Figure S4. Hourly generation profile for a region with high wind generation and exporter region, China South; Figure S5. Hourly generation profile for Western Australia.in a winter week; Figure S6. Hourly generation profile for the region of Vietnam, Cambodia and Laos, which profits from interconnection to Northeast Asia; Figure S7. Interregional electricity trade between the East Asian regions in an area-wide scenario in absolute and relative terms; Figure S8. Aggregated yearly state-of-charge for storage technologies, battery, PHS, Hydro dam, gas storage.

Acknowledgments

The authors gratefully acknowledge the public financing of Tekes, the Finnish Funding Agency for Innovation, for the ‘Neo-Carbon Energy’ project under the number 40101/14. The authors would like to thank Michael Child for proofreading.

Author Contributions

Ashish Gulagi collected the input data, performed the research and simulations, generated the results, analyzed the results, and wrote the manuscript. Dmitrii Bogdanov did the coding for the model used in this research. Mahdi Fasihi contributed the RE-SNG scenario and wrote certain parts of the paper. Christian Breyer framed the research questions and scope of the work, checked the results, facilitated discussions, and reviewed the manuscript.

Conflicts of Interest

The authors declare no conflict of interest. The founding sponsors had no role in the design of the study; in the collection, analyses, or interpretation of data; in the writing of the manuscript, and in the decision to publish the results.

Abbreviations

A-CAESAdiabatic compressed air energy storage
ASEANAssociation for South East Nations
CapexCapital expenditure
CCGTCombined cycle gas turbine
CCSCarbon capture and storage
CSPConcentrating solar thermal power
FLHFull load hours
HVDCHigh-voltage direct current
IEAInternational Energy Agency
LCOCLevelized cost of curtailment
LCOELevelized cost of electricity
LCOGLevelized cost of gas
LCOSLevelized cost of storage
LCOTLevelized cost of transmission
OCGTOpen cycle gas turbine
OpexOperational expenditure
PHSPumped hydro storage
PtGPower-to-gas
RERenewable energy
RE-SNGRenewable energy based synthetic natural gas
SWROSeawater reverse osmosis
TESThermal energy storage
WACCWeighted average cost of capital

References

  1. [UNFCCC]—United Nations Framework Convention on Climate Change. Adoption of the Paris Agreement—Proposal by the President, UNFCCC, Paris. Available online: http://unfccc.int/resource/docs/2015/cop21/eng/l09.pdf (accessed on 1 February 2017).
  2. Boucher, O.; Bellassen, V.; Benveniste, H.; Ciais, P.; Criqui, P.; Guivarch, C.; Le Treut, H.; Mathy, S.; Séférian, R. Opinion: In the wake of Paris Agreement, scientists must embrace new directions for climate change research. Proc. Natl. Acad. Sci. USA 2016, 113, 7287–7290. [Google Scholar] [CrossRef] [Green Version]
  3. Schellnhuber, J.H.; Rahmstorf, S.; Winkelmann, R. Why the right climate target was agreed in Paris. Nat. Clim. Chang. 2016, 6, 649–653. [Google Scholar] [CrossRef]
  4. Taggart, S. A Pan-Asian Energy Infrastructure by 2050; GRENATEC: Sydney, Australia, 2013. [Google Scholar]
  5. Teske, S.; Pregger, T.; Simon, S.; Naegler, T.; O’Sullivan, M.; Sawyer, S.; Obusan, A.; Buakamsri, T. Energy [R]evolution: A Sustainable ASEAN Energy Outlook; Technical Report; Greenpeace International and European Renewable Energy Council (EREC): Amsterdam, The Netherlands, 2013. [Google Scholar]
  6. [IEA]—International Energy Agency. Southeast Asia Energy Outlook; World Energy Outlook Special Report; IEA Publications: Paris, France, 2015. [Google Scholar]
  7. Farfan, J.; Breyer, C. Structural changes of global power generation capacity towards sustainability and the risk of stranded investments supported by a sustainability indicator. J. Clean. Prod. 2017, 141, 370–384. [Google Scholar] [CrossRef]
  8. Duguid, B. (Ed.) Ontario’s Long-Term Energy Plan; Ontario Ministry of Energy: Toronto, ON, Canada, 2010.
  9. Buonocore, J.J.; Luckow, P.; Norris, G.; Spengler, J.D.; Biewald, B.; Fisher, J.; Levy, J.I. Health and climate benefits of different energy-efficiency and renewable energy choices. Nat. Clim. Chang. 2016, 6, 100–105. [Google Scholar] [CrossRef]
  10. Epstein, P.; Buonocore, J. Full cost accounting for the life cycle of coal. Ann. N. Y. Acad. Sci. 2011, 1219, 73–98. [Google Scholar] [CrossRef] [PubMed]
  11. [IMF]—International Monetary Fund. How Large Are Global Energy Subsidies? IMF Working Paper, WP/15/105; IMF: Washington, DC, USA, 2015. [Google Scholar]
  12. Hoffmann, W. The Economic Competitiveness of Renewable Energy: Pathways to 100% Global Coverage; John Wiley & Sons: San Francisco, CA, USA, 2014. [Google Scholar]
  13. Pleßmann, G.; Erdmann, M.; Hlusiak, M.; Breyer, C. Global energy storage demand for a 100% renewable electricity supply. Energy Procedia 2014, 46, 22–31. [Google Scholar] [CrossRef]
  14. Dii 2050, Desert Power—Perspectives on a Sustainable Power System for EUMENA. Munich, 2012. Available online: http://desertenergy.org/wp-content/uploads/2015/09/dp2050_study_web.pdf (accessed on 1 February 2017).
  15. Desertec Foundation. Clean Power from Deserts—The Desertec Concept for Energy, Water and Climate Security, Whitebook, Hamburg. 2009. Available online: www.dun-eumena.com/sites/default/files/files/doc/trec_white_paper.pdf (accessed on 1 February 2017).
  16. Komoto, K.; Enebish, N.; Song, J. Very large scale PV systems for North-East Asia: Preliminary project proposals for VLS-PV in the Mongolian Gobi desert. In Proceedings of the 39th PVSC, Tampa, FL, USA, 16–21 June 2013.
  17. Mano, S.; Ovgor, B.; Samadov, Z.; Pudlik, M.; Jülich, V.; Sokolov, D.; Yoon, J.Y. Gobitec and Asian Super Grid for Renewable Energies in Northeast Asia; Energy Charter Secretariat, Energy Economics Institute of the Republic of Korea, Energy Systems Institute of the Russian Federation, Ministry of Energy of Mongolia, Japan Renewable Energy Foundation: Brussels, Belgium, 2014.
  18. Taggart, B.S.; James, G.; Dong, Z.; Russell, C. The Future of Renewables Linked by a Transnational Asian Grid. Proc. IEEE 2011, 100, 348–359. [Google Scholar] [CrossRef]
  19. Teske, S.; Muth, J.; Sawyer, S.; Pregger, T.; Simon, S.; Naegler, T.; O’Sullivan, M.; Schmid, S.; Pagenkopf, J.; Frieske, B.; et al. Energy [R]evolution: A Sustainable World Energy Outlook; Technical Report; Greenpeace International, Global Wind Energy Council (GWEC) and Solar Power Europe: Amsterdam, The Netherlands, 2015. [Google Scholar]
  20. Zenya, L. Constructing global energy internet. In Book Global Energy Interconnection; Elsevier: Amsterdam, The Netherlands, 2015. [Google Scholar]
  21. Blakers, A.W.; Luther, J.; Nadolny, A. Asia Pacific Super Grid—Solar electricity generation, storage and distribution. Green 2012, 2, 189–202. [Google Scholar]
  22. Breyer, C.; Gulagi, A.; Bogdanov, D. South-East Asia and the Pacific Rim Super Grid for 100% RE power supply. IEA-PVPS Task 1 Meeting—GÜNDER Workshop. Istanbul, Turkey, 27 October 2015. Available online: https://goo.gl/LhQTcA (accessed on 1 February 2017).
  23. Bogdanov, D.; Breyer, C. North-East Asian Super Grid for 100% Renewable Energy supply: Optimal mix of energy technologies for electricity, gas and heat supply options. Energy Convers. Manag. 2016, 112, 176–190. [Google Scholar] [CrossRef]
  24. Louwen, A.; Sark van, W.; Schropp, R.E.I. Re-Assessment of Net Energy Production and Greenhouse Gas Emissions Avoidance after 40 Years of Photovoltaics Development. Nat. Commun. 2016. [Google Scholar] [CrossRef] [PubMed]
  25. [IEA PVPS]—International Energy Agency-Photovoltaic Power Systems Programme, 2016. Trends 2016 in Photovoltaic Applications—Survey Report of Selected IEA Countries between 1992 and 2015, St. Ursen. Available online: www.iea-pvps.org/fileadmin/dam/public/report/national/Trends_2016_-_mr.pdf (accessed on 1 February 2017).
  26. Parkinson, G. How the Jaw-Dropping Fall in Solar Prices Will Change Energy Markets, Article in Renew Economy, New South Wales. 2016. Available online: http://reneweconomy.com.au/2016/how-the-jaw-dropping-fall-in-solar-prices-will-change-energy-markets-55160 (accessed on 1 February 2017).
  27. Fasihi, M.; Bogdanov, D.; Breyer, C. Economics of Global LNG Trading Based on Hybrid PV-Wind Power Plants. In Proceedings of the 31st European Photovoltaic Solar Energy Conference, Hamburg, Germany, 14–18 September 2015.
  28. [BP]—British Petroleum. BP Statistical Review of World Energy; British Petroleum: London, UK, 2016. [Google Scholar]
  29. Barbosa, L.S.N.S.; Bogdanov, D.; Vainikka, P.; Breyer, C. Hydro, wind and solar power as a base for a 100% Renewable Energy supply for South and Central America. In Proceedings of the Rio 15—World Climate & Energy Event, Rio de Janeiro, Brazil, 4–5 September 2015.
  30. Stackhouse, P.W.; Whitlock, C.H. (Eds.) Surface Meteorology and Solar Energy (SSE) Release 6.0, NASA SSE 6.0; Earth Science Enterprise Program, National Aeronautic and Space Administration (NASA): Langley, BC, Canada, 2008. Available online: https://eosweb.larc.nasa.gov/sse/ (accessed on 1 February 2017).
  31. Stackhouse, P.W.; Whitlock, C.H. (Eds.) Surface Meteorology and Solar Energy (SSE) Release 6.0 Methodology, NASA SSE 6.0; Earth Science Enterprise Program, National Aeronautic and Space Administration (NASA): Langley, BC, Canada, 2009. Available online: https://eosweb.larc.nasa.gov/sse/documents/SSE6Methodology.pdf (accessed on 1 February 2017).
  32. Stetter, D. Enhancement of the REMix Energy System Model: Global Renewable Energy Potentials Optimized Power Plant Siting and Scenario Validation. Ph.D. Thesis, Faculty of Energy, Process and Bio-Engineering, University of Stuttgart, Stuttgart, Germany, 2012. [Google Scholar]
  33. Gerlach, A.-K.; Stetter, D.; Schmid, J.; Breyer, C. PV and wind Power—Complementary technologies. In Proceedings of the 26th EU PVSEC, Hamburg, Germany, 5–9 September 2011.
  34. Huld, T.; Šúri, M.; Dunlop, E.D. Geographical variation of the conversion efficiency of crystalline silicon photovoltaic modules in Europe. Prog. Photovoltaics Res. Appl. 2008, 16, 595–607. [Google Scholar] [CrossRef]
  35. Duffie, J.A.; Beckmann, W.A. Solar Engineering of Thermal Processes; Wiley: Hoboken, NJ, USA, 2013. [Google Scholar]
  36. Enercon. Enercon Product Overview; Enercon GmbH: Aurich, Germany, 2014. [Google Scholar]
  37. Gulagi, A.; Bogdanov, D.; Breyer, C. Solar Photovoltaics—A driving force towards a 100% renewable energy system for India and the SAARC region. In Proceedings of the 32nd EU PVSEC, Munich, Germany, 20–24 June 2016.
  38. Caldera, U.; Bogdanov, D.; Breyer, C. Local cost of seawater RO desalination based on solar PV and wind energy: A global estimate. Desalination 2016, 385, 207–216. [Google Scholar] [CrossRef]
  39. [IEA]—International Energy Agency. Energy Balances of OECD and Non-OECD Countries; IEA: Paris, France, 2013. [Google Scholar]
  40. Mokhatab, S.; Mak, J.; Valappil, J.; Wood, D. Handbook of Liquefied Natural Gas; Gulf Professional Publishing: Woburn, MA, USA, 2014; pp. 1–106. [Google Scholar]
  41. Dii. 2050 Desert Power—Perspectives on a Sustainable Power System for EUMENA; Dii: Munich, Germany, 2012. [Google Scholar]
  42. Gerlach, A.; Werner, C.; Breyer, C. Impact of Financing Cost on Global Grid-Parity Dynamics till 2030. In Proceedings of the 29th EU PVSEC, Amsterdam, The Netherlands, 22–26 September 2014.
  43. DBFZ. Regionale und Globale Räumliche Verteilung von Biomassepotenzialen; German Biomass Research Centre: Leipzig, Germany, 2009. (In German) [Google Scholar]
  44. [IEA]—International Energy Agency. Technology Roadmap—Bioenergy for Heat and Power; IEA Publishing: Paris, France, 2012. [Google Scholar]
  45. [IPCC]—Intergovernmental Panel on Climate Change. Special Report on Renewable Energy Sources and Climate Change Mitigation; Intergovernmental Panel on Climate Change: Geneva, Switzerland, 2011. [Google Scholar]
  46. Gulagi, A.; Aghahosseini, A.; Bogdanov, D.; Breyer, C. Comparison of the Potential Role of Adiabatic Compressed Air Energy Storage (A-CAES) for a Fully Sustainable Energy System in a Region of Significant and Low Seasonal Variations. In Proceedings of the 10th IRES 2016, Düsseldorf, Germany, 15–17 March 2016.
  47. Bogdanov, D.; Breyer, C. Influence of Storage Technologies’ Cost Development on the Economics of Power Transmission Grids. In Proceedings of the 10th International Renewable Energy Storage Conference (IRES 2016), Düsseldorf, Germany, 15–17 March 2016.
  48. Bogdanov, D.; Koskinen, O.; Aghahosseini, A.; Breyer, C. Integrated renewable energy based power system for Europe, Eurasia and MENA regions. In Proceedings of the 5th International Energy and Sustainability Conference (IESC), Cologne, Germany, 30 June–1 July 2016.
  49. Breyer, C.; Child, M.; Koskinen, O.; Dmitrii, B. A low-cost power system for Europe based on renewable electricity. In Proceedings of the European Utility Week, Barcelona, Spain, 15–17 November 2016; Available online: https://goo.gl/kjX9c4 (accessed on 1 February 2017).
  50. Bogdanov, D.; Breyer, C. Eurasian Super Grid for 100% Renewable Energy power supply: Generation and storage technologies in the cost optimal mix. In Proceedings of the ISES Solar World Congress 2015, Daegu, Korea, 8–12 November 2015.
  51. Aghahosseini, A.; Bogdanov, D.; Breyer, C. The MENA Super Grid towards 100% Renewable Energy Power Supply by 2030. In Proceedings of the 11th International Energy Conference, Tehran, Iran, 30–31 May 2016.
  52. Bogdanov, D.; Breyer, C. Integrating the excellent wind resources in Northwest Russia for a sustainable energy supply in Europe. In Proceedings of the 15th Wind Integration Workshop, Vienna, Austria, 15–17 November 2016.
  53. Fasihi, M.; Bogdanov, D.; Breyer, C. Long-Term Hydrocarbon Trade Options for Maghreb Core Region and Europe—Renewable Energy Based Synthetic Fuels for a Net Zero Emissions World. In Proceedings of the SGEM Vienna Green 2016 Sessions, Vienna, Austria, 2–5 November 2016.
  54. Agora Energiewende. Comparing the Cost of Low-Carbon Technologies: What Is the Cheapest Option? Report by Prognos AG on Behalf of Agora Energiewende: Berlin, Germany, 2014; pp. 10–13. Available online: www.prognos.com/fileadmin/pdf/publikationsdatenbank/140417_Prognos_Agora_Analysis_Decarbonisationtechnologies_EN.pdf (accessed on 1 February 2017).
  55. European Commission. Integration of Renewable Energy in Europe. Study Prepared by KEMA Consulting, DNV GL—Energy, Imperial College and NERA Economic Consulting on Behalf of DG Energy, Brussels. 2014, pp. 7–8. Available online: https://ec.europa.eu/energy/sites/ener/files/documents/201406_report_renewables_integration_europe.pdf (accessed on 1 February 2017).
  56. Citi Research Equities. Paris Climate Change Agreement; Citi Research Equities: Sydney, Australia, 2015. [Google Scholar]
  57. Dittmar, M. Nuclear energy: Status and future limitations. Energy 2012, 37, 35–40. [Google Scholar] [CrossRef]
Figure 1. Flow diagram for the model with all the input and output parameters and system model optimization [29].
Sustainability 09 00233 g001
Figure 2. A block diagram of all the technologies applied in the modeling for East Asia [29].
Sustainability 09 00233 g002
Figure 3. LNG value chain.
Sustainability 09 00233 g003
Figure 4. The different sub-regions in East Asia, HVDC grid configuration, and RE-SNG trading route.
Sustainability 09 00233 g004
Figure 5. Aggregated feed-in profiles for single-axis tracking PV (left) and wind power plant (right) in East Asia.
Sustainability 09 00233 g005
Figure 6. Aggregated load curve (left) and load curve with prosumers influence (right) for East Asia for the year 2030.
Sustainability 09 00233 g006
Figure 7. Installed capacities of RE and storage technologies for the region-wide (a), area-wide (b), and integrated scenario (c).
Sustainability 09 00233 g007
Figure 8. Annual imported and exported electricity for the area-wide scenario in the East Asian region.
Sustainability 09 00233 g008
Figure 9. Annual imported and exported electricity for the integrated scenario in the East Asian region.
Sustainability 09 00233 g009
Figure 10. Energy flow of the system in the integrated scenario.
Sustainability 09 00233 g010
Table 1. Future transition scenarios for East Asia with their key findings.
StudyScopeKey Findings
Zhenya L. [20]Connecting Australia to AsiaSolar resources from northern and central Australia and abundant wind resources from the northwest could power Asia. Connecting different large grids in Asia, in this case Northeast Asia to Southeast Asia, will help with the transfer of renewable electricity.
Taggart S. [4]Asia: connecting Australia—Southeast Asia—ChinaNetwork of highly efficient HVDC lines connecting Australia, ASEAN, China, Japan, and South Korea in 2050. Natural gas pipelines on the similar lines connecting different countries.
Taggart B.S. et al. [18]Asia: connecting Australia—Southeast Asia—ChinaDeveloping the solar and wind resources in Australia, Mongolia, China, and Vietnam and constructing an electricity grid from China to Australia. This will decrease the price of electricity and decrease total regional emissions costs. Large-scale connectivity of different regions can partially cancel out the regional intermittencies and are easier to manage without large-scale storage technologies.
Teske et al. [19]Asia and OceaniaIn the Advanced Energy [R]evolution scenario for 2030, solar PV has the highest installed capacity, followed by wind and other complementary technologies. However, fossil fuel technologies will still be present in the generation mix for 2030.
Blakers A. et al. [21]Southeast Asia and AustraliaDemand for electricity in Southeast Asia in 2050 would be satisfied by large-scale transmission of solar electricity from Australia and supplemented by locally produced electricity from renewable and conventional sources. This can be both technically and economically feasible.
Table 2. The sub-regions for East Asia.
AbbreviationsSub-RegionsCountries/Regions/Provinces Included
1NZNew ZealandNew Zealand
2AU-EEast AustraliaQueensland, South Australia, NSW, Victoria, and Tasmania
3AU-WWest AustraliaNorthern Territory and Western Australia
4ID-PG + NGIndonesia-Papua + Papua New GuineaIndonesian Papua and Papua New Guinea
5ID-SUSumatraSumatra
6ID-JV + TLJava + Timor LesteJava and Timor-Leste
7ID-KLSWEast IndonesiaKalimantan and Sulawesi
8MY + SG + BNMalaysia + Singapore+BruneiMalaysia, Singapore, and Brunei
9PHPhilippinesPhilippines
10VN + LA + KHVietnam + Laos + CambodiaVietnam, Laos, and Cambodia
11MM + THMyanmar + ThailandMyanmar and Thailand
12CN-SSouth ChinaGuangdong, Guangxi, Hainan, Guizhou, Yunnan, Hong Kong, and Macau
13CN-CCentral ChinaJiangxi, Henan, Hubei, Hunan, Chongqing, and Sichuan
14CN-EEast ChinaShanghai, Jiangsu, Zhejiang, Anhui, and Fujian
15CN-NW + T + UNorthwest China + Tibet + UygurShaanxi, Gansu, Qinghai, Ningxia, Uygur, and Tibet
16CN-NNorth ChinaBeijing, Tianjin, Hebei, Shanxi, Inner Mongolia, and Shandong
17CN-NENortheast ChinaLiaoning, Jilin, and Heilongjiang
18MNMongoliaMongolia
19KRSouth Korea + North KoreaSouth Korea and North Korea
20JPJapanJapan
Table 3. Financial results for the four scenarios applied for East Asia.
2030 ScenariosTotal LCOELCOE PrimaryLCOCLCOSLCOTTotal Ann. CostTotal CAPEXRE CapacitiesGenerated Electricity
(€/MWh)(€/MWh)(€/MWh)(€/MWh)(€/MWh)(b€)(b€)(GW)(TWh)
Region-wide66.341.92.621.80.0755.06684654413,009
Area-wide61.141.82.414.72.3692.26239589612,664
Integrated scenario52.939.11.710.22.0911.78301782916,906
Integrated scenario with RE-SNG trading52.538.71.710.31.9902.18179762417,022
Table 4. Installed RE technologies and storage capacities for the four scenarios for East Asia.
Region-WideArea-WideIntegrated ScenarioIntegrated Scenario with RE-SNG Trading
PV self-consumption(GW)1397139713971397
PV optimally tilted(GW)642575578
PV single-axis tracking(GW)1918168834833053
PV total(GW)3957314349354528
CSP(GW)0000
Wind energy(GW)1572183021722369
Biomass power plants(GW)61555354
MSW incinerator(GW)7777
Biogas power plants(GW)1091294241
Geothermal power(GW)32262424
Hydro Run-of-River(GW)84888486
Hydro dams(GW)409409409409
Battery PV self-consumption(GWh)2065206520652065
Battery System(GWh)3053159727282719
Battery total(GWh)5117366247924784
PHS(GWh)1191116711801180
A-CAES(GWh)32511019
Heat storage(GWh)0001
PtG electrolyzers(GWel)17197558499
CCGT(GW)2341634164
OCGT(GW)1451248365
Steam Turbine(GW)0000
Table 5. Comparison of the key parameters for East Asia with SEA and NEA.
East AsiaNortheast AsiaSoutheast Asia
Area-WideIntegrated ScenarioArea-WideIntegrated ScenarioArea-WideIntegrated Scenario
LCOE total(€/MWh)61.152.961.653.860.949.0
Generated electricity(TWh)12,664.216,906.111,228.814,556.31469.62356.8
Generation capacities(GW)5896.17829.15343.26903.9606.4938.1
Total annual cost(bn €)692.2911.7610.9791.585.8123.8
Total CAPEX(bn €)6238.58301.35536.37231.9732.31084.4
Table 6. RE-SNG value chain cost breakdown.
East ChinaKoreaJapan
SNG cost at location of export(€/MWhth)84.5684.5684.56
Liquefaction cost(€/MWhth)9.989.989.98
Shipping cost(€/MWhth)1.962.112.17
Regasification cost(€/MWhth)2.362.362.36
Cost of re-gasified SNG(€/MWhth)99.8799.0299.08
Table 7. Key parameters for the integrated RE-SNG scenario and integrated scenario.
IntegratedIntegrated RE-SNG Trading
AU-WCN-EKRJPSumAU-WCN-EKRJPSum
LCOE total *(€/MWh)32694950593274535664
LCOG local production *(€/MWh)8515814212813285153137129130
LCOG import(€/MWh)0000-09999100-
LCOG blended (total) *(€/MWh)8515814212813285121138109103
Total annual cost(b€)121054710627056924371262
Annual import of gas(TWhth)0000001460327473
Annual export of gas(TWhth)00000520000520
Total electricity demand gas sector(TWh)230399307819175512231243071961850
Curtailment losses(TWh)1534287715472342547178
Efficiency losses storages turbines(TWh)0421031830501239101
Efficiency losses grid total(TWh)01655260146323
Grid import of electricity(TWh)0604150157911051421592821
Power-to-Gas output(TWh,gas)15627720856012018301002091411280
Total RE generation capacities(GW)101912440104324964678063846752332
PV total(GW)4671735587119892076053005021614
Wind total(GW)541587412541126015874126618
* Sum calculated as weighted average.

