Article

Urbanization and Socioeconomic Development in Inner Mongolia in 2000 and 2010: A GIS Analysis

1
Center for Human-Environment System Sustainability (CHESS), State Key Laboratory of Earth Surface Processes and Resource Ecology (ESPRE), Beijing Normal University, Beijing 100875, China
2
College of Resources Science & Technology, Faculty of Geographical Science, Beijing Normal University, Beijing 100875, China
*
Author to whom correspondence should be addressed.
Sustainability 2017, 9(2), 235; https://doi.org/10.3390/su9020235
Submission received: 7 December 2016 / Revised: 3 February 2017 / Accepted: 3 February 2017 / Published: 10 February 2017
(This article belongs to the Section Sustainable Urban and Rural Development)

Abstract

:
Economic indicators and other indices measuring overall development describe local development trajectories differently. In this paper, we illustrated this difference and explored how urbanization is related to development by a case study in Inner Mongolia, China. We calculated the human development index (HDI) and compared the temporal and spatial dynamics of the overall development (represented by the HDI) and economic growth (represented by the GDP) in 2000 and 2010. We conducted partial correlation analysis between the HDI and urbanization rate whilst controlling for the effects of the GDP. Our results showed that the spatial pattern of the HDI was little in 2000 and became clearer in 2010 when the western part tended to have higher values and the northeastern part tended to have lower values. The spatial trend for the GDP was obvious in 2000 as the high values clustered in the northwest and the low values clustered in the southeast but became less obvious in 2010 when high values clustered in several counties in the southwest and low values took up almost the entire northeast and some counties in the middle. Furthermore, we found that the HDI of all the city districts were significantly higher than their surrounding rural counties in both 2000 and 2010. Urbanization rates are found to be positively correlated with the HDI even when we controlled the effects of the GDP (p < 0.001). This study illustrated that the HDI and GDP told different stories on local performance in development at the county level. Translating the fast economic growth into an improvement in education and health relies on many other factors and our results seem to suggest that urbanization is one of these factors.

1. Introduction

Economic indicators, especially the gross domestic product (GDP), have long been and are still widely used in practice to evaluate development [1], even though economic growth is widely acknowledged as not being the only one aspect of development (e.g., [2,3]). The GDP is frequently used because (1) data for economic indicators, such as the GDP and income, is usually readily available; and (2) economic indicators often correlate with indices measuring overall development and therefore are considered representative to describe general development patterns. The use of economic indicators is especially widespread in countries such as China with rapid economic growth, where it often generates a dramatic growth curve indicating a great progress in development.
Recognizing that economic growth is only one aspect of development, researchers increasingly evaluate societies’ development from multiple perspectives, using, for example, the capacity approach, the basic needs framework, and the quality of life measurement [4]. Based on these frameworks, researchers from different fields have developed numerous indices and indicators to quantify development trajectories through temporal and/or spatial comparative studies (e.g., [5,6,7,8,9]). Among these indicators/indices, the most widely used is the human development index (HDI), first released in 1990 in the annual Development Reports of the United Nations Development Programme (UNDP) [10].
Based on the capacity approach framework [11], the HDI emphasizes that the ultimate goal of development is to enlarge people’s capacities rather than to promote economic growth [12]. It composes three indicators: income, health and education. As an alternative to the GDP, it measures three key dimensions in development: a long and healthy life, being knowledgeable and having a decent living standard [13]. Since 1990, UNDP reports the HDI for countries all over the globe every year and uses it to compare countries’ development progress. Since its first release in 1990, the HDI soon became one of the most popular development measurements, partly because of the open and time continuous datasets provided by UNDP. In addition, the straightforward calculation method of the HDI and its relatively low requirements for data make it attractive and operable to a variety of development assessments.
There are numerous studies related to the HDI. It is out of the scope of this paper to give a thorough review (but see [14,15,16]). Instead, we recognized and summarized recent efforts to modify and apply the HDI in development assessments into three categories: (1) studies that apply the HDI to examine and compare its tempo-spatial variations in different countries (e.g., [17,18]); (2) studies that modify the HDI by adding one or more indicators on the environmental dimension, and compare the results between the original and modified HDI indices (e.g., [19,20]); and (3) studies that analyze the relationship between the HDI and other variables. Examples include incidence and mortality of certain disease [21,22,23,24,25,26], drug use [27], patient profiles [28], food consumption, obesity [29], suicide and homicide [30], prevalence of physical inactivity [31], infrastructure [32,33], total fertility rate [34], and worldwide governance indicators [35].
Most of these studies we reviewed using nation as their analytical unit and exploring research questions at the global or national scale (e.g., [31,36]). Several studies, in contrast, focused on the local scale [32,37]. Examples include constructing a municipal-based HDI based on census data [38], and incorporating governance as an indicator to build a local level development index [39]. Interestingly, few studies have focused on the regional scale, which is worth studying for at least two reasons. First, development planning and decision-making often take place at the regional scale. Providing scientific evidence and influencing practice are the ultimate goals for all the development measurements and relevant studies. Examining development on the regional scale would contribute to future regional planning and decision-making; second, regional scale studies can allow analysis on spatial heterogeneities of economic and the overall development, which will be helpful to further explore the potential influencing factors on development.
One of the potential influencing factors is urbanization, which is often considered as a driving force as well as a result of economic growth [40]. This raises questions as to whether urbanization is related to economic growth and overall development and whether urbanization can contribute to overall development. These questions are worth exploring in case studies, especially in developing countries where fast urbanization is taking place.
Filling the gap between the global/national and local scale, our study applies the HDI to explore its regional dynamics in Inner Mongolia, China. We aim to assess the temporal and spatial variation of the HDI within the Inner Mongolia region, and compare it with the GDP at two points in time: 2000 and 2010. Specifically, we have two objectives. The first objective is to illustrate that although the GDP is highly correlated with the HDI, the two indicators may tell different stories at local and regional scales. The second objective is to draw preliminary conclusions from a case study in China on the relationship between urbanization, economic growth and socioeconomic development. Here, we asked three research questions: (1) What are the temporal and spatial patterns of the HDI for Inner Mongolia in 2000 and 2010? (2) Whether and how was it different from the GDP variation? (3) How does urbanization relate to HDI and GDP variation in 2000 and 2010? Answering these questions will contribute to our understanding of the temporal and spatial patterns of the HDI and GDP. It will also help to enhance our insights into the fast-growing economy in Inner Mongolia and its relationships with social progress and urbanization.

2. Methods

2.1. Study Area

Our study area, Inner Mongolia, is located in northern China with an area of 1183 thousand square kilometers and a population of 25 million people [41]. It encompasses 12% of China’s land and has 101 counties. Inner Mongolia experienced dramatic economic growth [42]. From 2002 to 2009, its economic growth rate ranked first in China for eight continuous years. The average annual growth rate during the period 2002–2010 was 18.55% for Inner Mongolia [42] and 11% for the national average [43]. Rapid urbanization occurred during the same time. The urbanization rate in Inner Mongolia increased from 42.2% to 55.45% from 2000 to 2010 [44]. The urbanization rate for China was 36.2% in 2000 and 49.9% in 2010 for reference [45]. Large area, rapid economic growth, and fast urbanization make Inner Mongolia an ideal case to explore our research questions.

2.2. Measures

We used the county, the smallest administrative unit where census data is available, as the unit of analysis in this study. We obtained the GDP, population, numbers of students enrolled in primary and secondary schools from the Inner Mongolia Statistical Yearbooks [42,46]. We obtained data on literacy, population by age groups and death tolls by age groups from the national census database [44,47]. We used the urban population rate to describe the urbanization rate in counties. We calculated the urban population rate by dividing urban population by the total population, which were obtained from the Inner Mongolia Statistical Yearbooks [42,46]. A census survey is carried out every 10 years in China. Therefore, we selected the two most recent census years, 2000 and 2010 to conduct our study.

2.3. HDI Calculation

We calculated the HDI (Human Development Index) according to the original method as it was first released in 1990 [10]. We first calculated the three indicators for income, health, and education (Table 1).
The income indicator was calculated from the per capita GDP (Equation (1)).
I Income = log ( GDP GDP min ) log ( GDP max GDP min )
Health is measured by life expectancy (Equation (2)). We estimated life expectancy by using Life Expectancy Table based on age-group death rate [48], which was calculated from populations and death tolls by age groups [44,47].
I Health = LE LE min LE max LE min
The education index has two components: adult literacy and gross school enrollment (Equation (3)). We used the proportion of the literate population aged above 15 to describe adult literacy. We calculated the gross school enrollment by dividing the total number of students enrolled in primary and secondary schools by the population aged between 5 and 19.
I Education = 2 3 Adult   literacy + 1 3 Gross   enrollment
Finally, we calculated the average value of the three indicators as the HDI. The three indicators and the HDI all range between 0 and 1. The higher the value is, the better condition the indicator suggests (i.e., higher income, more education and longer life expectancy).
It is worth noting that UNDP released a new method to calculate the HDI in 2010 [49], which modified income and education indices’ calculation as well as how to aggregate the three indices. For the income index, the new method uses Gross National Product (GNP) per capita instead of the GDP per capita. For the education index, the new method uses the mean value of schooling years for adults instead of adult literacy; and the expected schooling years for children at school entrance age instead of the gross school enrollment. The new method uses the geometric mean instead of the arithmetic mean to aggregate the three indices. However, we were unable to obtain GNP, mean value of schooling years for adults, and expected schooling years for children at school entrance age for our study area. Limited by data availability, we used the original method to calculate the HDI in our study.

2.4. Statistical Analyses

We first calculated the HDI and urbanization rates for the 101 counties using data from 2000 and 2010. Then we produced a series of maps to visualize HDI indices and the per capita GDP for the years 2000 and 2010 (denoted as “HDI” and “GDP” for simplicity in the following text) as well as their changes by counties in ArcGIS™ 10.3 (ESRI, Redlands, CA, USA) [50]. Spatial autocorrelation analysis measures the spatial dependence of each county’s values of the HDI and GDP at its geographical location. Here, we conducted a local spatial autocorrelation analysis and used the Anselin local Moran’s I Index (Z) to examine whether there was spatial aggregation for the HDI and GDP in 2000 and 2010. Next, we ranked counties according to their per capita GDP and HDI, and compared their rankings between the two indices in 2000 and 2010. Finally, we conducted an independent-samples t-test of all the counties to test whether HDI values differ in urban and rural areas. We also used a partial correlation analysis to examine how urbanization related to GDP and HDI growth.

3. Results

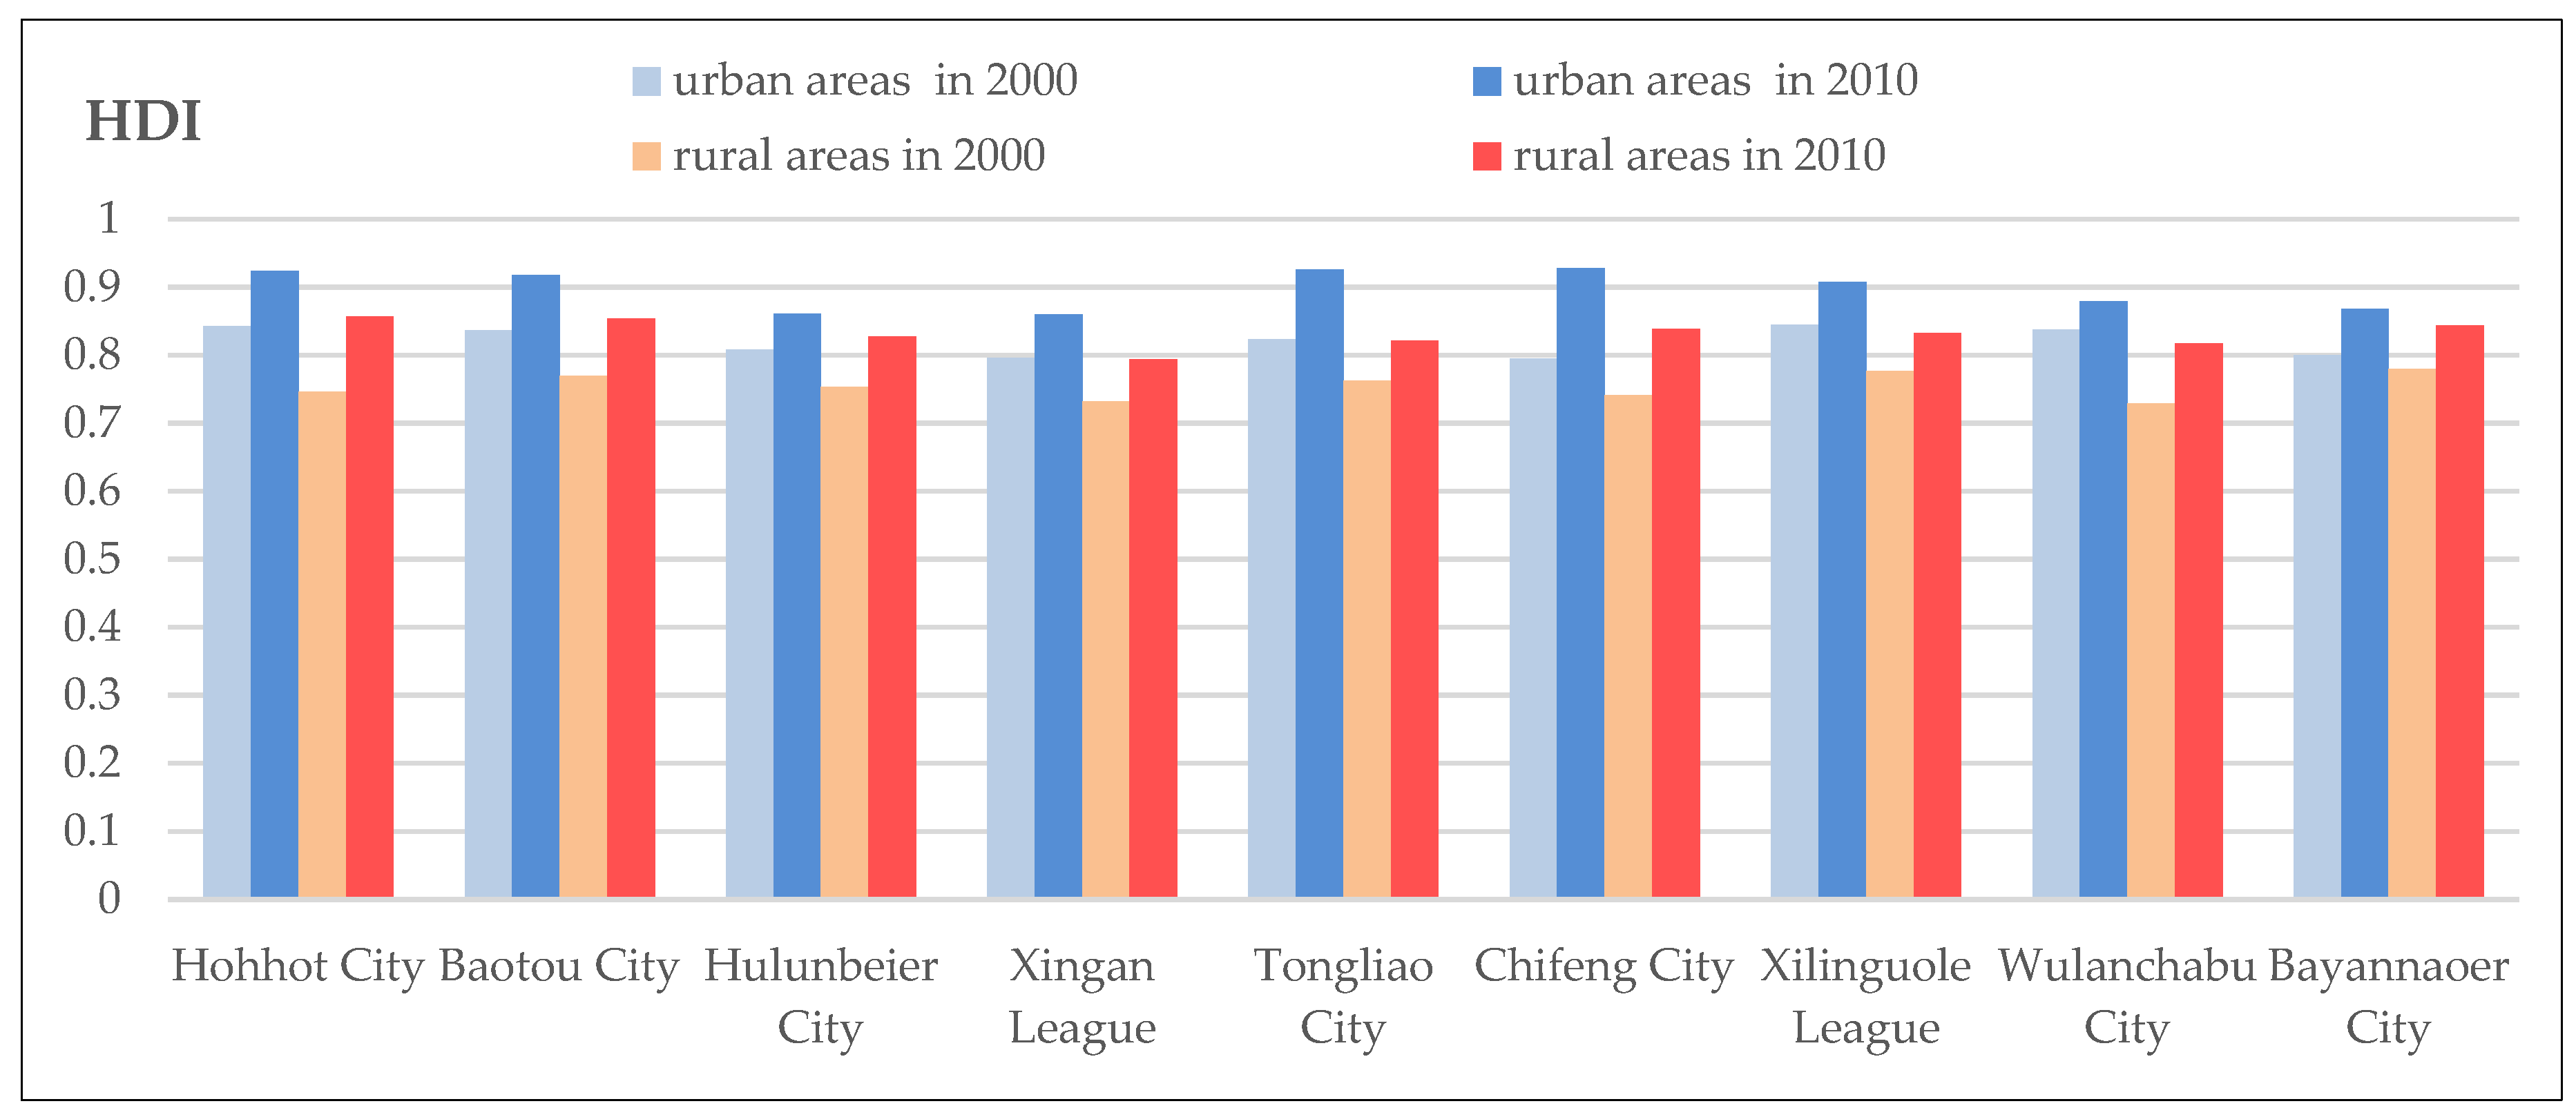
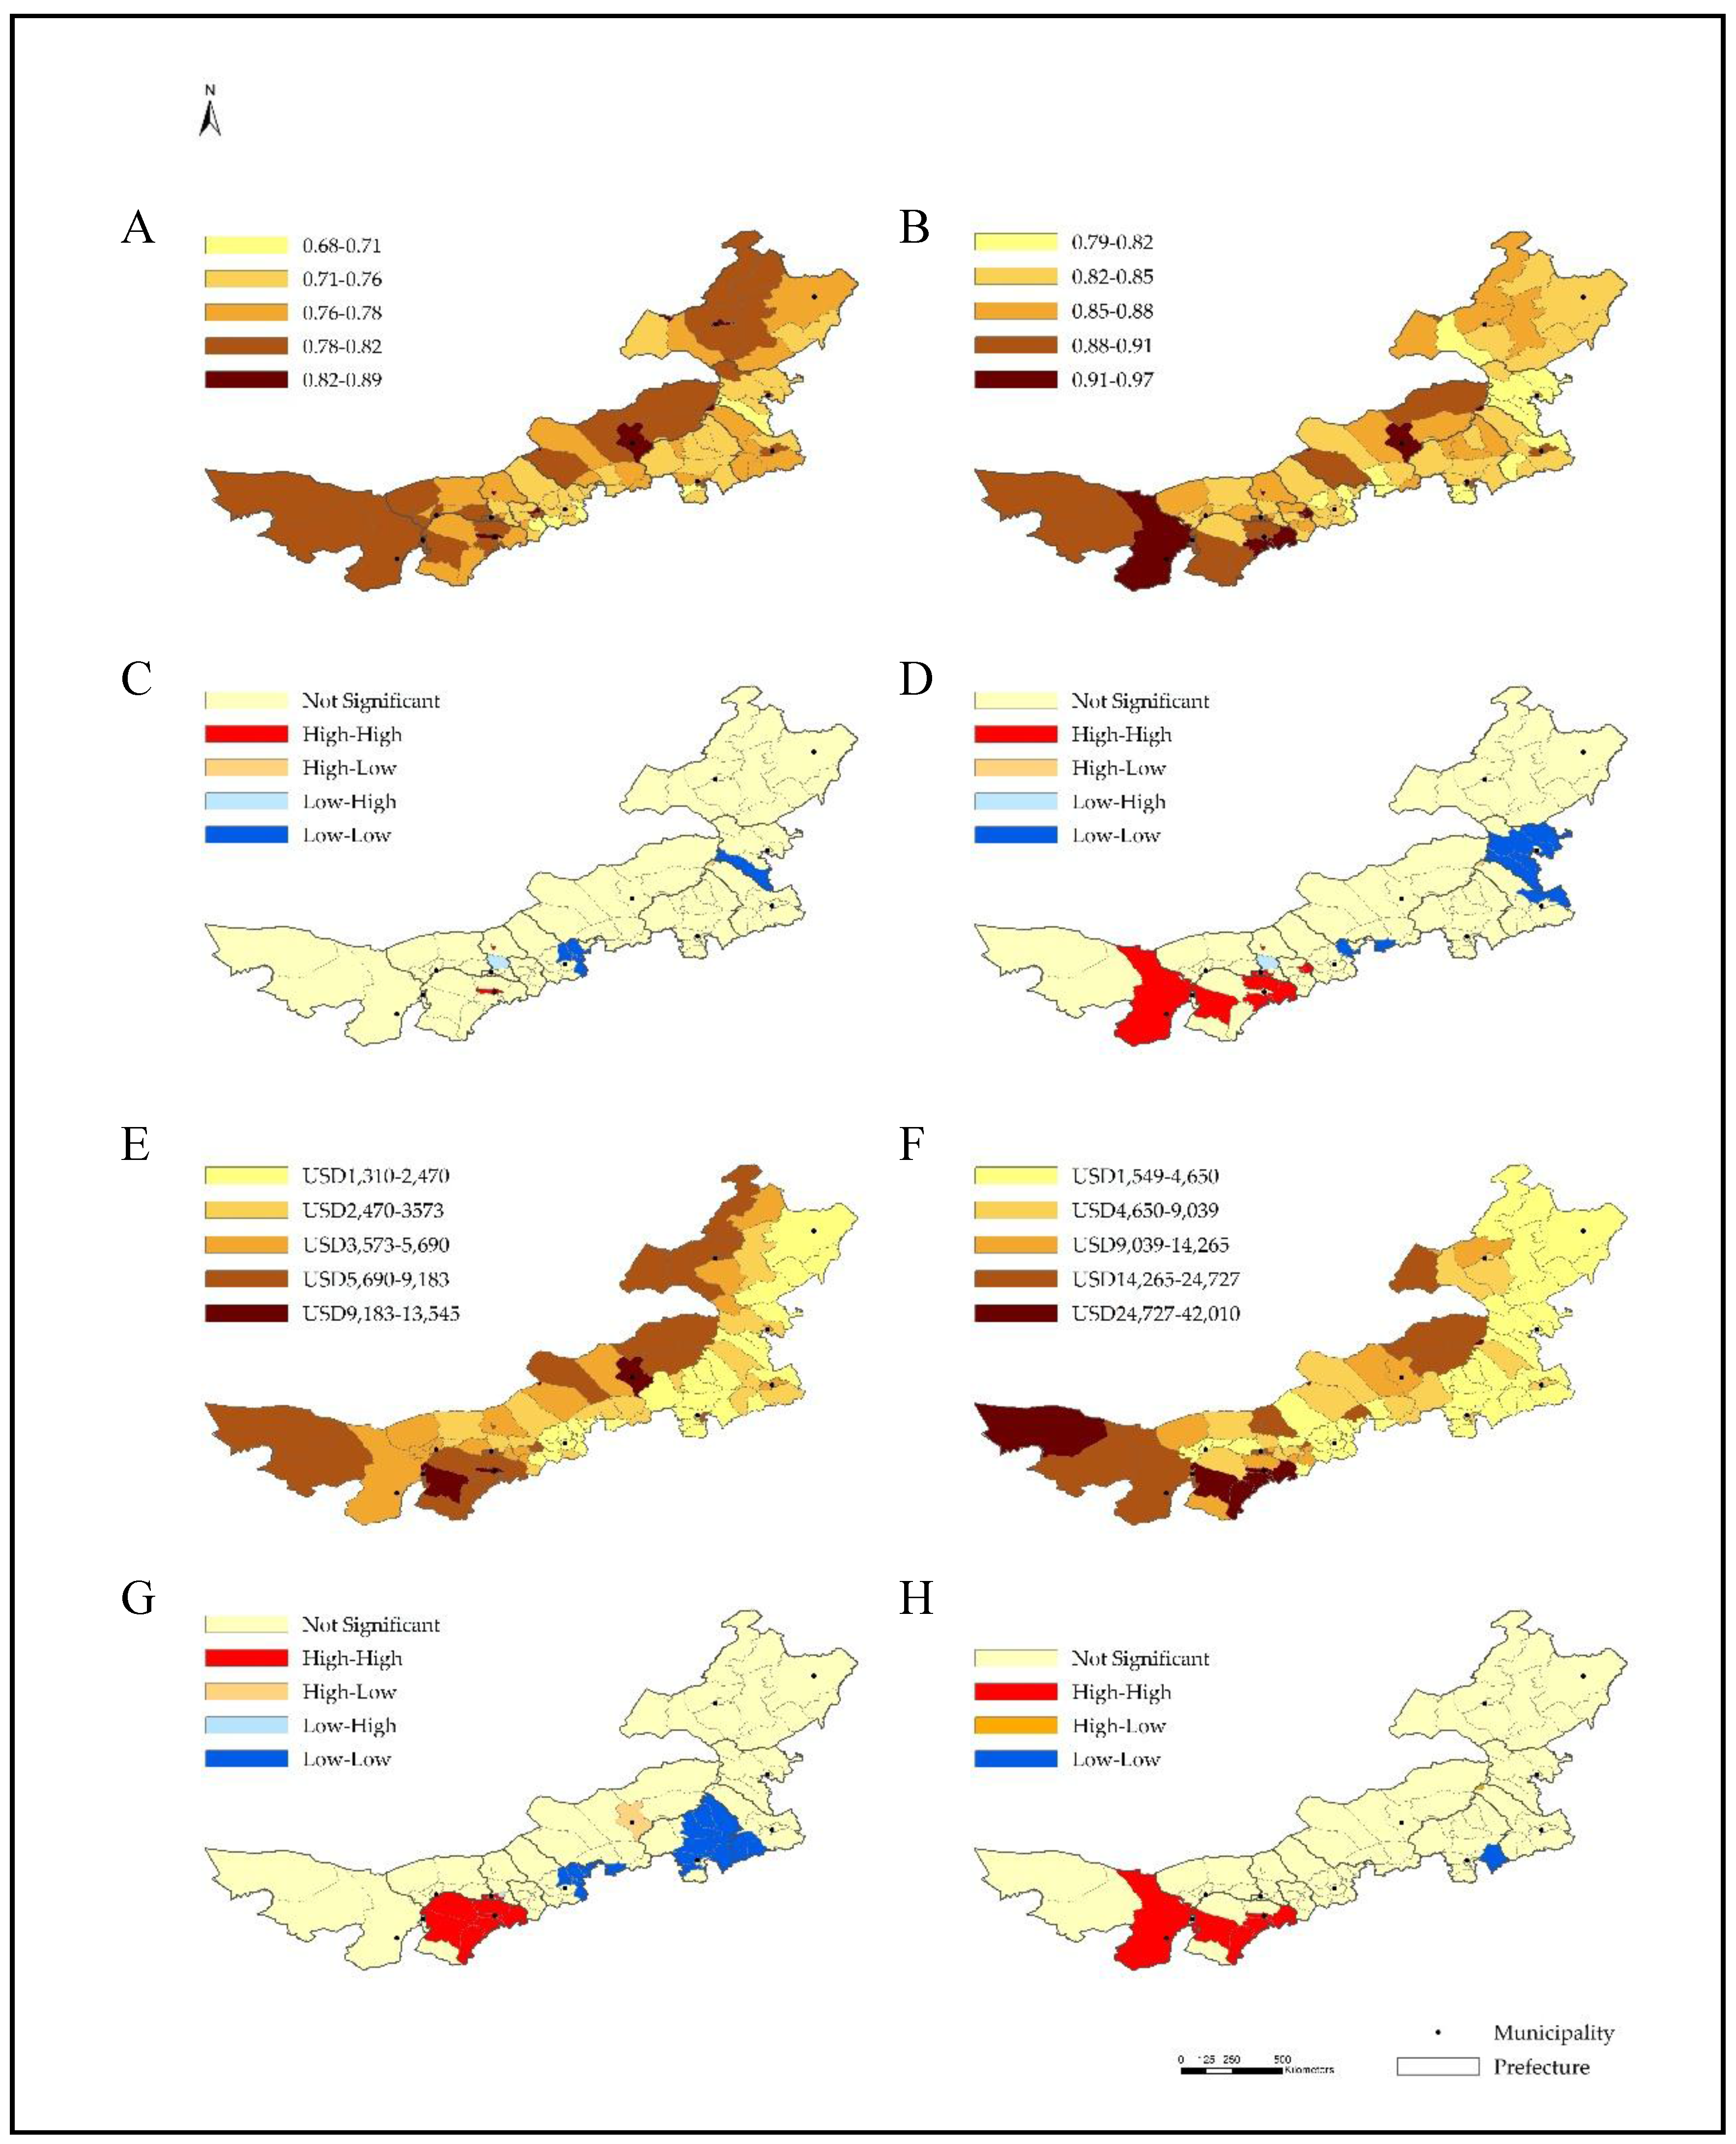
3.1. Temporal and Spatial Patterns of HDI and GDP in 2000 and 2010

We found that the values of the HDI were highly heterogeneous spatially in both 2000 and 2010 (Figure 1A,B), ranging from 0.68 to 0.89 in 2000, and from 0.78 to 0.97 in 2010. The values of the HDI had little spatial pattern in 2000 (Figure 1A), which was echoed by the presence of the very few hot/cool spots in the spatial autocorrelation analysis (Figure 1C). In 2010, however, the western part of Inner Mongolia tended to have higher values of the HDI while the northeastern part tended to have lower values of the HDI (Figure 1B). As shown in the Figure 1D, the high values of the HDI clustered in the western part and the low values clustered in the northeastern part.
The spatial trend for the GDP was rather obvious in 2000 as the high values clustered in the northwest and the low values clustered in the southeast (Figure 1E). Such spatial trend became less obvious in 2010 when high values clustered in several counties in the southwest and low values took up almost the entire northeast and some counties in the middle (Figure 1F). As shown in Figure 1G,H, the high value cluster expanded from 2000 to 2010 whereas the low value cluster shrank.

3.2. Comparing HDI and GDP

The comparison of the spatial patterns of the GDP and HDI, and their changes from 2000 to 2010 showed differences and similarities. In general, the spatial pattern of the GDP in Inner Mongolia was less heterogeneous than that of the HDI (Figure 1E,F). In other words, there was less difference in the GDP spatially across Inner Mongolia than that in the HDI. For example, there was a low-value belt of GDP from the northeast down to the southwest in both 2000 and 2010, but the HDI values did not show such a pattern. In addition, areas clustered with high or low values of per capita GDP were larger than those of the HDI in the year 2000 (Figure 1G). These differences, however, became smaller in the year 2010. For example, areas clustered with high values of per capita GDP and the HDI largely overlapped and were quite similar in 2010. However, areas clustered with low values of per capita GDP were much smaller than those with low values of the HDI (Figure 1H).
We ranked 101 counties based on the HDI scores and the GDP in 2010, and then compared the two rankings of counties. The HDI and GDP rankings of 74 counties are found to differ by more than five places in 2010. The rankings for the HDI and GDP for eight counties differed by more than 30 places (Table 2).
For example, the ranking score of Linxi County’s HDI (46 out of 101) was greatly above its per capita GDP ranking (89 out 101) in 2010. The difference in ranking was as high as 43 places, indicating that although its economic growth was among the last quantile, its overall development measured by the HDI performed well above average in Inner Mongolia. In contrast, Xinbaerhuzuo Banner showed a HDI rank (91 out 101) less favorable than its GDP per capita rank (41 out 101), indicating that although its economic growth was above the average level, the overall development measured by the HDI was among the last several counties in the study region. Whether there is a lag effect between society development (measured by the HDI) and economic development (measured by GDP) requires further research, as it may take some time to translate the financial wealth into human well-being.

3.3. Urbanization, GDP and HDI

We found that the HDI of all the municipal districts were higher than their surrounding rural areas and the differences were statistically significant (p < 0.001) in both 2000 and 2010 (Figure 2). In 2000, the mean of the HDI of the municipal districts was 0.83, while that of the surrounding rural areas was 0.77. In 2010, the difference of the mean HDI between municipal districts and their surrounding rural areas decreased from 0.057 in 2000 to 0.054 in 2010. The difference of 0.003 is fairly small, suggesting that the disparities between urban and rural areas in the HDI were reducing at a very slow pace.
Our results suggested that the HDI positively correlated with the urbanization rate measured by the proportion of urban population in both 2000 and 2010. When we controlled the effects of GDP, the partial correlation coefficients were 0.691 and 0.679 respectively in 2000 and 2010 with p-values smaller than 0.001. However, when controlling for the effects of the HDI, the urbanization rate was not significantly related to GDP, as suggested by the partial correlation coefficients of −0.144 (p = 0.153) and 0.019 (p = 0.853) in 2000 and 2010, respectively.

4. Discussion

This study calculated the HDI and per capita GDP for the 101 counties in Inner Mongolia in 2000 and 2010. We found that both the HDI and GDP tended to have higher values in southwestern parts and lower values in northeastern parts of the study area. Although the HDI and GDP had similar spatial patterns, GDP values were more similar across counties than the HDI. When urbanization was considered, our results indicated that the urbanization rate contributed to a higher HDI when the effects of GDP were controlled.
Our results suggested that Inner Mongolia had an unbalanced regional development in both economy and the society, as indicated by the GDP and HDI. The southwestern area in Inner Mongolia had both a higher HDI and GDP than the northeastern area. Among 48 out of the 101 counties that have HDI values above the average value of 0.86 in 2010, 31 of them are located in the western part of Inner Mongolia. This is consistent with findings from previous studies [51,52].
The unbalanced regional development, however, was reflected differently, when looking at HDI and GDP rankings. As many as 74 counties ranked differently for the GDP and HDI and the difference is over five places. Table 2 showed that the rankings for nine and eight counties differed over 30 places between the HDI and GDP in 2000 and 2010 respectively. Local governors are frequently evaluated by the counties’ GDP rankings. Dramatic differences between HDI and GDP rankings indicate an existing potential bias when only the GDP ranking is considered. Our results showed that all the urban districts (same level of administrative unit as county, used in urban areas) had higher HDI scores and per capita GDP than the rural counties in the same prefecture (the one-level higher administrative unit than county). People, resources and wealth accumulate in cities. By definition, cities do better in economic and social development than their surrounding rural areas. Our findings are consistent with such expectation of cities. Results from partial correlation between the HDI, urban population proportion and the per capita GDP indicated that urbanization contributed to increase the HDI even after controlling for the impacts from the GDP. Moreover, the positive relationship between urbanization and the HDI was strong as the correlation coefficients were both larger than 0.6. These results indicated that with a similar level of economic development measured by the per capita GDP, urban areas tend to do better in life expectancy, school enrollment and adult literacy, and have higher HDI scores than rural areas. As revealed by the father of the HDI, Mahbub ul Haq, while development in local economy and GDP growth makes many social services and improvements within reach, whether this happens still relies on many other factors [12]. Our analysis suggested that urbanization is one of these factors, which has important impacts on the process of translating economic development into social improvement.
Some strengths and limitations exist. We used official government data for our variables and we relied on census data to calculate the HDI for counties. Since a census survey is conducted every ten years in China, we only had data in 2000 and 2010. As a result, we could not adopt the new method for calculating the HDI due to the lack of data on income and education. The lack of time continuous data limited our capacity to explain the change in the variables of interest between the 2000 and 2010. Failing to adopt the new method for calculating the HDI, however, may not impact our results significantly for the following reasons. First, replacing the GDP with GNP would not introduce much change since both foreign investment in this region and earnings gained by residents outside the region are neglectable; second, the new method replaces the adult literacy rate and school enrolling rate with schooling years (i.e., schooling years for adults and expected schooling years for children at school entrance age). Many developed countries do well in eliminating adult illiteracy and having all children enroll in school and score high in the education sub-index when measured by the old indicators. However, the new method can capture the difference in education performance among these countries by schooling years. Both the literacy rate and school enrollment rate vary considerably in our study area. Using them to calculate the education sub-index presents variations in education in our study area well since the education index ranged from 0.75 to 0.97 in 2010. Therefore, adopting the new indicators is not a prerequisite in our case study. Last, we used the geometric means of the three sub-indices to calculate the HDI and compared the results with that of the arithmetic means. Although the values are different, the spatial patterns, changes from 2000 to 2010 and the relationship with urbanization rates remain similar.

5. Conclusions

We analyzed economic and social development in Inner Mongolia, China in 2000 and 2010 by calculating and comparing the per capita GDP and HDI in counties. Inner Mongolia as a whole experienced a dramatic economic growth during 2000–2010. As we found here, the values of both the HDI and GDP were very spatially heterogeneous and told very different stories on local performance in development at the county level. Having a high score in one of the two indicators does not necessarily guarantee a high score in the other. Future studies may examine which drivers lead to the disparities between northeast and southwest Inner Mongolia as well as such a sharp difference between HDI and GDP rankings. The coal mining industry grew during the period 2000–2010 in many counties within our study region, which brought GDP surges as well as other environmental and social impacts. How the mining development contributed to a HDI increase is a question worth examining. In addition, our study area include both agriculture and grazing regions. Whether natural environment and the way local people utilize natural resources influences the GDP and HDI patterns and changes is also worth exploring.
GDP growth and rankings are still frequently used as an important indicator in the evaluation of the performance of local governments. As revealed in our study, GDP rankings may be very different from HDI rankings. While the GDP measures how local economy performs, the HDI reveals how the local society supports people in terms of education and health. Instead of achieving a high score on economic growth, the ultimate goal for a society is to support people to fulfill their lives. Therefore, translating economic growth into improvements in education and health is important. As what we measure often affects what we do [4], we argue that attention on GDP ranking should be reduced and more focus should be put on HDI rankings.

Acknowledgments

The authors thank both anonymous reviewers for their valuable input and constructive comments. This study is supported by the National Basic Research Program of China (2014CB954302).

Author Contributions

G.H. designed the study, rewrote, and revised the paper; Y.J. collected and analyzed the data, wrote the first draft, and revised the paper.

Conflicts of Interest

The authors declare no conflict of interest.

References

  1. Dasgupta, P. Human Well-Being and the Natural Environment; Oxford University Press: Oxford, UK, 2001. [Google Scholar]
  2. Abramovitz, M.; Inkeles, A. Economic growth and its discontents. Bull. Am. Acad. Arts Sci. 1973, 27, 11–27. [Google Scholar] [CrossRef]
  3. Layard, R. Happiness: Lessons form a New Science; Penguin Press: London, UK, 2005. [Google Scholar]
  4. Forgeard, M.J.C.; Jayawickreme, E.; Kern, M.L.; Seligman, M.E.P. Doing the right thing: Measuring wellbeing for public policy. Int. J. Wellbeing 2011, 1, 79–106. [Google Scholar]
  5. Morris, D.; McAlpin, M. Measuring the Condition of the World’s Poor; Pergamons Press: Oxford, UK, 1979; pp. 20–40. [Google Scholar]
  6. Bradburn, N. The Structure of Psychological Well-Being; Aldine: Chicago, IL, USA, 1969; pp. 252–253. [Google Scholar]
  7. Diener, E.; Emmons, R.A.; Larsen, R.J.; Griffin, S. The satisfaction with life scale. J. Personal. Assess. 1985, 49, 71–75. [Google Scholar] [CrossRef] [PubMed]
  8. Marks, N.; Abdallah, S.; Simms, A.; Thompson, S. The Happy Planet Index; New Economics Foundation: London, UK, 2006; pp. 10–14. [Google Scholar]
  9. Vazquez, C.; Hervas, G. Addressing current challenges in cross-cultural measurement of well-being: The pemberton happiness index. In Well-Being and Culture: Perspectives from Positive Psychology; Springer: Dutch, The Netherlands, 2013; Volume 3, pp. 31–49. [Google Scholar]
  10. United Nations Development Programme (UNDP). Human Development Report 1990: Concept and Measurement of Human Development; Oxford University Press: New York, NY, USA, 1990. [Google Scholar]
  11. Sen, A. Development as Freedom; Oxford University Press: Oxford, UK, 2001; pp. 22–24. [Google Scholar]
  12. Ul Haq, M. The birth of the human development index. In Readings in Human Development; Oxford University Press: Oxford, UK, 2003; Volume 2, pp. 127–137. [Google Scholar]
  13. United Nations Development Programme (UNDP). Human Development Report 2015: Work for Human Development; UNDP: New York, NY, USA, 2015. [Google Scholar]
  14. Desai, M. Human development: Concept and measurement. Eur. Econ. Rev. 1991, 35, 350–357. [Google Scholar] [CrossRef]
  15. Sagar, A.D.; Najam, A. The human development index: A critical review 1. Ecol. Econ. 1998, 25, 249–264. [Google Scholar] [CrossRef]
  16. Stanton, E. The Human Development Index: A History. Working Papers. 2007. Available online: http://scholarworks.umass.edu/peri_workingpapers/85/ (accessed on 28 November 2016).
  17. Pinar, M.; Stengos, T.; Yazgan, M.E. Measuring human development in the mena region. Emerg. Mark. Financ. Trade 2015, 51, 1179–1192. [Google Scholar] [CrossRef]
  18. Sharma, K. Human development and South East Asian countries: Special emphasis on India. J. Educ. Health Promot. 2013, 2, 45. [Google Scholar] [CrossRef] [PubMed]
  19. Türe, C. A methodology to analyse the relations of ecological footprint corresponding with human development index: Eco-sustainable human development index. Int. J. Sustain. Dev. World Ecol. 2013, 20, 9–19. [Google Scholar] [CrossRef]
  20. Blancard, S.; Hoarau, J.F. A new sustainable human development indicator for small island developing states: A reappraisal from data envelopment analysis. Econ. Model. 2013, 30, 623–635. [Google Scholar] [CrossRef]
  21. Wu, S.H.; Woo, J.; Zhang, X.H. Worldwide socioeconomic status and stroke mortality: An ecological study. Int. J. Equity Health 2013, 12, 1–11. [Google Scholar] [CrossRef] [PubMed]
  22. Ghoncheh, M.; Mirzaei, M.; Salehiniya, H. Incidence and mortality of breast cancer and their relationship with the human development index (HDI) in the world in 2012. Asian Pac. J. Cancer Prev. 2015, 16, 8439–8443. [Google Scholar] [CrossRef] [PubMed]
  23. Ghoncheh, M.; Mohammadian-Hafshejani, A.; Salehiniya, H. Incidence and mortality of breast cancer and their relationship to development in Asia. Asian Pac. J. Cancer Prev. 2015, 16, 6081–6087. [Google Scholar] [CrossRef] [PubMed]
  24. Lacey, C.J. Global burden of human papillomavirus and related diseases. Vaccine 2012, 30 (Suppl. 5), F12–F23. [Google Scholar]
  25. Hu, Q.D.; Zhang, Q.; Chen, W.; Bai, X.L.; Liang, T.B. Human development index is associated with mortality-to-incidence ratios of gastrointestinal cancers. World J. Gastroenterol. 2013, 19, 5261–5270. [Google Scholar] [CrossRef] [PubMed]
  26. Rodríguez-Morales, A.J.; Castañeda-Hernández, D.M. Relationships between morbidity and mortality from tuberculosis and the human development index (HDI) in Venezuela, 1998–2008. Int. J. Infect. Dis. 2012, 16, e704–e705. [Google Scholar] [CrossRef] [PubMed]
  27. Salazar Silva, F.; Villatoro Velazquez, J.A.; Oliva Robles, N.F.; Hynes, M.; de Marco, M. Relationship between human development and drug use. Human development index and drug use. Salud Ment. 2014, 37, 35–39. [Google Scholar] [CrossRef]
  28. Roy, A.; Roe, M.T.; Neely, M.L.; Cyr, D.D.; Zamoryakhin, D.; Fox, K.A.; White, H.D.; Armstrong, P.W.; Ohman, E.M.; Prabhakaran, D. Impact of human development index on the profile and outcomes of patients with acute coronary syndrome. Heart 2015, 101, 279–286. [Google Scholar] [CrossRef] [PubMed]
  29. Dutra, F.; Rodrigues, P.; Fialho, E.; Lannes, D.; Atella, G. Education and globalization: A research of food consumption and obesity with children from low and high human development index areas. In Proceedings of the 5th International Conference of Education, Research and Innovation (ICERI), Madrid, Spain, 19–21 November 2012; Chova, L.G., Martinez, A.L., Torres, I.C., Eds.; International Technology, Education and Development (INTED): Valencia, Spain, 2012; pp. 1602–1606. [Google Scholar]
  30. Lee, A.Y.; Pridmore, S. Emerging correlations between measures of population well-being, suicide and homicide: A look at global and Australian data. Aust. Psychiatry 2014, 22, 112–117. [Google Scholar] [CrossRef] [PubMed]
  31. Dumith, S.C.; Hallal, P.C.; Reis, R.S.; Rd, K.H. Worldwide prevalence of physical inactivity and its association with human development index in 76 countries. Prev. Med. 2011, 53, 24–28. [Google Scholar] [CrossRef] [PubMed]
  32. Kusharjanto, H.; Kim, D. Infrastructure and human development: The case of Java, Indonesia. J. Asia Pac. Econ. 2011, 16, 111–124. [Google Scholar] [CrossRef]
  33. Amador-Jimenez, L.; Willis, C.J. Demonstrating a correlation between infrastructure and national development. In. J. Sustain. Dev. World Ecol. 2011, 19, 197–202. [Google Scholar] [CrossRef]
  34. Harttgen, K.; Vollmer, S. A reversal in the relationship of human development with fertility? Demography 2014, 51, 173–184. [Google Scholar] [CrossRef] [PubMed]
  35. Gaygısız, E. How are cultural dimensions and governance quality related to socioeconomic development? J. Socio-Econ. 2013, 47, 170–179. [Google Scholar] [CrossRef]
  36. Schmitt, J.V.; Miot, H.A. Distribution of brazilian dermatologists according to geographic location, population and hdi of municipalities: An ecological study. An. Bras. Dermatol. 2014, 89, 1013–1015. [Google Scholar] [CrossRef] [PubMed]
  37. Pinheiro, A.C.; Niederauer, J.M.; Vargas, D.M. Secular trend of growth in stature in Florianopolis in the state of Santa Catarina (Brazil) in relation with the human development index (HDI). Cien Saude Colet 2014, 19, 227–233. [Google Scholar] [CrossRef] [PubMed]
  38. Permanyer, I. Using census data to explore the spatial distribution of human development. World Dev. 2013, 46, 1–13. [Google Scholar] [CrossRef]
  39. Silva, R.; Ferreira-Lopes, A. A regional development index for portugal. Soc. Indic. Res. 2014, 118, 1055–1085. [Google Scholar] [CrossRef]
  40. Batty, M. The New Science of Cities; MIT Press: Cambridge, MA, USA, 2013. [Google Scholar]
  41. Inner Mongolia Autonomous Region Bureau of Statistics. Inner Mongolia Statistical Yearbooks 2015; China Statistic Press: Beijing, China, 2015. (In Chinese) [Google Scholar]
  42. Inner Mongolia Autonomous Region Bureau of Statistics. Inner Mongolia Statistical Yearbooks 2011; China Statistic Press: Beijing, China, 2011. (In Chinese) [Google Scholar]
  43. National Bureau of Statistics of the People’s Public of China. China Statistical Yearbooks 2011; China Statistic Press: Beijing, China, 2011. (In Chinese)
  44. Office for the Sixth Population Census of Inner Mongolia Autonomous Region; Inner Mongolia Autonomous Region Bureau of Statistics. Tabulation on the 2010 Population Census of Inner Mongolia Autonomous Region; China Statistic Press: Beijing, China, 2012. (In Chinese) [Google Scholar]
  45. Population Census Office under the State Council; Department of Population and Employment Statistics National Bureau of Statistics. Tabulation on the 2010 Population Census of the People’s Republic of China; China Statistic Press: Beijing, China, 2012. (In Chinese)
  46. Inner Mongolia Autonomous Region Bureau of Statisitcs. Inner Mongolia Statistical Yearbooks 2001; China Statistic Press: Beijing, China, 2001. (In Chinese) [Google Scholar]
  47. Office for the Fifth Population Census of Inner Mongolia Autonomous Region; Inner Mongolia Autonomous Region Bureau of Statistics. Tabulation on the 2000 Population Census of Inner Mongolia Autonomous Region; China Statistic Press: Beijing, China, 2002. (In Chinese) [Google Scholar]
  48. Zha, R.C. Life Expectancy Table. Popul. Res. 1981, 5, 55–61. (In Chinese) [Google Scholar]
  49. United Nations Development Programme (UNDP). Human Development Report 2010. The Real Wealth of Nations: Pathways to Human Development; Palgrave Macmillan: New York, NY, USA, 2010; p. 15. [Google Scholar]
  50. Environmental Systems Research Institute (ESRI). ArcGIS Desktop: Release 10; Environmental Systems Research Institute: Redlands, CA, USA, 2011. [Google Scholar]
  51. Wu, X.D.; Wang, C.Z. County-level economy development model in Inner Mongolia. J. Inner Mong. Norm. Univ. (Philos. Soc. Sci.) 2009, 38, 89–94. (In Chinese) [Google Scholar]
  52. Jiang, Y.Z. The theoretical thoughts of economic development mode in Inner Mongolia. North. Econ. 2009, 1, 22–23. Available online: http://www.cnki.com.cn/Article/CJFDTotal-BFJJ200901009.htm (accessed on 28 November 2016). (In Chinese)[Google Scholar]
Figure 1. Spatial distributions of the HDI and per capita GDP in 2000 and 2010. (A) the HDI in 2000 and (B) the HDI in 2010; (C) Spatial clusters of the HDI in 2000 and (D) Spatial clusters of the HDI in 2010; (E) the GDP in 2000 and (F) the GDP in 2010; (G) Spatial clusters of the GDP in 2000 and (H) Spatial clusters of the GDP in 2010.
Sustainability 09 00235 g001
Figure 2. Comparing HDI between urban and rural areas in 2000 and 2010.
Sustainability 09 00235 g002
Table 1. Human Development Index calculation
Indicators Measure
Income GDP per capita
Health Life expectancy
EducationAdult LiteracyProportion 15 and older with literacy
Gross EnrolmentProportion 5–19 year-old population of primary and secondary students
Table 2. GDP per capita and the HDI rankings differed over 30 places (GDP rank minus HDI rank).
More Favorable HDI Rank Less Favorable HDI Rank
Year 2000 Year 2000
Hongshan District in Chifeng City+40Xinbaerhuyou Banner in Hulunbeier City−50
Genhe City in Hulunbeier City+30Hangjin Banner in Erdos City−37
Wushen Banner in Erdos City−34
Zhungeer Banner in Erdos City−33
Dongwuzhumuqin Banner in Xilinguole League−32
Tumotezuo Banner in Hohhot City−31
Xinbaerhuzuo Banner in Hulunbeier City−30
Year 2010 Year 2010
Linxi County in Chifeng City+43Xinbaerhuzuo Banner in Hulunbeier City−50
Hongshan District in Chifeng City+41Sunitezuo Banner in Xilinguole League−41
Jining District in Wulanchabu City+38Xinbaerhuyou Banner in Hulunbeier City−38
Balinyou Banner in Chifeng City+34Xiwuzhumuqin Banner in Xilinguole League−37
Note: This table lists counties that have per capita GDP and HDI rankings that differ by more than 30 places. The column “More favorable HDI rank” lists counties whose HDI ranking was higher than their per capita GDP and therefore their overall development is better than economic growth in terms of ranking. The column “Less favorable HDI rank” listed counties whose HDI ranking was lower than their per capita GDP and therefore their economic growth is better than the overall development in terms of franking.

