Spatial Variability and Ecological Effects of Anthropogenic Activities in a Nature Reserve: A Case Study in the Baijitan National Nature Reserve, China


Abstract
:1. Introduction
2. Methodology
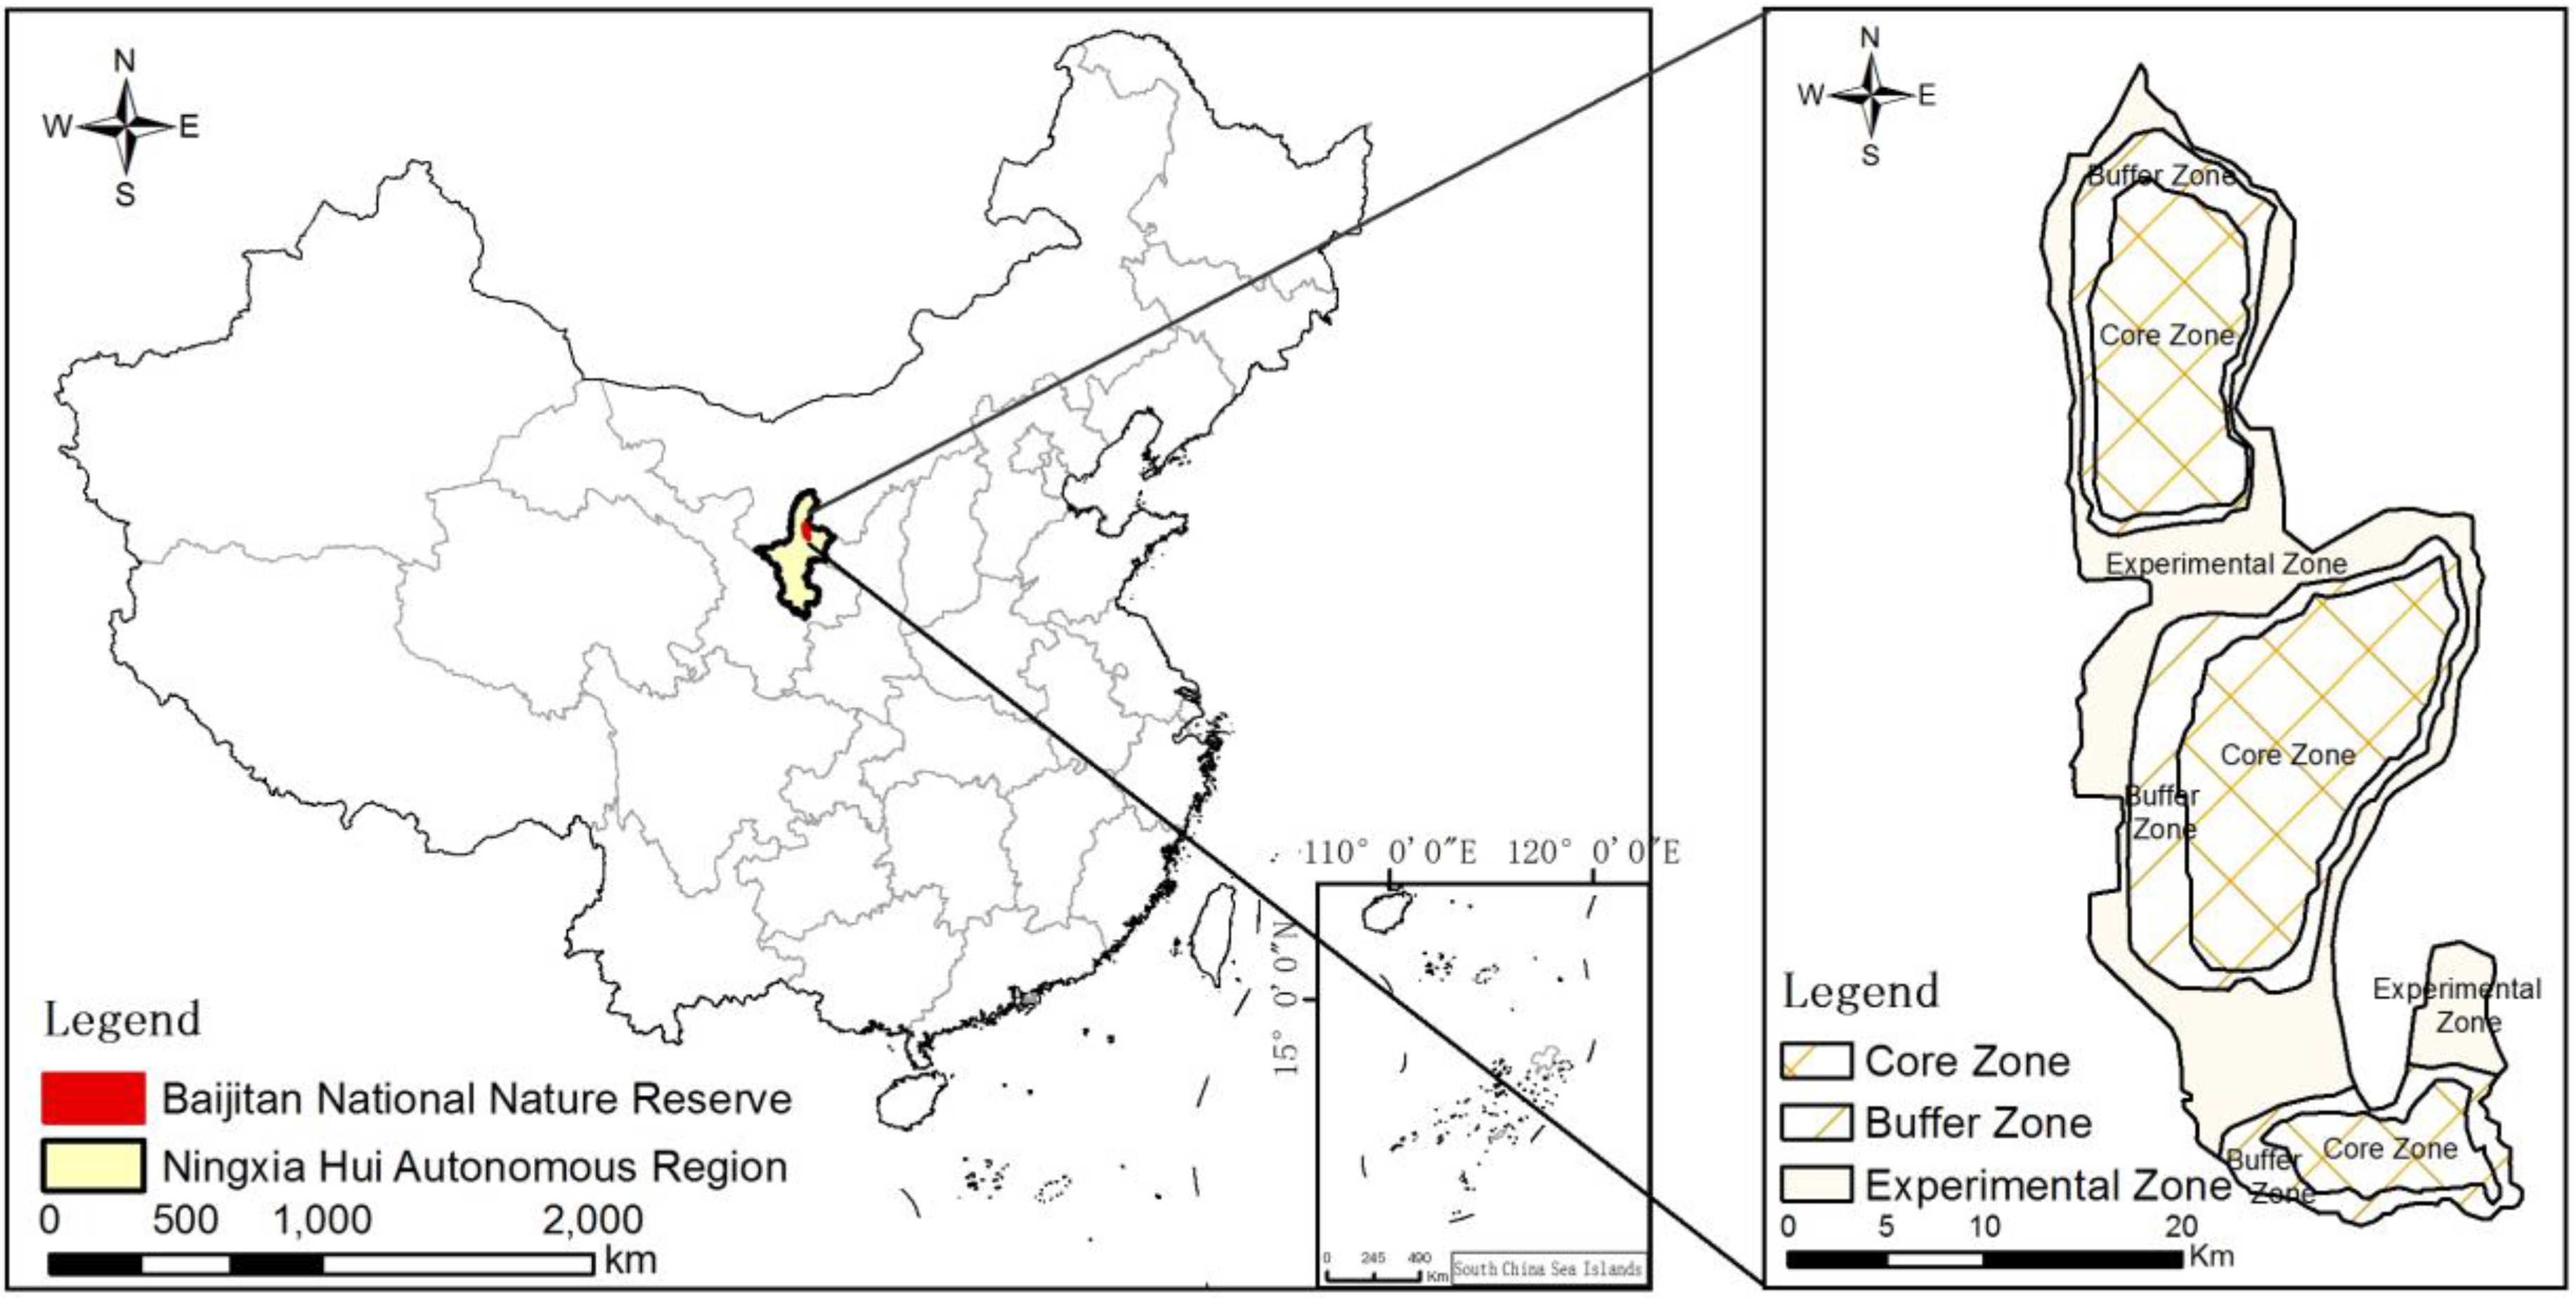
2.1. Study Area
2.2. Data and Tools Used
2.3. Landscape Indices (LI)
2.3.1. Patch density (PD)
2.3.2. Landscape shape index (LSI)
2.3.3. Landscape division index (DIVISION)
2.3.4. Contagion Index (CONTAG)
2.3.5. Shannon′s diversity index (SHDI)
2.3.6. Shannon′s evenness index (SHEI)
2.4. Human Interference in the Nature Reserve
3. Results and Analysis
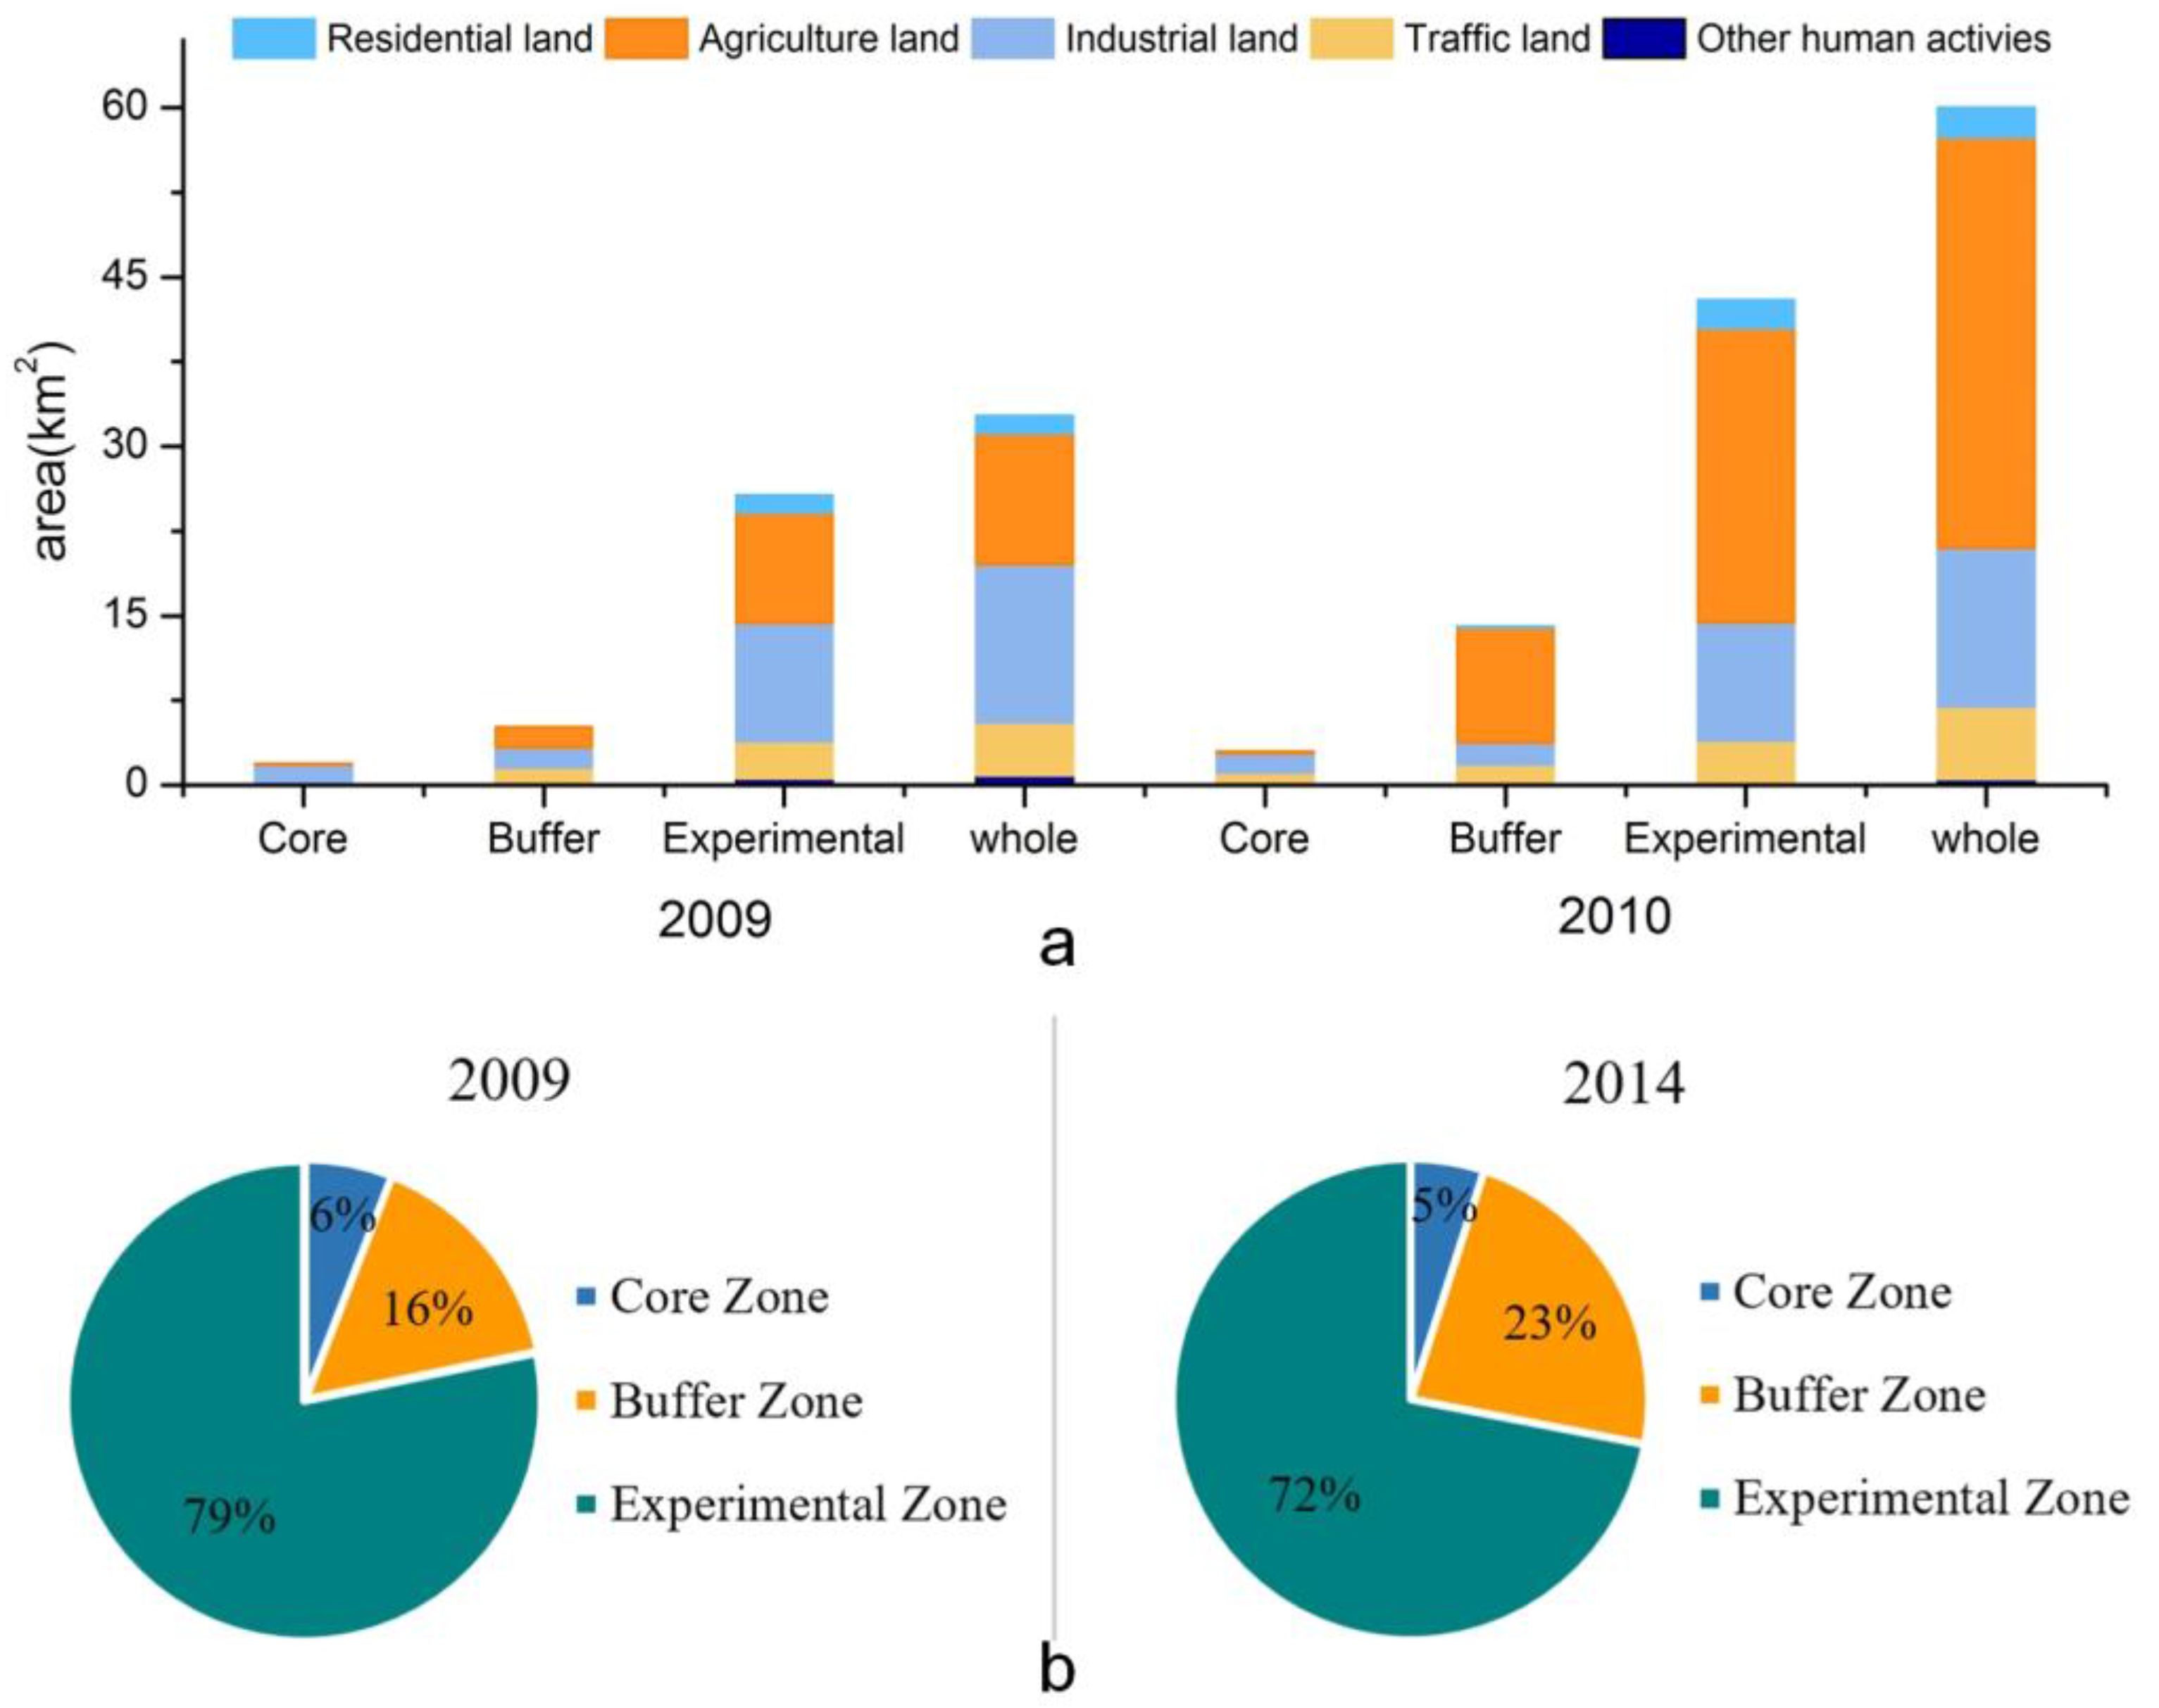
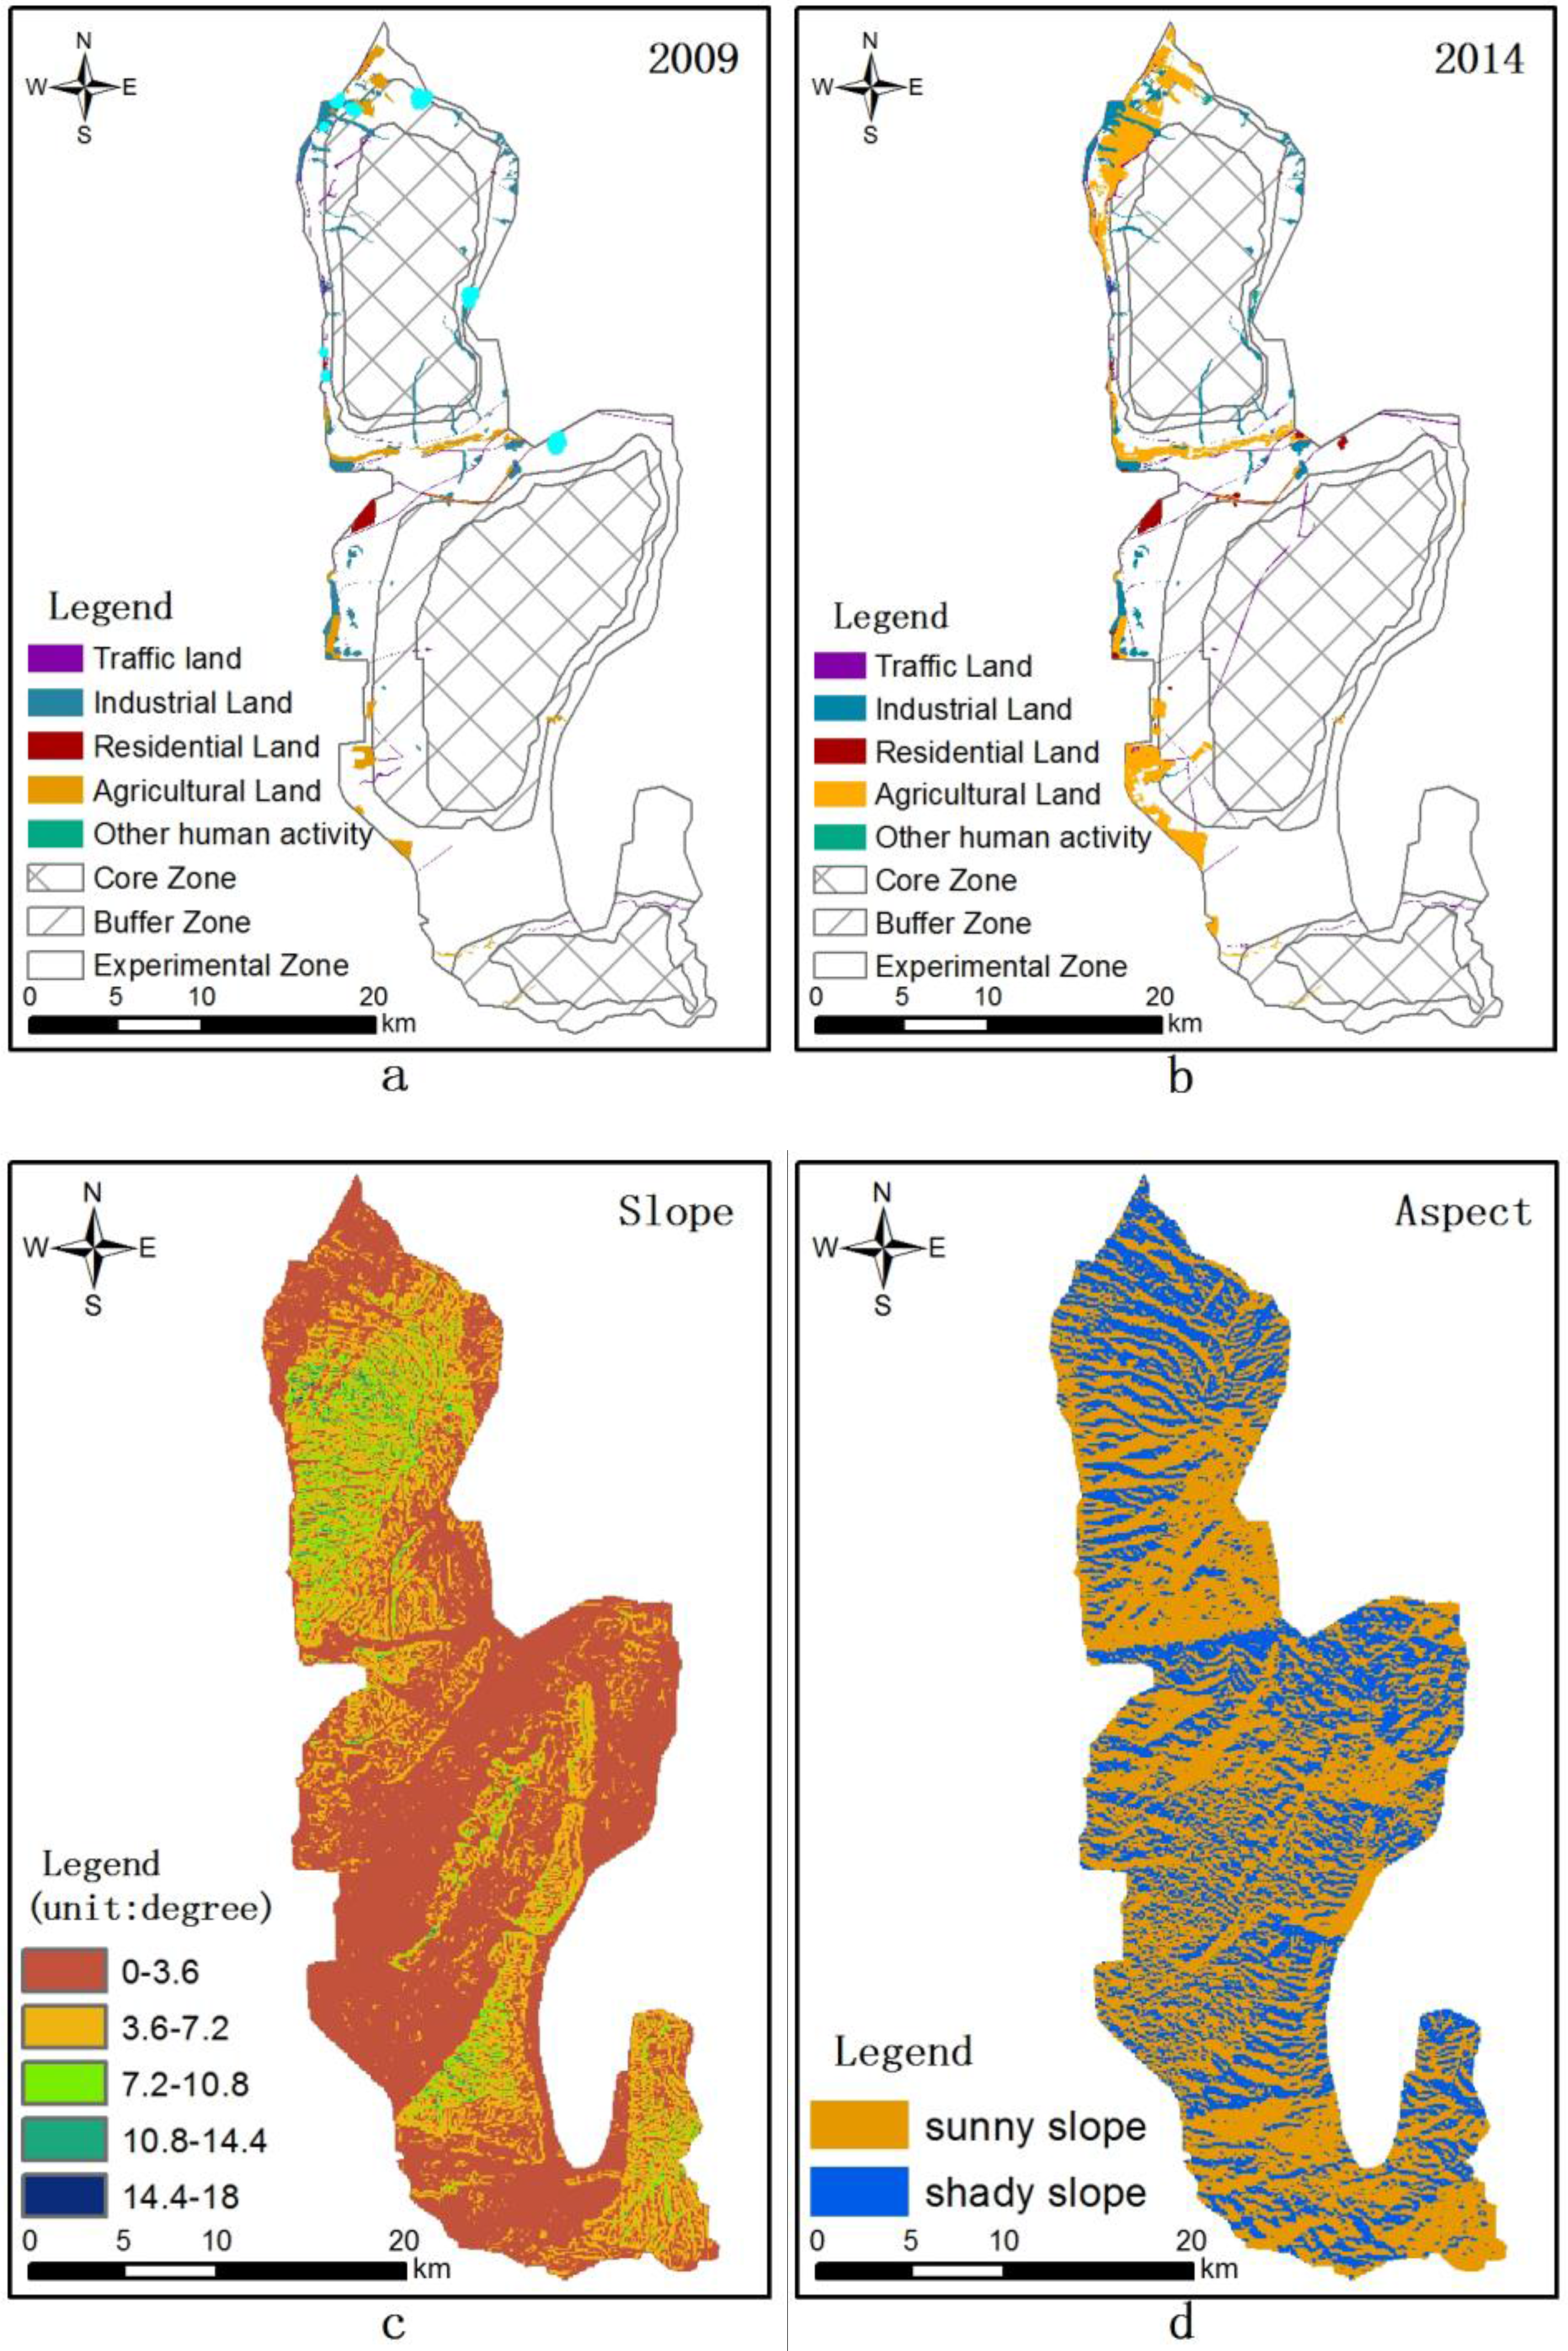
3.1. Distribution of Human Activities
3.2. Landscape Indices (LI)
3.3. Distribution Regularity of Human Activities
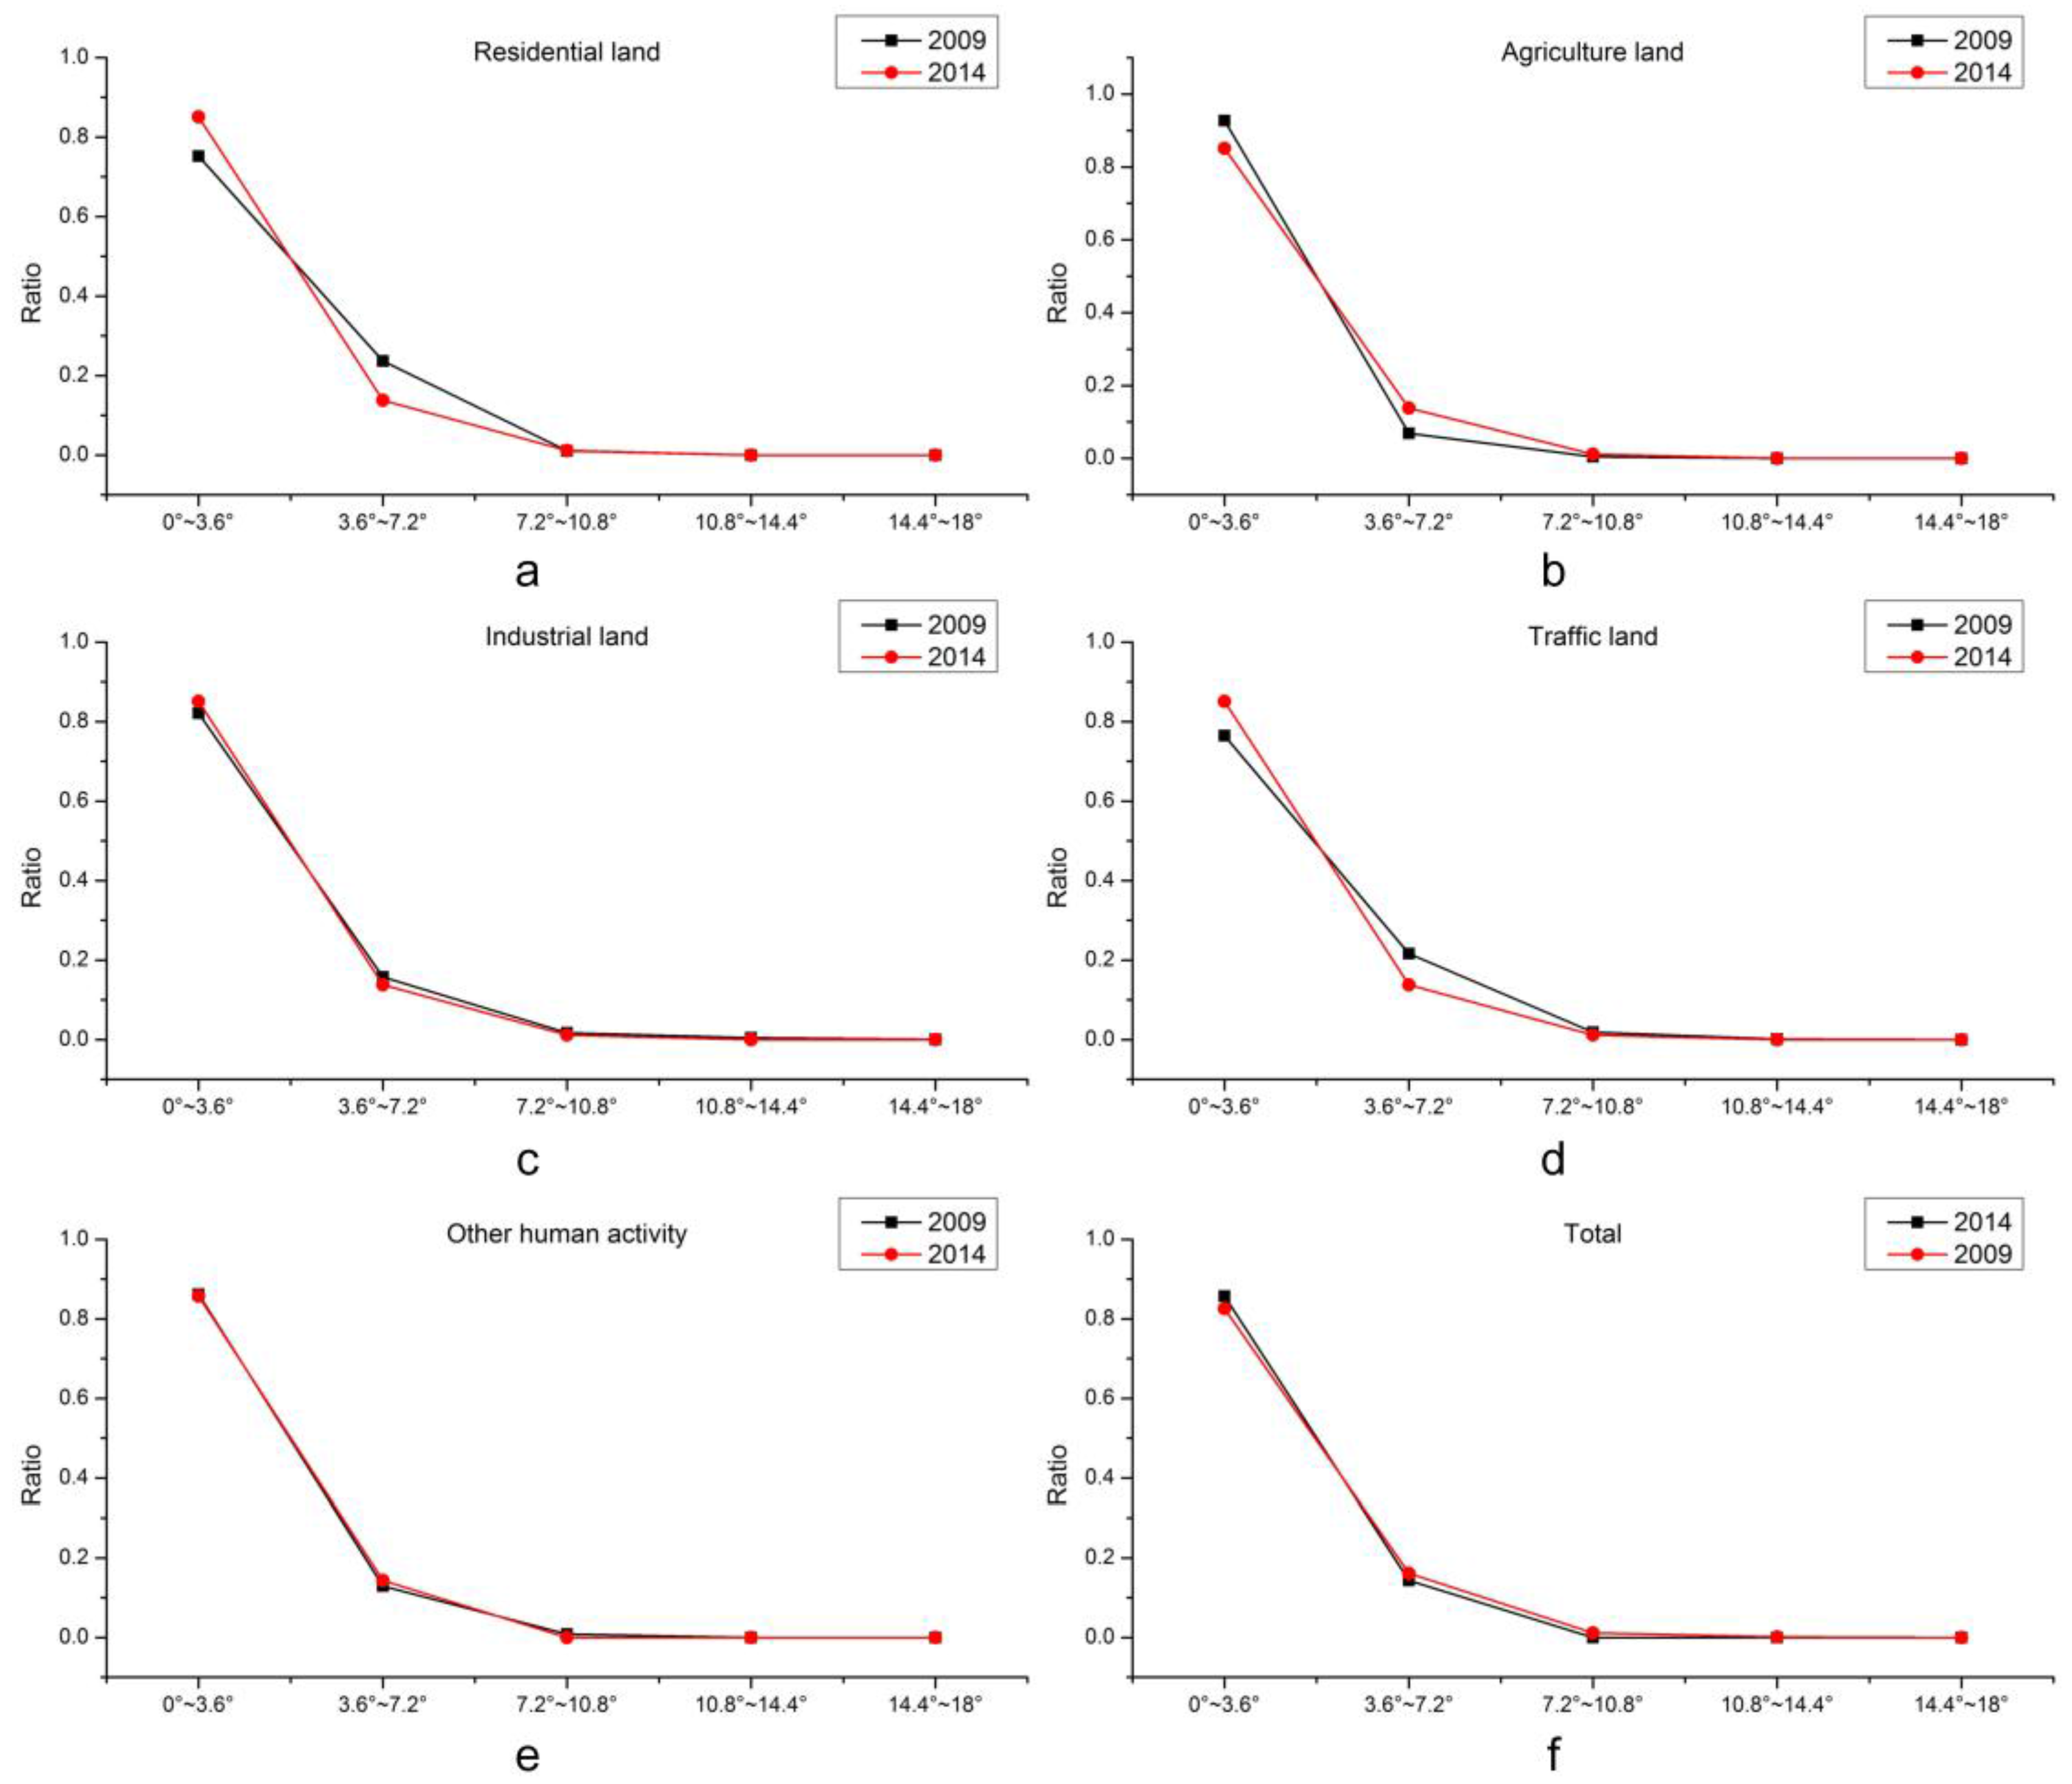
3.3.1. Slope
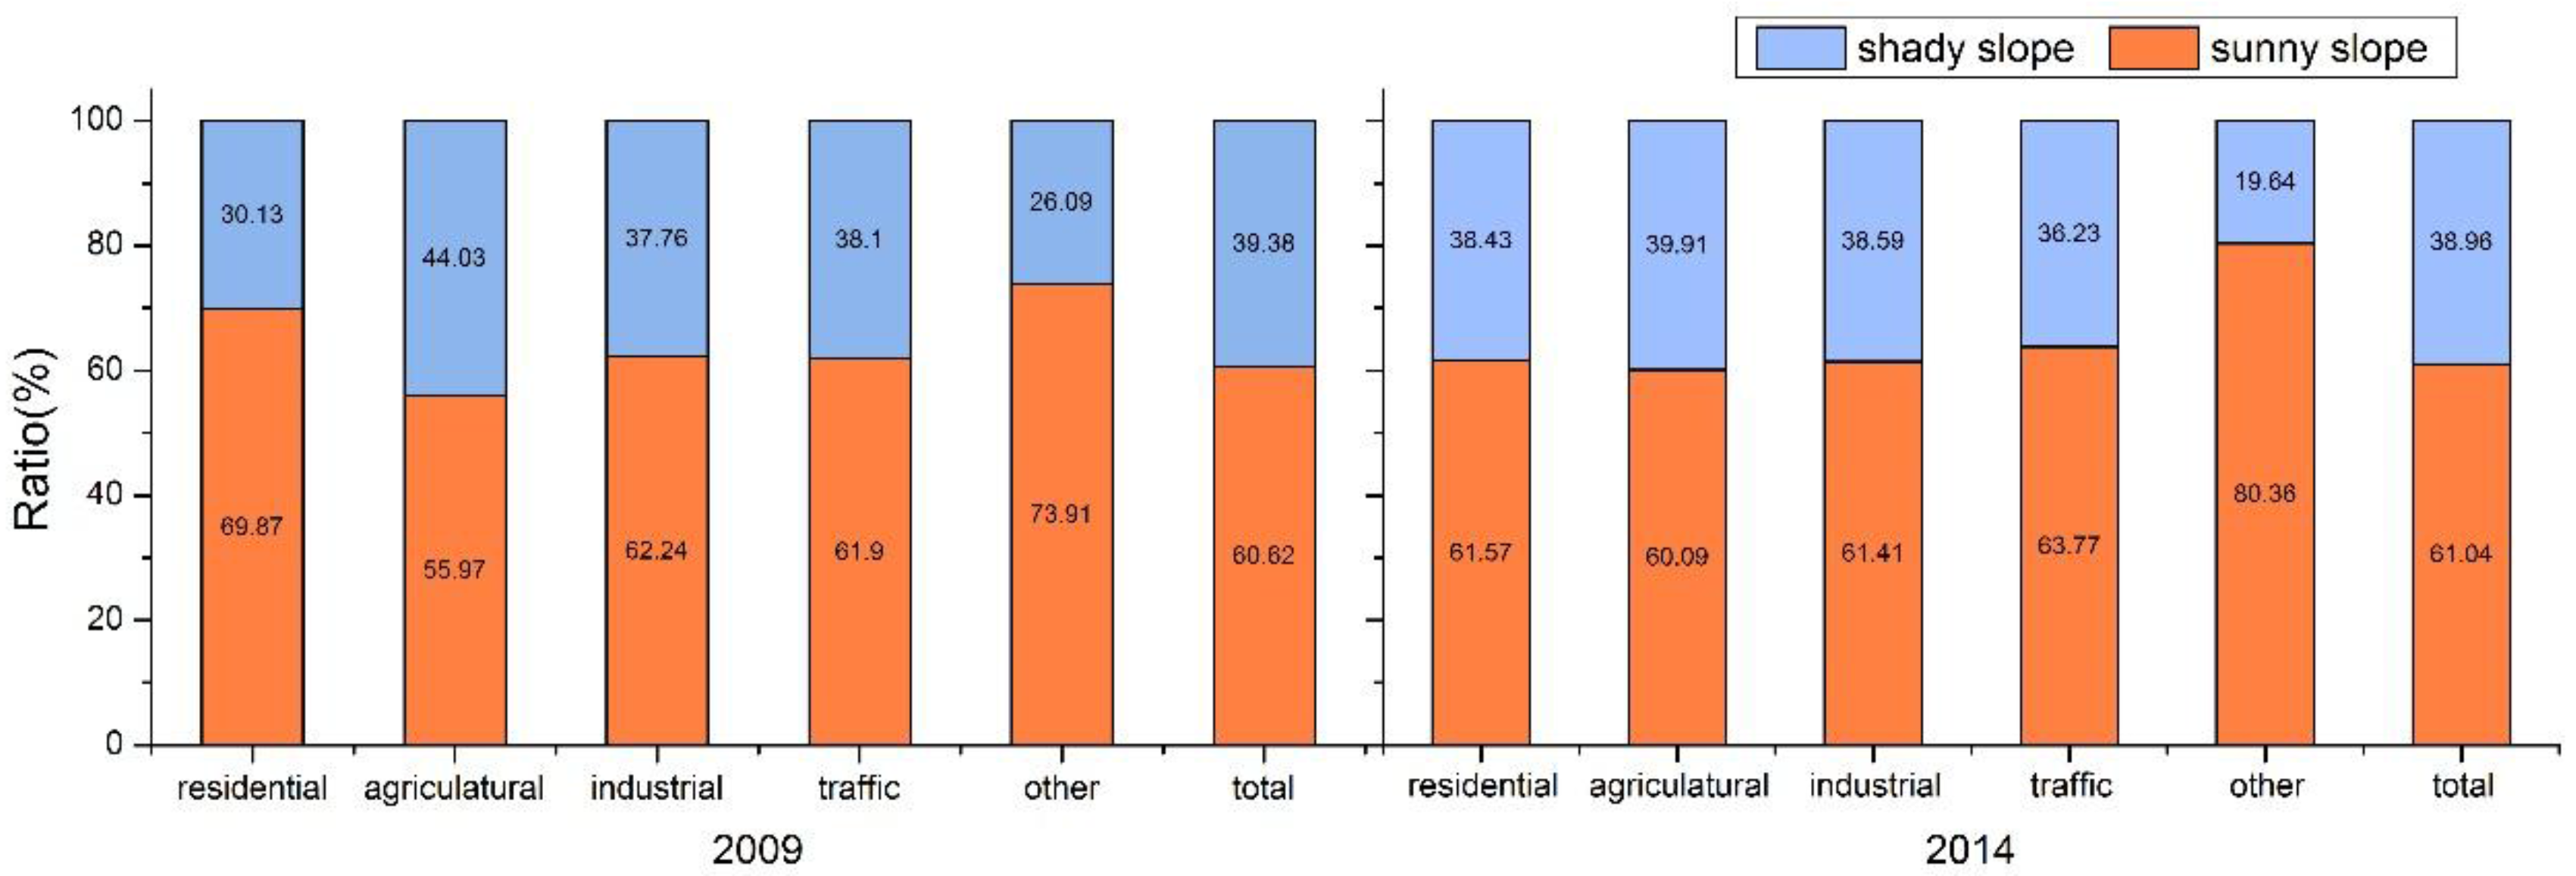
3.3.2. Aspect
4. Conclusions
Acknowledgments
Author Contributions
Conflicts of Interest
References
- Vitousek, P.M.; Mooney, H.A.; Lubchenco, J.; Melillo, J. Human domination of Earth′s ecosystems. Science 1997, 277, 494–499. [Google Scholar] [CrossRef]
- Forman, R.T.T. Estimate of the area affected ecologically by the road system in the United States. Conserv. Biol. 2000, 14, 31–35. [Google Scholar] [CrossRef]
- Wang, Z.; Huang, N.; Luo, L.; Li, X.; Ren, C.; Song, K.; Chen, J.M. Shrinkage and fragmentation of marshes in the West Songnen Plain, China, from 1954 to 2008 and its possible causes. Int. J. Appl. Earth Obs. 2011, 13, 477–486. [Google Scholar] [CrossRef]
- Song, K.; Wang, Z.; Li, L.; Tedesco, L.; Li, F.; Jin, C.; Du, J. Wetlands shrinkage, fragmentation and their links to agriculture in the Muleng-Xingkai Plain, China. J. Environ. Manag. 2012, 111, 120–132. [Google Scholar] [CrossRef] [PubMed]
- Huang, C.; Zhang, M.; Zou, J.; Zhu, A.X.; Chen, X.; Mi, Y.; Wang, Y.; Yang, H.; Li, Y. Changes in land use, climate and the environment during a period of rapid economic development in Jiangsu Province, China. Sci. Total Environ. 2015, 536, 173–181. [Google Scholar] [CrossRef] [PubMed]
- Wingard, G.J.; Harris, R.B.; Pletscher, D.H.; Bedunah, D.J.; Mandakh, B.; Amgalanbaatar, S.; Reading, R.P. Argali food habits and dietary overlap with domestic livestock in Ikh Nart Nature Reserve, Mongolia. J. Arid Environ. 2011, 75, 138–145. [Google Scholar] [CrossRef]
- Cooper, N.S. How natural is a nature reserve? An ideological study of British nature conservation landscapes. Biodivers. Conserv. 2000, 9, 1131–1152. [Google Scholar] [CrossRef]
- Brun, C.; Cook, A.R.; Lee, J.S.H.; Wich, S.A.; Koh, L.P.; Carrasco, L.R. Analysis of deforestation and protected area effectiveness in Indonesia: A comparison of Bayesian spatial models. Glob. Environ. Chang. 2015, 31, 285–295. [Google Scholar] [CrossRef]
- Hansen, A.J.; Defries, R. Ecological mechanisms linking protected areas to surrounding lands. Ecol. Appl. 2007, 17, 974–988. [Google Scholar] [CrossRef] [PubMed]
- Ye, X.; Liu, G.; Li, Z.; Wang, H.; Zeng, Y. Assessing Local and Surrounding Threats to the Protected Area Network in a Biodiversity Hotspot: The Hengduana Mountains of Southwest China. PLoS ONE 2015, 10, e0138533. [Google Scholar] [CrossRef] [PubMed]
- Bland, L.M.; Keith, D.A.; Miller, R.M.; Murray, N.J.; Rodríguez, J.P. Guidelines for the Application of IUCN Red List of Ecosystems Categories and Criteria, Version 1.0; IUCN: Gland, Switzerland, 2016; pp. 6–41. [Google Scholar]
- Davies, T.E.; Clarke, R.H.; Ewen, J.G.; Fazey, I.R.; Pettorelli, N.; Cresswell, W. The effects of land-use change on the endemic avifauna of Makira, Solomon Islands: Endemics avoid monoculture. Emu 2015, 115, 199–213. [Google Scholar] [CrossRef]
- Han, F.; Yang, Z.; Liu, X.; Di, F. Impact Assessment and Protection of Outstanding Landscape Integrity in a Natural Heritage Site: Fairy Valley, Kanas Nature Reserve, Xinjiang, China. J. Mt. Sci.-Engl. 2011, 8, 46–52. [Google Scholar] [CrossRef]
- Liu, S.D.; Gao, J.; Xue, D.Q. The analysis of landscape pattern evolution of coastal area in Shanghai Hangzhou Bay North shore. Adv. Environ. Technol. 2013, 726–731, 4620–4624. [Google Scholar] [CrossRef]
- Baldina, E.A.; De Leeuw, J.; Gorbunov, A.K.; Labutina, I.A.; Zhivogliad, A.F.; Kooistra, J.F. Vegetation change in the Astrakhanskiy Biosphere Reserve (Lower Volga Delta, Russia) in relation to Caspian Sea level fluctuation. Environ. Conserv. 1999, 26, 169–178. [Google Scholar] [CrossRef]
- Young, J.E.; Sánchez-Azofeifa, G.A.; Hannon, S.J.; Chapman, R. Trends in land cover change and isolation of protected areas at the interface of the southern boreal mixedwood and aspen parkland in Alberta, Canada. For. Ecol. Manag. 2006, 230, 151–161. [Google Scholar] [CrossRef]
- Zeng, H.; Sui, D.Z.; Wu, X.B. Human disturbances on landscapes in protected areas: A case study of the Wolong Nature Reserve. Ecol. Res. 2005, 20, 487–496. [Google Scholar] [CrossRef]
- Luque, S.S. Evaluating temporal changes using Multi-Spectral Scanner and Thematic Mapper data on the landscape of a natural reserve: The New Jersey Pine Barrens, a case study. Int. J. Remote Sens. 2000, 21, 2589–2611. [Google Scholar] [CrossRef]
- Conrad, C.; Rudloff, M.; Abdullaev, I.; Thiel, M.; Löw, F.; Lamers, J.P.A. Measuring rural settlement expansion in Uzbekistan using remote sensing to support spatial planning. Appl. Geogr. 2015, 62, 29–43. [Google Scholar] [CrossRef]
- Bing, Z.H.; Gao, J. Research on the Impact of Human Activities on the Landscape Pattern in Jiuzhaigou Nature Reserve. In Proceedings of the 2015 Aasri International Conference on Circuits and Systems (Cas 2015), Paris, France, 9–10 August 2015; Volume 9, pp. 66–70.
- Terra, T.N.; Dos Santos, R.F.; Costa, D.C. Land use changes in protected areas and their future: The legal effectiveness of landscape protection. Land Use Policy 2014, 38, 378–387. [Google Scholar] [CrossRef]
- Aguilera, F.; Valenzuela, L.M.; Botequilha-leitao, A. Landscape metrics in the analysis of urban land use patterns: A case study in a Spanish metropolitan area. Landsc. Urban Plan 2011, 99, 226–238. [Google Scholar] [CrossRef]
- Wan, L.; Zhang, Y.; Zhang, X.; Qi, S.; Na, X. Comparison of land use/land cover change and landscape patterns in Honghe National Nature Reserve and the surrounding Jiansanjiang Region, China. Ecol. Indic. 2015, 51, 205–214. [Google Scholar] [CrossRef]
- Wang, L.; Wehrly, K.; Breck, J.E.; Kraft, L.S. Landscape-Based Assessment of Human Disturbance for Michigan Lakes. Environ. Manag. 2010, 46, 471–483. [Google Scholar] [CrossRef] [PubMed]
- Muposhi, V.K.; Chademana, T.C.; Gandiwa, E.; Muboko, N. Edge effects: Impact of anthropogenic activities on vegetation structure and diversity in western Umfurudzi Park, Zimbabwe. Afr. J. Ecol. 2016, 54, 450–459. [Google Scholar] [CrossRef]
- Mcgarigal, K.; Marks, B.J. FRAGSTATS: Spatial Analysis Program for Quantifying Landscape Structure; Dolores Po Box: Portland, OR, USA, 1995; p. 351. [Google Scholar]
- McGarigal, K.; Cushman, S.A.; Neel, M.C.; Ene, E. FRAGSTATS: Spatial Pattern Analysis Program for Categorical Maps. Available online: www.umass.edu/landeco/research/fragstats/fragstats.html (accessed on 8 February 2017).
- Jaeger, J.A.G. Landscape division, splitting index, and effective mesh size: New measures of landscape fragmentation. Landsc. Ecol. 2000, 15, 115–130. [Google Scholar] [CrossRef]
- Tischendorf, L. Can landscape indices predict ecological processes consistently? Landsc. Ecol. 2001, 16, 235–254. [Google Scholar] [CrossRef]
- Liu, X.; Zhuang, D.; Wang, C.; Zhan, Z. Assessment of Ecosystem Health of Nature Reserve Based on the HJ-1 Data. In Advanced Technology in Teaching—Proceedings of the 2009 3rd International Conference on Teaching and Computational Science (Wtcs 2009); Springer: Berlin/Heidelberg, Germany, 2012; Volume 117, pp. 875–882. [Google Scholar]
- Wang, Z.Y.; Zhang, D.F.; Liu, Y.; Li, C.L. Farmland Landscape Pattern Change in Changping District of Beijing in Recent Ten Years. In Proceedings of the 2013 the International Conference on Remote Sensing, Environment and Transportation Engineering (Rsete 2013), Quebec, QC, Canada, 11–12 May 2013; Volume 31, pp. 717–720.
- Wei, W.; Shi, P.; Zhou, J.; Feng, H.; Wang, X.; Wang, X. Environmental suitability evaluation for human settlements in an arid inland river basin: A case study of the Shiyang River Basin. J. Geogr. Sci. 2013, 23, 331–343. [Google Scholar]
- Satellite Environment Center, Ministry of Enviromental Protection. Technology Guides of Human Activities Remote Sensing Monitoring in Nature Reserve[EB/OL]. Available online: http://www.secmep.cn/secPortal/portal/column/itemDetails.faces?itemid=297e85514b143cdb014b2e3ec1f9003e (accessed on 5 February 2015/24 January 2017).
- Song, X.Y.; Jiang, X.S.; Jiang, D.; Huang, Y.H.; Wan, H.W.; Wang, C.Z. Object-oriented classification of high-resolution remote sensing image. Remote Sens. Technol. Appl. 2015, 30, 99–105. [Google Scholar]
- Ming, G.; Wenbing, Y.; Mingguo, M.; Xin, L. Study on the oasis landscape fragmentation in northwestern China by using remote sensing data and GIS: A case study of Jinta oasis. Environ. Geol. 2008, 54, 629–636. [Google Scholar] [CrossRef]
- Na, L.; Genxu, W.; Guangsheng, L.; Yun, L.; Xiangyang, S. The ecological implications of land use change in the Source Regions of the Yangtze and Yellow Rivers, China. Reg. Environ. Chang. 2013, 13, 1099–1108. [Google Scholar] [CrossRef]
- Guan, D.; Gao, W.; Watari, K.; Fukahori, H. Land use change of Kitakyushu based on landscape ecology and Markov model. J. Geogr. Sci. 2008, 18, 455–468. [Google Scholar] [CrossRef]
- Fang, G.; Chen, J.Y.; Yang, J.; Zhao, Q.; Su, H.M. Dynamic Changes Analysis of Dangshan Landscape Pattern. Adv. Mater. Res.-Switz. 2012, 356–360, 2870–2873. [Google Scholar] [CrossRef]
- Rong-Ming, H.U.; Rui, L.I.; Guo, B.; Wen, W. Effects of Slope on Land Use/Land Cover Change. Bull. Soil Water Conserv. 2011, 44, 350–356. [Google Scholar]
- Lu, L.; Guo, L.; Zhao, S.T. Land use and land cover change on slope in Qiandongnan prefecture of Southwest China. J. Mt. Sci.-Engl. 2014, 11, 762–773. [Google Scholar] [CrossRef]
- Beaudette, D.E.; O′geen, A.T. Quantifying the Aspect Effect: An Application of Solar Radiation Modeling for Soil Survey. Soil Sci. Soc. Am. J. 2009, 73, 1345–1352. [Google Scholar] [CrossRef]


| Types | Impact Degree | Weight |
|---|---|---|
| Industrial area | 100 | 0.21 |
| Traffic facilities | 50 | 0.11 |
| Other human activities | 30 | 0.07 |
| Farmland | 10 | 0.02 |
| Residential land | 10 | 0.02 |
| Function Zone | Area (km2) | |||||||||||
|---|---|---|---|---|---|---|---|---|---|---|---|---|
| Residential Land | Agriculture Land | Industrial Land | Traffic Land | Other Human Activities | Total | |||||||
| 2009 | 2014 | 2009 | 2014 | 2009 | 2014 | 2009 | 2014 | 2009 | 2014 | 2009 | 2014 | |
| Core Zone | 0.00 | 0.00 | 0.04 | 0.13 | 1.71 | 1.71 | 0.15 | 1.12 | 0 | 0 | 1.9 | 2.96 |
| Buffer Zone | 0.00 | 0.09 | 1.79 | 10.19 | 1.76 | 1.94 | 1.3 | 1.59 | 0.27 | 0.27 | 5.12 | 14.08 |
| Experimental Zone | 1.51 | 2.50 | 9.79 | 26.06 | 10.49 | 10.45 | 3.29 | 3.68 | 0.58 | 0.29 | 25.66 | 42.98 |
| Total | 1.51 | 2.59 | 11.63 | 36.38 | 13.96 | 14.09 | 4.74 | 6.39 | 0.85 | 0.56 | 32.68 | 60.01 |
| Year | NRHI | PD | LSI | CONTAG | DIVISIO | SHDI | SHEI |
|---|---|---|---|---|---|---|---|
| 2009 | 0.0901 | 0.34 | 8.60 | 92.87 | 0.53 | 0.25 | 0.13 |
| 2014 | 0.1127 | 0.48 | 11.00 | 89.16 | 0.59 | 0.39 | 0.20 |
| Year | Slope | Ratio | |||||
|---|---|---|---|---|---|---|---|
| Residential Land | Agriculture Land | Industrial Land | Traffic Land | Other Human Activities | Total | ||
| 2009 | 0°–3.6° | 75.24% | 92.73% | 82.13% | 76.50% | 86.23% | 82.57% |
| 3.6°–7.2° | 23.68% | 6.86% | 15.75% | 21.58% | 12.93% | 16.16% | |
| 7.2°–10.8° | 1.08% | 0.41% | 1.67% | 1.81% | 0.84% | 1.16% | |
| 10.8°–14.4° | 0 | 0 | 0.44% | 0.11% | 0 | 0.11% | |
| 14.4°–18° | 0 | 0 | 0.01% | 0 | 0 | 0 | |
| 2014 | 0°–3.6° | 85.07% | 91.42% | 80.57% | 79.94% | 85.71% | 84.54% |
| 3.6°–7.2° | 13.81% | 7.71% | 17.16% | 19.16% | 14.29% | 14.43% | |
| 7.2°–10.8° | 1.12% | 0.88% | 1.72% | 0.90% | 0 | 0.92% | |
| 10.8°–14.4° | 0 | 0 | 0.48% | 0 | 0 | 0.10% | |
| 14.4°–18° | 0 | 0 | 0.07% | 0 | 0 | 0.01% | |
| Year | Aspect | Area (km2) | |||||
|---|---|---|---|---|---|---|---|
| Residential Lands | Agriculture Lands | Industrial Lands | Traffic Lands | Other Human Activities | Total | ||
| 2009 | sunny slope | 1.04 | 6.45 | 8.50 | 2.93 | 0.65 | 19.57 |
| shady slope | 0.45 | 5.07 | 5.16 | 1.81 | 0.23 | 12.71 | |
| 2014 | sunny slope | 1.58 | 21.60 | 8.51 | 4.07 | 0.43 | 36.18 |
| shady slope | 0.98 | 14.35 | 5.35 | 2.31 | 0.11 | 23.10 | |
© 2017 by the authors. Licensee MDPI, Basel, Switzerland. This article is an open access article distributed under the terms and conditions of the Creative Commons Attribution (CC BY) license ( http://creativecommons.org/licenses/by/4.0/).
Share and Cite
Song, X.; Huang, Y.; Fu, J.; Jiang, D.; Tian, G. Spatial Variability and Ecological Effects of Anthropogenic Activities in a Nature Reserve: A Case Study in the Baijitan National Nature Reserve, China. Sustainability 2017, 9, 239. https://doi.org/10.3390/su9020239
Song X, Huang Y, Fu J, Jiang D, Tian G. Spatial Variability and Ecological Effects of Anthropogenic Activities in a Nature Reserve: A Case Study in the Baijitan National Nature Reserve, China. Sustainability. 2017; 9(2):239. https://doi.org/10.3390/su9020239
Chicago/Turabian StyleSong, Xiaoyang, Yaohuan Huang, Jingying Fu, Dong Jiang, and Guangjin Tian. 2017. "Spatial Variability and Ecological Effects of Anthropogenic Activities in a Nature Reserve: A Case Study in the Baijitan National Nature Reserve, China" Sustainability 9, no. 2: 239. https://doi.org/10.3390/su9020239