1. Introduction
Traffic congestion, increased travel time, and air pollution are serious problems in modern metropolitan areas. Easing traffic congestion and solving other related traffic problems through public transport developments has become a common practice all over the world [
1]. In order to guarantee the basic profit rate of operators, as well as keep the ticket prices at low levels, subsidies are usually needed for the sustainable development of a public transport system. However, increasing public transport subsidy requirements have created a financial burden for governments. Financial constraints will affect bus frequency and bus size, which will affect the service quality of public transport [
2]. Therefore, governments at all levels have to face the problem of maintaining service quality and keeping the transit fares at low levels based on limited financial resources [
3]. How to solve the problem is worthy of research and discussion.
Encouragingly, private capital provides a potential solution to the above problem because the private sector can contribute in terms of financial support, technical skills, innovation, technology advances, specialist knowledge, and efficiency [
4]. The experiences of developed countries show that the way out of the dilemma for public transport is to establish competition between public and private sectors, and introduce private capital in the urban public transport industry [
5,
6,
7,
8,
9,
10,
11,
12,
13]. After 2000, more and more countries became interested in introducing private capital to the fields of construction and operations in public affairs, and Public-Private Partnership (PPP) is a common method. However, there is no single, internationally-accepted definition of PPP. The definition given by the World Bank group—a long-term contract between a private party and a government entity, for providing a public asset or service, in which the private party bears significant risk and management responsibility, and remuneration is linked to performance [
14]—will be used here. Many EU countries have a powerful incentive to explore alternative funding approaches to build transport infrastructure and provide service delivery. Most EU member states and the European Commission regard PPP as an important method to attract additional financial resources for high-priority investments, such as transportation [
9,
15]. Many states in America have a great interest in Public-Private Partnerships due to fiscal constraints, declining infrastructure, and increased industry specialization, e.g., in the early 1990s Texas, Virginia, Colorado, and Florida added new road and rail capacity to their most congested corridors with PPP concessions financed with private and public funds [
16]. In developing countries, private sectors are also introduced to the procurement of public facilities and services [
17,
18,
19].
Chinese governments at all levels encourage private capital investment in public transport via legislative and regulatory reforms in order to ease the financial pressure [
17,
20,
21,
22,
23]. However, the investments in transportation operations have largely failed due to unsustainable financial operations and some other factors (e.g., lack of well-established legal framework, poor governance, political/social obstacles, and so on.) [
17,
24,
25,
26,
27,
28]. Zhang [
24,
25,
26,
27] divides PPP failures into six types: value for money is not achieved, concession cancelled, concession tender cancelled, project nationalization, project halted, and contract suspension. Financial unsustainability is a key failure factor. After the 1990s, the public transport industry in China experienced a tide of marketization. Due to the low level ticket price and subsidies restricting the private sectors’ profit rates, most of the investments in public transport operations eventually failed. Public transport returned to be state-owned. Due to financial burdens, Chinese governments encouraged private capital investment in public transport again after 2010. Under this background, improving the success rate and attracting private capital investment in public transport is a problem for governments and researchers [
4] (a PPP project is successful only if the contract items are realized, the success rate means the ratio of successful PPP projects over total PPP projects in a specific time period).
There have been many research projects focused on the critical success factors (CSF) for introducing private capital into public affairs [
12]. Osei-Kyei and Chan [
12] reviewed the studies of CSFs for implementing PPP from 27 top-tier academic journals from 1990–2013. The most identified success factors are risk allocation and sharing, strong private consortium, political support, community/public support, and transparent procurement [
12]. Chan [
4] researched privileges and attractions for the private sector to involve itself with PPP projects in mainland China and Hong Kong. Three attractions and privileges were rated higher by respondents in mainland China: government guarantee (joint first position), government assistance in financing (joint first position), and tax exemption/reduction. Two factors observed to be higher for Hong Kong respondents were government sponsorship and incentives for new market penetration [
4]. The above research results provide guides for introducing public private investments in public transport.
It is obvious that if the feasibility of private capital investment in public transport can be quantitatively evaluated, then decision-makers (government officials in management departments of public transport) can make logical investment policies more easily [
16,
29,
30,
31,
32,
33,
34,
35]. However, many studies focus on qualitative analysis [
12,
17,
28,
36]. The quantitative studies mainly focus on value for money (VFM) analysis of infrastructure construction and cost-benefit analysis (CBA) [
17,
31,
32,
33,
34,
35,
36,
37]. The concept VFM may differ between agencies. VFM is often regarded as a monetary value savings produced by selecting the PPP option versus a traditional procurement option. If the value is positive, the project should be chosen. Otherwise, the project should be dropped [
37]. The definition given by the UK’s HM Treasury is ‘optimum combination of whole-of-life’ costs and quality (or fitness for purpose) of the goods or service to meet the user’s requirement [
38]. Current VFM analysis mainly deals with the economic aspect of ensuring VFM in PPP projects. Other non-financial costs and benefits are neglected in the quantitative assessment [
38]. Factually, the value-of-time (VOT) of passengers is also important due to public necessity of transport [
3]. VOT should be considered because the travel time is different before and after providing public transport services. The saved time can be measured in a monetary form as a part of the returns of government subsidies in public transport [
39]. Additionally, passengers form a vast customer base which can generate huge values, beyond ticket fares. However, the customer value of passengers (‘passenger value’ for short in the following sections, and the concept is explained in next section) is not fully considered when private capital invests in public transport. In the UK, and many other European countries, private sectors are bidding for subsidy payments from the public authority through providing public transport service passenger services [
40], because the user charges are not enough for private sectors to achieve financial sustainability [
9]. However, the private sectors did not utilize the resources of public transport passengers fully, with respect to user charges. Otherwise, traveler’s choice behavior should also be considered, which will affect the number of passengers. Since there is competition between different traffic modes, travelers may transfer among travel modes due to the generalized costs (travel time, travel cost, service quality, and so on) [
41].
As mentioned above, passengers form a customer base that can generate other values beyond ticket fares. If the passenger value could be fully considered by private sectors, it would be valuable for financial benefits. To address the shortcomings of previous research on private capital investment in public transport, namely, a lack of passenger value analysis and traveler’s mode choice behavior, not considering the VOT of passengers, a new model of private capital investment in public transport considering passenger value was developed. A bi-level programming model (BLPM) was constructed as a tool of quantifying the impacts of the sustainable development strategy for public transport, and the lower level function took traveler’s mode choice behavior into account. The model validity was verified based on a case study of Jinan city traffic in China. Conclusions, policy recommendations, and further research issues are provided in the last section.
3. The Investment Model in Public Transport Considering Passenger Value
Seybold, et al. [
46] stated that the ‘customer economy’ era had come. Research on customer value is based on three different approaches [
46,
47,
48,
49]: (1) Customers are treated as the subjects and enterprises as objects. To understand and meet customer demand is the major task; (2) Customers are regarded as objects and enterprises as subjects. The primary task is attracting and maintaining profitable customers; and (3) Customers and enterprises are regarded as both subjects and objects, known as a customer value exchange. The customer value exchange means customers can benefit from enterprises and, at the same time, enterprises can benefit from customers. It considers benefits of both customers and enterprises, while approach (1) or (2) mainly consider the benefits of customers or enterprises. In public transport systems, the customer value of passengers (‘passenger value’ for short) has two meanings: For public transport operators, passenger value means the benefits brought by passengers, including the fare income, cash flow income of the public transport card balance, and advertisement revenue; the other aspect of passenger value is the travel service provided to passengers by public transport companies. The third approach is widely used at present, and this paper will use this approach in the following analysis.
Customer value analysis is widely used in the areas of mobile commerce and telecommunications [
50,
51]. Research in the transportation industry is rare, mainly focusing on railway customer value classification [
52,
53]. However, the equivalent research about passenger value in the public transport industry is lacking.
Passengers form a vast customer base which can generate value besides ticket fares. The purpose of considering passenger value in public transport system is to increase the system welfare. The system welfares include the surpluses of all of the groups in the public transport system. There are two major surpluses in mainstream economics: consumer surplus and producer surplus. Consumer surplus is the monetary gain obtained by consumers because they want to purchase a product or some service for a price that is less than the highest price they are willing to pay. Producer surplus is the benefit gained by selling a product at a market price that is higher than the lowest price that producers would be willing to sell for [
3]. Herein, the public transport enterprise surplus equals the benefit minus cost, and the traveler surplus equals the fee public transport travelers are willing to pay minus the actual cost. If the passenger value is fully considered, it should be beneficial for both public transport companies and passengers. After considering passenger value fully, public transport companies can gain more profits besides ticket fees, e.g., more profits of cash flow in accounts of public transport cards (
Table 2), because the profits of cash flow in accounts of public transport cards can change from bank interest to investment profit [
3]. In many countries there is no current interest, the current interest rate in China is about 0.3%. On the contrast, the return on investment is generally larger than 10%. Passengers’ surplus can also increase due to the returns to passengers (
Table 2). Thus, it should be more conducive to sustainable private capital investment in public transport operation, since some investments have failed due to unsustainable financial operations.
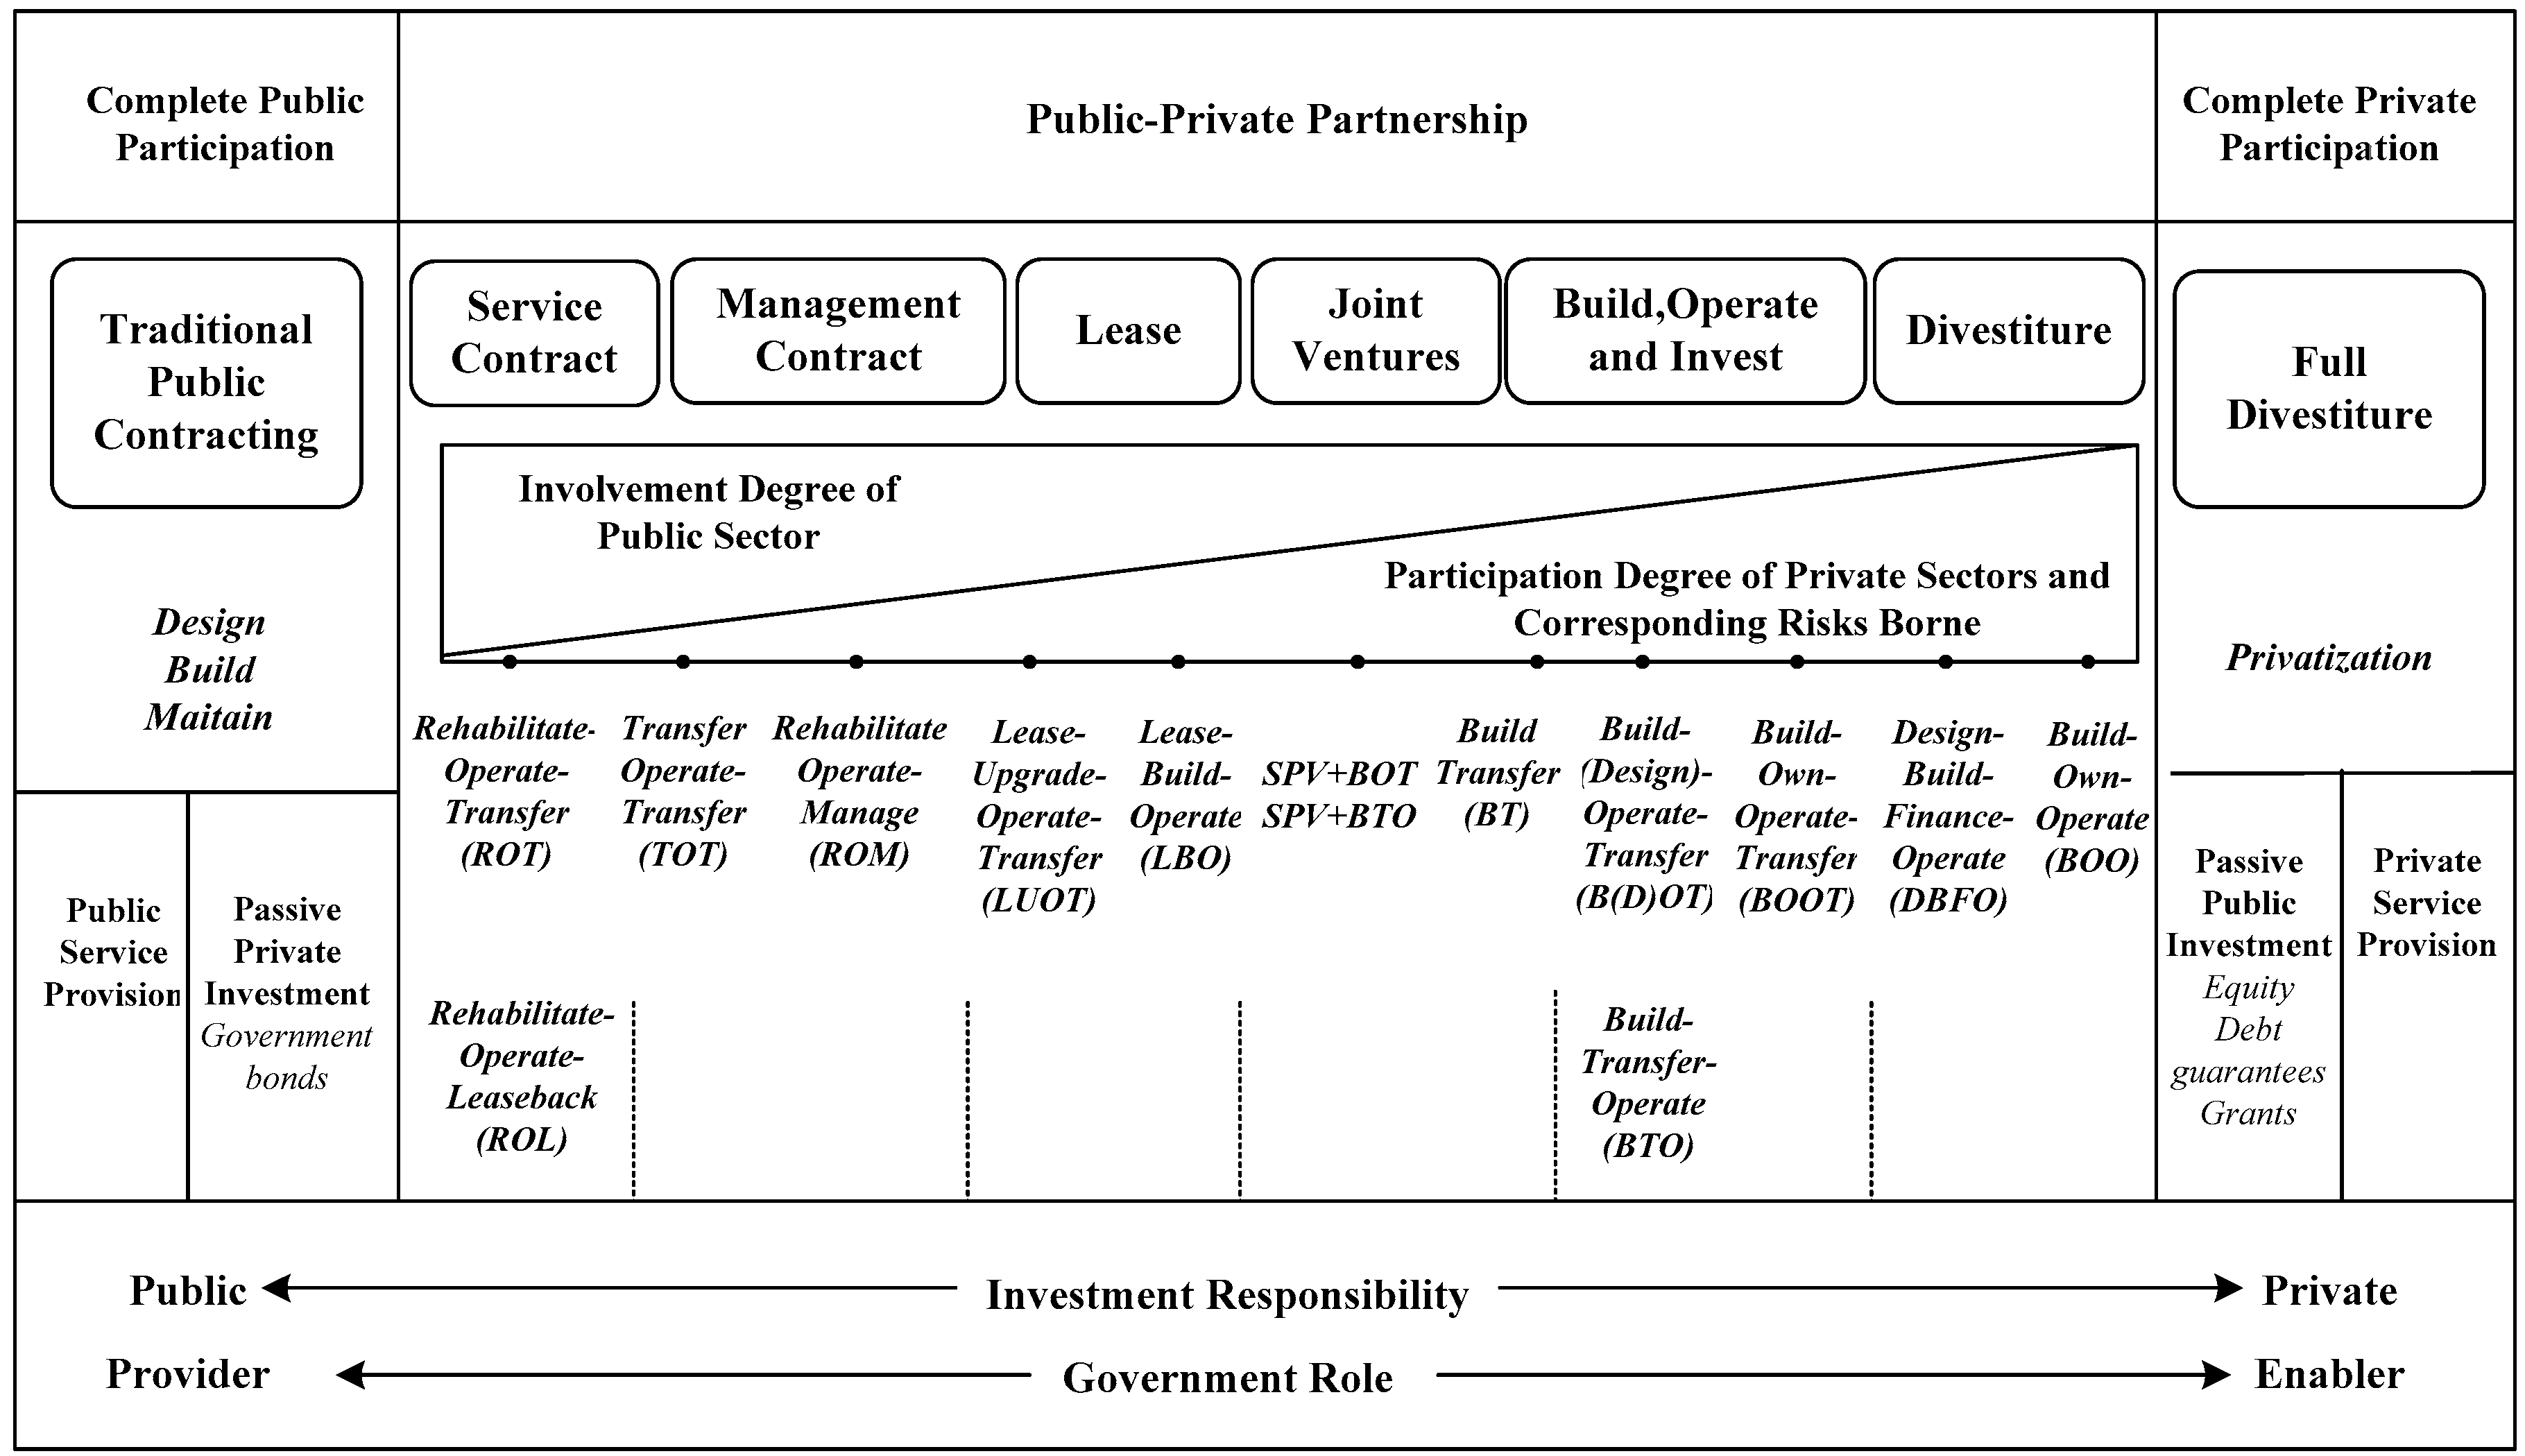
A lease is taken as an example, and other types can be analyzed similarly. The government leases the public transport route to a private operator for a fee. The private operator takes on the operational risk (see
Table 1). Passenger value and service quality constraints are considered in the lease contract, and the private operator is permitted to utilize passenger resources as a customer base and make use of cash flow in accounts of passengers’ public transport cards. Then, the private sector can gain other profits besides ticket fares [
3]. The private operator also shares the same government subsidies as the traditional public transport company. Based on the report “White Book of Jinan Urban Public Traffic Development” [
54], government subsidies include fuel allowances, vehicle subsidies, trips allowances for special social groups (students, the aged, the disabled, soldiers), and other subsidies for policy-related losses. Ticket price ranges and minimum service levels are listed in the contract. When the public transport system efficiency is measured, the value-of-time (VOT) of passengers [
39] is considered as a basis for fiscal subsidy since the government purchases public services to supply travel services [
3].
Table 2 shows the differences in profits for the private sector with and without considering passenger value. One difference is the profits of cash flow in the accounts of passengers’ public transport cards change from bank interest to investment profit. It is obvious that the rate of investment profit is higher than that of bank interest (the current interest of a bank account in China is about 0.3%, while there is no current interest in many Western countries (e.g., USA). It is common the investment profit rate is higher than that of bank interest). Another difference is that advertising profit is increased by e-commerce ads. The private sector may give some profits to passengers who take more trips by public transport. Then, different customer values of passengers can be reflected and more people will be enticed to travel by public transport. According to the financial statement of the Jinan Public Traffic Company, the fixed cost contains office expenses, property costs, vehicle insurance, and depreciation charges. The variable cost contains consumptions of fuels, materials, and lubricants, as well as repair charges, accident costs, salaries, and all kinds of insurances.
In addition to following a sound financial system and regulations, private sectors should improve efficiency of resource utilization, since private sectors can gain more profits and enhance competitive power if they make use of passenger resources more efficiently. More profits are what the private sectors want. The investment model proposed here considers passenger value, generates more profits, and should be more conducive to private capital investment in public transport. In the following section, a quantitative tool is constructed to measure the specific impacts of private capital investment in public transport considering passenger value.
4. BLPM of Private Capital Investment in Public Transport
Xue and Guan [
3] also established the BLPM of private investment in public transport in previous research. This paper is an extended research of the previous study. The major difference is that private cars and taxis were added to the competition among travel modes. Private cars and taxis were also considered in the case study. Additionally, there are more parameter analysis and policy recommendations in this paper than the previous one, and the former paper mainly focused on model characteristics. Although the model structures are similar, the model contents are obviously different. Tables and figures are significantly different. The data is also different in the two papers.
The bi-level programming problem (BLPP) is a programming model which contains upper and lower levels. Additionally, the lower level programming is the constraint condition for the upper level programming [
55]. Hypothesizing that the control variable of the upper level function is
. The control variable of the lower level function is
. Therefore, the BLPM is listed as follows:
where, functions
are the respective target functions of
P1 and
P2; Vector functions
are respective constraint conditions of
P1 and
P2.
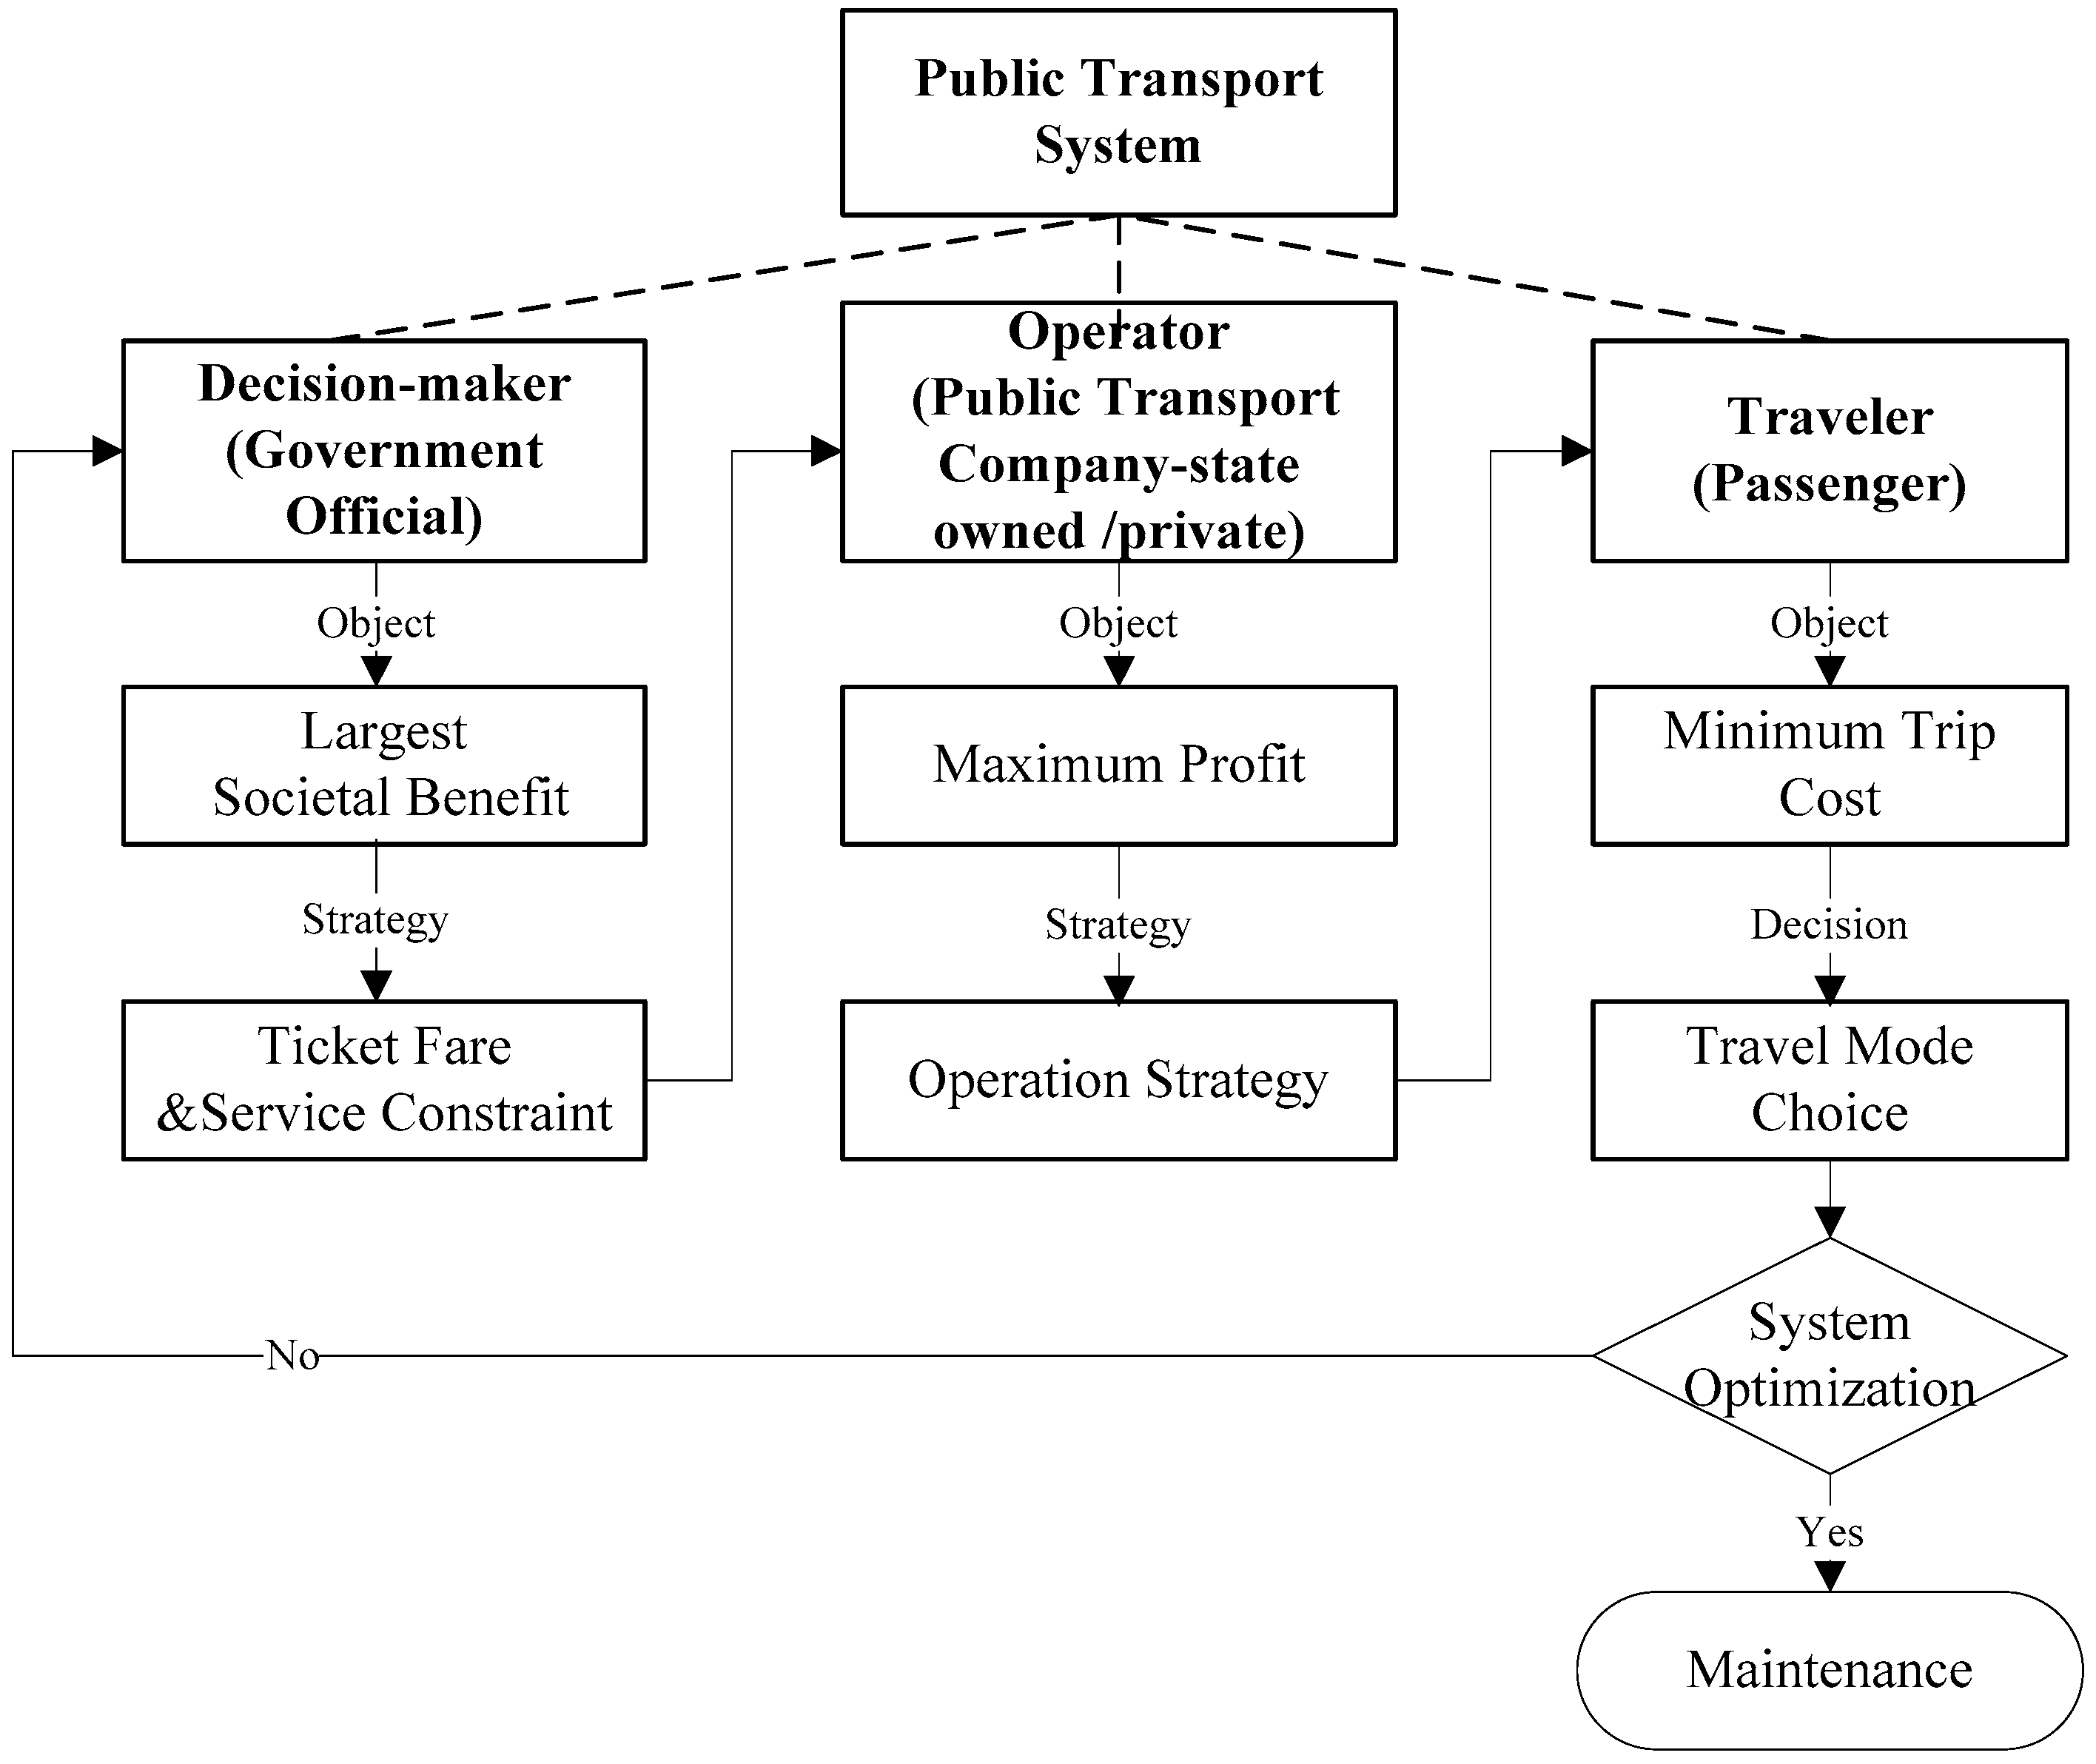
Figure 2 shows why the multi-level programming theory is used to establish a quantitative evaluation model for optimization analysis of the effects of private capital investment in public transport. There are three groups in a public transport system: government officials, public transport companies, and travelers. Each group is at a different hierarchical level. Government requires the public transport system generate the largest societal benefit, while public transport companies want to get the maximum profit, and travelers hope to minimize trip cost. Public transport companies make operation strategies based on the service quality constraint. Travelers will choose the suitable traffic modes according to travel choice behavior theory. The travel choices will, in return, affect decision-makers (government officials). If fewer travelers choose public transport, government officials have to change strategies (e.g., subsidies to private sectors, lease fees of private sectors, reset the range of ticket fares and the constraint of the service level of public transport) to improve the service quality. Then, facing the new strategy of the decision-maker, operators should adjust operational strategies (e.g., ticket fares, departure frequencies, the rate of returns to passengers, and advertising business). The iterative process will not stop until the public transport system is optimal. In fact, if the system efficiency is acceptable by government officials, the system is stable and the present situation will be maintained. The relationships and restrictions can be captured effectively by multilevel programming models. Since public transport belongs to public affairs, the government purchases public services to supply travel services. Therefore, governments do not expect public transport companies to maximize profits, although they have to meet the minimum income constraint of public transport companies [
3,
56]. The three-level decision problem can be simplified into the BLPP. Since the system welfare contains not only money but also some non-financial benefits (e.g., travel time), the generalized trip cost is considered in the BLPM.
Suppose there are three basic kinds of public transport modes: bus, bus rapid transit (BRT), and subway (there are also light rail train, electric tram, trolley bus, and maglev train in some cities; in the following analyses we only consider bus, BRT, and subway for simplicity. The public transport modes are treated as the subscript values of the parameters. Only the subscripts take different values if other modes are considered; actually, this will not change the model structure). Suppose the private sector invests in one of the public transport modes and pays some lease fee to the government. The private operator also shares the same government subsidies as the traditional bus company. The government sets the ticket price ranges and requires minimum service levels. The ticket price ranges are based on the per capita level (the average spending on public transport lies in the range of 5%–10% of personal disposable income) and individual passengers’ acceptable spending level [
3]. The upper decision-makers (government officials in the management department of public transport) aim to realize the largest social welfare of the public transport system (including traditional public transport companies’ surplus, private sector lease fee, and traveler’s surplus) [
3]. The upper control variable is the ticket price. Travelers in the lower programming model aim to minimize the generalized travel cost, and the lower control variable is the service level (measured by departure frequency). The constraint conditions are the profit rate of the private sector and the vehicle capacity limit. Although more travelers choosing public transport will be beneficial to transportation system, travelers are not compelled to give up private cars. Travelers choose their desired travel mode through choice theory. In order to show the impacts of car usage to the welfare of the public transport system, the surplus of car travelers is considered in bi-level objective functions. Normally, the generalized cost of travel by car is higher than by public transport, and it is a common practice to encourage citizens to travel by public transport for transportation system optimization.
The BLPM of private capital investment in public transport operation considering passenger value is presented as follows:
Equation (5) is the upper objective function, which represents the welfare of the public transport system. It is the sum of traditional bus company’s surplus (Equation (12)), lease fee of the private sector
, and traveler’s surplus (Equation (13)).
is a parameter, its value is determined in the contract. The value constraint of
can be determined in the model; too high a lease fee will affect the profit rate of the private sector, while too low a lease fee is not what decision-makers want. Public transport operator’s surplus and traveler’s surplus are given as follows:
where:
public transport operator’s surplus;
ticket price of route i;
passenger flow of route i;
total passenger flow of public transport;
subsidy of route i;
other benefit of route i;
the operation cost without private capital investment under departure frequency F;
surplus of travelers, equal to the cost bus travelers are willing to pay for the service minus the actual cost, minus the travel cost of car users. This means the fewer car users the better, although it is not compulsory for travelers to drop private cars.
public transport travel demand under O-D (origin-destination) pair s and t, which is a function of ticket price and bus service;
the inverse function of public transport demand, reflects the corresponding price and service corresponding to demand D;
returns to passengers ‘Q’ by the private capital enterprise;
the travel cost of private car from origination s to destination t;
the travel flow of private car from origination s to destination t;
m: the number of total public transit lines;
n: the number of state-owned lines, n ≤ m;
The constraint condition given by Equation (6) is the compulsive ticket price range of route i set by the government.
The constraint condition given by Equation (7) is the revenue constraint for the private sector. Where, is the rate of bank interest and is the minimum profit rate the private sector can accept. is a beneficial function, and is related with tine ‘T’, passenger flow ‘Q’, and bus card account balance ‘Maccount’. In the case study, it is presented as the product of ‘Q’ and ‘M’ under a fixed time ‘T’. is the operation cost of private sector under departure frequency F.
The lower objective function given by Equation (8) is the generalized travel cost of travelers. The more detailed function is listed as follows:
trip cost of travelers under private capital investment type S (in the paper S means lease);
volume of route i;
volume of private car from origination s to destination t;
generalized travel cost of route i;
generalized travel cost of private car from origination s to destination t;
travel time value of the bus (yuan/hour);
travel time by bus;
wait time value of the bus (yuan/hour);
wait time of the bus;
walk time value of the bus (yuan/hour);
walk time of the bus;
travel time value of the BRT (yuan/hour);
travel time of the BRT;
wait time value of the BRT (yuan/hour);
wait time of the BRT
walk time value of the BRT (yuan/hour);
walk time of the BRT;
travel time value of the subway (yuan/hour);
travel time of the subway;
wait time value of the subway (yuan/hour);
wait time of the subway;
walk time value of the subway;
walk time of the subway;
travel time value of private car users;
travel time of private car from s to t.
The inequality shown in Equation (9) is the departure frequency constraint. NTi is the largest number of vehicles in route i. rti is the average travel time of rout i (hour) in one running cycle.
The inequality shown in Equation (10) is the vehicle capacity constraint, where, TCapi is the average capacity of vehicles on route i.
Equation (11) is the traffic demand constraint under travel choice behavior theory. The multinomial logit model is used to describe travelers’ mode choice behavior.
The multinomial logit model (MNLM) is the basic disaggregate model and is mainly used for describing choice behaviors [
57,
58]. There are also other choice behavior theories, including game theory, prospect theory, and theory of planned behavior (TPB). Since the disaggregate theory is robust and widely used at present [
59,
60,
61], it will be used in the paper. The disaggregate model is based on the hypothesis that travelers choose the maximal utility option under a specific condition. The probability that traffic mode
i will be chosen by traveler n is presented as follows:
where,
is the deterministic component of utility
Ui for traveler
n;
is a parameter; and
J is a set of available traffic mode alternatives for travelers. The parameter
can be estimated through maximum likelihood and the Newton-Raphson method [
57].
5. Solution Algorithm
Due to the NP-hard problem, it is difficult to obtain the global optimal value. Colson published a series of representative research results to solve the solution problems of nonlinear bi-level programming models [
62,
63,
64]. There are two types of methods to solve the bi-level programming problem: one method is to transform the bi-level programming model into a single programming model based on the optimal conditions, such as KKT conditions; the other method is to obtain the optimal solution of the lower model under a given variable value of the upper model. Based on the two types of solution methods, many specific algorithms have been proposed and developed [
64,
65,
66,
67,
68,
69].
Intelligent algorithms, such as genetic algorithms and simulated annealing algorithms, have a wide range of applications, because these algorithms do not require convexity and continuously differentiable properties of objective functions.
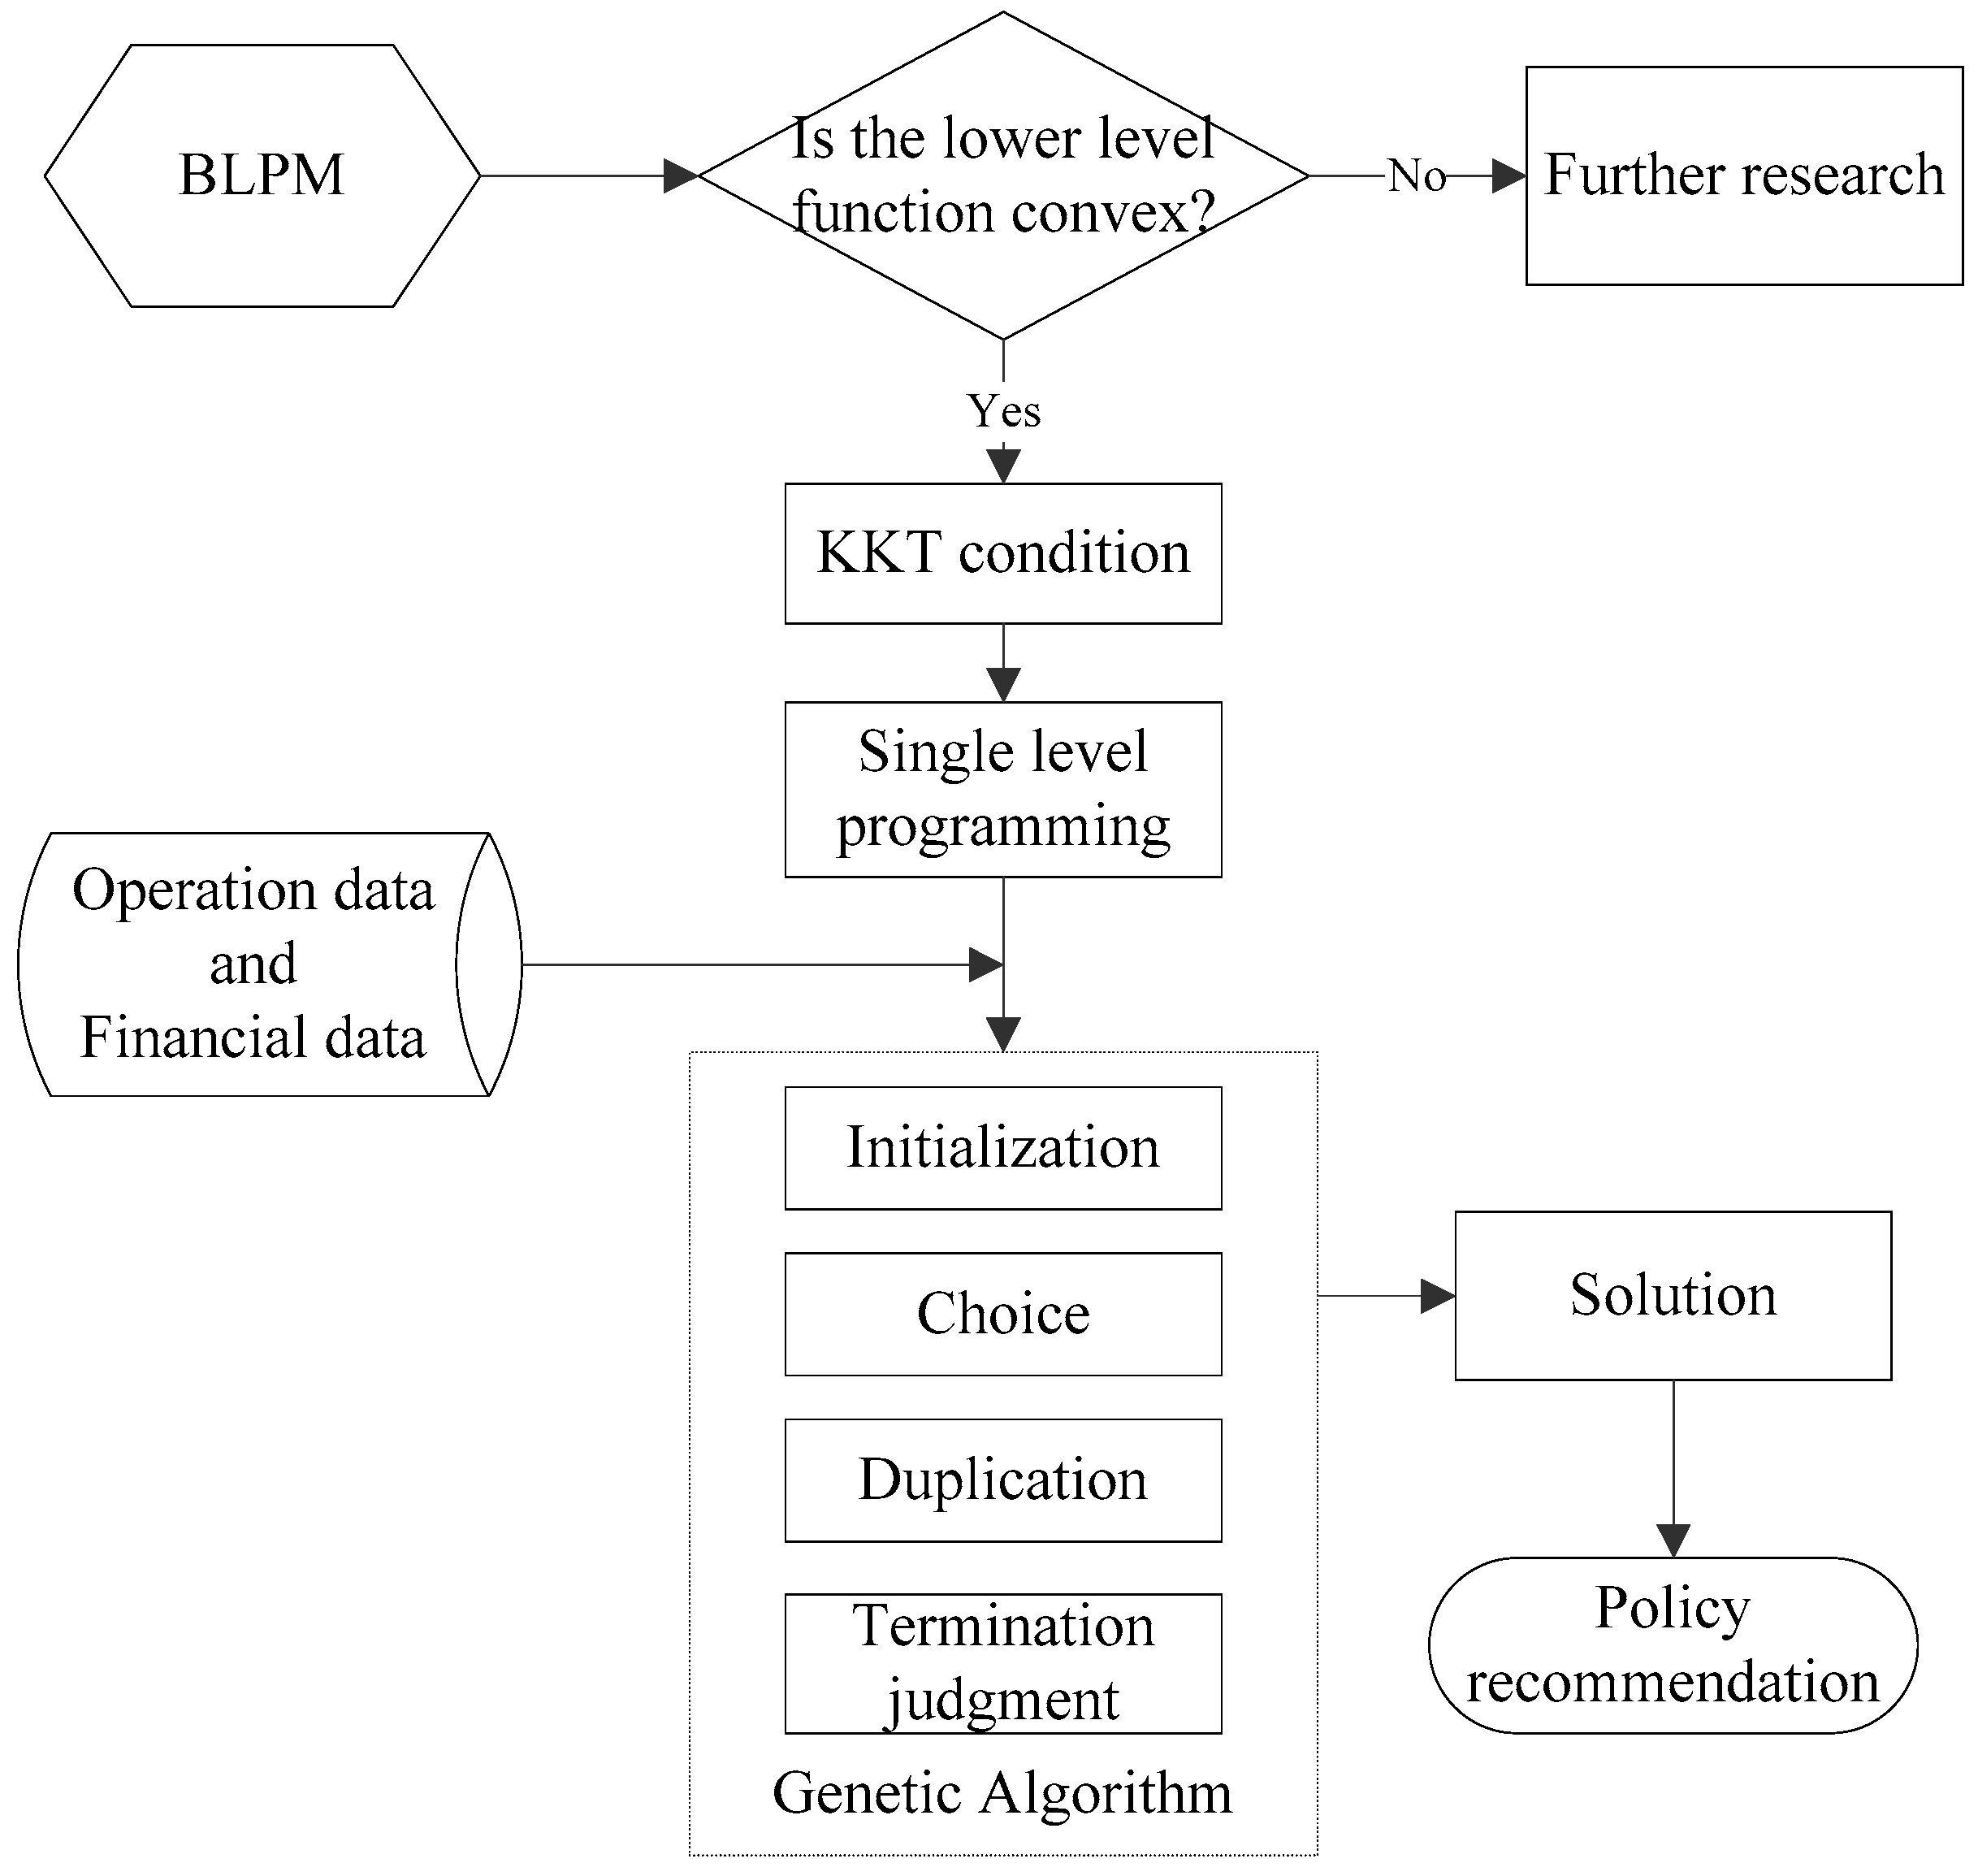
Therefore, the KKT condition and genetic algorithm are used to solve the BLPM in this paper (
Figure 3). If the lower level function is convex, the KKT condition can be used to transform the bi-level programming model into a single programming model. The non-convex situation is not considered in this paper, but is considered for further research. Based on the operational data and financial data of a public transport operator, the single level programming model can be solved via a genetic algorithm (GA). GA is robust and widely used to solve nonlinear programming problems. The process of GA is mainly divided into four steps: initialization, choice, duplication, and termination judgment. The detailed process can be found in [
3].
Hypothesizing that the lower function is convex, and other situations will be discussed in further research. If the involved route is more attractive and the difference between routes is less than the profits returned to passengers, the lower objective function is convex [
3]. Then, the KKT equivalent conditions of the lower level programming model (Equations (8)–(11)) are presented as follows:
6. Case Study
Jinan city, the capital of Shandong Province, China, was selected for this case study. The urban population of Jinan was 4.4 million at the end of 2015 [
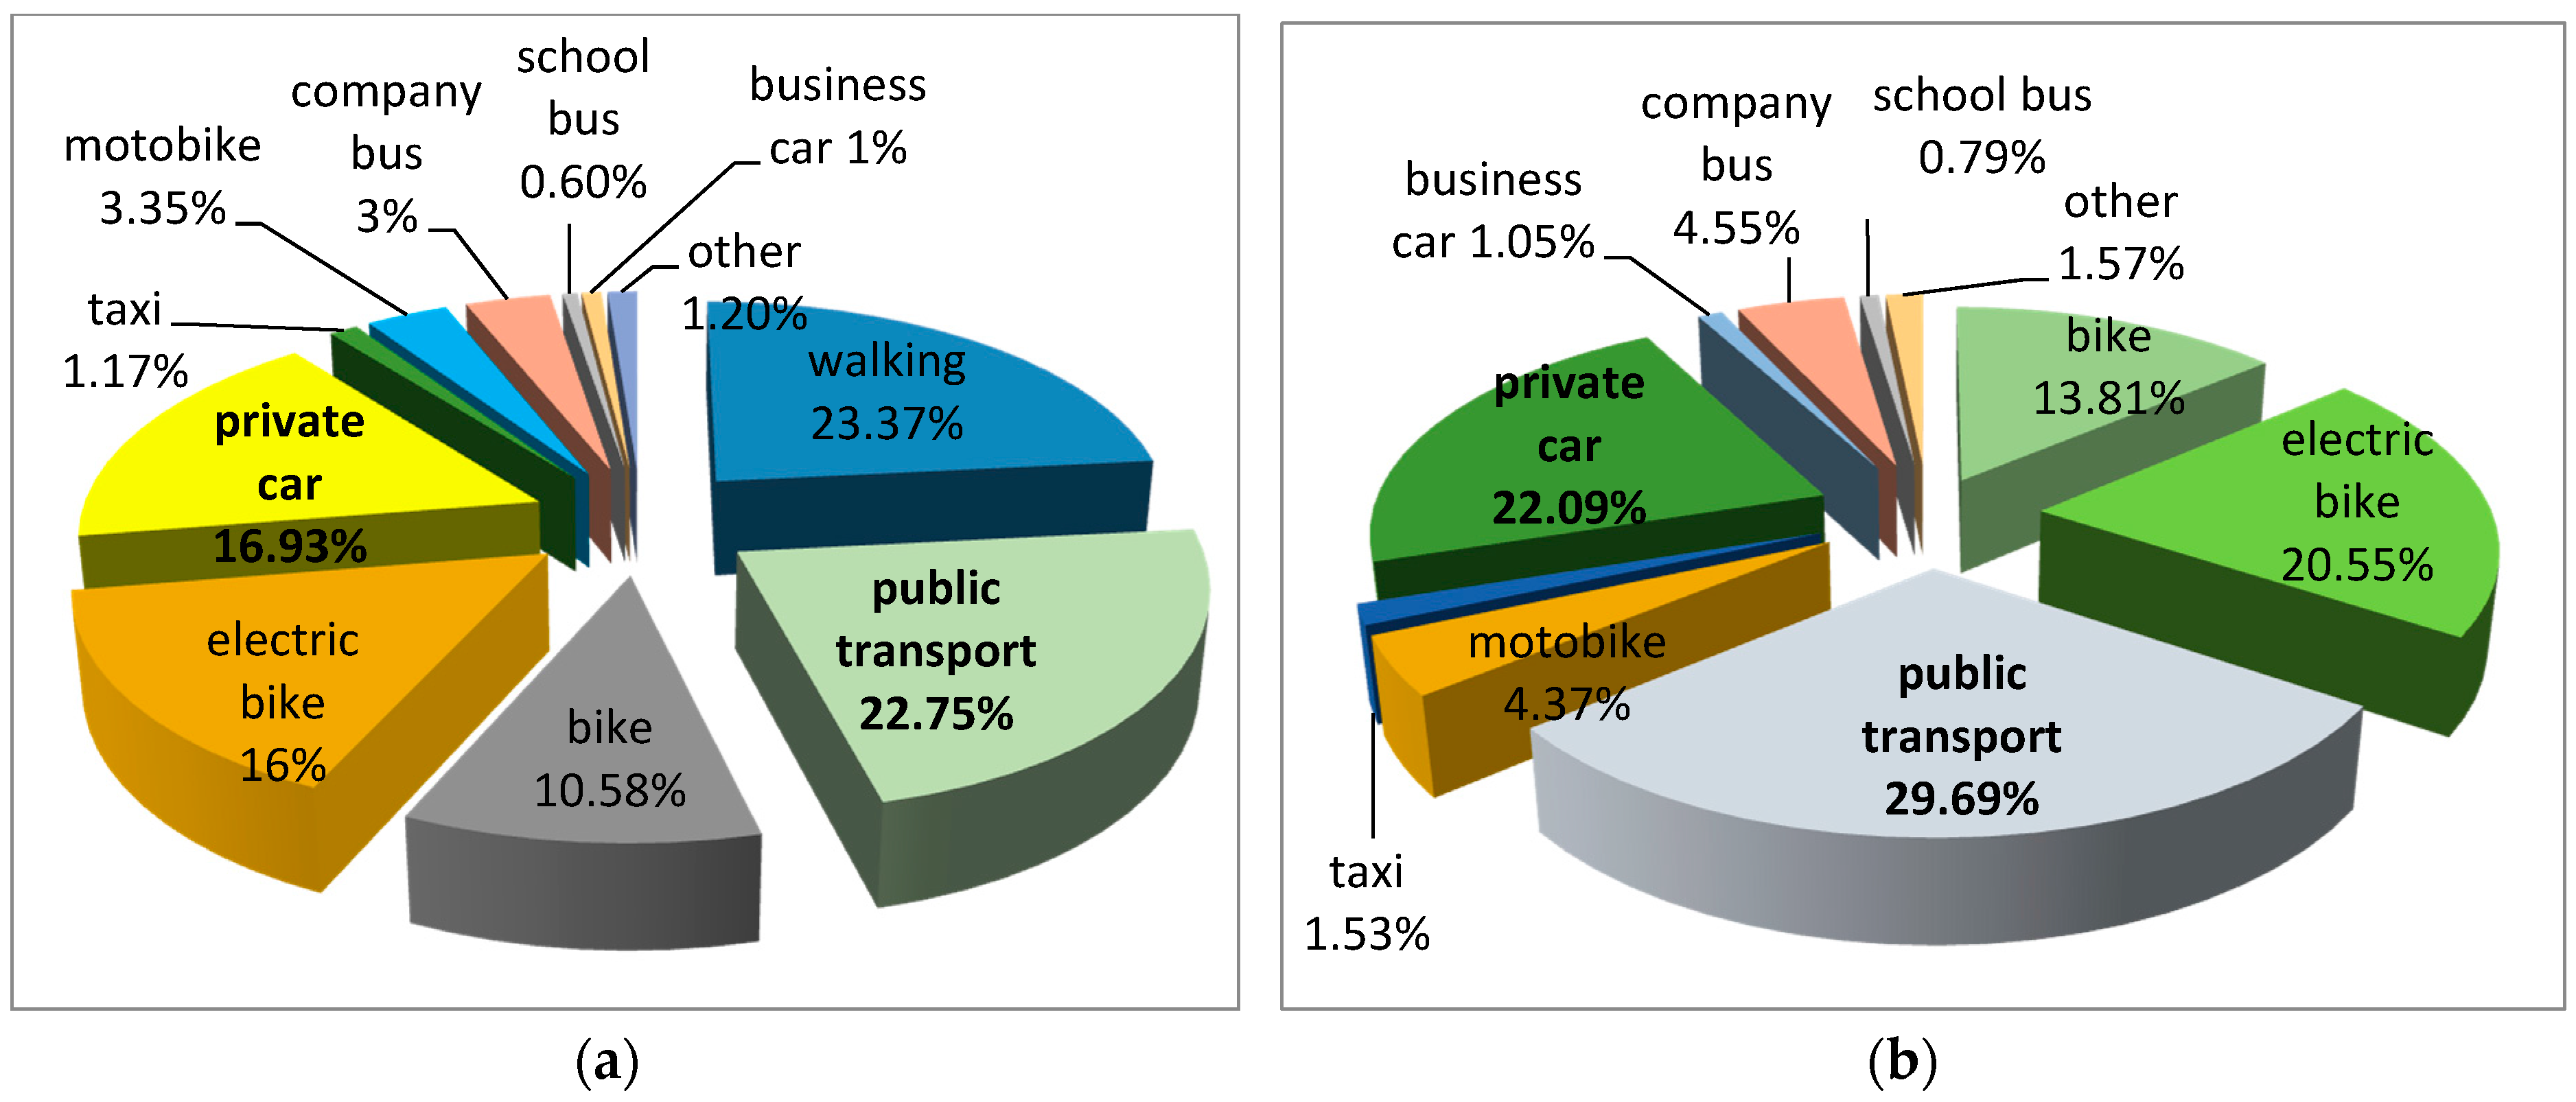
70]. The total amount of motor vehicles of Jinan had reached 1.67 million by the end of 2015, 1.48 million of which were private cars. The public transport of Jinan city has developed rapidly in recent years due to its struggle to be the National Public Transit City of China. There were about 12,000 staff, 5200 buses in operation in the Jinan Public Traffic Company by the end of 2015. The public transport system had 240 bus routes (eight BRT routes included) with a total length of 4100 kilometers and the network length of 1280 kilometers, and carried more than 2.4 million passenger trips daily (the BRT volume was about 0.3 million per day). At the same time, there were about 8000 taxis by the end of 2015 in Jinan city. According to the comprehensive transportation survey of Jinan city in 2011, the public transit mode share rate (excluding walking) reached 29.69% (
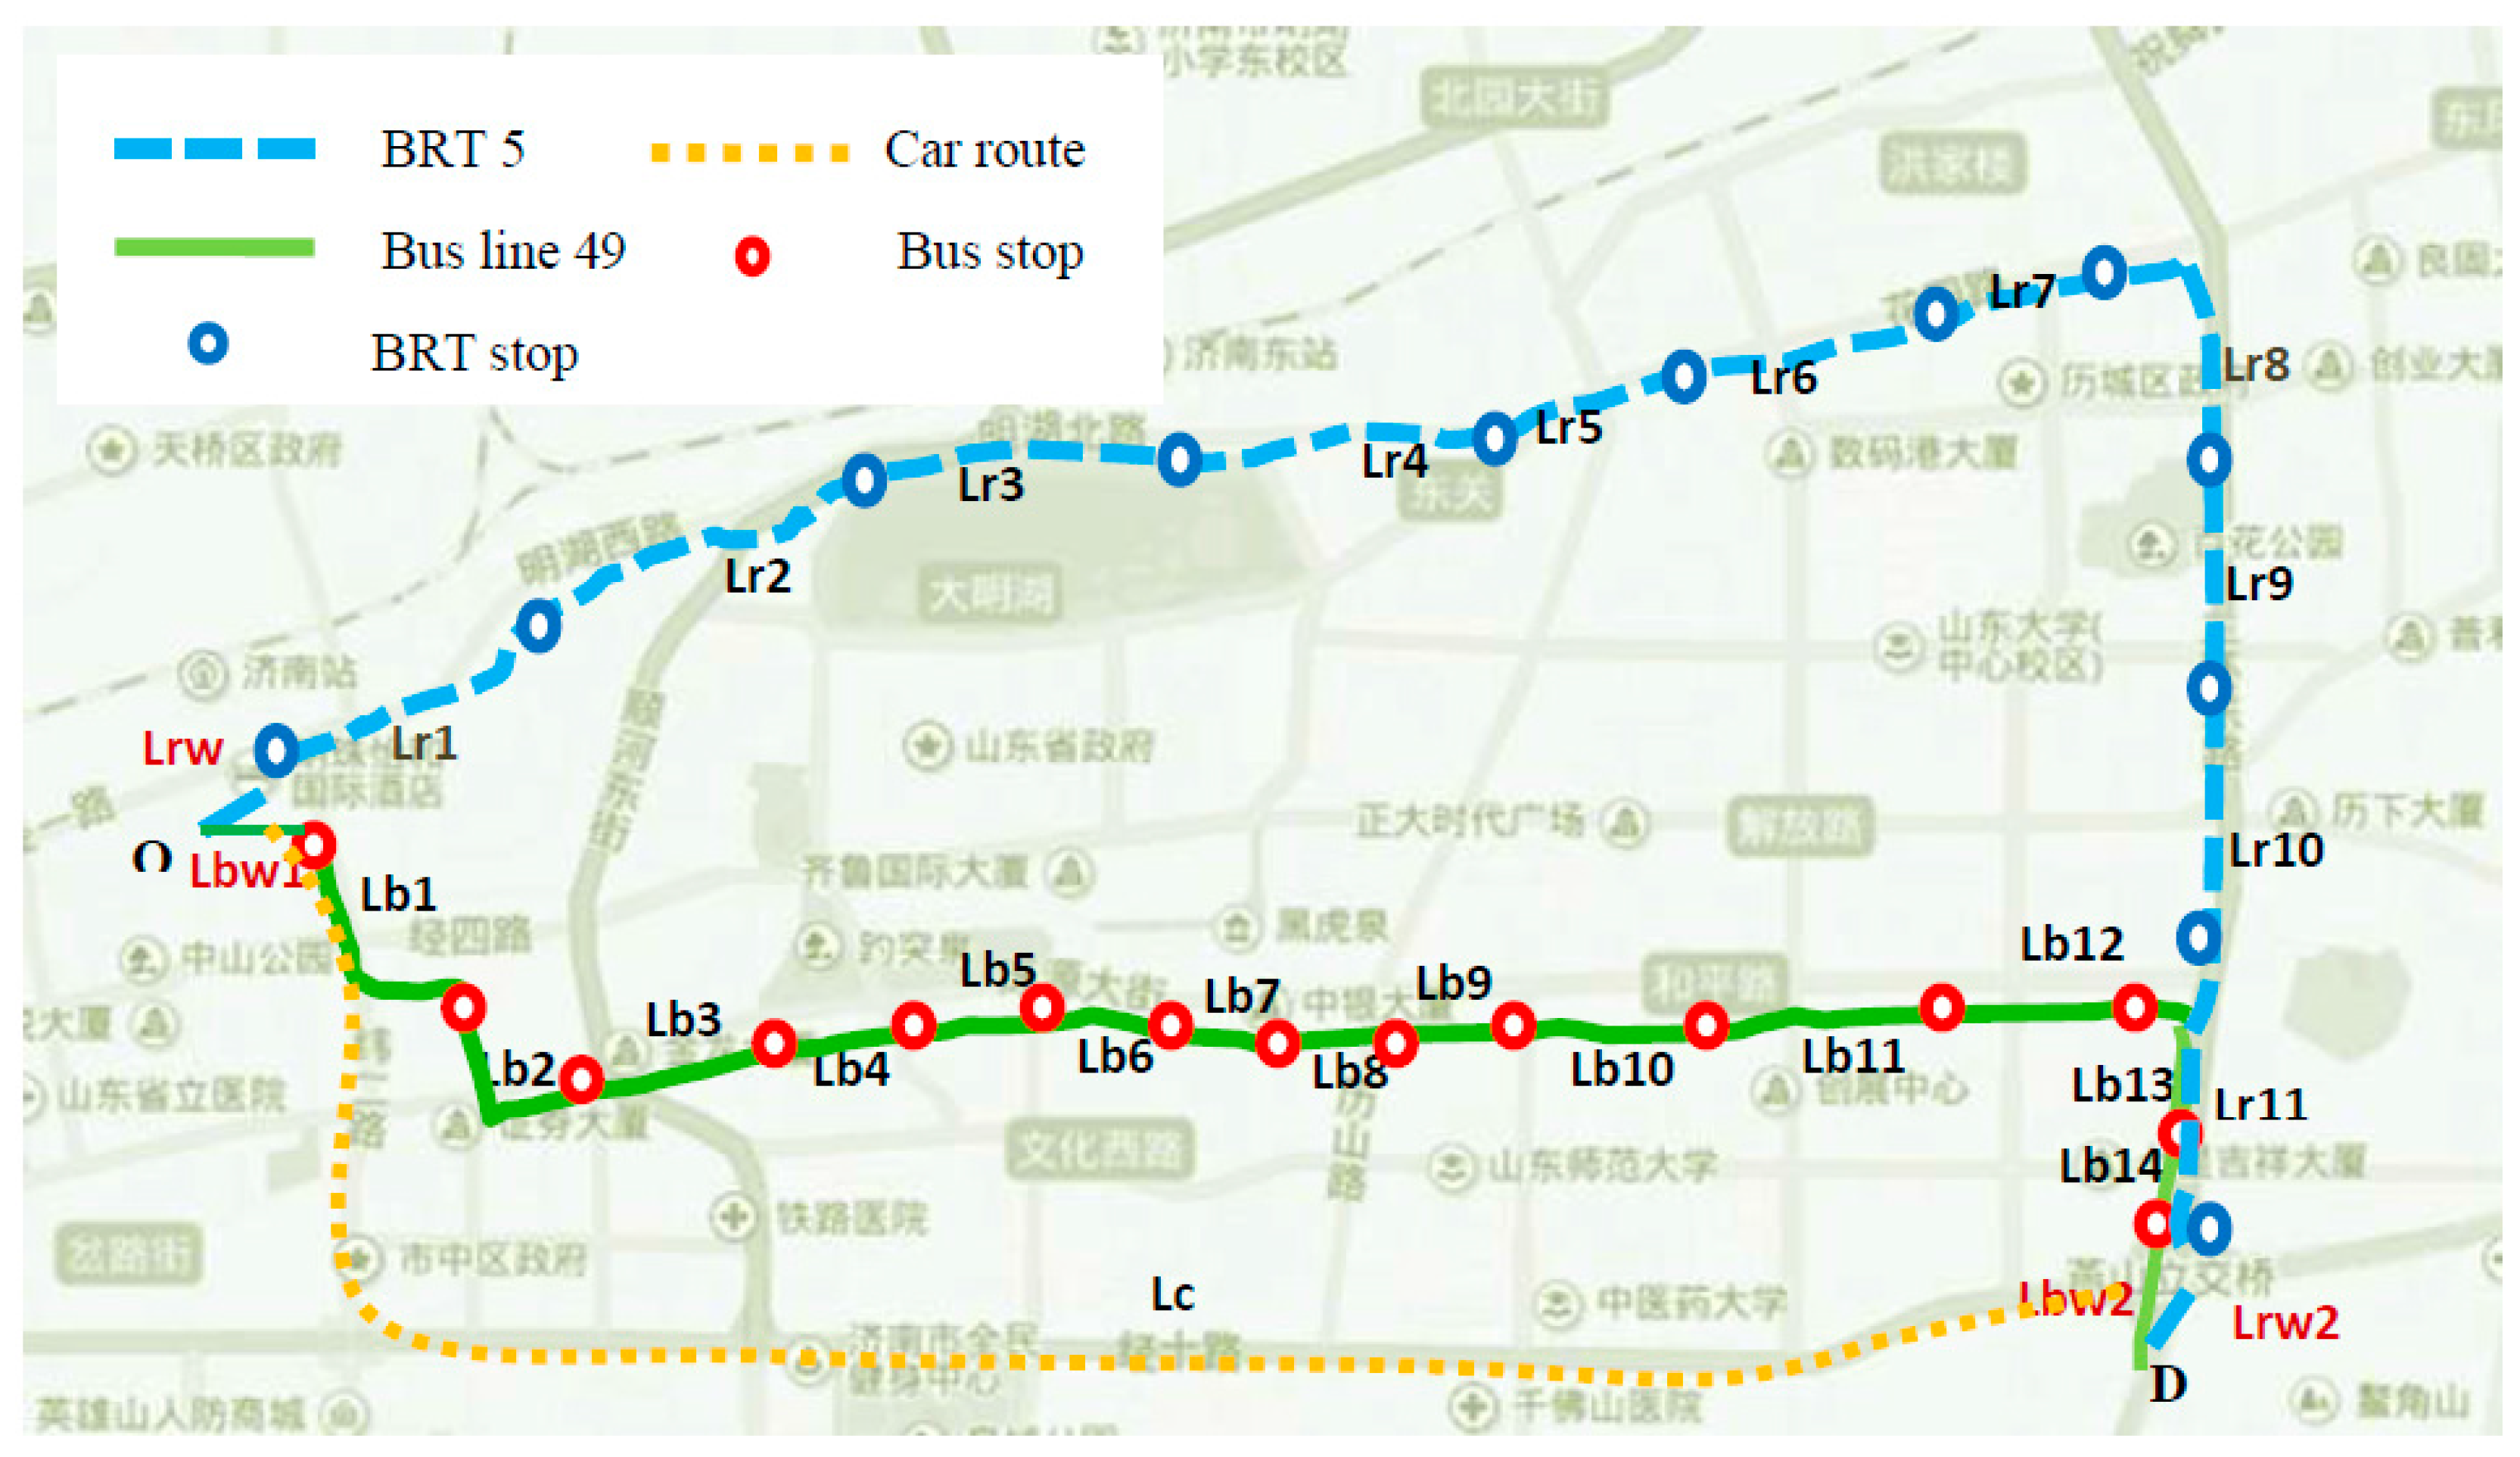
Figure 4). Walking, bikes, and electric bikes are green traffic modes, and these traffic modes should be maintained. However, the electric bike has caused many safety problems due to its high speed and simple bumper. Based on the travel survey of Jinan city, travel time and travel cost were similar for the same trip by private car, business car, or taxi. Therefore, the three travel modes are considered together. Company buses and school buses are also operated by the public transport company, and they can be considered together with buses. In the following section, we mainly analyze the competitions among buses, BRT, and cars. BRT5, bus line 49, and car/taxi routes were chosen in this section to form a network between Jinan Railway Station and the Yan-Shan Overpass (
Figure 5).
Suppose the private sector is involved in the service provision of BRT routes. Parameters in the BLPM under a lease contract were calculated according to the operational data and financial data of the Jinan Public Traffic Company and Jinan city travel survey in 2011 [
71]. Parameter values are listed in
Table 3.
The GA toolbox of MATLAB (2012a version, MathWorks Inc., Natick, MA, USA) was used for the model solution under several comparable conditions, such as with and without the private capital investment in public transport, and whether or not to give some returns to passengers. The minimum ticket price in
Table 3 was treated as the specific cost passengers were willing to pay.
Model results in three comparable conditions before and after considering car competition with public transport are listed in
Table 4. The last column ‘objective value’ is calculated with MATLAB under the constraints of ticket fare and departure frequency. The solution algorithm was given in
Section 5. Objective value means the optimal welfare of the public transport system under the given value range of each parameter. The other columns are the variable values when the objective value reaches an optimal value. For example, the second row of
Table 4 means without car competition and without private capital investment, the optimal objective value (welfare) of the public transport system is 2737 yuan; at this time, the bus ticket price should be 1 yuan, the BRT ticket price should be 2 yuan, the bus departure frequency should be 15 buses/hour, and the BRT departure frequency should be 20 BRT/hour. For the three investment situations, the objective value, respectively, decreases after the private car competes with public transport under the same public transport travel demand (the objective value changes from 2737 to 2271 in the situation without private investment, 3457 drops to 2371 under the traditional investment, and from 3488 to 2396 in the third investment situation).
When the transportation system is optimal under each situation, bus and BRT ticket prices all reach the lowest level at the same time the departure frequency reaches the highest level. The objective value of private capital investment with returns (considering passenger value) is the greatest one (2396 yuan when considering car competition, and 3488 yuan without car competition), while the public transport system has the least welfare (2271 yuan when considering car competition, and 2737 yuan without car competition) without private capital investment, whether or not considering car competition with public transport. The results show that private capital investment is beneficial to the total welfare of the public transport system, and private capital investment in public transport considering passenger value (returning some profits to passengers) is superior to the traditional investment without considering passenger value. The system welfare under proposed strategy is 2396 yuan, 125 yuan higher than that without private investment (2271 yuan). The system welfare has increased by 5.5%. The lease fee for the private sector should not be higher than 225 yuan/day (the present fee is 100 yuan/day, meaning there is a growth space of 125 yuan). Otherwise, the system welfare will be less than that without private investment.
Table 5 shows the results under different passenger demands when other parameters are fixed. If the passenger flow is less than 200 in this case, it does not satisfy the profit constraint. Therefore, travel demand should be carefully considered when the private capital invests in public transport. The lease fee and subsidies should be adjusted reasonably. Obviously, the results also depend on the ticket price and other costs. After all, the model can show a reasonable tendency. For a given city and fixed transport system, it can analyze the investment feasibility more precisely than qualitative analysis.
Benefits returned to passengers will attract more people to take the bus. Since the benefit rate of cash flow in accounts of bus cards is higher than that of bank interest, there will be additional returns for passengers. However, in order to satisfy the benefit rate of the private sector, there should be some critical point.
Table 6 shows that the critical point is 0.9 in this case. As the return ratio increases, the system objective value increases gradually. The system welfare when return rate reaches the critical point is 2416.9 yuan; the value increases by 1.9% than without returns to passengers. Additionally, the return critical point is determined by all of the parameters and constraint conditions. This case is only one bus route and one BRT route; the total welfare of the whole city’s public transport system will be considerable.
The quantitative effects of private capital investment in public transport are obvious. The critical points of the lease fee, passenger flow, and return rate can also be calculated via the model. The results are important for decision-makers and private sectors. The BLPM is reasonable for private capital investment in public transport considering passenger value in terms of the process of the solution and results analysis. Specific parameters can be regulated and controlled, and policy suggestions can also be recommended based on the model.
7. Discussion and Conclusions
This study provides a comprehensive view of private capital investment. Private capital investment in urban public transport is limited in scope [
3] to mainly infrastructure construction and operations. Since investments in construction are well-addressed, investments in operations are particularly discussed in the paper. Due to unsustainable finance, previous investments in public transport operation have largely failed [
3]. As such, a new investment strategy considering passenger value is proposed in the paper. In order to quantify the effects of the proposed investment scheme, the bi-level programming quantitative evaluation model of private capital investment in public transport considering passenger value was established, a solution algorithm was designed, and the model validity was verified through a case analysis of Jinan public transport of China. The research results provide a theoretical basis for quantifying the impacts of private capital investment in public transport and designing more efficient investment schemes.
Through the results shown in
Table 4,
Table 5 and
Table 6, we can obtain the critical points of the lease fee, passenger flow, and return rate. The system welfare has increased by 5.5% after considering passenger value. The variations of objective values are smooth when critical parameters (ticket price, passenger flow, return rate) take different values. There are no big fluctuations for the objective values. Therefore, the critical parameters are robust. Additionally, the total welfare of the whole city’s public transport system will be considerable if considering passenger value. Private capital investment is beneficial to the total social welfare of the public transport system, and the investment model considering passenger value is superior to the traditional investment. The new investment scheme is better for sustainable development of public transport. Private investment considering passenger value should be encouraged. The proposed investment strategy increased the total social welfare of the public transport system and increased the total benefits of private sector when considering passenger value. The proposed investment strategy is beneficial to the financial sustainability of public transport development. This research is related to the topic of sustainability especially the financially sustainable development of public transport. In this case, the lease fee for the private sector should not be higher than 225 yuan/day. Additionally, passenger flow should be higher than 200. The above analyses show that the competition among different traffic modes, public transport travel demand, government subsidies, and returns to passengers should be considered carefully. The quantitative results of the case study are valuable for decision-makers and the private sector. The VFM analysis can also give financial results, but VFM only considers the financial aspect. For public transport, traveler’s choice behavior is very important, which will affect the number of passengers [
39].
Additionally,
Table 4 also shows private cars are bad for public transport system, and travelers should be encouraged to use public transport through improving the service quality and passenger returns. Only in this way can the success rate of private sector investment in public transport be improved efficiently.
Although the case study is simple, the model construction and model solution provide a foundation for further research and practical application. If the operational data and financial data of public transport in another city in China and elsewhere are collected, BLPM can be solved easily according to the solution algorithm in the manuscript. Collecting the related data is not a problem for government officials in the management department of public transport. The model established in the paper can be transplanted to other cities if the parameter values in
Table 3 are collected. The paper also has some shortcomings. It is obvious there is competition and cooperation among different public transport modes. Cooperation is important in the public transport network due to transfers between different public transport modes. The intermodal issues are very important; however, the issues will make the complexity of BLPM increase rapidly. The model, at present, only considers competition among different public transport modes, although in the case study, competition is more common for the same origin and destination. Perhaps cooperation is more important if there are transfer situations. Xue and Guan [
3] also established BLPM for private investment in public transport in previous research and chose a binary logit model as the travel mode choice model. They also only considered the competition between buses and BRT. In this study, private cars and taxis were added to the competition among the traffic model, and a multinomial logit model was chosen as the traffic mode choice model. Intermodal issues could be considered in further research in a more complicated network.
Based on the BLPM established in the paper, more detailed and further research can be developed. In fact, each parameter is not certain as a fixed value in the sample case. This is the uncertainty or stochastic bi-level programming problem which will be explored in following studies. The solution problem of BLPM when the lower function is not convex is also worthy of discussion. Additionally, the strategies under more complicated networks and intermodal issues need further research and design in detail. After all, the BLPM constructed in the paper laid the foundation for further research and provides a quantitative analysis tool which is more reasonable than the value for money analysis.


