Article

The Suitability of Different Nighttime Light Data for GDP Estimation at Different Spatial Scales and Regional Levels

1
Institute of Geographic Sciences and Natural Resources Research, Chinese Academy of Sciences, Beijing 100101, China
2
State Key Laboratory of Resources and Environmental Information System, Beijing 100101, China
3
University of Chinese Academy of Sciences, Beijing 100049, China
*
Author to whom correspondence should be addressed.
Sustainability 2017, 9(2), 305; https://doi.org/10.3390/su9020305
Submission received: 9 December 2016 / Revised: 10 February 2017 / Accepted: 14 February 2017 / Published: 19 February 2017

Abstract

:
Nighttime light data offer a unique view of the Earth’s surface and can be used to estimate the spatial distribution of gross domestic product (GDP). Historically, using a simple regression function, the Defense Meteorological Satellite Program’s Operational Linescan System (DMSP/OLS) has been used to correlate regional and global GDP values. In early 2013, the first global Suomi National Polar-orbiting Partnership (NPP) visible infrared imaging radiometer suite (VIIRS) nighttime light data were released. Compared with DMSP/OLS, they have a higher spatial resolution and a wider radiometric detection range. This paper aims to study the suitability of the two nighttime light data sources for estimating the GDP relationship between the provincial and city levels in Mainland China, as well as of different regression functions. First, NPP/VIIRS nighttime light data for 2014 are corrected with DMSP/OLS data for 2013 to reduce the background noise in the original data. Subsequently, three regression functions are used to estimate the relationship between nighttime light data and GDP statistical data at the provincial and city levels in Mainland China. Then, through the comparison of the relative residual error (RE) and the relative root mean square error (RRMSE) parameters, a systematical assessment of the suitability of the GDP estimation is provided. The results show that the NPP/VIIRS nighttime light data are better than the DMSP/OLS data for GDP estimation, whether at the provincial or city level, and that the power function and polynomial models are better for GDP estimation than the linear regression model. This study reveals that the accuracy of GDP estimation based on nighttime light data is affected by the resolution of the data and the spatial scale of the study area, as well as by the land cover types and industrial structures of the study area.

1. Introduction

Gross Domestic Product (GDP) is a basic indicator that measures national and regional economic development [1]. Obtaining accurate and up-to-date information on the spatial distribution of GDP is important to better understand a country’s social and economic condition [2]. Modern satellite remote sensing technology can provide a foundation for large-scale and high-frequency studies. It can also provide the foundation for combining natural science and socio-economic research [3,4]. Nowadays, remote sensing data have become a useful substitute for economic indicators when the source data are missing or of low quality in a study area [5]. Nighttime light data, an important remote sensing product, reflect the use of public and commercial lighting, which is strongly associated with the state of the economy and can indicate the development of urbanization, population, and industry [6,7]. Nighttime light data have been used for simulation, dynamic monitoring [8,9], and comparative evaluation of regional populations [10,11], GDP [12], and other key socio-economic indicators.
Nighttime light products provide an efficient approach for studying regional societies and economies. For example, Elvidge et al. show that regional GDP and DMSP/OLS (Defense Meteorological Satellite Program’s Operational Linescan System) nighttime light area are highly correlated [13]. Based on Elvidge’s results the U.S. Air Force and the National Oceanic and Atmospheric Administration (NOAA) released a global GDP dataset on a 1-km grid in 2010. The same year, Ghosh et al. also produced a global GDP map on a 1-km grid, integrating population and land cover data [14]. He et al. built a spatial pattern of electric power consumption (EPC) in Mainland China at the county level from 1995 to 2008, based on DMSP/OLS stable nighttime light data [15]. Han et al. studied the correlation between DMSP/OLS data and economic census data at the county level and then produced a raster grid GDP map [16]. Doll et al. studied the correlation between total radiance, instead of lighted lit area, and GDP using a linear regression function and finally created a GDP estimation map of the United States and 11 countries in the European Union at a resolution of 5 km [17]. Han et al. generated a GDP map of Mainland China on a 1-km grid based on DMSP/OLS NTL (Nighttime light intensity and Lit areas) data and land cover data [18].
Therefore, a number of studies have shown that DMSP/OLS nighttime light data can be used to investigate the economic status of a country [19,20] with varying methods, spatial scales, data sources, and study areas. In terms of the data source, studies have used only nighttime light data [21] or combined nighttime light data with other monitoring products [22,23,24]. In terms of the study methods, several methods for GDP estimation using nighttime light data have been implemented, including simple linear regression [25], log regression models [26], and artificial neural networks [27]. In terms of the spatiotemporal dimensions, there are studies at the county or higher spatial scale level [22,28], as well as studies of dynamic changes over long time series at lower spatial scales or at the national scale [29].
Past studies have usually investigated the correlation between nighttime light data and GDP statistical data from the perspective of a single spatial scale (or single area), single functional model, or single nighttime light image. For example, most past studies have usually used DMSP/OLS data products with a coarse resolution but not the new NPP/VIIRS (Suomi National Polar-orbiting Partnership Visible Infrared Imaging Radiometer Suite)data with high spatial and radiometric resolution [21,30,31], which was probably due to a lack of awareness of preprocessing methods for these new data. Summarizing past studies shows that conclusions about GDP estimation differ widely and cannot be generalized, probably because of different spatial scales, data sources, fitting models, and study areas, or different economic levels and industrial structures. So far, there has been no systematical comparison and assessment of the suitability of nighttime light data for GDP estimation from the viewpoints of different data sources, different spatial scales, and different regression functions.
In order to fill the research gap, the suitability of nighttime light data for GDP estimation are analyzed from the three perspectives of data sources, fitting function models, and spatial scales. Specifically, two levels of administrative divisions in Mainland China, the provincial level (including autonomous regions and municipalities) and the city level (including prefectures cities, autonomous regions, and municipality), are the spatial scales in this study. The DMSP/OLS and NPP/VIIRS nighttime light data are the remote sensing data sources. Linear regression, power function, and polynomial models are used for relating the nighttime light data to the GDP statistical data at the provincial and city scales, and the GDP estimation accuracy and error are compared for each model. Based on the estimation accuracy and error, the model with the highest precision is selected. Then the spatial distribution of the estimation error of the best model is mapped in order to explore the spatial regularities and underlying mechanisms. This work can provide support for reasonable applications of nighttime light products in the economic and social science fields.
The paper is organized as follows. In the Section 2, we first introduce the study area, the data sources, the data processing methods, and the different models. In Section 3, we present the methods used. In Section 4, we present the estimation results, the spatial scales, the model suitability analysis based on the linear regression, the power function, and the polynomial models. In Section 5, we discuss the regional suitability of the GDP estimation based on the best modelling simulation and analyze the mechanisms of regional suitability. Finally, in Section 6, we summarize the results and draw conclusions.

2. Study Area and Data
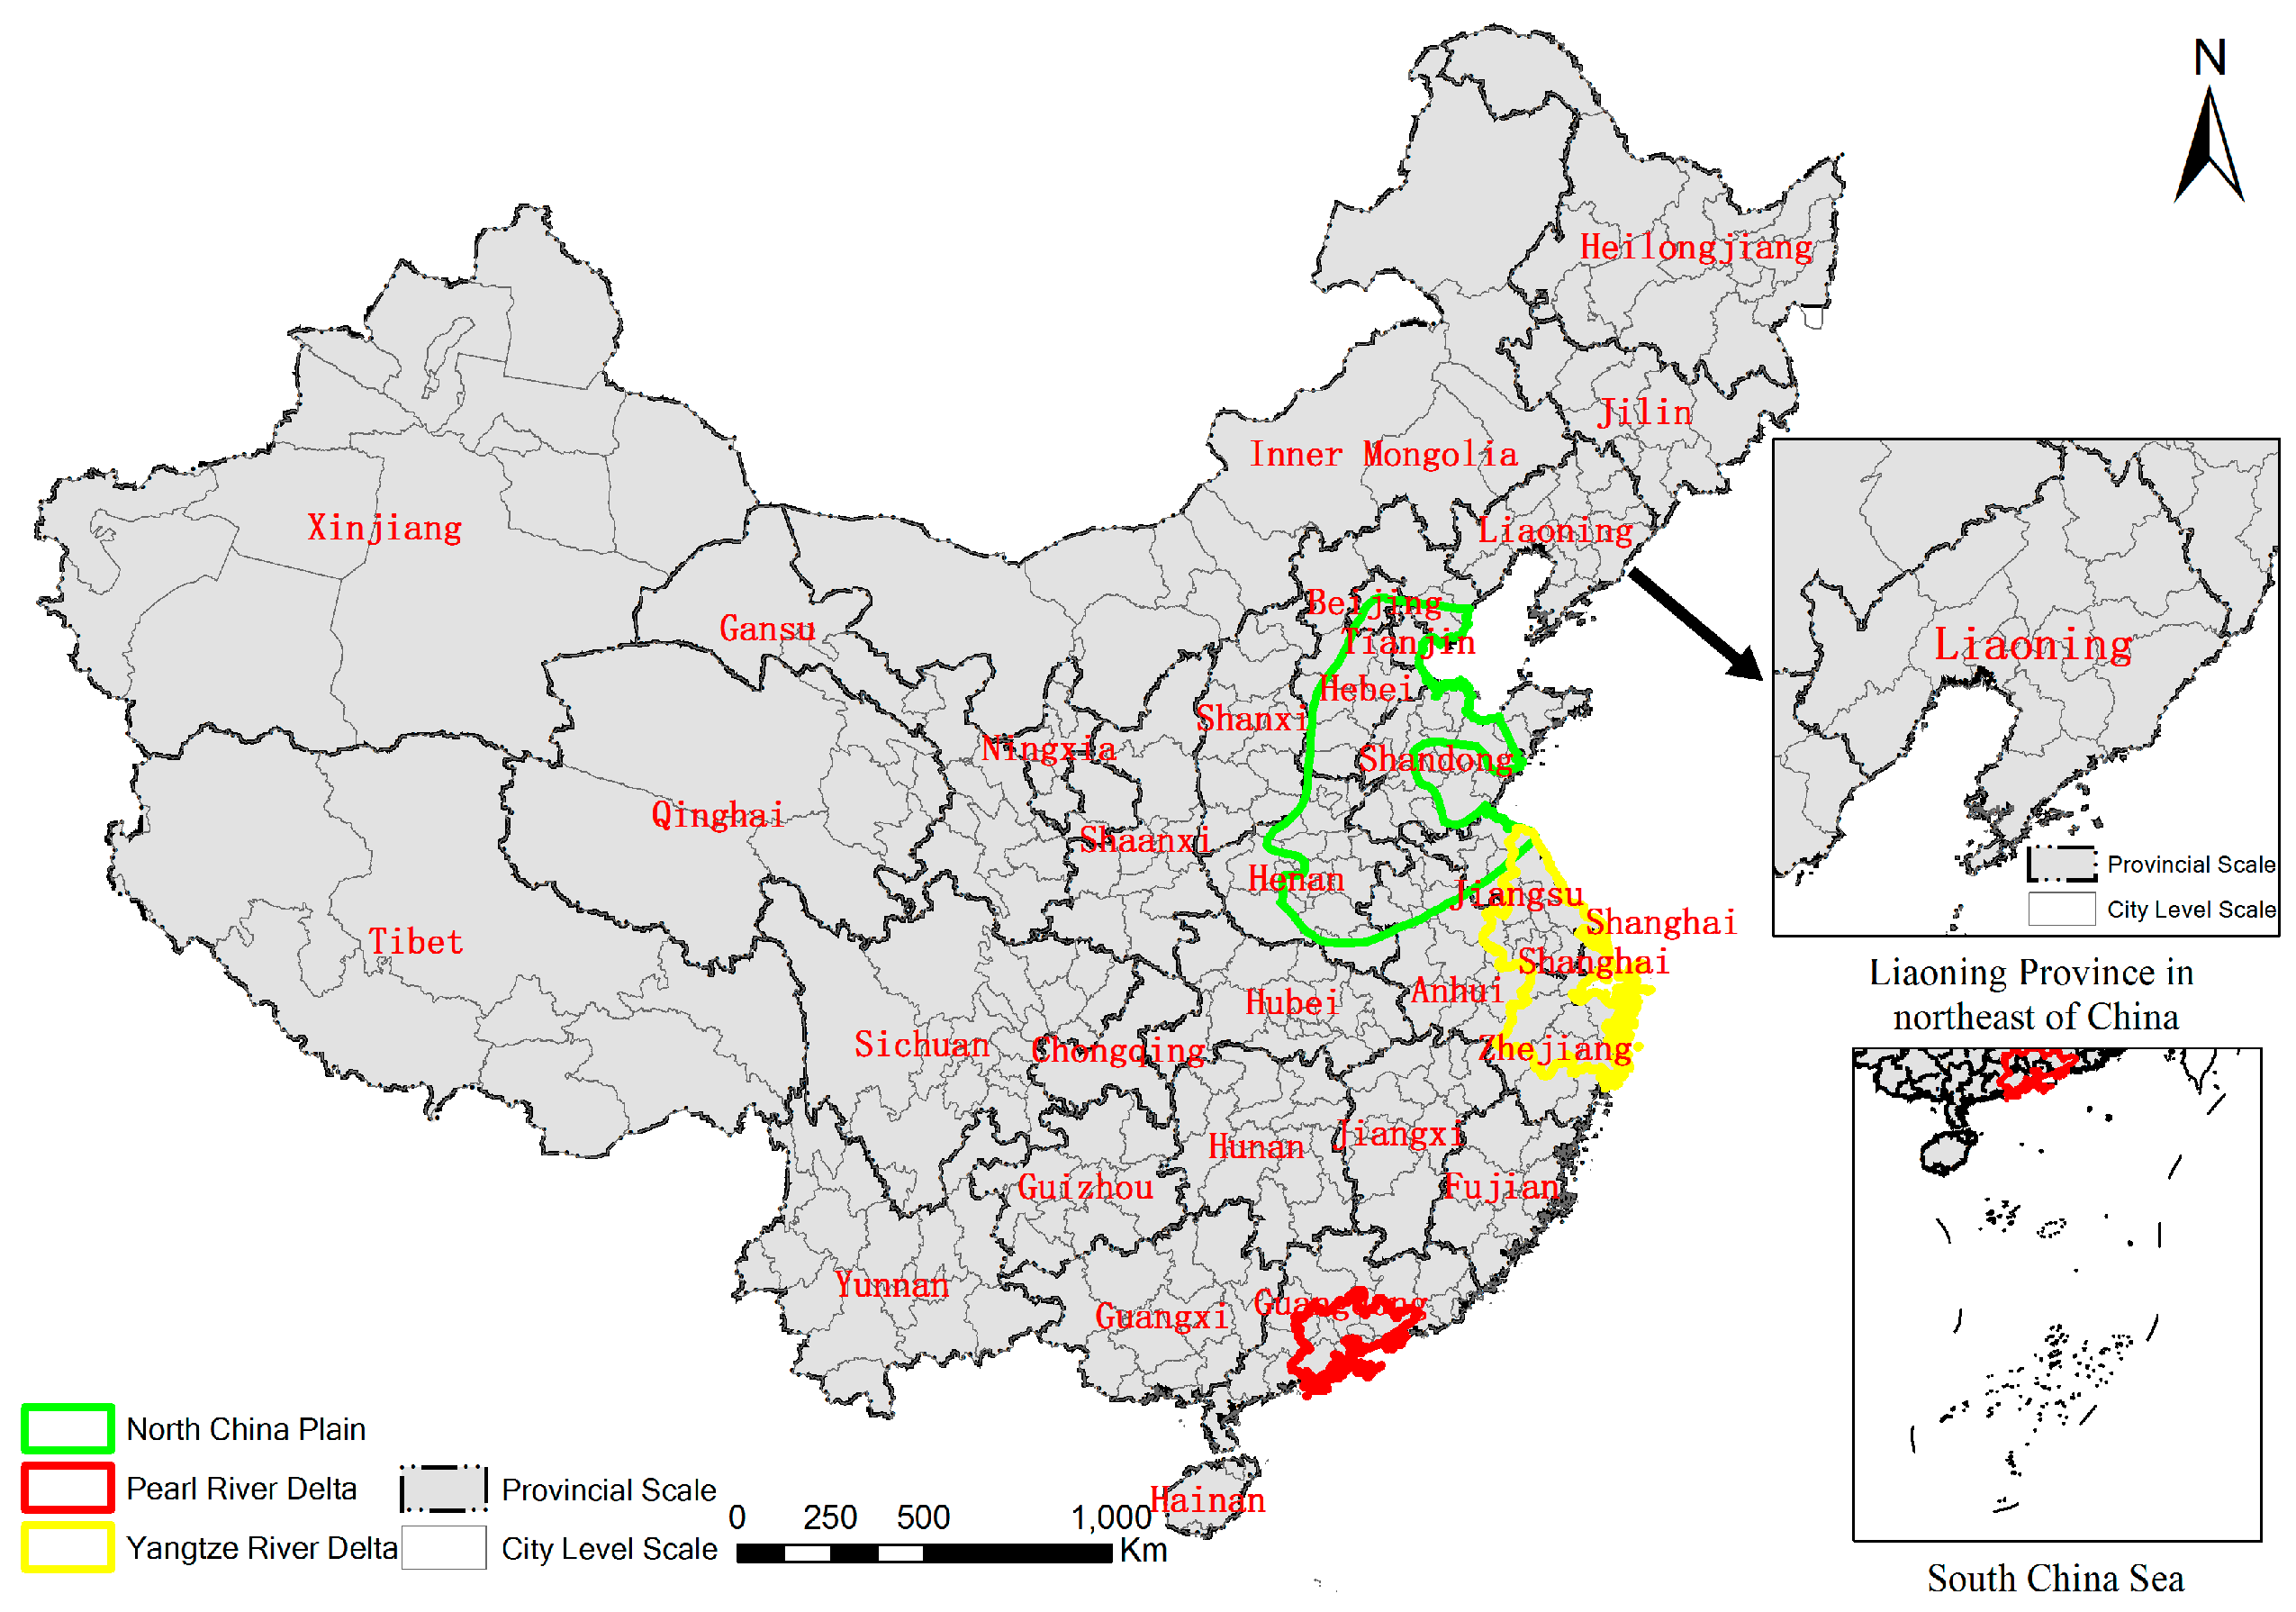
2.1. Study Area

To evaluate the suitability of the DMSP/OLS and NPP/VIIRS nighttime light imagery for modelling regional GDP at different spatial scales, we use China’s provincial and city level administrative regions for analysis. In China, there are three major levels of administrative areas; province, city (prefecture city), and county. All the provincial regions, except Hong Kong, Macao, and Taiwan, are included in this research. At the city level, 341 cities (337 prefectures and four municipalities) in Mainland China are selected. In fact, municipalities represent a higher administrative rank than prefecture counties, but the economic data and boundaries of their districts are difficult to collect from public sources. Therefore, each municipality is treated as a statistical region along with the prefecture level regions. The areas of the prefectural divisions in the municipalities are much smaller than those in the provinces. In this work, we use the ‘city level’ to represent the prefectures and municipalities. Some prefectural units are neglected in the city level analysis due to a lack of GDP statistical data (Hainan is a province that contains ‘Counties directly controlled by Province-level Governments’; the counties are not on the same level as the prefectures’ cities and lack relevant statistical data). Figure 1 represents the 31 provinces and 341 city level regions. In the map, the top box mainly describes the difference between the Provincial Scale and the City Level Scale, with Liaoning Province as an example; the below box mainly describes the South China Sea, which also belongs to China.

2.2. Data Collection

The DMSP/OLS nighttime lights [32] time series data have been released by NOAA/NGDC over 1992–2013. DMSP/OLS data can be divided into three categories; stable light data, cloud-free coverages, and data with no further filtering. In this study, the DMSP/OLS stable light data are collected for 2013. This dataset is a cloud-free composite assembled using all the archives of smooth resolution data of DMSP/OLS. It contains lights from cities, towns and other sites with persistent lighting, and ephemeral events have been removed [33] (e.g., fires, gas flares, volcanoes, and background noise) [34,35,36]. The data is in a spatial resolution of 30 arc seconds. The product is available from http://ngdc.noaa.gov/eog/dmsp/downloadV4composites.html.
Compared with the DMSP/OLS data, the NPP/VIIRS data has a higher spatial resolution and a wider radiometric detection range [37]. These also employ an onboard calibration (which is not available for the DMSP/OLS data [38]), which can increase data quality. The Suomi-NPP/VIIRS DNB composite data was collected during April and October 2014. However, these original data have not been filtered to remove light detections associated with fires, gas flares, volcanoes, or auroras. Additionally, the background noise has not been subtracted [30], including the weak light reflected by snow-capped mountains and dry lake beds. Moreover, there are some pixels with negative DN (Digital Number) values in the original NPP/VIIRS data, which must be corrected before use. The data are in a spatial resolution of 15 arc seconds. The available composite NPP/VIIRS nighttime light data was obtained from website of NOAA/NGDC (http://ngdc.noaa.gov/eog/viirs/download_viirs_ntl.html) [39].
The GDP data for the provincial and city level units in 2014 were obtained from the China Statistical Yearbook, the China City Statistical Yearbook [40,41], and some Local Statistical Yearbooks of 2015. These GDP values are recorded in the RMB Chinese currency unit, which is also called the Yuan in Chinese.
The boundaries of the administrative divisions, including the national, provincial, and city level boundaries, were obtained from the National Geomatics Center of China in 2012. The DEM data of Mainland China, drawn from the SRTM (Shuttle Radar Topography Mission), were downloaded from http://srtm.csi.cgiar.org/Selection/inputCoord.asp. All the data were projected into the Albers Equal Area Projection and resampled to a spatial resolution of 1000 m × 1000 m (cell size). Additionally, this study also used the 2013 1:100,000 land use and land cover data set provided by the Institute of Geographic Sciences and Natural Resources Research.

3. Methods

3.1. Correction of the NPP/VIIRS Nighttime Light Data

Although the NPP/VIIRS nighttime light data have a higher spatial resolution and a wider radiometric detection range, the data represents a preliminary product, which has not been filtered to remove features associated with gas flares, biomass burning, volcanoes, and background noise. Moreover, it also contains features associated with the reflectance light of bright surfaces, such as snow covered mountains or bright playa lake beds. These light noises can limit the accuracy and reliability of the GDP estimation. Therefore, confounding noises that are irrelevant to real economic activities must be removed.
The DMSP/OLS nighttime stable light data is a cloud-free composite assembled using all of the archived smooth resolution data. In this data, the background noise was discarded and only lights from cities, towns, and other sites with persistent lighting remain. Based on DMSP/OLS data, we corrected the NPP/VIIRS nighttime light data. Like Shi et al. [30], we first assumed that the lit areas in the 2014 NPP/VIIRS data and the 2013 DMSP/OLS stable light data were the same, and we extracted the pixels whose DN values are positive in the DMSP/OLS data in 2013. Then, based on the extracted pixels, we extracted the 2014 NPP/VIIRS data to generate an initial corrected image. The values of pixels with negative DN values in the original NPP/VIIRS data are assigned a value of 0. The initial corrected data can still contain a few outliers in some areas, which may be caused by the stable lights from fires of oil or gas wells located in these areas. Since Beijing, Shanghai, and Guangzhou are the three biggest and most developed cities in China, the pixel values of the other areas should not, in theory, exceed those of the three megacities. Therefore, we take the DN values of these three megacities as the maximal values, and each pixel’s DN value should not exceed this value. The value of each pixel with a DN value larger than the maximal DN value is assigned to be the same as the largest DN value possessed by the pixel’s eight immediate neighbors. After this process, all the pixel values in the corrected NPP/VIIRS data are less than the maximal value.

3.2. Simulation Model

There are a number of models which have been used for GDP estimation based on nighttime light data, such as linear regression, exponential, and complex artificial neural network models. Among these methods, the regression model is relatively accurate and easy to implement [10,42,43]. Therefore, a linear regression model (Equation (1)), a power function model (Equation (2)), and a polynomial model (Equation (3)) were used to describe the relationship between GDP and TNL (Total Nighttime Light).
G D P i ^ = a × TNL + b
G D P i ^ = a × TNL b
G D P i ^ = a × TNL 2 + b × TNL + c
where G D P i ^ is the predicted GDP of an administrative unit; TNL denotes the total nighttime light, which is measured by the sum of all pixel values in the corresponding administrative unit of an image; and a, b, and c are all model coefficients. These three models were applied to the data for the 31 provincial units and 341 cities (337 prefectures and four municipalities).
The determination coefficient R2 denotes the percentage of GDP estimation explained by TNL. The correlation coefficients R and the R2 can be used to measure the correlation between TNL and GDP (which is the city’s statistical data) for each administrative region.
The Relative Error (RE), which is obtained from the predicted GDP and the statistical GDP data for each administrative region, is used to evaluate the regression function’s capacity for GDP estimation. An RE value less than zero means that the predicted GDP is lower than the real GDP (statistical data); an RE value more than zero means that the predicted GDP is higher than the real GDP. The lower the absolute value of the RE, the better the function’s capacity for GDP estimation.
The Relative Root Mean Square Error (RRMSE), which is derived from RE and the research number, is used to measure the regression function’s accuracy of GDP estimation for each administrative region. The lower the RRMSE, the better the regression function’s fitting accuracy. The residual RE and the RRMSE can describe the model’s fitting precision. The previous parameters are computed as follows:
R = i = 1 n ( G D P i G D P ¯ ) ( G D P i G D P ¯ ) i = 1 n ( G D P i G D P ¯ ) 2 i = 1 n ( G D P i G D P ¯ ) 2
RE = ( ( GDP i ^ GDP i ) / GDP i ) × 100 %
RRMSE = i = 1 n ( RE ) 2 n
where n is the number of fitting elements. Low absolute values of RE are associated with low RRMSE values and indicate an accurate model. At the provincial level, the GDP data and the TNL data are analyzed over the 31 provincial regions using the three regression models. At the city level, the GDP data and the TNL data are analyzed over the 341 cities.

4. Results

Figure 2a shows the DMSP/OLS nighttime light data for Mainland China, and Figure 2b shows the corrected NPP/VIIRS data for Mainland China. Using the model formulations presented above, the TNL-GDP relationship were evaluated at the provincial and the city levels (Figure 3). Then, based on Equations (4)–(6), we calculated the correlation coefficient R, the determination coefficient R2, the RE, and the RRMSE (Table 1).

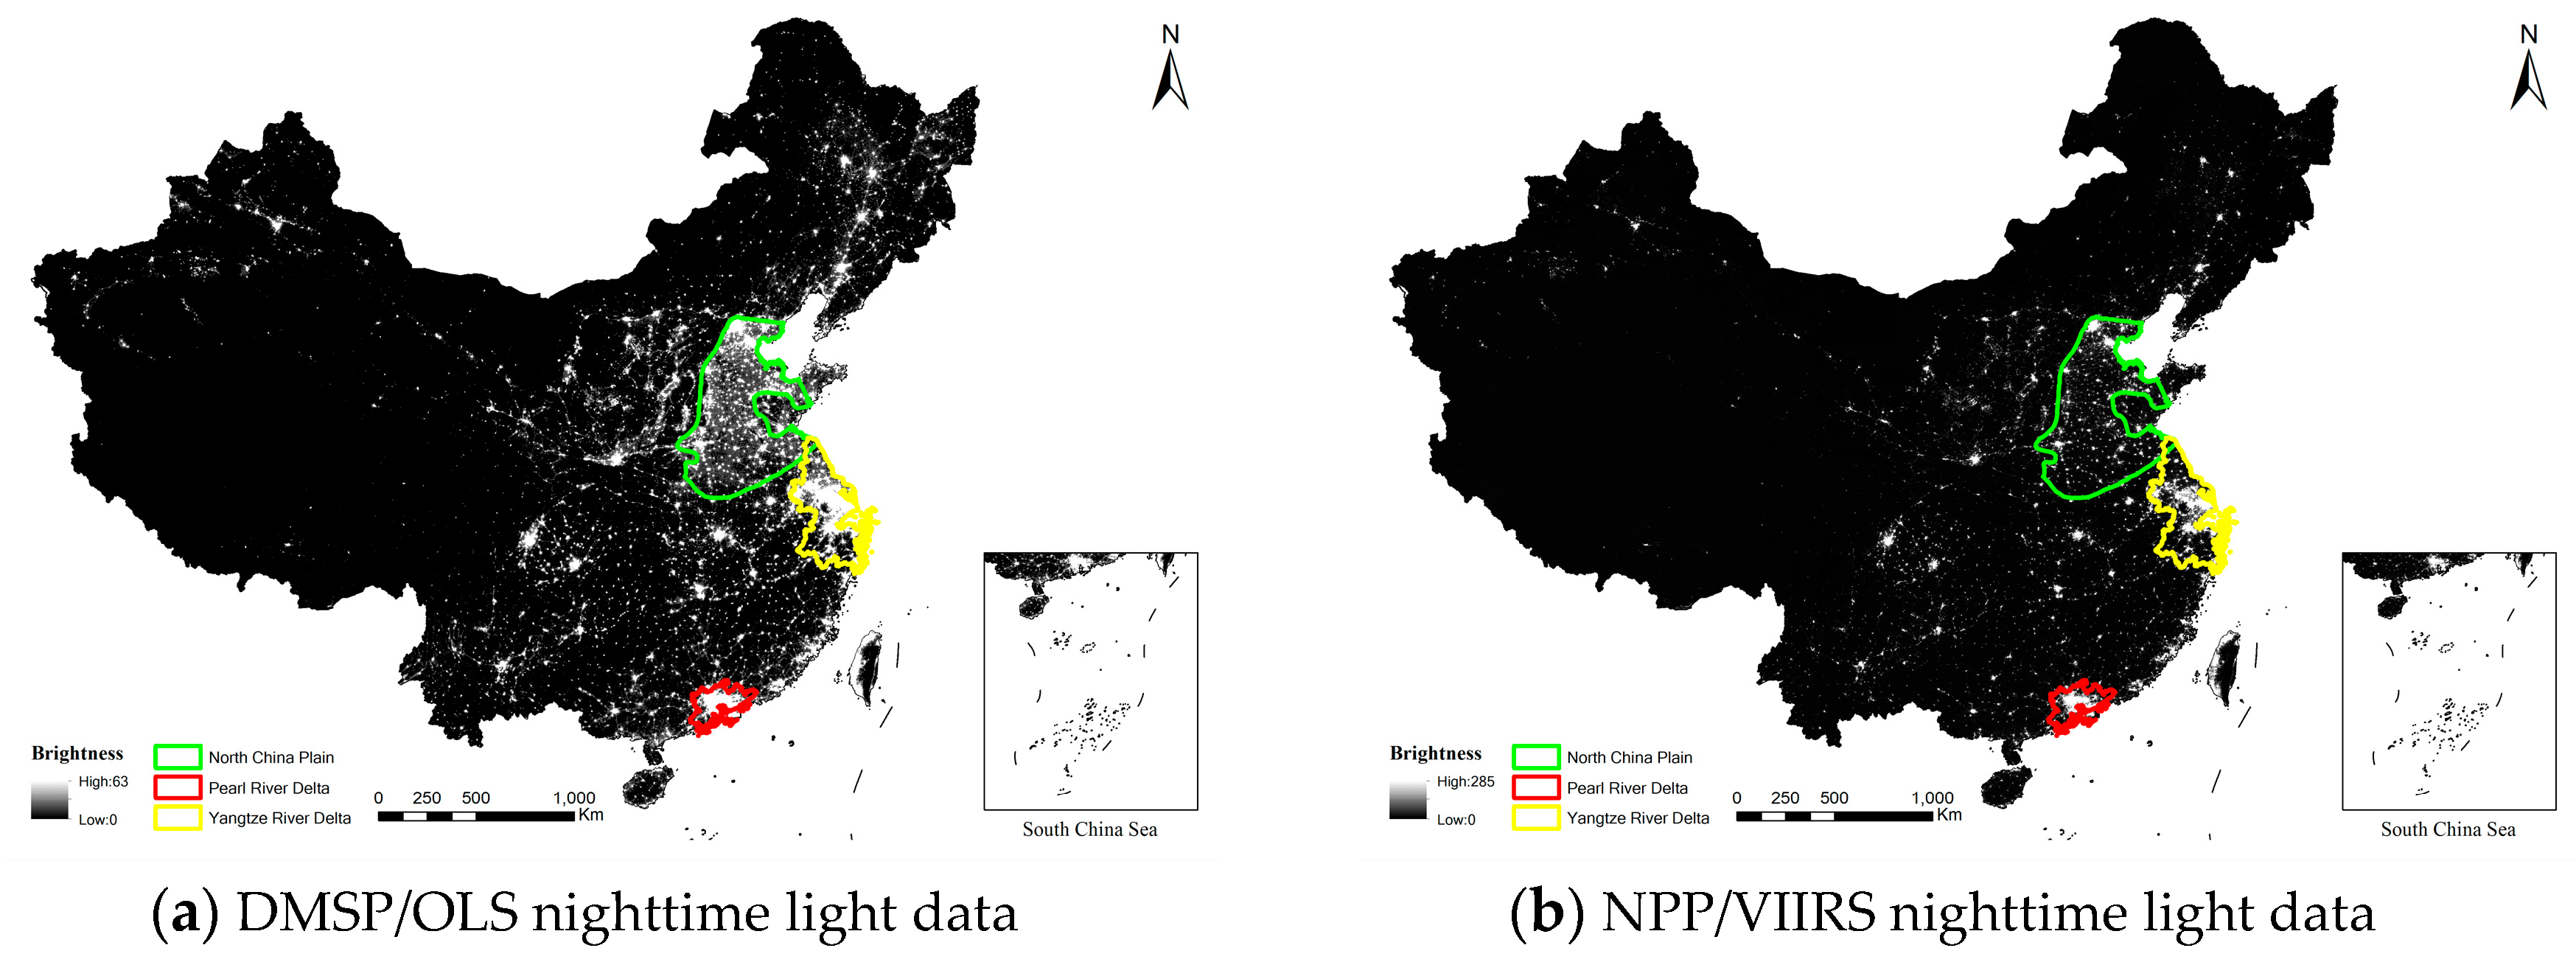
4.1. Nighttime Light Images

In both the DMSP/OLS data and the NPP/VIIRS data, the high DN values are mainly found in eastern China, especially in the North China Plain, the Yangtze River Delta, and the Pearl River Delta, which is mapped in Figure 1 and Figure 2. In central China, in some provincial capitals such as Wuhan, Changsha, Chengdu, Chongqing, and Xi’an, a certain degree of light concentration is observed. In the western parts of China, especially in Tibet, Qinghai, the southern part of Xinjiang, and the western part of Inner Mongolia, the nighttime light DN values are very low or even equal to zero (Figure 2).
DMSP/OLS has a grid resolution of 1 km, a radiation resolution of 6 bits, and DN values ranging from 0 to 63. The DMSP/OLS nighttime light image has the characteristic of high brightness and dramatic spatial transitions. On the other hand, the NPP/VIIRS nighttime light image has a sub-satellite point resolution of 400 m, a grid resolution of 500 m in China, and a radiation resolution of 14 bits [44]. The NPP/VIIRS data present spatial features of high brightness cells that are widely scattered with smooth spatial transitions. The overall brightness of a NPP/VIIRS image is less than that of a DMSP/OLS nighttime light image.

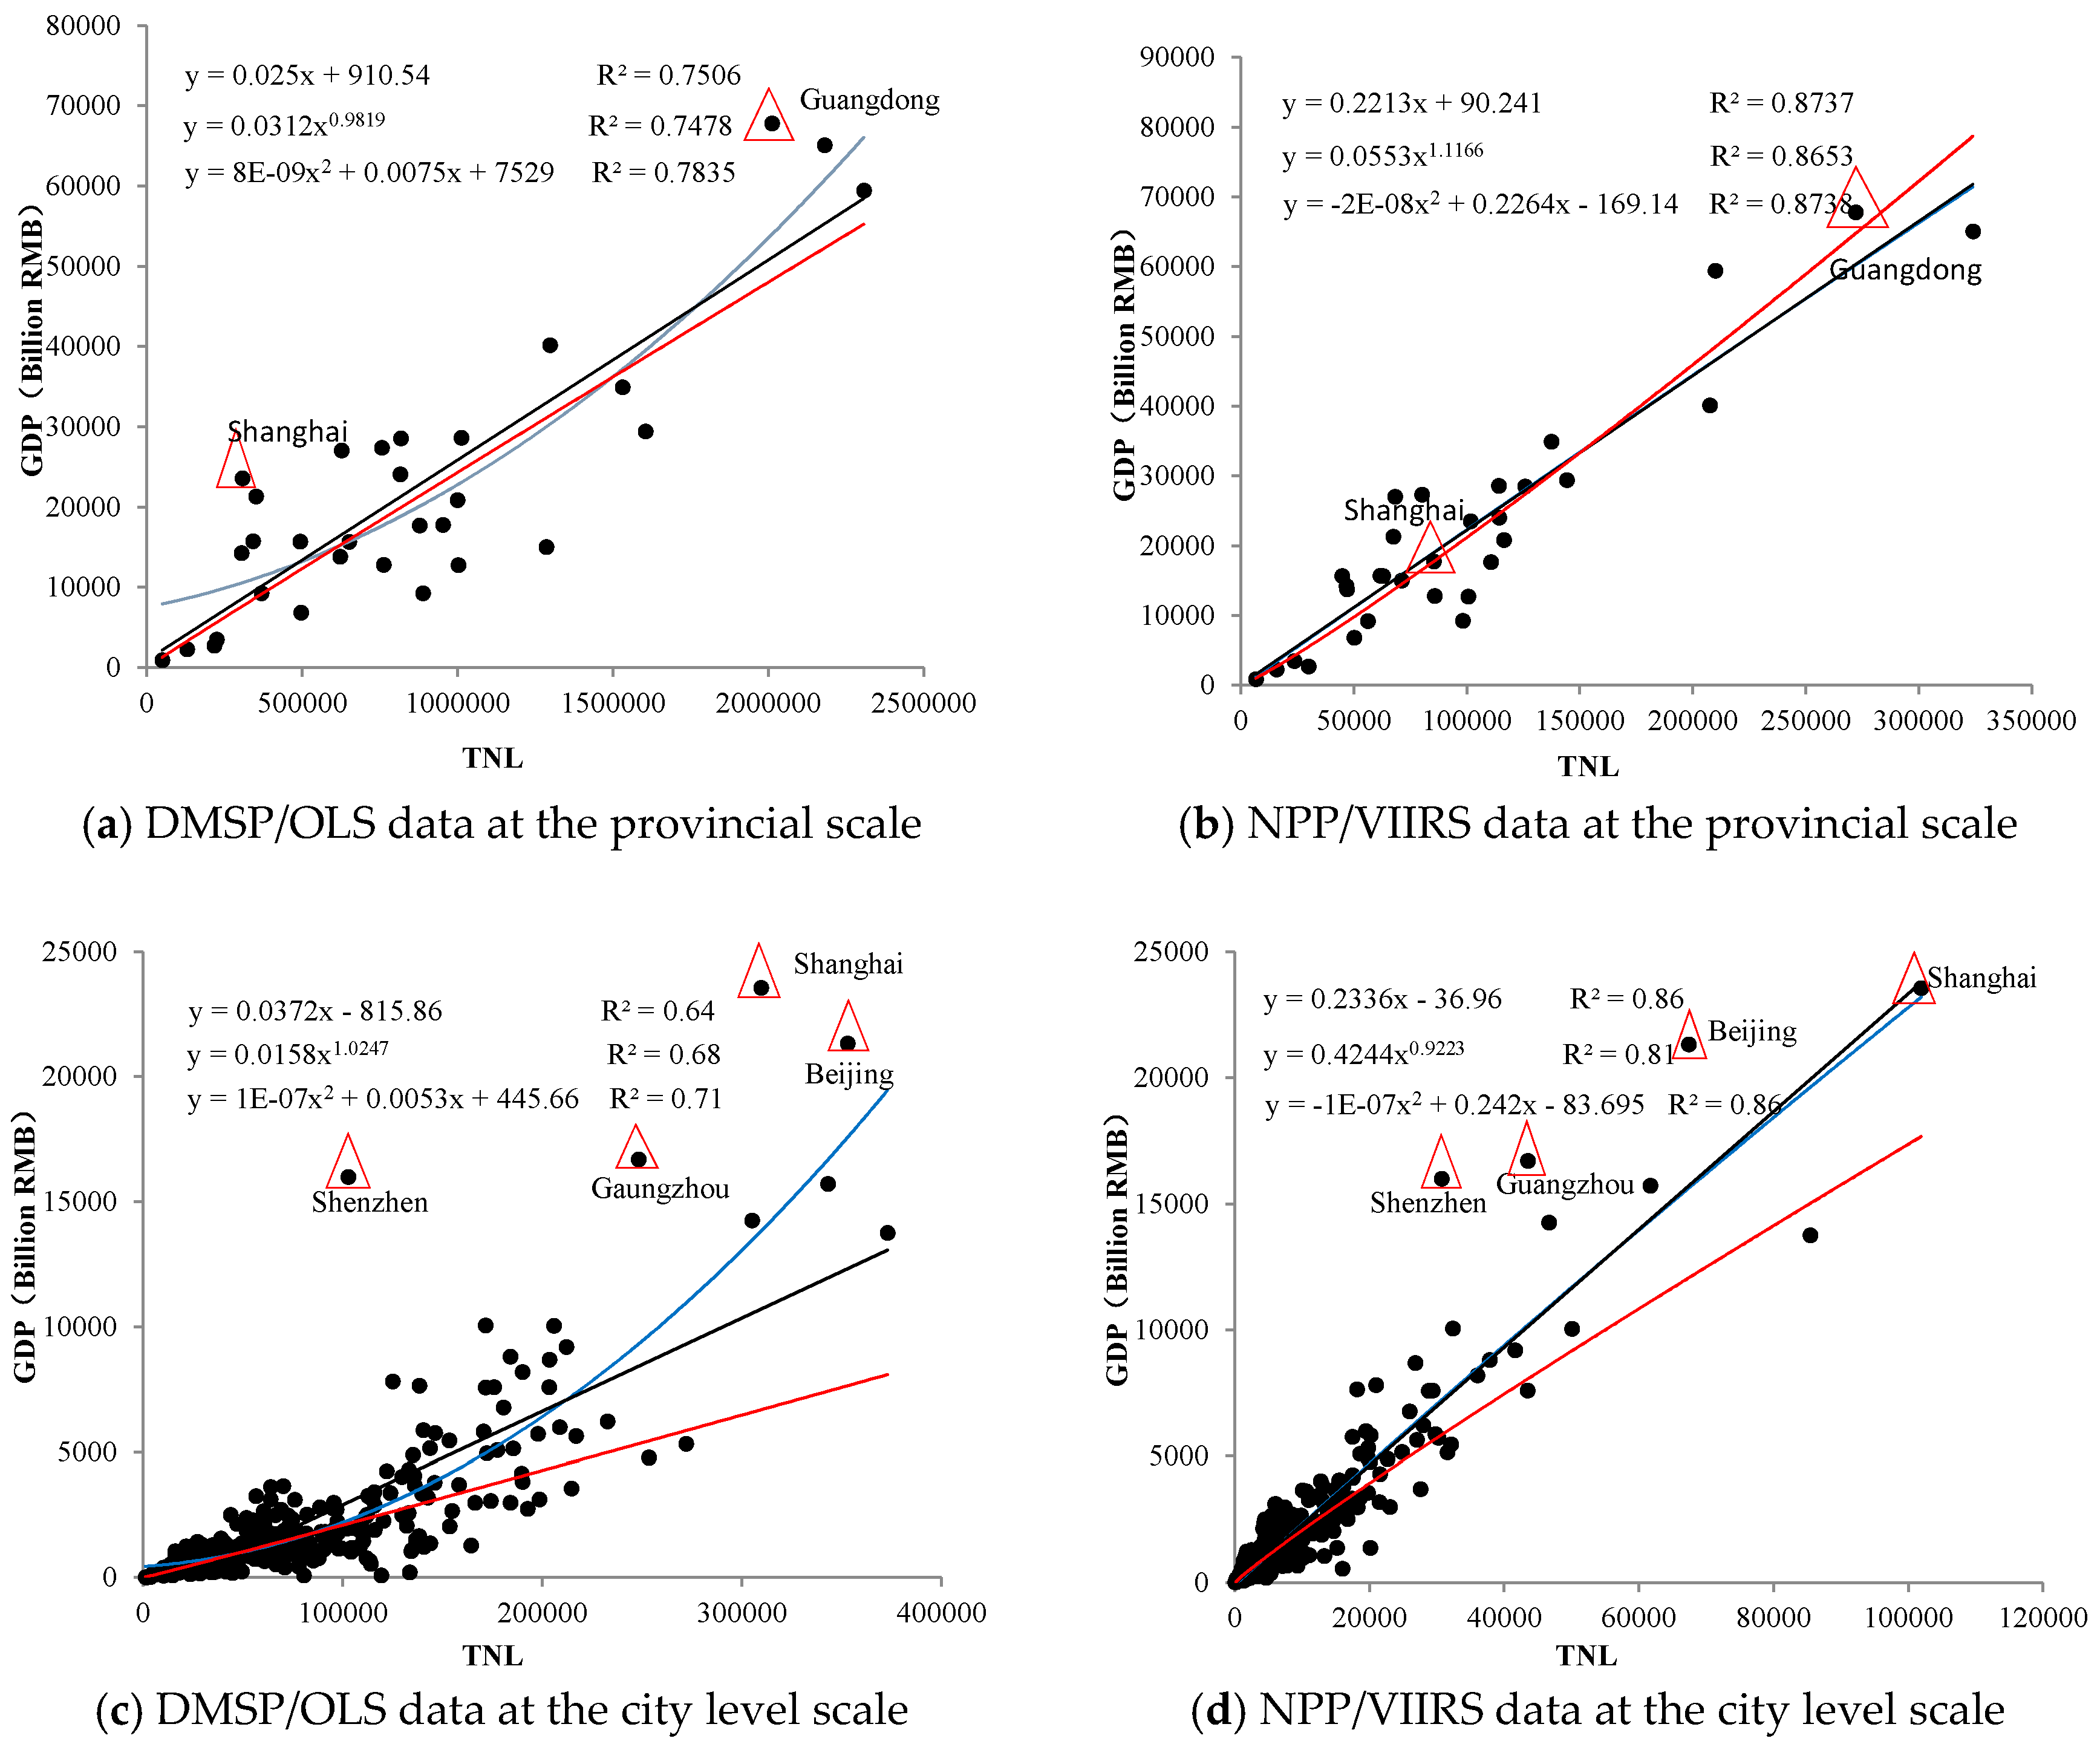
4.2. Suitability of Nighttime Light Data

The effectiveness of the NPP/VIIRS data for GDP estimation is higher than that of the DMSP/OLS data. For instance, when comparing the two estimations at the same spatial scale and for the same model, the correlation coefficient R and the determination coefficient R2 based on NPP/VIIRS nighttime light data are higher, and the residual RE and RRMSE values are lower. The lower the RRMSE, the better the regression function’s fitting accuracy.
At the provincial scale, the GDP fitting parameters based on the DMSP/OLS data are of the same order of magnitude as the fitting parameters based on the NPP/VIIRS data, which, however, provide a slightly better fit. However, at the city level scale, the GDP fit based on the DMSP/OLS nighttime light data is significantly decreased, as the parameter RRMSE is one order of magnitude larger than that at the provincial scale, and the specific number is 3 to 6 times larger.
Whether at the provincial scale or the city level scale, the GDP estimation based on NPP/VIIRS data usually displays stronger consistency than the GDP estimation with the DMSP/OLS nighttime light data. The simulation values (R, R2, RE, RRMSE) are approximately the same at different scales, but are all superior to the same indices based on DMSP/OLS data.

4.3. Suitability of Spatial Scale

The GDP fit at the provincial scale is usually better than the GDP fit at the city level scale. To be specific, the fit models at the provincial scale have higher values of R and R2 and lower values of RE and RRMSE when using the same nighttime light data and the same model (all the R values have a level of significance p < 0.001).
In terms of the DMSP/OLS nighttime light data, no matter the fitting model, when the spatial scale shifts from the provincial scale to the city level scale, the correlation between TNL and GDP clearly decreases. For example, the R value decreases from 0.87 to 0.84; the relative error RE and RRMSE values increase substantially. The value of RRMSE in the city level scale models is 3–6 times higher than that at the provincial scale.
In terms of the NPP/VIIRS nighttime light data, no matter what fitting model was used, when the spatial scale shifted from the provincial scale to the city level scale, the correlation between TNL and GDP decreased slightly. For example, the R value shifted from 0.93 to below 0.93; the RE and RRMSE values increased slightly. The RRMSE values at the city level scale are approximately 1.2–1.5 times those at the provincial scale. The GDP estimation effectiveness based on NPP/VIIRS data is more consistent and better than that with DMSP/OLS data; the values of RRMSE based on NPP/VIIRS data remain at the same order of magnitude at different spatial scales.

4.4. Suitability of Fitting Function Model

As Table 1 shows, at the provincial scale the three regression models can all simulate the GDP of Mainland China accurately. The R value based on DMSP/OLS data is at 0.87, and the RRMSE values range between 55 and 80. The R value based on NPP/VIIRS data is at 0.93, and the RRMSE values range between 40 and 50. In general, the fitting accuracy of the three regression function models display no significant differences at the provincial scale.
At the city level scale, when the DMSP/OLS nighttime light data are used to estimate GDP, the RRMSE value based on the linear regression model is 404.1. However, there is no significant change in the magnitude of RRMSE in the power function model and the polynomial model, where the RRMSE values range between 180 and 187. The GDP estimation accuracies based on the two models are better than that of the linear regression model. Therefore, the power function model and the polynomial model may be more suitable for GDP estimation at the city level scale no matter what nighttime light data are used.

4.5. Suitability of Different City Regions

To analyze the GDP estimation reliability based on nighttime light data in different cities of Mainland China, this study attempts to determine the spatial distribution of RE, which is the relative error between the predicted GDP value and the real statistical GDP value at the city level scale.
Based on the DMSP/OLS data, the spatial distribution of RE has no significant pattern (Figure 4a). In Liaoning and Jilin province (northeastern China), eastern Inner Mongolia (northern China), Jiangsu, Zhejiang, and Fujian province (along the southeastern coast), and a few scattered cities in Anhui, Hubei, Guangxi, Hainan, Guizhou, Yunnan, Chongqing, and Sichuan province, as well as the southern part of Gansu province (central China), the difference between the predicted GDP and the real GDP value is small (which means that the RE value is within 30%) (shown in green in Figure 4a). In most other cities, when compared with the real statistical GDP values, the estimated GDP values based on DMSP/OLS nighttime light data are substantially overvalued (shown in yellow and red) or substantially undervalued (shown in light blue and dark blue in Figure 4a). A statistical analysis (Table 2) shows that the number of cities with an absolute value of RE within 30% make up only 32.8% of all cities, whereas the number of cities where the absolute values of RE are higher than 50% make up as much as 50% of all cities.
Based on the NPP/VIIRS data, the spatial distribution of RE presents a regular pattern (Figure 4b). The absolute value of RE is higher in the western inland portion of China and lower in the eastern part. The GDP estimation effectiveness is higher in the middle and eastern parts of Mainland China and worst in the western parts, especially in western Tibet and Xinjiang, as well as in some cities in Shaanxi, Gansu, Ningxia Hui, and Mongolia and most of the cities in the middle Yangtze Valley. The statistical analysis (Table 2) shows that the cities where the absolute value of the RE is within 30% make up as much as 50.1% of all cities. The number of cities with an absolute value of RE greater than 50% only account for 24% of all cities.
More concretely, the cities where the GDP is significantly overrated (with relative residual errors more than 50%, as shown in red in Figure 4b) are mainly distributed in the western part of Mainland China. These cities are located in the Xinjiang and Shanxi provinces, Haixi prefecture city in Qinghai province, Ningxia, the southeastern part of Gansu province, the northern part of Shaanxi province, and the western part of Sichuan province. The cities where the GDP is overvalued (RE is higher than 30% but below 50%, as shown in yellow in Figure 4b) are mainly distributed discretely in the central and western cities of Mainland China. Specifically, these cities include the northwestern part of Gansu province, the southern part of Shanxi and Guizhou province, the eastern part of Yunnan province, and the eastern part of Guangdong province.
The cities where the GDP is significantly undervalued (RE is lower than −50%, as shown in dark blue in Figure 4b) are distributed unevenly over the central and western regions of China. These cities mainly include Ngari prefecture and Nagqu prefecture in southwestern Tibet, as well as Hubei and Hunan province in the middle reaches of the Yangtze River. Moreover, a few cities are distributed within Jilin, Sichuan, and Gansu province. The cities where the GDP is undervalued (RE is lower than −30% but higher than −50%, as shown in light blue in Figure 4b) are mainly distributed in the central regions of Mainland China, especially in Hubei, Hunan, and Jiangxi province in the middle reaches of the Yangtze River. At the same time, a few cities are distributed within Jilin, the eastern part of Inner Mongolia and Tibet.
The cities where the GDP is estimated accurately (the absolute value of RE is lower than 30%, as shown in green in Figure 4b) are widely distributed over most areas in eastern China, especially in China's eastern coast, where the precision of GDP estimation based on NPP/VIIRS data is high.

5. Discussion

5.1. The Influence of Nighttime Light Image Resolution and the Spatial Scales of Analysis

The accuracy of GDP prediction using nighttime light data is influenced tremendously by nighttime light image radiation resolution. With the same spatial resolution, NPP/VIIRS nighttime light data are more suitable for GDP estimation than DMSP/OLS data, whether at the provincial scale or the city level scale. This is due to the higher radiation resolution of the NPP/VIIRS data. The NPP/VIIRS remote sensing data have a three-class dynamic radiation synchronization sampling platform, its radiation resolution is 14 bits, and the radiation acquisition magnitude can be as high as 105. Its high radiation resolution means that the NPP/VIIRS product has a good ability to capture the ground information using different brightness levels (high, medium, or low). Especially at the high brightness level, the light value may not reach saturation, which represents a big improvement over DMSP/OLS data. For example, even in relatively developed cities, such as Beijing, Shanghai, Tianjin, Nanjing, and Hangzhou, the corresponding RE values based on NPP/VIIRS data are −26.3%, 0.90%, −8.6%, −0.14%, and 5.3%, but the values based on DMSP/OLS data are higher with −42.3%, −54.6%, −24.1%, −31.6%, and −23.1%, respectively. Therefore, GDP estimation based on NPP/VIIRS data usually will not be underestimated due to lighting saturation, and these GDP estimates have a higher accuracy.
The matching performance between the spatial scale of the study area and the nighttime light product is another important factor that influences GDP prediction accuracy. At the provincial scale, whether DMSP/OLS data or NPP/VIIRS data are used in GDP estimation, the estimation precision is roughly equivalent. However, at the city level scale (including prefectures, cities, autonomous regions, and municipalities), the GDP estimation effect based on the NPP/VIIRS data is obviously better than that based on DMSP/OLS data. This is so because, when applied to the city level scale estimation, the analysis unit is small and the light overflow and saturation phenomenon are significant; furthermore, if the data resolution and grey levels are low, the accuracy of GDP estimation may decrease.

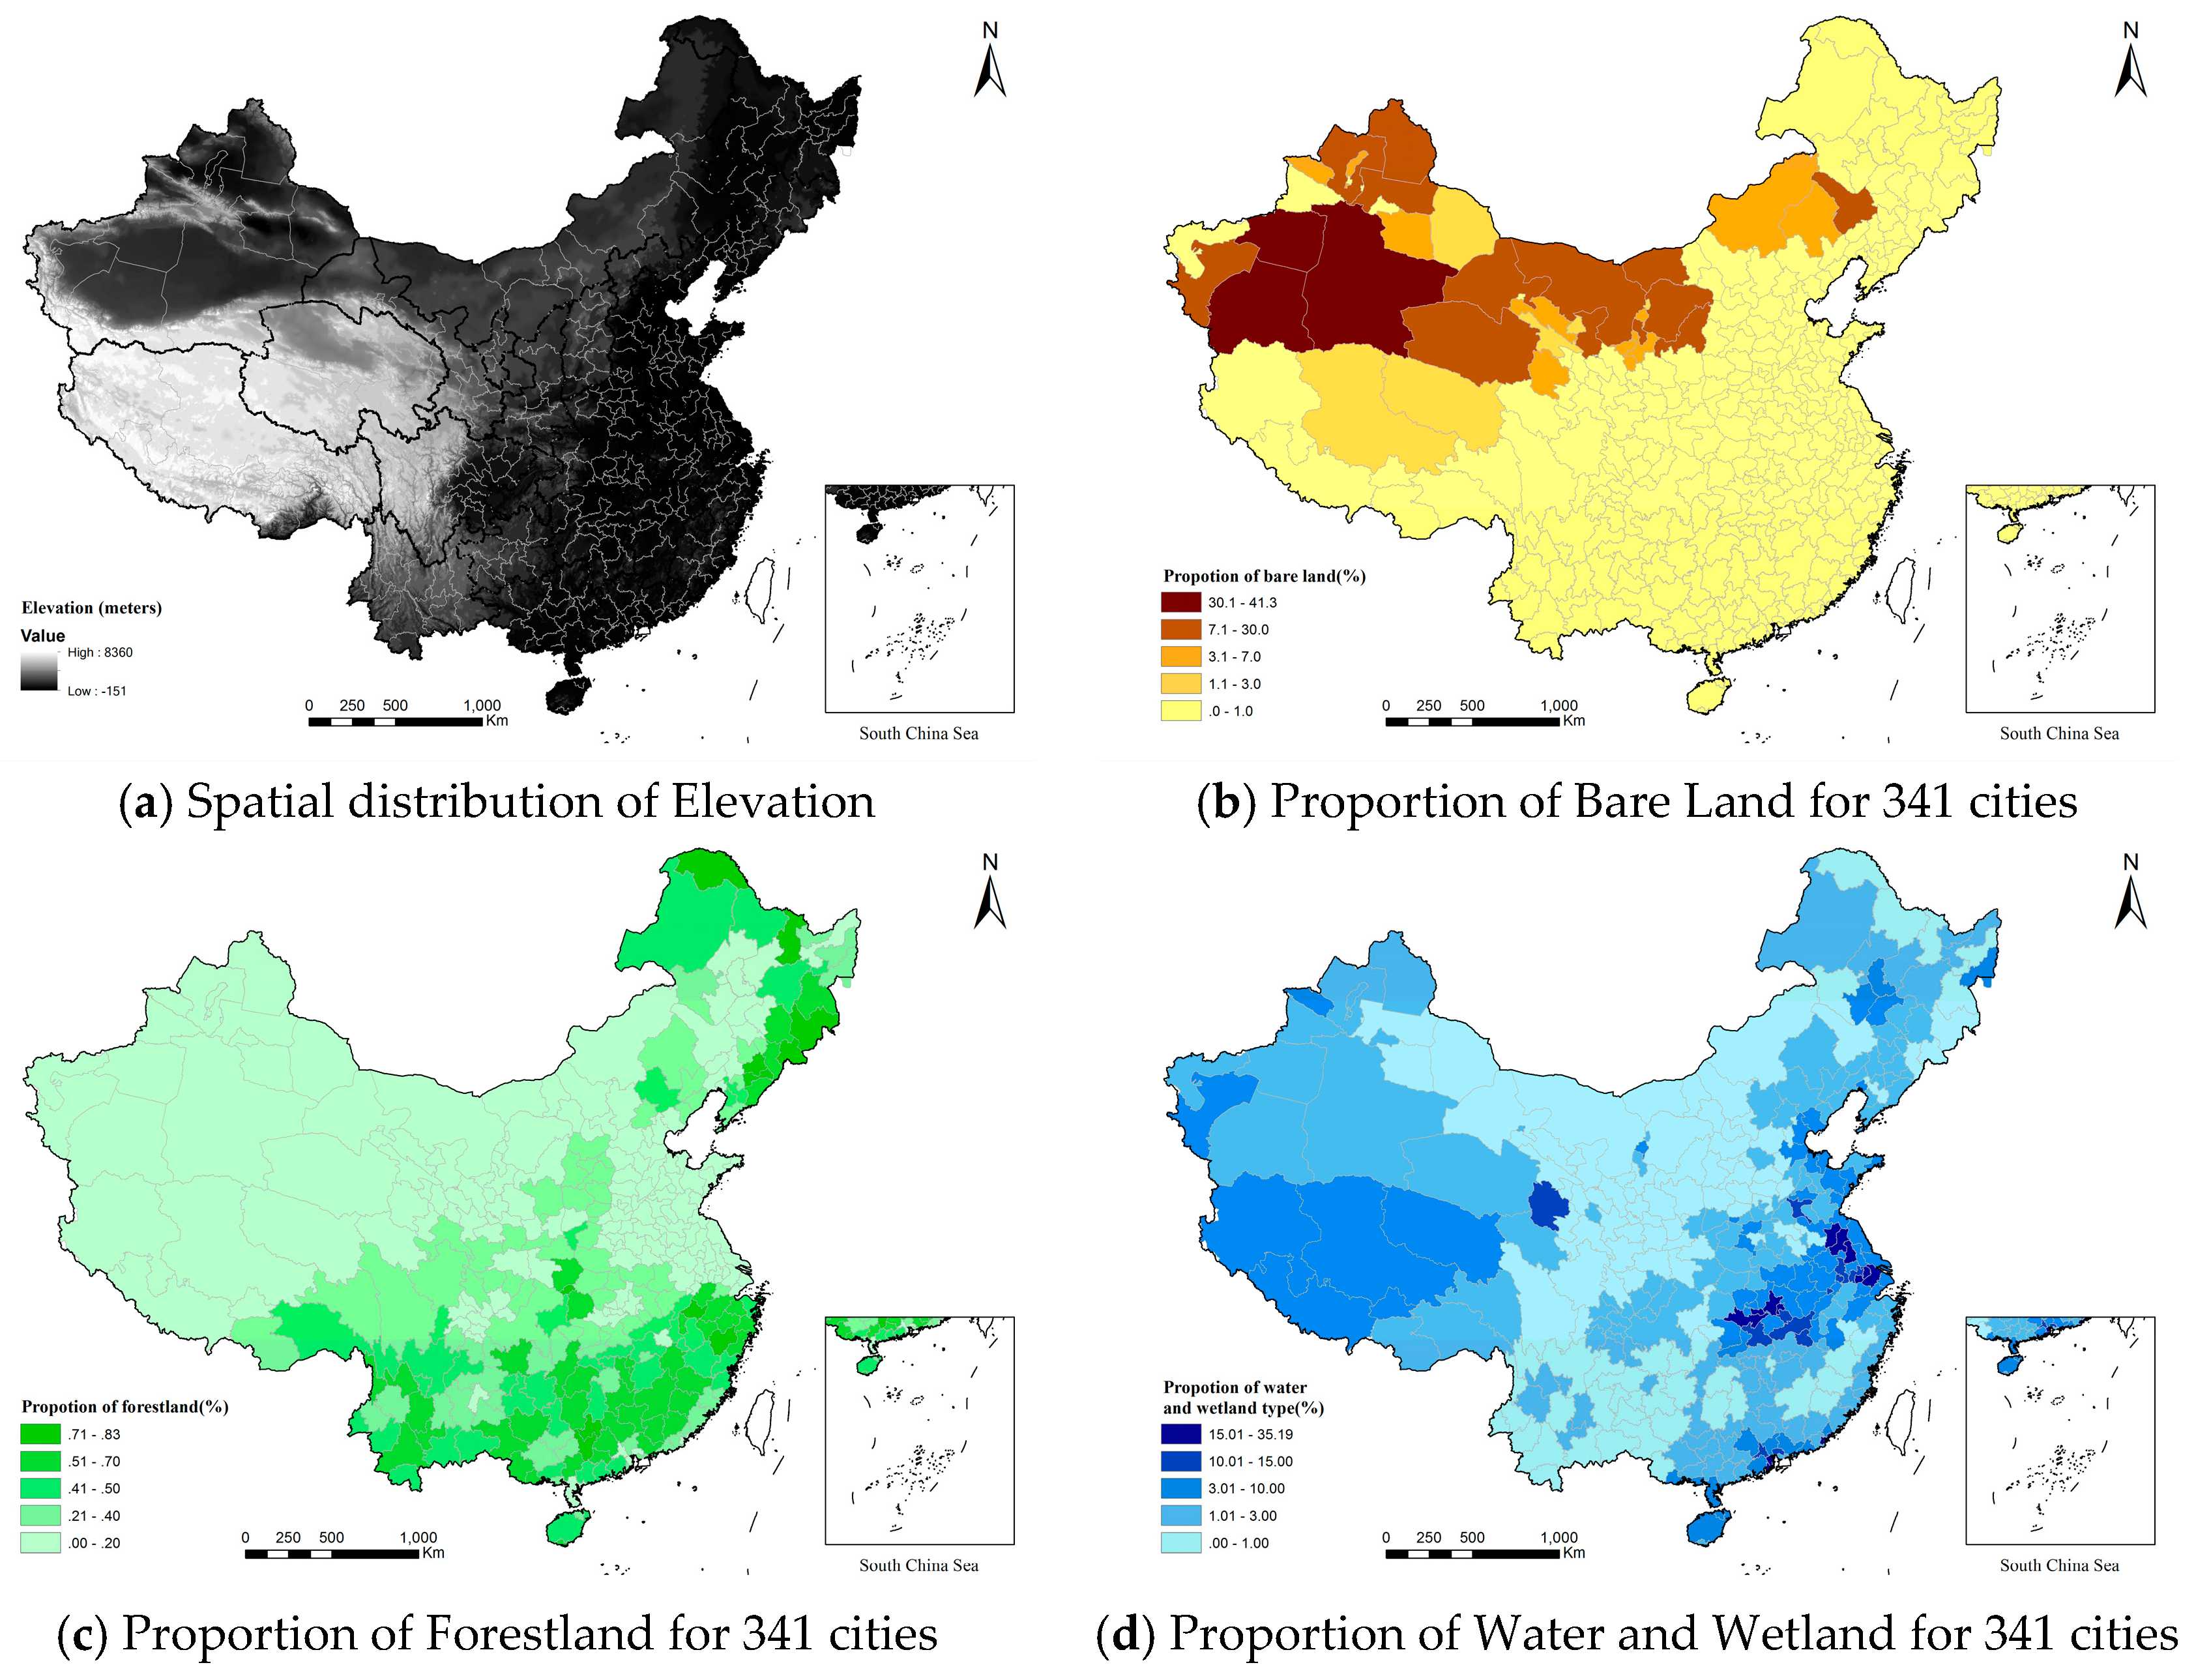
5.2. The Influence of Land Cover Patterns

The accuracy of GDP estimation based on nighttime light data is also influenced by elevation and land coverage. In areas with medium to high elevation, low vegetation coverage, and large exposure, it is easy to overestimate the GDP. On the other hand, in cities with extreme altitudes, high coverage by forest and grassland, or areas over which water is widely distributed, it is easy to underestimate the GDP (Figure 4). Figure 5 represents the spatial distribution of topography and typical land covers in Mainland China.
In western China, specifically the regions of Xinjiang, Qinghai, Ningxia, Gansu, and northern Shaanxi Province, the GDP is severely overestimated based on the NPP/VIIRS data. In these areas, deserts and sandy land (or bare land) generally account for more than 10% of the whole province area, in some cities even more than 40% (Figure 5b). For example, in the Aksu Prefecture (Xinjiang), the Hotan Prefecture (Xinjiang), the Changji hui autonomous prefecture (Xinjiang), the Haixi Mongolian Tibetan Autonomous Prefecture (Qinghai), and the Bayingol Mongolian Autonomous Prefecture (Xinjiang), which each have a desertification ratio of more than 20%, RE values are very high: 557.5%, 421.5%, 189.6%, 119.9%, and 83.3%, respectively. Those parts with low vegetation coverage and high exposure experience large amounts of sunshine during the daytime, making the ground surface heat rapidly, When a nighttime light sensor with high gain scans the area, the good air quality and the strong permeability of the atmosphere will not only produce a spuriously high light intensity from built-up areas, they may also produce a weak pseudo-light background due to the thermal radiation from the extensive hot surface.
In contrast, in the central and western regions of China, such as Ali in the southwestern part of Tibet, the Nagqu prefecture (Tibet), Hunan and Hubei provinces, and some areas in Jilin, Sichuan, and Gansu province, it is easy to seriously underestimate the GDP based on the NPP/VIIRS nighttime light data. These regions, which have high altitudes and low surface temperatures (e.g., the Ali prefecture in Tibet (Figure 5a), with an altitude of 5128 m and an RE value of −157.3%), rich grassland and forest resources, and a high vegetation coverage (e.g., DaXingAnLing in Dongbei Province, with a forest ratio of 70% and RE value of −90.1%) (Figure 5c) or widely distributed water bodies and wetlands (e.g., Shennong jia Forestry District, Pingxiang City in the middle reaches of the Yangtze River), with rich water and wetlands (Figure 5d), the RE values are −227.6% and −70.0%, respectively. In these areas, the landforms and land cover can not only greatly reduce the surface thermal infrared radiation and the pseudo-light background of the nighttime light but also can weaken light spillover effects significantly due to the large presence of vegetation. Therefore, the predicted GDP value in these areas is usually lower than the real GDP.

5.3. The Influence of Regional Industrial Structures

The accuracy of GDP prediction based on nighttime light data is also influenced by economic development and industrial structures. In general, the GDP is usually overestimated in regions that have a low economic level but with a secondary dominant industry, such as cities where the energy industry is highly developed. In cities with a primary dominant industry, it is also easy to underestimate the GDP.
In the north of Xinjiang, as well as in parts of Mongolia, Shanxi, Shaanxi, Ningxia, and Jiangsu provinces (which are called the ‘energy triangle’ [45]), the estimated GDP based on the NPP/VIIRS data and model is higher than the real GDP value. For example, in the Chinese major oil production center, Karamay in northwestern Xinjiang, the RE value is 130.1%. The reasons for this overestimation are (1) a low vegetation coverage and large amounts of exposed surface, which can increase the regional light background; (2) these cities usually include rich oil, natural gas, and coal mineral resources, and mining lights and industrial fires can increase the total regional light and form pseudo-light in the nighttime light image. More importantly, due to special industrial structure with a high proportion of large-scale industries, a GDP regression model based on uniform national-level data may be not suitable for these cities.
In parts of Tibet and Qinghai and the middle reaches of the Yangtze River, the estimated GDP value based on NPP/VIIRS nighttime light data is lower than the actual GDP value. There are several reasons for this. One reason is that the forest and grassland coverage is high and water and wetlands are widely distributed (Figure 5c,d), and these factors can generate a lower background light value. The other reason is that these regions usually focus on primary industries. The share of primary industry is usually more than 15% (e.g., in the traditional animal husbandry area, the Tibetan Autonomous Prefecture of Haibei in Qinghai, the RE value is −76.5%); in some individual cities, it even exceeds 25%, which is significantly higher than the national average. Compared with secondary and tertiary industries, traditional agriculture has no dependence on fossil fuels and energy consumption and cannot form large-scale and high-brightness nighttime light patches. Therefore, the GDP contributions produced by the primary industry cannot be reflected by the remote sensing nighttime light data, which then influences the accuracy of GDP estimation.

6. Conclusions

Based on statistical GDP data for 31 provinces (autonomous regions and municipalities) and 341 cities (prefectures cities, municipality), two remote sensing nighttime light data products (DMSP/OLS and NPP/VIIRS), and three regression models, we have compared the accuracy of GDP estimation and the spatial distribution of the relative residual error value at two spatial scales and finally explored the underlying mechanisms of the suitability of GDP estimation at the city-level scale. This work provides a clearer understanding of the reasonable application of different sources of remote sensing nighttime light data at different spatial scales. The main conclusions are as follows:
(1)
DMSP/OLS nighttime light data can be used in GDP estimation at the provincial scale but may be not suitable at the city level scale. NPP/VIIRS nighttime light data are usually suitable for GDP estimation at both the provincial scale and the city-level scale.
(2)
For GDP estimation at the provincial scale, the results based on different models display no apparent differences. However, at the city level scale, the accuracy of GDP estimation using the exponential model and the polynomial model is better than the accuracy of GDP estimation using the linear regression model.
(3)
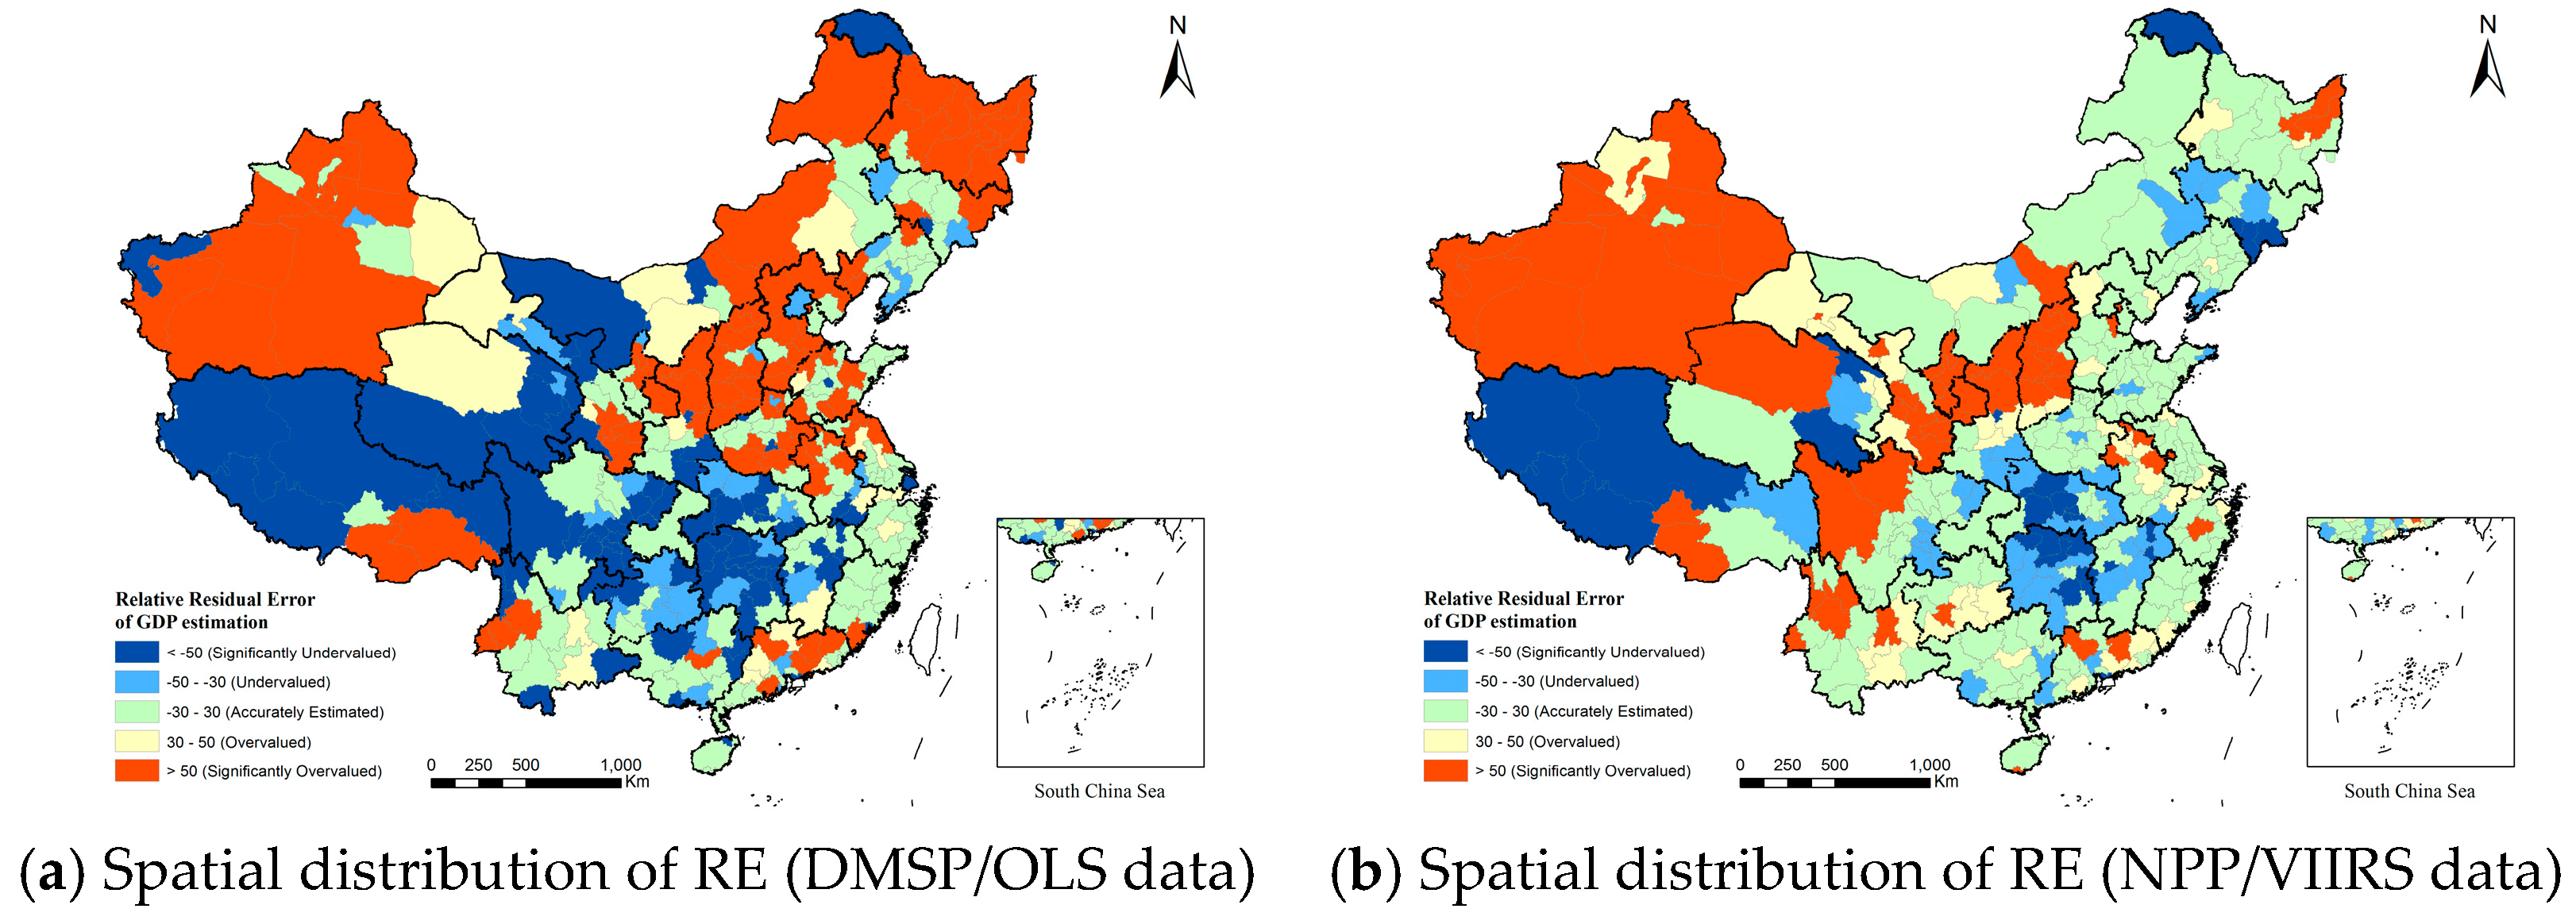
The RE values of GDP estimation in each city, based on the DMSP/OLS data, display no obvious spatial distribution pattern, but the spatial distribution of RE displays a regular pattern in each city based on the NPP/VIIRS data. Specifically, the absolute value of RE for GDP estimation gradually declines from the west to the east, which implies that it is more suitable for GDP estimation to use the NPP/VIIRS nighttime light data in the eastern part of Mainland China. However, the unified national model for GDP prediction based on the NPP/VIIRS data is usually not suitable for most of western China.
(4)
The GDP estimation accuracy is influenced by the spatial and radiation resolution of the nighttime light data, as well as the spatial scale, the characteristics of the terrain and landforms, the landscape, and the industrial structure of the study area. Generally, higher spatial and radiation resolutions of the nighttime light data result in better accuracy in GDP estimation. The cities with moderate to high elevations, low vegetation coverage, and large amounts of exposure surfaces often have their GDP overestimated; the cities with extremely high elevation, high vegetation coverage, or large amounts of water are prone to GDP underestimation. The cities with low economic development or with large amounts of secondary industry (especially the energy industry) are also characterized by overestimation, but in the regions where the economy mainly relies on primary industries, the GDP is usually underestimated.
Therefore, without consideration of the spatial and radiation resolution of nighttime light data, the spatial scale, the natural environment, and industrial structure of the study area, when the regional GDP is directly estimated with inappropriate nighttime light data or when the GDP for different cities is estimated with the same national-level model, then the predicted GDP will be significantly overvalued or undervalued, especially in some cities in the western and middle parts of Mainland China. In future studies on the economic and social factors combined with nighttime light data, we will recognize the potential applications of the NPP/VIIRS data and build suitable regression models accounting for economic and social factors at the county scale (smaller than the city level). This work should improve the accuracy of GDP estimation based on nighttime light data for various spatial scales and regions.

Acknowledgments

This work was supported by the National Key Research and Development Plan Program of China, “Multi spatial-temporal scale monitoring and modelling based on global remote sensing (2016YFB0501502)”; “Methods, indices and assessments of the global ecological management technologies (2016YFC0503701)”; the National Science and Technology Major Project of China, “Monitoring and assessment in national main-functional regions by using High Resolution Remote Sensing (00-Y30B14-9001-14/16)”.

Author Contributions

In particular, Yunfeng Hu and Zhaoxin Dai conceived and designed the methodology, and Zhaoxin Dai mainly analyzed the data; Guanhua Zhao aided in the data analysis; Zhaoxin Dai drafted the manuscript, which was revised by Yunfeng Hu. All authors have read and approved the final manuscript.

Conflicts of Interest

The authors declare no conflict of interest.

References

  1. Xu, K.N.; Chen, F.L.; Liu, X.Y. The truth of China Economic Growth: Evidence from Global Night-time Light Data. Econ. Res. J. 2015, 9, 17–29. (In Chinese) [Google Scholar]
  2. Yue, W.Z.; Gao, J.B.; Yang, X.C. Estimation of Gross Domestic Product Using Multi-Sensor Remote Sensing Data: A case study in Zhejiang Province, East China. Remote Sens. 2014, 6, 7260–7275. [Google Scholar]
  3. Hu, Y.F.; Wang, Q.Q.; Liu, Y.; Li, J.; Ren, W.B. Index System and Transferring Methods to build the National Society and Economy Grid Database. Geo-Inf. Sci. 2011, 13, 573–578. (In Chinese) [Google Scholar] [CrossRef]
  4. Mao, W.H.; Hu, D.Y.; Cao, R.; Deng, L. Monitoring urban expansion of Zhejiang Province using MODIS/EVI data products and DMSP/OLS nighttime light data. Geogr. Res. 2013, 32, 1325–1335. (In Chinese) [Google Scholar]
  5. Chen, X.; Nordhaus, W.D. Using Luminosity Data as a Proxy for Economic Statistics. Proc. Natl. Acad. Sci. USA 2011, 108, 8589–8594. [Google Scholar] [CrossRef] [PubMed]
  6. He, C.Y.; Li, J.G.; Chen, J.; Shi, P.J.; Pan, Y.Z.; Li, J.; Ichinose, T. The urbanization model and process in Bohai Sea surrounding area in the 1990s by using DMSP/OLS data. Acta Geogr. Sin. 2005, 60, 409–417. [Google Scholar]
  7. Li, D.R.; Li, X. An overview on data mining of nighttime light remote sensing. Acta Geod. Cartogr. Sin. 2015, 44, 591–601. (In Chinese) [Google Scholar]
  8. Wu, J.S.; Liu, H.; Peng, J.; Ma, L. Hierarchical structure and spatial pattern of China’s urban system: Evidence from DMSP/OLS nightlight data. Acta Geogr. Sin. 2014, 69, 759–770. [Google Scholar]
  9. Zhuo, L.; Li, Q.; Shi, P.J.; Chen, J.; Zheng, J.; Li, X. Identification and characteristics analysis of urban land expansion types in China in the 1990s using DMSP/OLS data. Acta Geogr. Sin. 2016, 61, 169–178. [Google Scholar]
  10. Zhuo, L.; Chen, J.; Shi, P.J.; Gu, Z.H.; Fan, Y.D.; Ichinose, T. Modeling population density of China in 1998 based on DMSP/OLS nighttime light image. Acta Geogr. Sin. 2005, 60, 266–276. [Google Scholar]
  11. Yang, X.C.; Yue, W.Z.; Gao, D.W. Spatial improvement of Human Population Distribution Based on Multi-Sensor Remote-sensing Data: An Input for Exposure Assessment. Int. J. Remote Sens. 2013, 34, 5569–5583. [Google Scholar] [CrossRef]
  12. Forbes, D.J. Multi-scale Analysis of the Relationship between Economic Statistics and DMSP/OLS Night Light Images. GISci. Remote Sens. 2013, 50, 483–499. [Google Scholar]
  13. Elvidge, C.D.; Baugh, K.E.; Kihn, E.A.; Kroehl, H.W.; Davis, E.R.; Davis, C.W. Relation between satellite observed visible near infrared emissions, population, economic activity and electric power consumption. Int. J. Remote Sens. 1997, 18, 1373–1379. [Google Scholar] [CrossRef]
  14. Ghost, T.; Powell, R.; Elvidge, C.D.; Baugh, K.E.; Sutton, P.C.; Anderson, S. Shedding light on the global distribution of economic activity. Open Geogr. J. 2010, 3, 148–161. [Google Scholar]
  15. He, C.Y.; Ma, Q.; Liu, Z.F.; Zhang, X.F. Modeling the Spatiotemporal Dynamics of Electric Power Consumption in Mainland China Using Saturation-corrected DMSP/OLS Nighttime Stable Light Data. Int. J. Digit. Earth 2014, 7, 993–1014. [Google Scholar] [CrossRef]
  16. Han, X.D.; Zhou, Y.; Wang, S.X.; Liu, R.; Yao, Y. GDP spatialization in China based on nighttime imagery. J. Geo-Inf. Sci. 2012, 14, 128–136. (In Chinese) [Google Scholar] [CrossRef]
  17. Doll, C.N.H.; Muller, J.P.; Morley, J.G. Mapping regional economic activity from night-time light satellite imagery. Ecol. Econ. 2006, 57, 75–92. [Google Scholar] [CrossRef]
  18. Han, X.D.; Zhou, Y.; Wang, S.X.; Liu, R.; Yao, Y. GDP spatialization in China based on DMSP/OLS data and land use data. Remote Sens. Technol. Appl. 2012, 27, 396–405. (In Chinese) [Google Scholar]
  19. Zhang, Q.L.; Steo, K.C. Mapping urbanization dynamics at regional and global scales using multi-temporal DMSP/OLS nighttime light data. Remote Sens. Environ. 2011, 115, 2320–2329. [Google Scholar] [CrossRef]
  20. Ma, T.; Zhou, C.H.; Pei, T. Quantitative estimation of urbanization dynamics using time series of DMSP/OLS nighttime light data: A comparative case study from China’s cities. Remote Sens. Environ. 2012, 124, 99–107. [Google Scholar]
  21. Li, X.; Xu, H.M.; Chen, X.L.; Li, C. Potential of NPP-VIIRS Nighttime Light Imagery for Modeling the Regional Economy of China. Remote Sens. 2013, 5, 3057–3081. [Google Scholar] [CrossRef]
  22. Liang, Y.J.; Xu, Z.M. Modeling the Spatial distribution of GDP based on night light radiation: A case study in Ganzhou district, Zhangye Municipality. J. Glaciol. Geocrol. 2013, 35, 249–254. [Google Scholar]
  23. Tian, Y.Z.; Yue, T.X.; Zhu, L.F.; Clinton, N. Modeling population density using land cover data. Ecol. Model. 2005, 189, 72–88. [Google Scholar] [CrossRef]
  24. Zandbergen, P.A.; Ignizio, D.A. Comparison of dasymetric mapping techniques for small-area population estimates. Cartogr. Geogr. Inf. Sci. 2010, 37, 199–214. [Google Scholar] [CrossRef]
  25. Wu, J.S.; Wang, Z.; Li, W.F. Exploring factors affecting the relationship between light consumption and GDP based on DMSP/OLS nighttime satellite imagery. Remote Sens. Environ. 2013, 134, 111–119. [Google Scholar] [CrossRef]
  26. Lo, C.P. Modeling the population of China using DMSP operational linescan system nighttime data. Remote Sens. 2001, 67, 1037–1047. [Google Scholar]
  27. Huang, H.Q.; Wang, Y.L.; Hu, B.Q.; Li, L. Study of spatialization of population census data based on Neural Network and GIS-Taking Guangxi Du’an county as an example. Geomat. Spat. Inf. Technol. 2009, 32, 46–49. (In Chinese) [Google Scholar]
  28. Chai, Z.W.; Wang, S.L.; Qiao, J.G. Township GDP estimation of the Pearl Delta based on the NPP-VIIRS night-time satellite data. Trop. Geogr. 2015, 35, 379–385. (In Chinese) [Google Scholar]
  29. Henderson, J.V.; Storeygard, A.; Weil, D.N. Measuring Economic Growth from Outer Space. Am. Econ. Rev. 2012, 102, 994–1028. [Google Scholar] [CrossRef] [PubMed]
  30. Shi, K.F.; Yu, B.L.; Huang, Y.X.; Hu, Y.J.; Yin, B.; Chen, Z.Q.; Chen, L.J.; Wu, J.P. Evaluating the ability of NPP-VIIRS nighttime light data to estimate the gross domestic product and the electric power consumption of China at multiple scales: A comparison with DMSP-OLS data. Remote Sens. 2014, 6, 1705–1724. [Google Scholar] [CrossRef]
  31. Ou, J.O.; Liu, X.P.; Li, X.; Li, M.F.; Li, W.K. Evaluation of NPP-VIIRS Nighttime Light Data for mapping global fossil fuel combustion CO2 emissions: A comparison with DMSP-OLS Nighttime Light Data. PLoS ONE 2015. [Google Scholar] [CrossRef] [PubMed]
  32. Kramer, H.J. Observation of the Earth and Its Environment: Survey of Missions and Sensors, 2nd ed.; Springer-Verlag: Berlin, Germany, 1994. [Google Scholar]
  33. Wu, J.S.; Niu, Y.; Peng, J.; Wang, Z.; Huang, X.L. Research on energy consumption dynamic among prefecture level cities in China based on DMSP/OLS Nighttime Light. Geogr. Res. 2014, 33, 625–634. (In Chinese) [Google Scholar]
  34. Su, Y.X.; Chen, X.Z.; Ye, Y.Y.; Wu, Q.; Zhang, H.O.; Huang, N.S.; Kuang, Y.Q. The characteristics and mechanisms of carbon emissions from energy consumption in China using DMSP/OLS night light imageries. Acta Geogr. Sin. 2013, 68, 1513–1526. [Google Scholar]
  35. Elvidge, C.D.; Ziskin, D.; Baugh, K.E.; Tuttle, B.T.; Ghosh, T.; Pack, D.W.; Erwin, E.H.; Zhizhin, M. A fifteen year record of global natural gas flaring derived from satellite data. Energies 2009, 2, 595–622. [Google Scholar] [CrossRef]
  36. Baugh, K.; Elvidge, C.D.; Ghosh, T.; Ziskin, D. Development of a 2009 stable lights product using DMSP-OLS data. Proc. Asia Pac. Adv. Net. 2010, 30, 114–130. [Google Scholar] [CrossRef]
  37. Gao, Y.; Wang, H.; Wang, P.T.; Sun, X.Y.; Lv, T.T. Population spatial processing for Chinese Coastal Zones based on census and multiple night light data. Resour. Sci. 2013, 35, 2517–2523. (In Chinese) [Google Scholar]
  38. Li, T.; He, C.Y.; Yang, Y.; Liu, Z.F. Understanding electricity consumption changes in Chinese mainland from 1995 to 2008 by using DMSP/OLS stable nighttime light time series data. Acta Geogr. Sin. 2011, 66, 1403–1412. [Google Scholar]
  39. Baugh, K.; Hsu, F.-C.; Elvidge, C.D.; Zhizhin, M. Nighttime lights compositing using the VIIRS day-night band: Preliminary results. Proc. Asia Pac. Adv. Net. 2013, 35, 70–86. [Google Scholar] [CrossRef]
  40. National Bureau of Statistics. China Statistical Yearbook; China Statistical Publishing House: Beijing, China, 2014.
  41. National Bureau of Statistics. China City Statistical Yearbook; China Statistical Publishing House: Beijing, China, 2014.
  42. Letu, H.; Hara, M.; Yagi, H.; Naoki, K.; Tana, G.; Nishio, F.; Shuhei, O. Estimating energy consumption from night-time DMPS/OLS imagery after correcting for saturation effects. Remote Sens. 2010, 31, 4443–4458. [Google Scholar] [CrossRef]
  43. Aldhous, P. Energy: China’s burning ambition. Nature 2005, 435, 1152–1154. [Google Scholar] [CrossRef] [PubMed]
  44. Christopher, C.M.K.; Stefanie, G.; Helga, K.; Alejandro, S.M.; Jaime, Z.; Jürgen, F.; Franz, H. High-Resolution Imagery of Earth at Night: New Sources, Opportunities and Challenges. Remote Sens. 2015, 7, 1–23. [Google Scholar]
  45. Liu, Y.X.; Wu, W.H.; Wen, X.J.; Zhang, D.H. Urban process and its eco-environmental impact in Shanxi-Shaanxi-Inner Mongolia energy area. Geogr. Res. 2013, 32, 2009–2020. (In Chinese) [Google Scholar]
Figure 1. The 31 provinces and 341 city level regions in Mainland China for analysis in this study. The map also contains the North China Plain, Yangtze River Delta, and Pearl River Delta.
Sustainability 09 00305 g001
Figure 2. The nighttime light data of Mainland China. The map also contains the North China Plain, Yangtze River Delta, and Pearl River Delta. (a) DMSP/OLS data in 2013; (b) NPP/VIIRS data in 2014.
Sustainability 09 00305 g002
Figure 3. The scatter diagram of regression variables in provincial regions and in city regions: (a) DMSP/OLS data in 2013 versus GDP data in 2014 at the provincial scale; (b) NPP/VIIRS data in 2014 versus GDP data in 2014 at the provincial scale; (c) DMSP/OLS data in 2013 versus GDP data in 2014 at the city level scale; (d) NPP/VIIRS data in 2014 versus GDP data in 2014 at the provincial scale. The black color line means the TNL-GDP relationship using linear regression model, the blue color line means the TNL-GDP relationship using polynomial model, the red color line means the TNL-GDP relationship using power function model. The red triangle frame in the picture means the marking of economic developed region.
Sustainability 09 00305 g003
Figure 4. Relative Error (RE) values based on different sources of nighttime light data at the city level scale using the power function model; (a) based on the DMSP/OLS data and (b) based on the NPP/VIIRS data.
Sustainability 09 00305 g004
Figure 5. The spatial distribution of topography and typical land covers in Mainland China: (a) Altitude; (b) Landscape of Bare Land; (c) Landscape of Forestry; (d) Landscape of Water and Wetland.
Sustainability 09 00305 g005
Table 1. GDP fitting precision values based on different nighttime light data sources in the provincial scale and the city level scale.
Data Simulation ModelProvincial ScaleCity Level Scale
RRE (%)RRMSERRE (%)RRMSE
DMSP-OLSLinear Regression Model0.870.16166.50.80−0.002404.1
Power Function Model0.87−0.06854.90.82−0.211187.2
Polynomial Model0.870.01276.40.84−0.108180.8
NPP-VIIRSLinear Regression Model0.93−0.000650.20.93−0.01767.6
Power Function Model0.93−0.02040.90.90−0.12165.4
Polynomial Model0.93−0.22652.50.930.00466.2
Table 2. The summary of RE values in 341 cities based on different nighttime light products and models.
DataModelSignificantly Overvalued (RE ≥ 50%)Overvalued (30% ≤ RE < 50%)Estimated Accurately (−30% < RE < 30%)Undervalued (−50% < RE ≤ −30%)Significantly Undervalued (RE ≤ −50%)
QuantityRatioQuantityRatioQuantityRatioQuantityRatioQuantityRatio
DMSP-OLSLinear Regression Model8825.8216.210731.43911.48625.2
Power-Function Model8524.9267.611232.8329.48625.2
Polynomial Model8725.54212.312135.55014.74112.0
NPP-VIIRSLinear Regression Model5716.74412.917250.54212.3267.6
Power-Function Model5716.74513.217150.14212.3267.6
Polynomial Model5516.14412.916548.44312.63410.0

