Article

Feasibility Study of the Post-2020 Commitment to the Power Generation Sector in South Korea

1
Decommissioning Engineering Team, Decommissioning & Spent Fuel Technology Center, KHNP Central Research Institute, 70, 1312-gil, Yuseong-daero, Yuseong-gu, Daejeon 34101, Korea
2
Department of Industrial and Information Engineering, Yonsei University, 50, Yonsei-ro, Seodaemun-gu, Seoul 03722, Korea
*
Author to whom correspondence should be addressed.
Sustainability 2017, 9(2), 307; https://doi.org/10.3390/su9020307
Submission received: 6 December 2016 / Revised: 14 February 2017 / Accepted: 15 February 2017 / Published: 20 February 2017
(This article belongs to the Special Issue Sustainability and Nuclear Power)

Abstract

:
We analyze the economic effects of greenhouse gases (GHG) reduction measures of the generation sector of South Korea to accomplish the 2030 GHG reduction target using a scenario-based approach. We estimate the GHG emission of the South Korean power industry in 2030 based on both the 7th Electricity Supply and Demand Plan and the GHG emission coefficients issued by the International Atomic Energy Agency (IAEA). We establish four scenarios for reduction measures by replacing the coal-fired power plants with nuclear power, renewable energy and carbon capture and storage, and liquefied natural gas (LNG) combined cycle generation. Finally, the nuclear power scenario demonstrates the most positive measure in terms of GHG reduction and economic effects.

1. Introduction

According to the IPCC (Intergovernmental Panel on Climate Change) Report Volume 5, greenhouse gases (GHG) from human activities had increased the average global temperature by 0.85 °C from 1880 to 2012. Furthermore, GHG emissions will raise the global temperature by 3.7 °C at the end of the century without abatement measures. Assuming Business As Usual (BAU) is kept as the projection, the official target from the 16th Conference of the Parties, which is to restrain the increase of the average global temperature by 2 °C until 2050, seems highly impossible in reality, recommending international involvement with aggressive GHG reduction policies.
The previous international attempts of GHG reduction had a serious limitation in terms of its effectiveness because China and the United States, the first and second largest GHG emitters, did not participate in GHG reduction activities from the promises of the Kyoto Protocol [1]. However, the Post-2020 Climate Change Mitigation Commitments require submissions of Intended National Determined Contributions (INDC), including China and the United States, unlike Kyoto Protocol. On 30 July 2015, South Korea announced its INDC as 37% of the reduction from the BAU in 2030. Recently, the Act on Allocation and Trading of Greenhouse Gas Emissions Allowances was passed in Korea’s National Assembly and, by 2015, the Greenhouse Gas Emission Trading Scheme will be implemented.
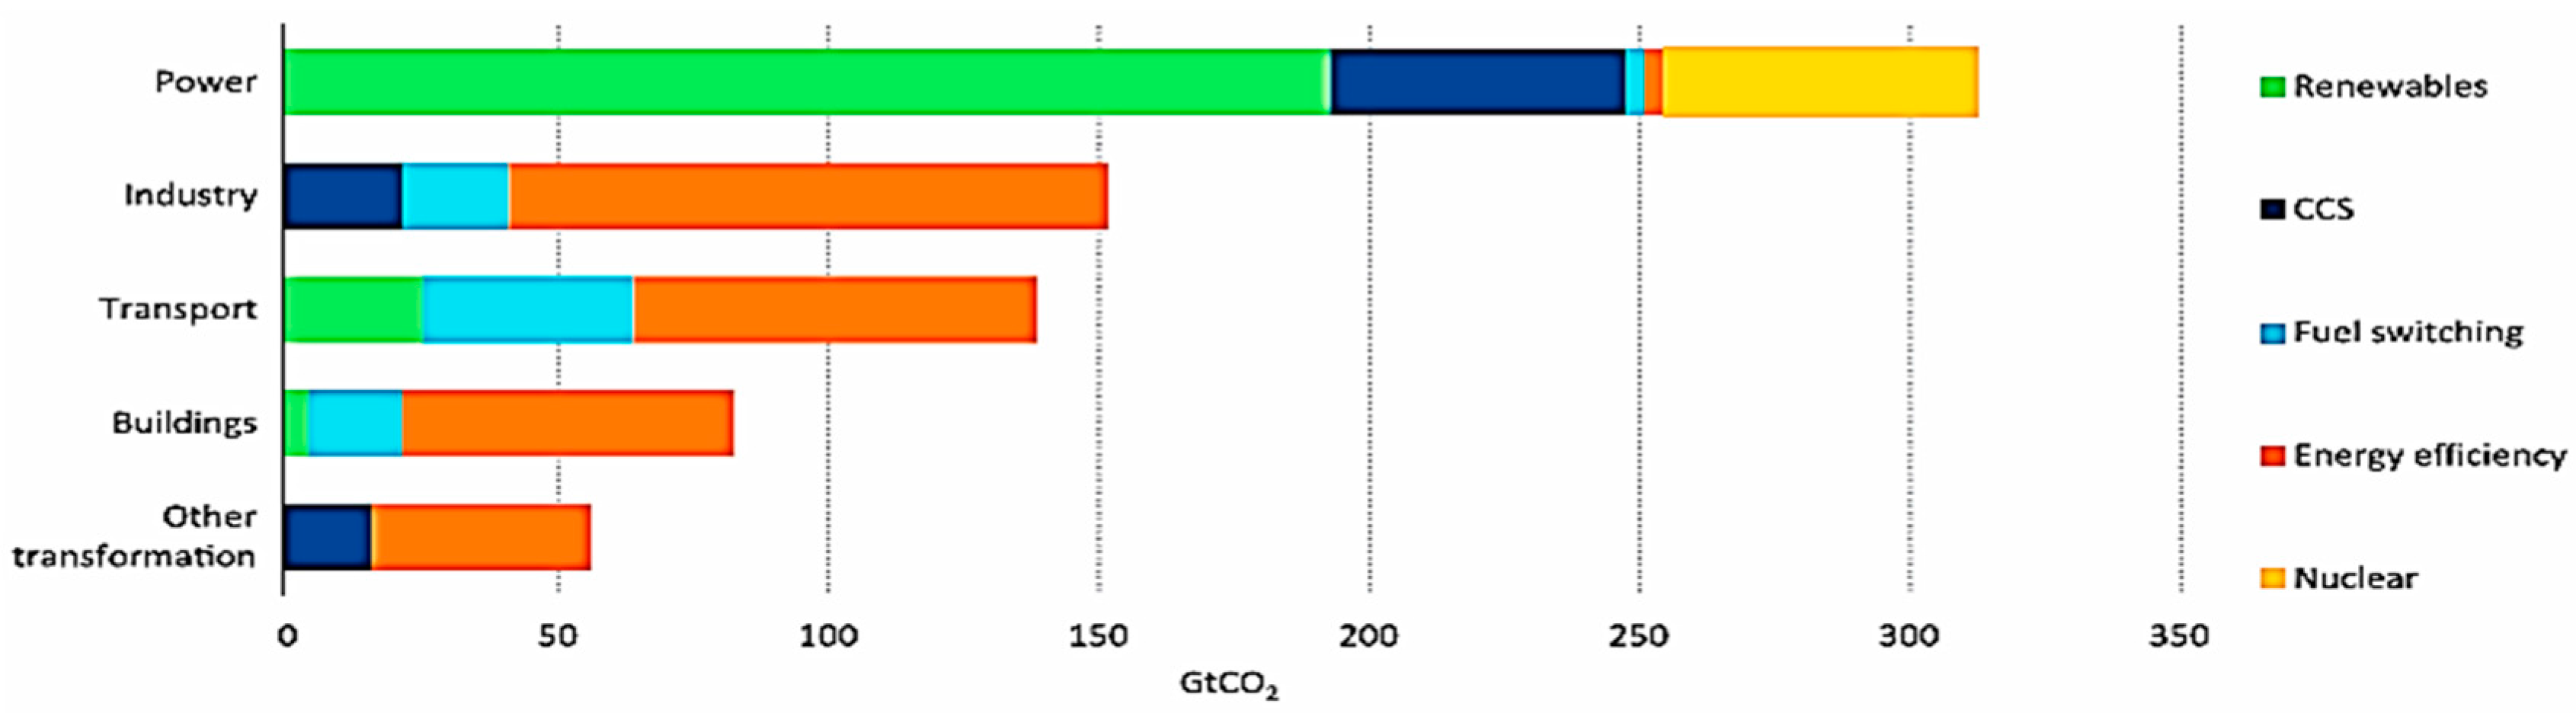
The INDC of South Korea states a 25.7% reduction in domestic emissions and an 11.3% purchase from the international carbon market mechanism from the BAU for the year 2030 in order to accomplish the total of 37% in 2030. This means any industry sector, emitting large amounts of GHG, will anticipate a more intensive reduction quota. In 2011, the GHG emission of the generation sector in South Korea was estimated as 251.5 million tons which accounted for 36.7% of the national emission amount of 685.7 million tons. In addition, the major government-owned thermal power generators emitted 30.2% (206.8 million tons) in the generation sector, suggesting an intensive GHG reduction quota in the generation sector is inevitable to achieve the 2030 national reduction target. The International Energy Agency (IEA) considers de-carbonization in power generation as the most important measure for achieving the GHG reduction target of the year 2050, as followed by reduction in sectors of industry, transport, and construction in the order of significance [2]. In addition, the IEA considers renewable energy, carbon capture and storage (CCS), nuclear power, energy efficiency, and fuel switching as the major technologies for GHG reduction in the generation sector (Figure 1).
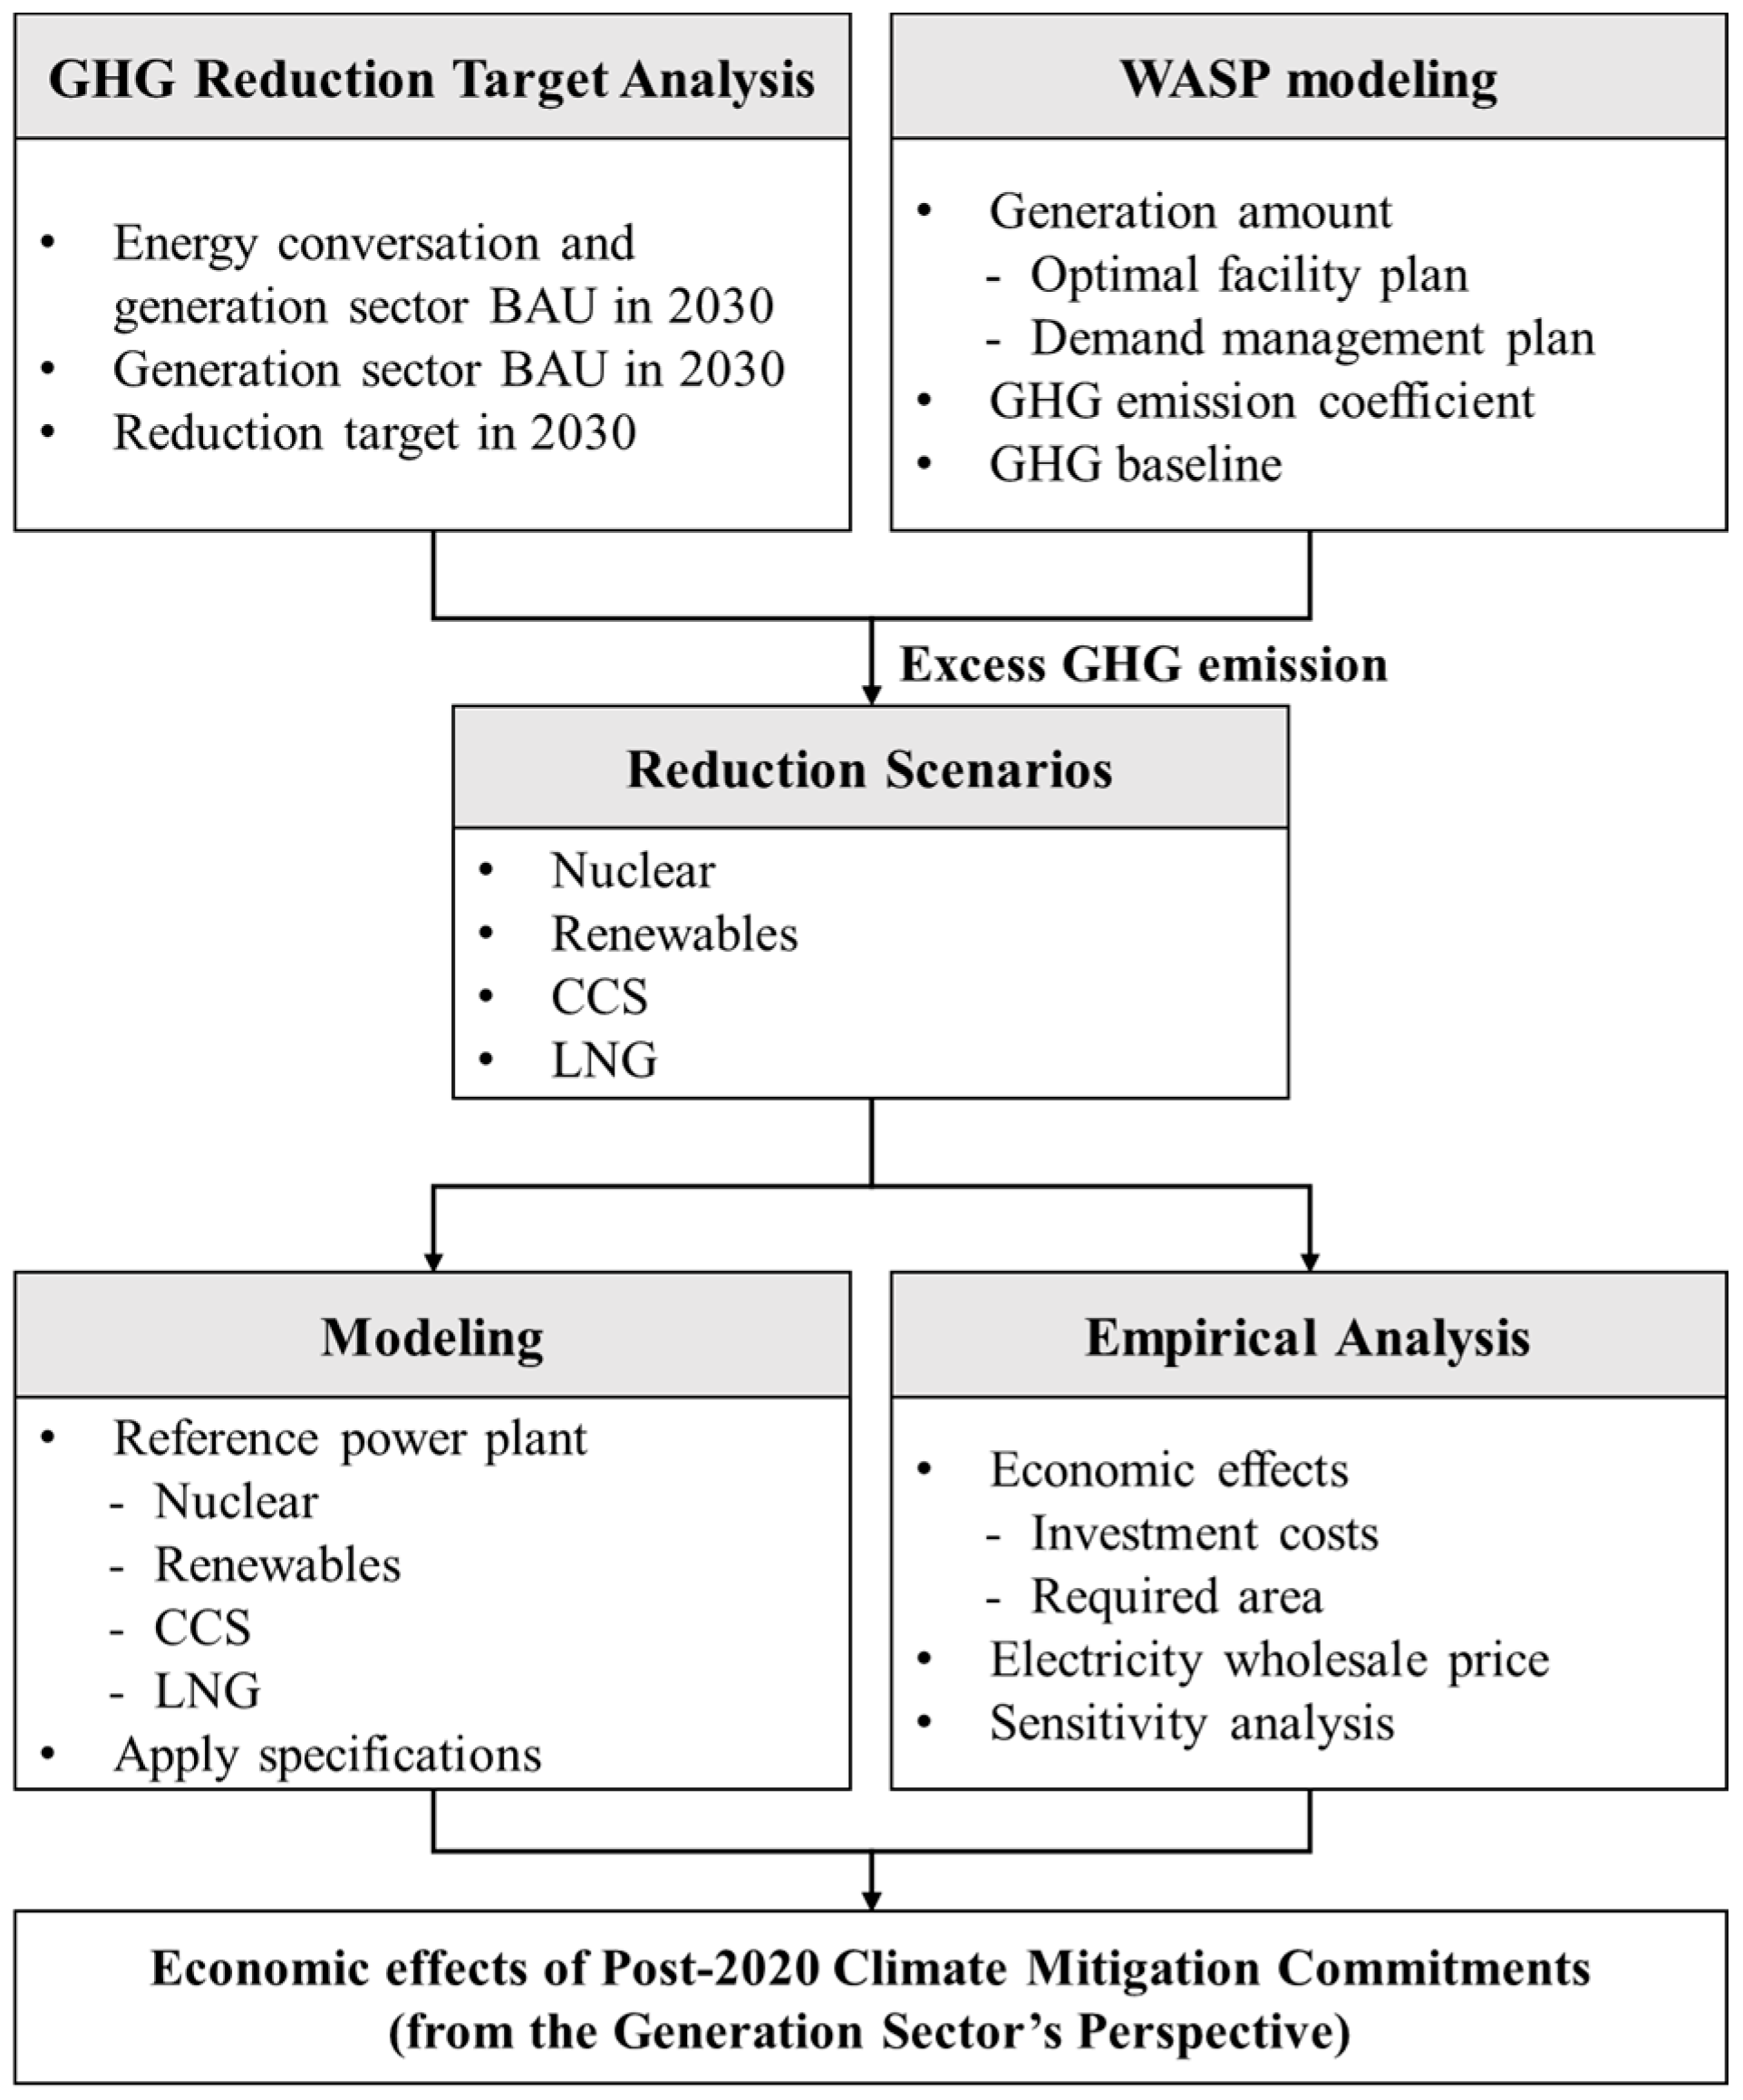
In order to analyze the economic effects of the Post-2020 Climate Change Mitigation Commitments from the generation sector’s perspective, we conduct modeling and empirical analysis in our study. As shown in Figure 2, we first aim to calculate the excess GHG emission amount that must be reduced to achieve the national reduction target of year 2030. In order to do that, we analyze the INDC of South Korea and the reference documents and find the required GHG reduction target of the generation sector in 2030. Then, we used the Wien Systematic System Planning (WASP) model (Wien Systematic System Planning (WASP) model: the IAEA’s comprehensive planning tool that permits finding the optimal facility expansion plan for a power generating system over a period of thirty years by evaluating the optimum in terms of minimum discounted total costs) to find the optimal generation for the year 2030, which can also be applied to determine the projected GHG emission volume of the generation sector in 2030.
Consequently, we calculate the excess GHG emission amount by comparing the GHG reduction target of the generation sector in 2030 with our projected GHG emission of the generation sector in 2030 derived from the WASP model. By applying the standard emission coefficient of GHG to the calculated excess GHG emission volume, we are able to determine the generation amount of the coal-fired plant that must be replaced in order to achieve the national GHG emission reduction target of the generation sector in 2030.
Therefore, we set up four scenarios, including nuclear, renewable energy, and CCS, to replace the coal-fired plant, as shown in Figure 2. We used modeling by applying specifications for the reference power plant for each scenario to calculate the equivalence of the generation amount from the coal-fired plant, which satisfies the GHG reduction target of 2030. Then, we calculate the economic effects and impacts on the wholesale electricity price of each scenario to attain comparative analysis results.
We calculate the required GHG reduction quantities based on the 7th Electricity Supply and Demand Plan to achieve the national target of the INDC and provide the quantitative economic effects from the GHG reduction using the scenario analysis approach.

2. Previous Research

According to the study on the roadmap policy and alternatives for the South Korean GHG reduction by Lee et al. [3], they demonstrate the reduction measures for the energy conversion and generation sector, which is composed of generation, city gas, and district heating sectors, will cause the most negative impacts on the South Korean macro economy. The impacts are estimated as a 4.96% decrease in the real output, a 5.05% decrease in the real gross domestic product (GDP), and a 4.96% decrease in employment relative to BAU in 2020. They also claim minimizing negative impacts on the macro economy is particularly important as the technologies, such as innovation in renewables, improvement in generation efficiency, and GHG management technology, are expected to be implemented as the reduction measures. Lee et al. [3] also examines the reduction measures in the energy conversion and generation sector and suggests demand management policy enhancement, renewable energy increase, intelligent demand management expansion, and leading technology development for alternatives. Among these solutions, KEI regards renewable energy increases and leading technology development as the major alternatives, along with demand management (Table 1).
In addition, the Dong-Woon Noh [4] also emphasizes GHG reduction in the generation sector in order to achieve national GHG reductions and sustain economic growth. According to Dong-Woon Noh [4], GHG reduction in the generation sector is not only cost-effective, but also coincides with the national policy that is currently being implemented as a response to climate change. In terms of reduction measures, Dong-Woon Noh [4] also suggest enforcing the Renewable Energy Portfolio Standard (RPS) and the rationalization of an energy price structure which would deliver the impact of increased costs from GHG reduction measures to the consumers of electricity. Although a carbon tax may be appealing as a GHG emission restraint, it is not encouraged by Dong-Woon Noh [4] since it would significantly increase the financial burden to the industry. Therefore, technology development for low-carbon generation is fundamentally needed in order to reduce GHG emission by replacing the current coal-fired plants with stronger governmental supports.
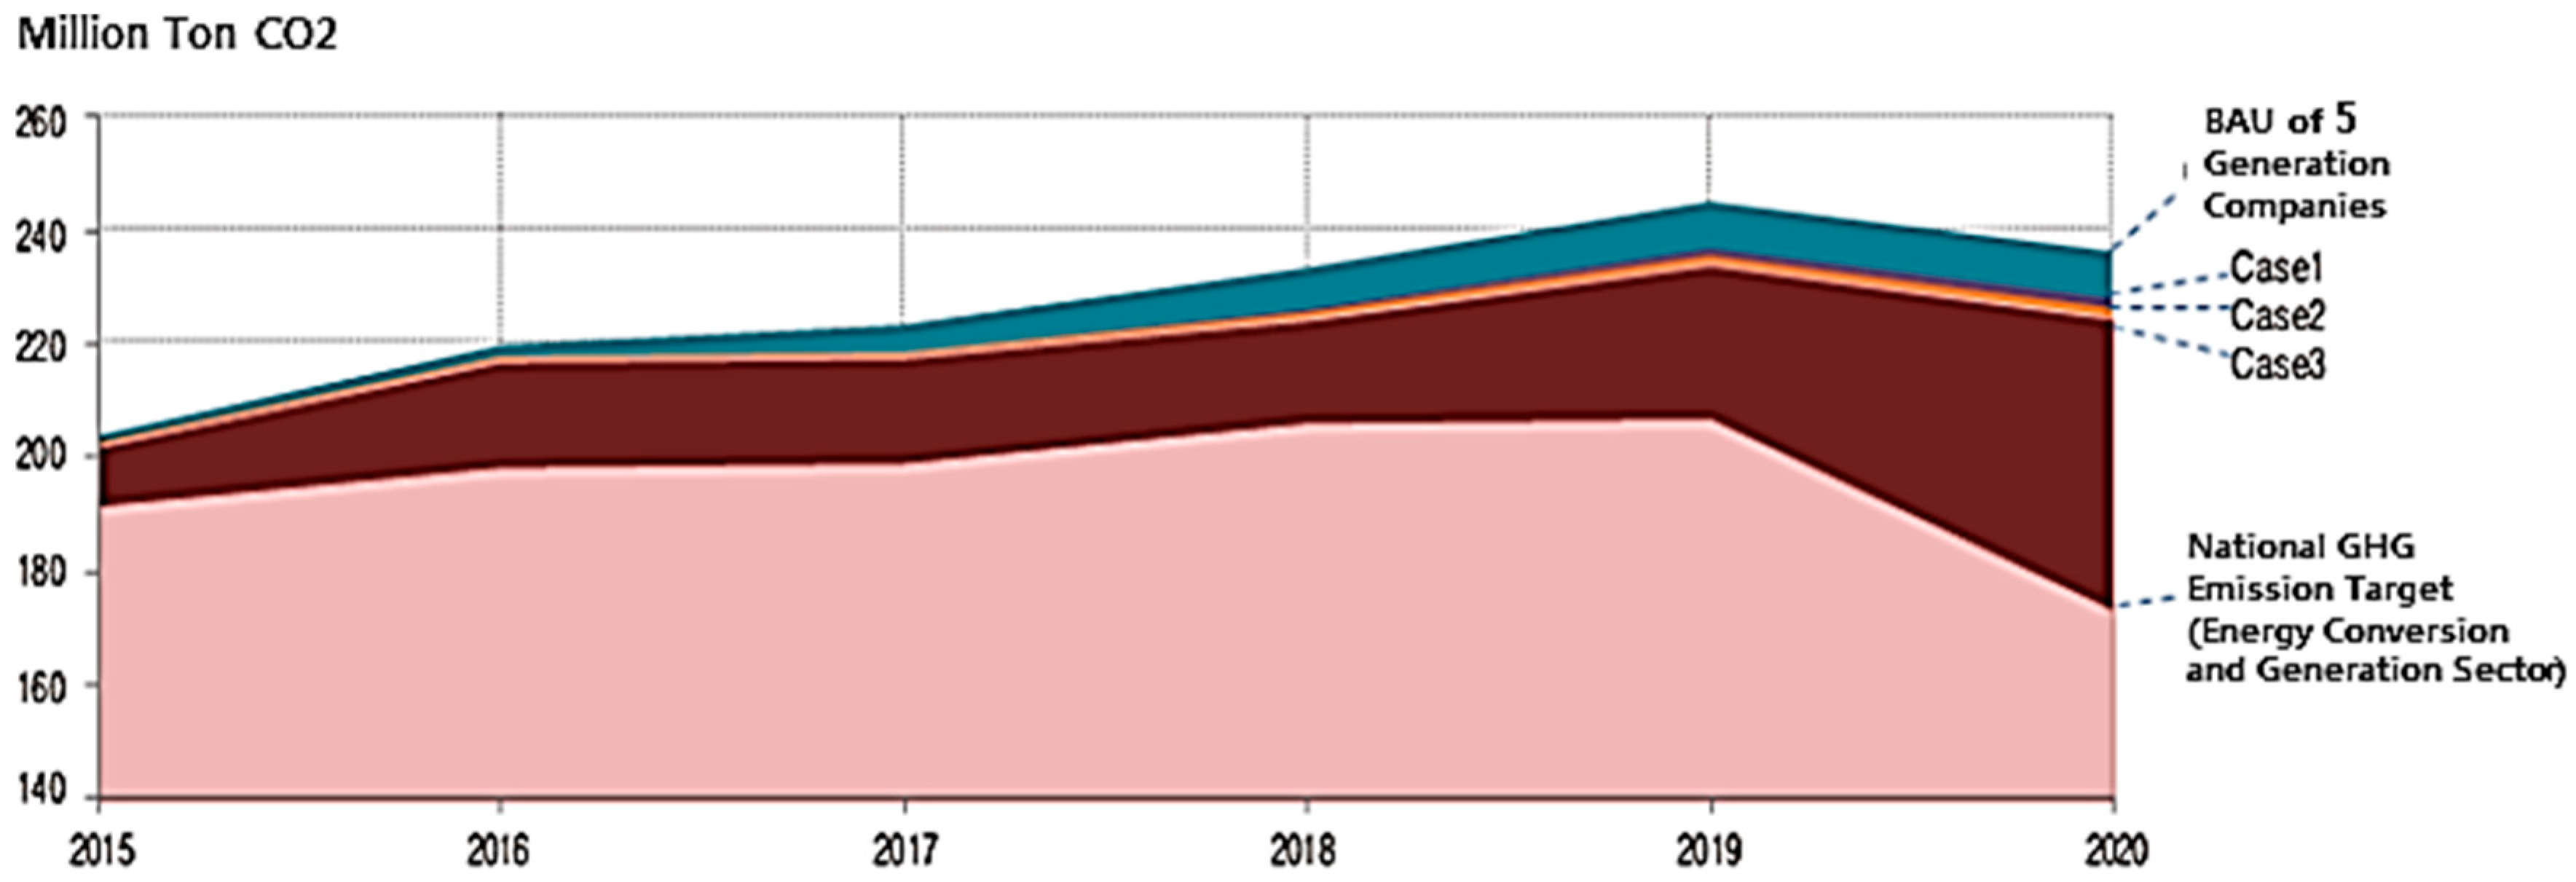
On Dae-Gyun Oh [5], which accounts for GHG reduction technology in thermal power plants and development in renewables as suggested in the 6th Electricity Supply and Demand Plan, eight technology categories were selected for analysis as the applicable technologies to the generation sector. For thermal power plants, technology development of CCS, ultra-super critical boiler, high-efficiency gas turbine, and integrated gasification combined cycle are considered for implementation to reduce GHG emissions, while technological improvements in fuel cell, biomass, wind, and photovoltaic power are also reviewed to partially replace the current thermal power plants. While the reduction target of the generation sector was 26.7% in 2020, the projected GHG reduction was estimated as 3.44% to 4.79% in 2020 based on the reduction roadmap plan. Since the projected GHG reduction in 2020 is far lower than the target of 26.7% in the generation sector, this result suggests that the reduction target of the generation sector is highly difficult to achieve solely with technical attempts (Figure 3).
Various previous studies have been conducted to analyze the potential of the environmental policies or the low-carbon scenarios from the system perspective, but they have not considered the effects of the alternative energy adoption from the system perspective. Alderson et al. [6] analyzed energy saving scenario for the United Kingdom (UK) by 2050, deriving that the GHG emissions reduction could be achieved at 46% by 2030. Ashina et al. [7] studied the future low-carbon society road map in Japan and showed that the CO2 emissions reduction rate would reach 31%–35% by 2030. Hu et al. [8] analyzed the successful cases of low-carbon economic planning in China for the last 30 years; as a result China would achieve 16.55 billion tons of CO2 emissions reduction, as well as 4.38 billion tons of oil-equivalent energy savings by 2030. Additionally, some of the quantitative national level GHG reduction studies that have been carried out include Gomi et al. [9], Kainuma et al. [10], Nakata et al. [11], Shrestha et al. [12], Shrestha and Shakya [13], and Winyuchakrit et al. [14]. There have been conceptual and analytical models presented in international journals that have been very useful for country-level implementation of low carbon measures and assessments.
The results of the previous studies validate that the generation sector holds a critical role in GHG reduction. Therefore, we analyze the impacts of the national GHG reduction measures for the Post-2020 Climate Change Mitigation Commitment on the generation sector and South Korean macro economy based on the recent governmental policies, which include National GHG Reduction Roadmap [15], released in 2014, and the 7th Electricity Supply and Demand Plan, released in 2015.
Yang et al. [16] suggested the optimization model to evaluate how appropriately the 2050 target emission quantities established in California were matched with those under the Post-2020 climate change regime formation. The forte of this model encompassed the limit of technology, costs, and even the policy-oriented characteristics. The authors emphasized the effects of introducing renewable energy and CCS. The adoption of CCS was especially instrumental in reducing GHG.
Muis et al. [17] developed a methodology to draw a portfolio of electricity generation sources per nation. In a bid to reduce GHG up to 50%, compared with the current emission, it was essential to introduce new generation technologies rather than the existing fossil fuel generation, such as integrated gasification combined cycle (IGCC), natural gas combined cycle (NGCC), nuclear power, and biomass from landfill gas, palm oil residues, and the like.
Mustafa Ozcan [18] performed the research to estimate electricity generation, GHG emission, costs incurred from the carbon tax per each generation source from 2013 to 2017. He asserted, in order to reduce GHG, renewables and nuclear power were efficient measures to generate electricity. However, so as to use nuclear power as a generation source, a couple of factors of concern, such as various hazards, and hurdles by Non-Governmental Organizations (NGOs), should be considered.
Lee et al. [19] developed a numerical model of reducing GHG in South Korea for power expansion planning to support various environmental policies. The authors identified 36% of GHG could be reduced far over 30% of the 2020 reduction target. In addition, considering only the domestic economic situation, nuclear power was one of the favorable alternatives. However, they both focused on hazards of the nuclear power and insisted more a supplemented power expansion planning allowing for renewable policies.
To date, the cost incurred from severe accidents of nuclear power plants, like that of the Fukushima event, is not included in the generation cost when the government established the electricity supply and demand plan. Regardless of the scale of accidents, those potential costs should be considered since nobody can deny the possibility of accidents of nuclear power plants.
The Fukushima accident demonstrates the external costs of nuclear power plants would be higher than those of the existing evaluation to date.
In this research, we analyze a number of precedent references and quantify a reasonable nuclear accident cost appropriately customized for the South Korean situation.
Hence, we apply the major alternatives for GHG reduction to the analysis scenarios of our study and comply with the demand management of the generation sector from the 7th Electricity Supply and Demand Plan.
Additionally, the sustainability of the generation technology should be considered over the long-term. In general, sustainability refers to the integration of three issues, i.e., including economic, environmental, and social approaches [20,21]. Sustainable development is also defined as “development that meets the needs of the present benefit without compromising the ability of future generations to meet their own needs” [22,23]. Li, Geng and Li [24] compared and analyzed various studies on aspects of sustainability for a variety of energy conversion systems. Three-quarters of the quantities of CO2 emission has been from the energy generation system using fossil fuel, which is the main factor producing GHG emissions. However, in order to avoid this environmental hazard, abruptly changing the current energy infrastructure is not an efficient approach to secure economic energy production. Hence, it is essential to perform R and D with regard to the energy system from the long-term perspective [24].

3. Methodology

3.1. Establishing the Baseline of GHG Emission Using WASP Model

In order to maintain consistency with the ongoing energy policy of South Korea, we refer to the 7th Electricity Supply and Demand Plan [15] to estimate the baseline of the GHG emission of the year 2030 for the generation sector, the major features of which focus on the low carbon energy mix; firstly, the four pre-arranged coal-fired power plants are excluded due to their high GHG emissions, the result of which eventually decreases the ratio of the coal-fired power plants. Policy planners reached an agreement that these excluded plants will be replaced with two new 1500 MW nuclear power plants. Secondly, the facility capacities of the renewable energy are expected to be up to 33,890 MW and its portion will be 11% in 2035. Finally, the active demand management plan is fortified in connection with the energy efficiency and information technology.
For the purpose of establishing the baseline of the 2030 GHG emission volume, we make use of the WASP model in which the International Atomic Energy Agency (IAEA) has distributed to estimate the electricity generation quantities. We anticipate the emission volume using the standard emission coefficient issued by the IAEA [25] in Table 2.

3.2. Scenario Composition

Since a detailed plan to reduce the emission volume for each generation sector is not determined yet, we assume a 95% emission volume of the energy conversion and generation sector as that of the only generation sector. Comparing the GHG reduction target of the Post-2020 Climate Change Mitigation Commitments with that of the generation quantities following the 7th Electricity Supply and Demand Plan, we estimate the additional reduction volume from the simulation using the WASP model. We decided to replace the coal-fired power plants to reduce the estimated additional emission volume as the main scenario in Table 3. As the IEA [1] considers nuclear power, renewables, and CCS as the three main technologies to reduce GHG, we also set those technologies as the alternatives to the coal-fired power plants. In addition, not as a totally carbon-free technology but as an efficient carbon capture technology, IGCC could be in the limelight as an alternative to reduce GHG. IGCC is the technology reducing GHG to the level of GHG emission level of LNG (liquefied natural gas). Since IGCC is still a premature technology which is not worthy of replacing high-capacity coal power plants, we exclude it from this study. In the current stage, LNG combined cycle technology can be considered as one of the practical base load technologies to replace coal power technology. Not only has this technology a significant low carbon emission compared with coal and oil power technology, but it also has a carbon emission coefficient that is almost similar to the IGCC technology. From the economic perspective, the price of LNG will plummet up to 75% in 2025 by the production increase of shale gas [26]. For those reasons, we add the LNG combined cycle technology as an alternative of coal power technology.
  • Scenario 1: replacing the coal-fired power plants with nuclear power plants
  • Scenario 2: replacing the coal-fired power plants with renewable energy
  • Scenario 3: installing CCS to the existing coal-fired power plants
  • Scenario 4: replacing the coal-fired power plants with LNG combined cycle power plants

4. Analysis and Estimation of Input Data

The main objective of this study is to perform comparative analysis regarding investment costs, necessary land size, and wholesale price as the economic effects.
First of all, we estimate investment costs for the replacement of coal-fired power plants with other alternatives using Equation (1):
I n v e s t m e n t   c o s t s   ( $ ) = A l t e r n a t i v e   c a p a c i t i e s   ( MW ) × U n i t   c o s t   o f   a l t e r n a t i v e   ( $ / MW )
In regards with new nuclear power technologies, the construction cost in South Korea is well below that of other major countries with the exception of China. The reasons embrace multiple factors; firstly, the economies of scale, such as savings from administration costs, site selection costs, and regulatory costs due to multiple units gathered in one site; secondly, construction capability, lessons learned from repeated construction; and finally, refined supply chain. The information on the construction costs of major countries are delineated in Table 4 [27]. According to D’haeseleer [28], constructing new nuclear power plants in the EU is very much capital intensive and generation costs are as good as other countries. On the other hand, he mentioned that recent repetitive construction of nuclear power plants in the EU showed a learning effect, serial effect, fleet effect, and economies of scale which could be a factor to decrease construction and generation costs.
Where we use the concept of overnight costs for the investment costs in 2030 and the GHG price for the year 2030 is estimated as $13.48/ton-CO2 on the basis of the historical GDP rate and price ranges during January to August of 2015 in the Korea Power Exchange in which the GHG rights are traded.
For the calculation of the necessary land size, we follow the NEI report [29] for each generation technology (Table 5).
To estimate the effects on the electricity wholesale price, we use the real data from 2001 to 2014 and draw an annual increasing rate of wholesale price to anticipate a selling price of each generation technology to the Korea Power Exchange in 2030.
Δ P P = L N ( P t + 1 P t )
where Δ P / P is an annual increasing rate, P t + 1 is the wholesale price of the year t + 1 , and P t is the wholesale price of the year t . We assume the annual increasing rate follows the function of the natural logarithm to reflect the general economic phenomena which explain the asymptotical increase of the commodity prices (Table 6).
With an estimated selling price of each generation technology including the impacts of the increase of investment costs, a price of GHG emission, we calculate the increased average wholesale price per each scenario. We are able to infer the economic insights of the increased wholesale price in the case of each scenario.
By dividing the investment costs per each scenario with the total generation quantities in 2030, we estimate variations of the wholesale price in which the positive effects of the decreased GHG effects are considered as well:
P ( 2030 ) i = i = 1 n C i i = 1 n Q i
where P ( 2030 ) i is the wholesale price in 2030, C i is investment costs of each scenario, and Q i is the generation quantity of each generation technology.
Risks of severe nuclear accidents are reflected with reference cases considering the domestic situation. According to the Second Energy Basic Plan [30], accident and policy costs are applied $0.0015 to $0.0049/kWh. In addition, the representative research in South Korea [31] demonstrated that accident response and policy costs as additive costs ranged from $0.0034 to $0.0538/kWh.
D’fhaeseleer [28] suggested that external costs from the normal operation in Europe were in the range of 1 to 4 €(2012)/MWh ($0.0013–$0.0051/kWh). This result was well below that compared with other generation technologies. The external costs of the severe accidents are on average 1 €(2012)/MWh ($0.0013/kWh), with a minimum of 0.3 €2012/MWh ($0.0004/kWh) and a maximum of 3 €(2012)/MWh ($0.0039/kWh).
Preiss et al. [32] estimated the external cost of a nuclear power plant in a normal operation was in the range of 3–3.5 €(2010)/MWh ($0.40–$0.46/kWh). Furthermore, external costs of coal power plants influencing the environment and humans were 40 €(2010)/MWh ($0.0531/kWh), those of gas power plants were 20 €(2010)/MWh ($0.0265/kWh), those of photovoltaic power plants were 10 €(2010)/MWh ($0.0133/kWh), and those of wind power plants were 2 €(2010)/MWh ($0.0027/kWh). Excluding wind power, the external costs of all of the power plants were estimated higher than for nuclear power. Preiss et al. [32] also estimated the external costs of the severe accidents of nuclear power plants. The external costs were drawn by an accident grade from minimum 0.13 €(2010)/MWh ($0.00017/kWh) to 0.15 €(2010)/MWh ($0.0002/kWh), the total external costs were 0.23 €(2010)/MWh ($0.00031/kWh).
Lévêque [33,34] assumed accident costs of nuclear power plants were 430 billion €, yearly generation quantities, 10 TWh, the frequency of accidents, 2 × 10⁻⁵/reactor-year on the basis of core damage accidents only among various past accidents. Under these assumptions, the external costs were estimated 0.86 €/MWh ($0.0011/kWh).
Rabl and Rabl [35] quantified the external costs of nuclear power including core loss, transmission and distribution losses, cancer, crop damages, refugees following serious accidents, and purification of the surroundings. In addition, accident damage costs were presumed to be 360 billion € (2010) and the accident probabilities one accident per 25 years in a periodic manner with the combination of Chernobyl and Fukushima accidents. As a result, the external costs were drawn at 3.8 €(2010)/MWh ($0.0050/kWh) at the median, 0.8 €(2010)/MWh ($0.0011/kWh) at the minimum, and 22.9 €(2010)/MWh ($0.0304/kWh) at the maximum.
According to Ludivine and Patrick [36], the technology institute supporting the French Nuclear Safety Authority divided the nuclear accident into two categories; severe accidents and major accidents. The costs from severe accidents and major accidents were 120 billion € (2010) and 430 billion € (2010) respectively. The probability of nuclear accidents applied a large early release frequency of radioactive materials suggested by IAEA Safety standard [1]. With the large early release frequency, 10−5/reactor year, of the third generation were applied, the external costs were estimated at 0.12–0.43 €/MWh ($0.00016–$0.00057/kWh). In the more conservative frequency, 10−4/reactor year, the external costs were estimated at 1.2–4.3 €/MWh ($0.0016–$0.0057/kWh).
In Japan, both the Accident Costs Validation Committee and the Operation Costs Validation Committee drew generation costs and accident response costs based on the Fukushima accident (see Table 7).
From reviewing many case studies, we reached the conclusion that the external costs applied in South Korea are similar to the $0.0049/kWh being used in Europe, which was estimated by William D’fhaeseleer [28]. Hence, we use $0.0049/kWh as the benchmark cost of severe accidents and analyze the various economic effects in the end.

5. Empirical Analysis

5.1. GHG Emission Baseline of the Generation Sector

We estimated the total electricity generation in the year 2030 to be 724,823 GWh by applying the optimal facility plan derived from the WASP model, which takes account of load, existing facilities, planned facilities, and operation costs of the 7th Electricity Supply and Demand Plan [15]. Accordingly, we calculate the GHG emission baseline of the generation sector by multiplying the GHG emission coefficient of the IAEA to our projected total generation in 2030. Thus, the GHG emission baseline is 266 million tons and the coal-fired power plants are responsible for 95% of the 266 million tons by emitting 253 million tons of GHG (Table 8) [25].
Despite the submitted INDC with the 37% reduction target, the detailed reduction plan is not yet determined for the generation sector for the year 2030. Therefore, we set the difference between the emission volumes by the BAU and our projected base line in 2030 as a standard to calculate excess GHG emission amounts of the generation sector.

5.2. Scenarios for Reduction Measures of the Generation Sector

The forecasted national GHG emission in the year 2030 is 850.6 million tons based on Post-2020 Climate Change Mitigation Commitment. Out of a total of 850.6 million tons, the energy conversion and generation sector will emit 333.1 million tons in 2030. We assume that the generation sector emits 95% of emissions from the energy conversion and generation sector. The BAU-based emission volume of the generation sector is 316.4 million tons, which is the permitted emission level for the generation sector according to the INDC of South Korea in 2030 (Table 9).
When we apply a 20% reduction target to the BAU based emission volume in the generation sector in 2030, the targeted emission volume of the generation sector is 253.2 million tons. By comparing with our GHG emission baseline of the generation sector, 266 million tons, the difference is 12.8 million tons of excessive emissions that need to be reduced in order to achieve the reduction target (Table 10).
Since the coal fired power plants emits 95% of the generation sector, we assign the excess of 12.8 million tons to replace the coal-fired power plants. While this excessive 12.8 million tons of GHG is equivalent to 12,957 GWh from the coal-fired power plants, as shown by Equation (4), this excessive emission is equivalent to 2.1 units of 800 MW coal-fired power plants which needs to be replaced (Table 11).
C r = G H G e x e s s C c o f . = 12.8 Million   ton 991 g - CO 2 / kWh = 12 , 957 GWh
where C r is the generation from the coal-fired power plant for replacement, G H G e x c e s s is excess GHG emission amount, and C C o f . is a GHG emission coefficient of coal.
In order to replace 2.1 units of 800 MW coal fired power plant, we set four scenarios by the reduction measures as nuclear, renewables, CCS, and LNG combined-cycle power, which are also the alternatives suggested by IEA.

5.3. Results of Scenario Analysis by Reduction Measures

5.3.1. Scenario 1: Replacing the Coal Fired Power Plants with Nuclear Power

As described in Equation (5), the generation from 1.2 units of the nuclear power plant is equivalent to 12,957 GWh from the coal fired power plant as shown in Table 12. However, a single nuclear power plant is constructed in a pair according to its fundamental design, meaning two nuclear power units are required instead of 1.2 units. Therefore, two nuclear power units generate 22,338 GWh, which is also capable of replacing an additional 9381 GWh from the coal fired power plant, reducing additional 9.3 million tons of GHG. In total, Scenario 1 is able to reduce 22.1 million tons of GHG. Accordingly, the investment costs of two nuclear power units is $6 billion based on the 7th Electricity Supply and Demand Plan [15] as shown in Table 13.
N r = C r N g = 12 , 957 GWh 11 , 169 GWh = 1.2 Unit 2 Units
where N r is a number of nuclear power units, C r is the generation from the coal fired power plant replacement, and N g is the generation from one nuclear power unit.

5.3.2. Scenario 2: Replacing the Coal-Fired Power Plants with Renewable Energy

According to the 7th Electricity Supply and Demand Plan [15] and its renewable energy plan, the projected generations from wind and solar power are 16,663 GWh and 21,210 GWh, respectively, for a total of 37,873 GWh in 2030. We decided on wind and solar power for replacement of the coal-fired power plants among the numerous renewables because wind and solar power hold the first and second places among renewables in terms of generation by the 7th Electricity Supply and Demand Plan [15]. By applying the ratio of wind and solar power from the renewable energy plan, 12,957 GWh from the coal fired power plants are replaceable by wind and solar power as of 5701 GWh and 7256 GWh for each. The average capacity factors for wind and solar power are 22.3% and 14.1% based on the capacity and capacity factors from 2015 to 2029 on the 7th Electricity Supply and Demand Plan [15]. As we apply these average capacity factors, the additional capacity of 2913 MW is required for wind power and 5883 MW for that of solar power (Table 14 and Table 15).
We apply the estimated investment costs of the year 2030 from Dae-Gyun Oh [5] to the capacity addition of the solar and wind power plants. The investment costs of wind and solar power are, respectively, $1.51 million/MW and $1.02 million/MW in 2030. For the result of Scenario 2, the total investment costs for replacing the coal-fired power plants with renewables is $10.4 billion, as shown in Table 16.

5.3.3. Scenario 3: Installing Carbon Capture and Storage

CCS is a direct reduction measure to reduce GHG emissions from coal-fired power plants. According to Energy Information Agency (EIA) [37], the GHG emission coefficient for the coal-fired power plants with CCS installed is 112.1 g-CO2/kWh which is significantly reduced by 878.9 g-CO2/kWh from the GHG emission coefficient of the coal fired power plant without CCS. As described by Equation (6), the generation from the coal-fired power plants with CCS is 14,609 GWh in order to reduce 12.8 million tons of excess GHG emissions to zero. This generation amount of 14,609 GWh is equivalent to 2085 MW, which is the required capacity of the coal-fired power plants with CCS installment.
CCS g = G H G e x e s s CCS c o f . = 12.8 Million   ton 878.9 g - CO 2 / kWh = 14 , 609 GWh
where CCS g is the generation of the coal-fired power plants with CCS installment, G H G e x c e s s is excess GHG emission amount, and CCS c o f . is the reduction in the GHG emission coefficient by CCS installation.
CCS r = CCS g 8760 hours × Capacity   factor = 14 , 609 GWh 8760 hours × 0.8 = 2085 MW
where CCS r is the required capacity of the coal fired power plants with CCS installation, and CCS g is the generation of the coal-fired power plant with CCS. We use the capacity factor in the analysis of the GHG reduction roadmap of the South Korean power industry (2014) (Table 17).

5.3.4. Scenario 4: Replacing the Coal-Fired Power Plants with Natural Gas Combined-Cycle Plants

We test four scenarios on the 2030 GHG emission quantities as the hard constraint. Scenario 4 differs from the other scenarios in that it does not assume a carbon-free situation, but rather assumes LNG combined cycle with a small amount of GHG. Hence, keeping the 2.1 plants as an alternative to coal power plants could not maintain the target GHG emission. In other words, the carbon emission coefficient, 549 g-CO2/kWh of LNG combined cycle generation substitutes for the 991 g-CO2/kWh of coal power plants. Assuming the same capacities, the alternation effect to one coal power plant with one LNG combined cycle is a reduction of approximately 442 g-CO2/kWh as shown in Table 18.
The assumptions above needs new values to test the effect of Scenario 4 instead of the 2.1 alternative value for coal power plants. For this purpose, we suggest specific values from Equation (9). In this case, despite a little higher value, 4.1, being needed, it is meaningful for the future theoretical and applicable research to estimate alternative capacities to coal power plants.
Generation quantities of CoalLNG
= excessive CO2 emission ÷ CoalLNG CO2 emission
= 12.8 million tons-CO2 ÷ 442 g-CO2/kWh
= 29,050 GWh
Number of LNG combined cycle plants needed
= coal generation need to alternate with ÷ one LNG combined cycle plants
= 29,050 GWh ÷ 6307 GWh
= 4.6 plants
The cost of 4.6 plants of LNG combined cycle generation is approximately $5.6 billion USD from the basis value of the 7th Electricity Supply and Demand Plan (Table 19).

5.3.5. Land area Requirement by Scenarios

We calculate the required land area of nuclear, wind, and solar power facilities in Scenario 1 and 2. Nuclear power of 3000 MW requires 10.1 km2, while the wind and solar power need 2338 km2 and 914 km2 for their designated capacities of 2913 MW and 5883 MW, respectively, to replace 12,957 GWh from the coal-fired power plant. Accordingly, the required land area for wind power is 229 times more than nuclear power, and solar power also needs 90 times more area than nuclear power (Table 20).

5.3.6. Effects of Electricity Price by Scenarios

We estimate the average electricity unit price in 2030 to be $0.1343/kWh. As described in Table 19, the estimated unit price for nuclear power is $0.0541/kWh, while it is $0.6866/kWh for oil in 2030. While the unit price of oil reaches the highest price with an annual increase of 8.48% from 2001 to 2014, the unit price of nuclear power is maintained relatively low compared to the other energy sources (Table 21).
We estimate the impacts of the average electricity unit price on the electricity price in 2030 by the scenarios in Table 22. In Scenario 1, the increase of nuclear power generation (22,338 GWh) and decrease of coal power generation (22,338 GWh) derive $0.0013/kWh reduction to the electricity unit price. The nuclear power investment costs of $6 billion increases the electricity unit price by $0.0082/kWh. The reduced purchase of emission credit decreases the electricity unit price by $0.00041/kWh. Considering the risks of a nuclear power plant, a $0.0049/kWh external cost of severe accidents are additionally added. The average electricity unit price for Scenario 1 is $0.1457/kWh, which is 8.1% higher than base average electricity unit price of $0.1343/kWh.
In Scenario 2, the increase of renewable energy generation (12,957 GWh) and decrease of coal power generation (12,957 GWh) derive $0.0034/kWh addition to the electricity unit price. The renewable energy investment costs of $10.4 billion increase the electricity unit price by $0.0144/kWh. The reduced purchase of emission credit decreases the electricity unit price by $0.00024/kWh. The average electricity unit price for Scenario 2 is $0.1518/kWh and it is 12.3% higher than the base average electricity unit price of $0.1343/kWh.
In Scenario 3, the CCS investment costs of $9.5 billion increase the electricity unit price by $0.0131/kWh. The reduced purchase of emission credit decreases the electricity unit price by $0.00024/kWh. The average electricity unit price for scenario 3 is $0.1471/kWh and it is 9.1% higher than the base average electricity unit price of $0.1343/kWh.
In Scenario 4, the increase and decrease of 29,050 GWh in the LNG combined cycle plants and coal power plants anticipate a $0.0074/kWh increase of the electricity selling price, the construction cost of $5.6 billion of the LNG combined cycle plants contribute to raise $0.0077/kWh increase of the electricity selling price. In addition, carbon credit from the reduction of coal power plants decreases $0.00024/kWh of the electricity selling price. Hence, the average electricity selling price is estimated around $0.1492/kWh which is 10% higher than the BAU selling price ($0.1343/kWh).

5.3.7. Sensitivity Analysis

Figure 4 shows the sensitivity analysis result with different GHG reduction target in 2030. We set the three reduction targets for the analysis: 30%, 25%, and 20%. In Scenario 1, the investment costs vary from $6 billion to $17.9 billion and the GHG reduction amount varies from 22.1 million to 66.4 million ton. In Scenario 2, the investment costs vary from $10.4 billion to $36.1 billion and GHG reduction amount vary from 12.8 million to 44.5 million tons. In Scenario 3, the investment costs vary from $9.5 billion to $32.8 billion and GHG reduction amounts vary from 12.8 million to 44.5 million tons.
By comparison, Scenario 1 shows higher GHG reduction than the other scenarios because of the additional power generation from nuclear power due to its two unit-pairing design characteristic. However, Scenario 2 shows the highest sensitivity variance for the investment costs.

6. Conclusions

Considering its position as the seventh-highest GHG emitter in the world [38], South Korea submitted a substantially high GHG reduction target, as announced in its INDC. In order to achieve the total of the 37% reduction target, which is composed of a 25.7% domestic emission reduction and an 11.3% purchase from the international carbon market from the BAU of 2030, the intensive GHG reduction measures are inevitable, especially for the generation sector, which emits 30% of the national GHG emissions. Thus, the major government-owned thermal power generators will face direct challenges and require aggressive actions to reduce their GHG emission.
According to our calculation, the forecasted excess GHG emission of the generation sector of the year 2030, complying with the 7th Electricity Supply and Demand Plan [15], is 12.8 million tons. We used the WASP model to estimate generation and GHG emission volume in order to maintain congruence in policy with the Korea Power Exchange, which also uses the same WASP model to develop the Electricity Supply and Demand Plan. To replace 2.1 or 4.6 units of coal power plants, which are accountable for the excess GHG emission, we set nuclear power, renewable energy, and CCS installation as the alternatives to the coal-fired power plants for our scenario base analysis. After analyzing GHG reduction quantity, investment costs, and electricity fare increment for each scenario, we conclude that Scenario 1 provides the most positive results (Table 23).
While GHG reduction in the generation sector is critical to achieve the national reduction target in 2030, the significant reduction in GHG emissions requires low-carbon energy and technology development. As our study elaborates, nuclear power is a promising alternative to reduce GHG in the generation sector. Therefore, a long-term plan to increase nuclear power plants in South Korea is required, along with genuine attempts to reach social compromise in expanding nuclear power.
Although we sought to maintain congruence in policy as much as possible, a limitation still exists due to the usage of a hypothetical approach for any policy which is not agreed upon, either domestically or the internationally. A detailed discussion of the BAU and reduction measures for the generation sector for the national reduction target by the year 2030 will be held in 2016 after the 21st Conference of the Parties, scheduled in December, 2015. Thus, we expect a change in the research results depending on future policy, since we applied the hypothetical approach to our study.

Author Contributions

Taesik Yun: Developed the model and performed the experiments. Younggook Kim: He wrote the experimental section of the paper. Jang-yeop Kim: Created the overall idea and the basic outline of the paper.

Conflicts of Interest

The authors declare no conflict of interest.

Abbreviations

BAUBusiness as Usual
CCSCarbon Capture and Storage
EIAEnergy Information Agency
GHGGreenhouse Gases
GDPGross Domestic Product
INDCIntended National Determined Contributions
IPCCIntergovernmental Panel on Climate Change
IAEAInternational Atomic Energy Agency
IEAInternational Energy Agency
KEEIKorea Energy Economics Institute
KEIKorean Environment Institute
LNGLiquefied Natural Gas
NGOsNon-Governmental Organizations
RPSRenewable energy Portfolio Standard
UKUnited Kingdom
WASPWien Systematic System Planning

References

  1. Sethi, M. Location of greenhouse gases (GHG) emissions from thermal power plants in India along the urban-rural continuum. J. Clean. Prod. 2015, 103, 586–600. [Google Scholar] [CrossRef]
  2. International Energy Agency (IEA). Energy Technology Perspectives; International Energy Agency (IEA): Paris, France, 2015. [Google Scholar]
  3. Lee, S.; Kim, K. Korea Environment Institute (KEI). In A Study on the Status of Greenhouse Gas Mitigation Policy Instruments and Its Improvement (II): Focusing on Realization of the National Greenhouse Gas Reduction Roadmap; Korea Environment Institute (KEI): Sejong, South Korea, 2014. [Google Scholar]
  4. Noh, D. Post-2012 Low Carbon Strategy for Energy and Industry Sectors for Green Growth; Korea Energy Economics Institute (KEEI): Ulsan, South Korea, 2014. [Google Scholar]
  5. Oh, D. Greenhouse Gas Reduction Roadmap of the Korean Power Industry. J. Electr. World 2015, 458, 22–27. [Google Scholar]
  6. Alderson, H.; Cranston, G.R.; Hammond, G.P. Carbon and environmental footprinting of low carbon UK electricity futures to 2050. Energy 2012, 48, 96–107. [Google Scholar] [CrossRef] [Green Version]
  7. Ashina, S.; Fujino, J.; Masui, T.; Ehara, T.; Hibino, G. A roadmap towards a low-carbon society in Japan using backcasting methodology: Feasible pathways for achieving an 80% reduction in CO2 emissions by 2050. Energy Policy 2012, 41, 584–598. [Google Scholar] [CrossRef]
  8. Hu, Z.; Yuan, J.; Hu, Z. Study on China’s low carbon development in an Economy-Energy-Electricity-Environment framework. Energy Policy 2011, 39, 2596–2605. [Google Scholar] [CrossRef]
  9. Gomi, K.; Ochi, Y.; Matsuoka, Y. A systematic quantitative backcasting on low-carbon society policy in case of Kyoto city, Technol. Forecast. Soc. Chang. 2011, 78, 852–871. [Google Scholar] [CrossRef]
  10. Kainuma, M.; Matsuoka, Y.; Morita, T. The AIM/end-use model and its application to forecast Japanese carbon dioxide emissions. Eur. J. Oper. Res. 2000, 122, 416–425. [Google Scholar] [CrossRef]
  11. Nakata, T.; Silva, D.; Rodionov, M. Application of energy system models for designing a low-carbon society. Progr. Energy Combust. Sci. 2011, 37, 462–502. [Google Scholar] [CrossRef]
  12. Shrestha, R.M.; Malla, S.; Liyanage, M.H. Scenario-based analyses of energy system development and its environmental implications in Thailand. Energy Policy 2007, 35, 3179–3193. [Google Scholar] [CrossRef]
  13. Shrestha, R.M.; Shakya, S.R. Benefits of low carbon development in a developing country: Case of Nepal. Energy Econ. 2013, 34, S503–S512. [Google Scholar] [CrossRef]
  14. Winyuchakrit, P.; Limmeechokchai, B.; Matsuoka, Y.; Gomi, K.; Kainuma, M.; Fujino, J.; Suda, M. Thailand’s low-carbon scenario 2030: Analyses of demand side CO2 mitigation options. Energy Sustain. Dev. 2011, 15, 460–466. [Google Scholar] [CrossRef]
  15. Ministry of Trade, Industry and Energy (MOTIE). 7th Electricity Supply & Demand Plan; Ministry of Trade, Industry and Energy: Sejong, South Korea, 2015.
  16. Yang, C.; Yeh, S.; Zakerinia, S.; Ramea, K.; McCollum, D. Achieving California’s 80% greenhouse gas reduction target in 2050: Technology, policy and scenario analysis using CA-TIMES energy economic systems model. Energy Policy 2015, 77, 118–130. [Google Scholar] [CrossRef]
  17. Muis, Z.A.; Hashim, H.; Manan, Z.A.; Taha, F.M.; Douglas, P.L. Optimal planning of renewable energy-integrated electricity generation schemes with CO2 reduction target. Renew. Energy 2010, 35, 2562–2570. [Google Scholar] [CrossRef] [Green Version]
  18. Ozcan, M. Estimation of Turkey’s GHG emissions from electricity generation by fuel types. Renew. Sustain. Energy Rev. 2016, 53, 832–840. [Google Scholar] [CrossRef]
  19. Lee, J.; Lee, I.; Kim, B. Generation expansion planning model supporting diverse environmental policies for reduction of greenhouse gases. ETRI J. 2015, 37, 295–305. [Google Scholar] [CrossRef]
  20. Carter, C.R.; Rogers, D.S. A framework of sustainable supply chain management: Moving toward new theory. Int. J. Phys. Distr. Log. 2008, 38, 360–387. [Google Scholar] [CrossRef]
  21. Formentini, M.; Taticchi, P. Corporate sustainability approaches and governance mechanisms in sustainable supply chain management. J. Clean. Prod. 2016, 112, 1920–1933. [Google Scholar] [CrossRef] [Green Version]
  22. Verbruggen, A.; Laes, E. Sustainability assessment of nuclear power: Discourse analysis of IAEA and IPCC frameworks. Environ. Sci. Policy 2015, 51, 170–180. [Google Scholar] [CrossRef]
  23. World Commission on Environment and Development. Our Common Future; Oxford University Press: Oxford, UK, 1987. [Google Scholar]
  24. Li, J.; Geng, X.; Li, J. A comparison of electricity generation system sustainability among G20 Countries. Sustainability 2016, 8, 1276. [Google Scholar] [CrossRef]
  25. International Atomic Energy Agency (IAEA). A Guide of Life-Cycle GHG Emissions from Electric Supply Technologies; International Atomic Energy Agency (IAEA): Vienna, Austria, 2006. [Google Scholar]
  26. World Bank. World Bank Commodity Price Data (Pink Sheet); World Bank: Washington, DC, USA, 2012. [Google Scholar]
  27. International Energy Agency (IEA). Projected Cost of Generating Electricity; International Energy Agency (IEA): Paris, France, 2010. [Google Scholar]
  28. D’haeseleer, W.D. Synthesis on the Economics of Nuclear Energy, Study for European Commission, DG Energy Final Report; Publisher: Stuttgart, Germany, 2013. [Google Scholar]
  29. Nuclear Energy Institute (NEI). Land Requirements for Carbon-Free Technologies; Nuclear Energy Institute (NEI): Washington, DC, USA, 2015. [Google Scholar]
  30. Ministry of Trade, Industry and Energy (MOTIE). The Second Energy Basic Plan; Ministry of Trade, Industry and Energy (MOTIE): Sejong, Korea, 2014.
  31. National Assembly Budget Office (NABO). Contentious Issues and Tasks Regarding the Cost of Nuclear Power Generation; National Assembly Budget Office: Seoul, South Korea, 2014.
  32. Preiss, P.; Wissel, S.; Fahl, U.; Friedrich, R.; Voß, A. Die Risiken der Kernenergie in Deutschland im Vergleich mit Risiken Anderer Stromerzeugungstechnologien; Arbeitsbericht/Working Paper; IER: Leuven, Belgium, 2013. [Google Scholar]
  33. Lévêque, F. Estimating the Cost of Nuclear Power: Benchmarks and Uncertainties; Working Paper 13-ME-01; Interdisciplinary Institute for Innovation: Paris, France, 2013. [Google Scholar]
  34. Lévêque, F. The Risk of a Major Nuclear Accident: Calculation and Perception of Probabilities; Working Paper 13-ME-02; Interdisciplinary Institute for Innovation: Paris, France, 2013. [Google Scholar]
  35. Ari, R.; Rabl, V.A. External costs of nuclear: Greater or less than the alternatives? Energy Policy 2013, 57, 575–584. [Google Scholar]
  36. Ludivine, P.C.; Patrick, M. Massive Radiological Releases Profoundly Differ from Controlled Releases; Institut de Radioprotection et de Sûreté Nucléaire: Fontenay-aux-Roses, France, 2013. [Google Scholar]
  37. Energy Information Agency. Capital Cost Estimates for Utility Scale Electricity Generation Plan; EIA: Washington, DC, USA, 2013. [Google Scholar]
  38. International Energy Agency (IEA). CO2 Emissions from Fuel Combustion; IEA: Paris, France, 2015. [Google Scholar]
Figure 1. Cumulative CO2 reduction by technology in two degrees by 2050. Source: International Energy Agency (IEA) [2].
Sustainability 09 00307 g001
Figure 2. Analysis process for the economic effects of Post-2020 climate change.
Sustainability 09 00307 g002
Figure 3. Comparison of reduction quantity by scenario and national target. Source: Dae-Gyun Oh [5].
Sustainability 09 00307 g003
Figure 4. Sensitivity analysis of GHG reduction target in 2030.
Sustainability 09 00307 g004
Table 1. Alternatives of the energy conversion and generation sector.
AlternativeDescription
Demand Management Policy Enhancement
  • Rationalize energy price structure
  • Normalize electricity fare, reflecting environmental and social costs, and expand application of demand managed electricity fare system
Renewable Energy Increase
  • Enforce and expand Renewable Portfolio Standards (RPS)
Intelligent Demand Management Expansion
  • Apply smart-grid technology
  • Expand EMS (Energy Management System)
Leading Technology Development
  • Develop source and core technology for CCS plant
  • Develop leading technology via examinations
Source: Lee et al. [3].
Table 2. Emission coefficient. (Unit: g-CO2/kWh).
ClassificationCoalLNGOilNuclearRenewables
Coefficient99154978210-
Source: IAEA (2006) [25].
Table 3. Main factors impacting the wholesale price per scenario.
Main FactorReasons Chosen as the Main FactorEffects on the Wholesale Price
Generation SourcesScenario 1
Replacing the coal power with low-carbon technology
Scenario 2
Replacing the coal power with renewable energy: carbon-free technology
Scenario 3
Install CCS to the existing coal power plants: good effects of GHG abatement
Scenario 4
Replacing the coal power with LNG combined cycle power: carbon reduction technology
Change of wholesale prices per each generation technology
Investment CostsDifferent investment costs per scenarioThe effect on the wholesale price = investment costs of each scenario/the total generation quantities in 2030
GHG Emission PricesDecrease of GHG purchasing costs per scenarioDecrease of GHG purchasing costs = The GHG price in 2030 × the decreasing quantities/the total generation quantities in 2030
Table 4. Construction cost of nuclear power plants.
CountryTechnologyCapacity (MWe)Overnight Cost (USD/kW)Total Investment Cost (USD/kW)
BelgiumEPR160053836185
ChinaCPR1000100017631946
CPR1000100017481931
AP1000125023022542
South KoreaAPR+150019592254
FranceEPR163038604483
GermanyPWR160041024599
HungaryPWR112051985632
JapanABWR133030093430
NetherlandsPWR165051055709
Slovak RepublicVVER95442614874
SwitzerlandPWR160058636988
PWR153040434758
United StatesAdv. Gen3+135033823814
RussiaVVER107029333238
Source: International Energy Agency (IEA) [27], Ministry of Trade, Industry and Energy (MOTIE) [15].
Table 5. Necessary land size. (Unit: km2/MW).
ClassificationNuclearWindSolar
Capacity1000 MW1000 MW1000 MW
Capacity Factor90%32%–47%17%–28%
Necessary Land Size0.00340.8030.155
Source: Nuclear Energy Institute (NEI) [29].
Table 6. Wholesale prices from 2001 to 2014.
ClassificationWholesale Price ($ a/MWh)Annual Increasing Rate (%)
2001200520102014
Nuclear33.4633.0033.4346.310.98 b
Coal35.6637.0952.9655.823.45
Oil62.0078.29155.78186.718.48
Gas74.0873.54108.08135.784.66
Pump storage62.3891.38170.98144.846.48
Renewables48.9558.5599.00109.476.19
a The exchange rate of 1085 KRW/$ is applied in this study; b In the case of the nuclear power plant, we apply one third of the average price index for the past three years since the selling price of nuclear power plant to the Korea Power Exchange is regulated by the government. We found from the price history that the increasing rate of the selling price of the nuclear power is normally under one percent per each year.
Table 7. Comparison of generation cost estimate.
ClassificationAccident Costs Validation Committee (2011)the Operation Costs Validation Committee (2015)
Damage costs5.8 trillion ¥9.1 trillion ¥
Probability of Accident1 time/2000 reactor·year1 time/4000 reactor·year
Cost estimation0.5 ¥/kWh ($0.0063/kWh)0.3 ¥/kWh ($0.0038/kWh)
Table 8. Electricity generation and greenhouse gas (GHG) emissions in 2030.
ClassificationGeneration (GWh)GHG Emission (Million Tons)
Nuclear290,3972.9
Coal255,505253
Oil4,4343.5
Gas11,6936.4
Hydro37,964-
Renewable55,188-
Others69,642-
Total724,823266
Table 9. GHG emission (BAU) projection of the generation industry.
YearNational (Million Tons)Energy Conversion and Generation Sector (Million Tons)Generation Sector (Million Tons)
2013679.8233.4221.7
2020782.5295.5280.7
2025809.7303.9288.7
2030850.6333.1316.4
Table 10. Excess GHG emission of the generation sector in 2030.
ClassificationGHG Emission (Million Tons)
Reduced BAU253.2
Base line emission266.0
Excess GHG emission+ 12.8
Table 11. Coal fired power plant specifications.
Capacity800 MW
Capacity factor90%
Generation6307 GWh
GHG emission coefficient991 g-CO2/kWh
GHG emission6.3 million tons
Table 12. Nuclear power unit specifications.
Capacity1500 MW
Capacity factor85%
Generation11,169 GWh
Table 13. Investment costs of nuclear power plant.
Capacity (MW)Construction Costs (Million $/MW)Investment Costs (Billion $)
30001.9926.0
Table 14. Generation and capacity factor of wind and solar in 2030.
ClassificationGeneration (GWh)Generation Share (%)Average Capacity Factor (%)
Wind16,6634422.3
Solar21,2105614.1
Total37,873100-
Table 15. Renewable energy replacing coal in 2030.
ClassificationGeneration of Coal Replacement (GWh)Required Capacity (MW)
Wind57012913
Solar72565883
Total12,9578796
Table 16. Investment cost of renewables.
ClassificationCapacity (MW)Construction Costs (Million $/MW)Investment Costs (Billion $)
Wind29131.514.4
Solar58831.026
Total879610010.4
Table 17. Investment costs of CCS.
Required Capacity for CCSConstruction Costs (Million $/MW)Investment Costs (Billion $)
2085 MW4.549.5
Table 18. Liquefied natural gas (LNG) combined cycle plants unit specifications.
Capacity800 MW
Capacity factor90%
Generation6307 GWh
GHG emission coefficient442 g-CO2/kWh
Table 19. Investment costs of natural gas combined-cycle plant.
Capacity (MW)Construction Costs (Million $/MW)Investment Costs (Billion $)
36850.8065.6
Source: The 7th Basic Plan of Long-Term Electricity Supply and Demand (2015).
Table 20. Required area.
ClassificationRequired Capacity (MW)Required Area (km2)Comparison (Times)
Scenario 1Nuclear power300010.21
Scenario 2Wind29132338229
Solar588391490
Table 21. Wholesale prices estimation in 2030.
ClassificationUnit Price ($/kWh)Generation (GWh)
Nuclear0.0541290,397
Coal0.096255,505
Oil0.68664434
Gas0.281511,693
Pump storage0.395537,964
Renewable0.286355,188
Other0.286369,642
Average/Total0.1343724,823
Table 22. Effects of wholesale price by scenario.
ClassificationScenario 1 ($/kWh)Scenario 2 ($/kWh)Scenario 3 ($/kWh)Scenario 4 ($/kWh)
Generation–0.00130.034-+0.0074
Investment costs+0.0082+0.0144+0.0131+0.0077
Emission credit–0.00041–0.00024–0.00024–0.00024
External cost+0.0049---
Average electricity unit price0.14570.15180.14710.1492
Table 23. Comparison of scenario analysis results.
ScenarioGHG Reduction (Million Tons)Investment Costs (Billion $)Change in Electricity Fare (%)
Scenario 1
Replacement with Nuclear Power Plant
22.16.0+8.14
Scenario 2
Replacement with Renewables
12.810.4+12.3
Scenario 3
Installment of CCS
12.89.5+9.10
Scenario 4
Installment of CCS
12.85.6+10.5

