Article

Mapping the Influence of Land Use/Land Cover Changes on the Urban Heat Island Effect—A Case Study of Changchun, China

1
Northeast Institute of Geography and Agroecology, Chinese Academy of Sciences, Changchun 130102, China
2
University of Chinese Academy of Sciences, Beijing 100049, China
*
Author to whom correspondence should be addressed.
Sustainability 2017, 9(2), 312; https://doi.org/10.3390/su9020312
Submission received: 30 December 2016 / Accepted: 13 February 2017 / Published: 20 February 2017
(This article belongs to the Special Issue Urban Heat Island)

Abstract

:
The spatio-temporal patterns of land use/land cover changes (LUCC) can significantly affect the distribution and intensity of the urban heat island (UHI) effect. However, few studies have mapped a clear picture of the influence of LUCC on UHI. In this study, both qualitative and quantitative models are employed to explore the effect of LUCC on UHI. UHI and LUCC maps were retrieved from Landsat data acquired from 1984, 1992, 2000, 2007, and 2014 to show their spatio-temporal patterns. The results showed that: (1) both the patterns of LUCC and UHI have had dramatic changes in the past 30 years. The urban area of Changchun increased more than four times, from 143.15 km2 in 1984 to 577.45 km2 in 2014, and the proportion of UHI regions has increased from 15.27% in 1984 to 29.62% in 2014; (2) the spatiotemporal changes in thermal environment were consistent with the process of urbanization. The average LST of the study area has been continuously increasing as many other land use types have been transformed to urban regions. The mean temperatures were higher in urban regions than rural areas over all of the periods, but the UHI intensity varied based on different measurements; and (3) the thermal environment inside the city varied widely even within a small area. The LST possesses a very strong positive relationship with impervious surface area (ISA), and the relationship has become stronger in recent years. The UHI we employ, specifically in this study, is SUHI (surface urban heat island).

1. Introduction

UHI (urban heat island), which refers to the phenomenon where urban areas tend to have higher temperatures than those of surrounding rural areas, is one of the major problems the 21st century poses to human beings as a result of the unprecedented growth in urbanization [1,2,3]. During the process of urbanization natural landscapes, like cropland and forests, are transformed into impervious surfaces consisting of chemical materials that effectively store short-wave radiation, such as cement, metal, and asphalt [4,5,6]. The UHI has profound effects on social, economic, and environmental problems, such as human health and well-being, mortality and risk of violence, higher energy costs, air quality, and urban runoff [7,8,9,10]. In terms of statistics, the UHI effects are found in more than 1000 cities of different sizes through all latitudes in both hemispheres, and more cities will suffer from it in the future [11]. In past years, many efforts have been made to mitigate the negative impacts caused by UHI, such as new roofing and paving materials, and more green space areas [12,13,14,15]. Thus, it has become a major research focus in urban climatology and urban ecology since first reported in 1818 [16]. To have a better understanding of the UHI effects is very important for providing a scientific basis for future climate mitigation and urban planning [17,18].
Traditionally, UHI studies have been conducted by ground-based observations [19]. In recent years, with the development of remote sensing technology, thermal infrared (TIR) remote sensing has become popular in urban climate and environment studies. It has become a powerful research tool for UHI studies [20,21,22,23]. Land surface temperature (LST), one of the most important variables measured by TIR, is considered the skin temperature of the Earth. LST plays an important role in the field of surface energy, environmental, and climate changes [24,25]. Compared to the CLHI (canopy layer heat island) and BLHI (boundary layer heat island), the UHI characterized by LST is defined as SUHI (surface urban heat island) and it relates directly to land surface features [26].The SUHI is dealt with in this study.
There has been quite a significant number of publications to investigate the impacts of LUCC (land use/land cover changes) on the thermal environment [27,28,29,30,31]. Rao is the first one to attempt the use of remote sensing technology in the study of UHI [32]. In the early stages remote sensing applications, NOAA AVHRR and MODIS, were the main data sources for retrieving LST [33,34]. However, the coarse spatial resolution of these data are found suitable only for small-scale urban temperature mapping and cannot be used to establish more accurate relationships between LST and surface biophysical parameters in urban environments [24]. Over 40 years, the Landsat series of satellites with higher spatial resolution provide the longest temporal record of space-based surface observations since 1972 and have become more popular among SUHI studies [35,36]. Land use types with different thermal properties and radiation features make different contributions to the UHI. For example, normalized differential vegetation index (NDVI ) is traditionally used as the indicator of vegetation abundance to estimate the LST-vegetation relationship, and the scatter diagram proved that there was a negative correlation between NDVI and LST [37,38]. Artificial buildings directly change the ratio of surface sensible heat flux and latent heat flux. Impervious surface area (ISA) and normalized different building index (NDBI), which are derived from images, are often used as the indicators to characterize the UHI effect. Goward found that there was a very close relationship between urban land cover and urban temperature patterns, but did not explore the urban inner structure in detail [39]. Li et al. selected Shanghai as a case for quantifying the impact of LUCC changes on the patterns of surface UHI and found that the dramatic changes in LUCC have drastically altered the spatiotemporal patterns of UHI [40]. At present, high resolution images, such as IKONOS and Quickbird, are widely used in urban LUCC studies, making it possible to explore the relationship between one single object and LST at finer scales [41].
The UHI studies are comprehensive studies which are influenced by the atmospheric environment, regional climate, hydrology, ecology, and many other factors. The remote sensing provides new perspectives for authors to study UHI and allow us to have a better understanding of UHI. However, most of the studies just focus on downtown urban areas over short periods and neglect the spatiotemporal changes of UHI over long periods considering the urban and suburban regions. Thus, this paper aims to: (1) map a clear picture of the spatio-temporal changes in the patterns of LUCC and the thermal environment of Changchun over the past 30 years; (2) analyze the impacts of LUCC on SUHI through both qualitative and quantitative models; and (3) measure UHI intensity and explore its relationship with ISA.

2. Materials and Methods
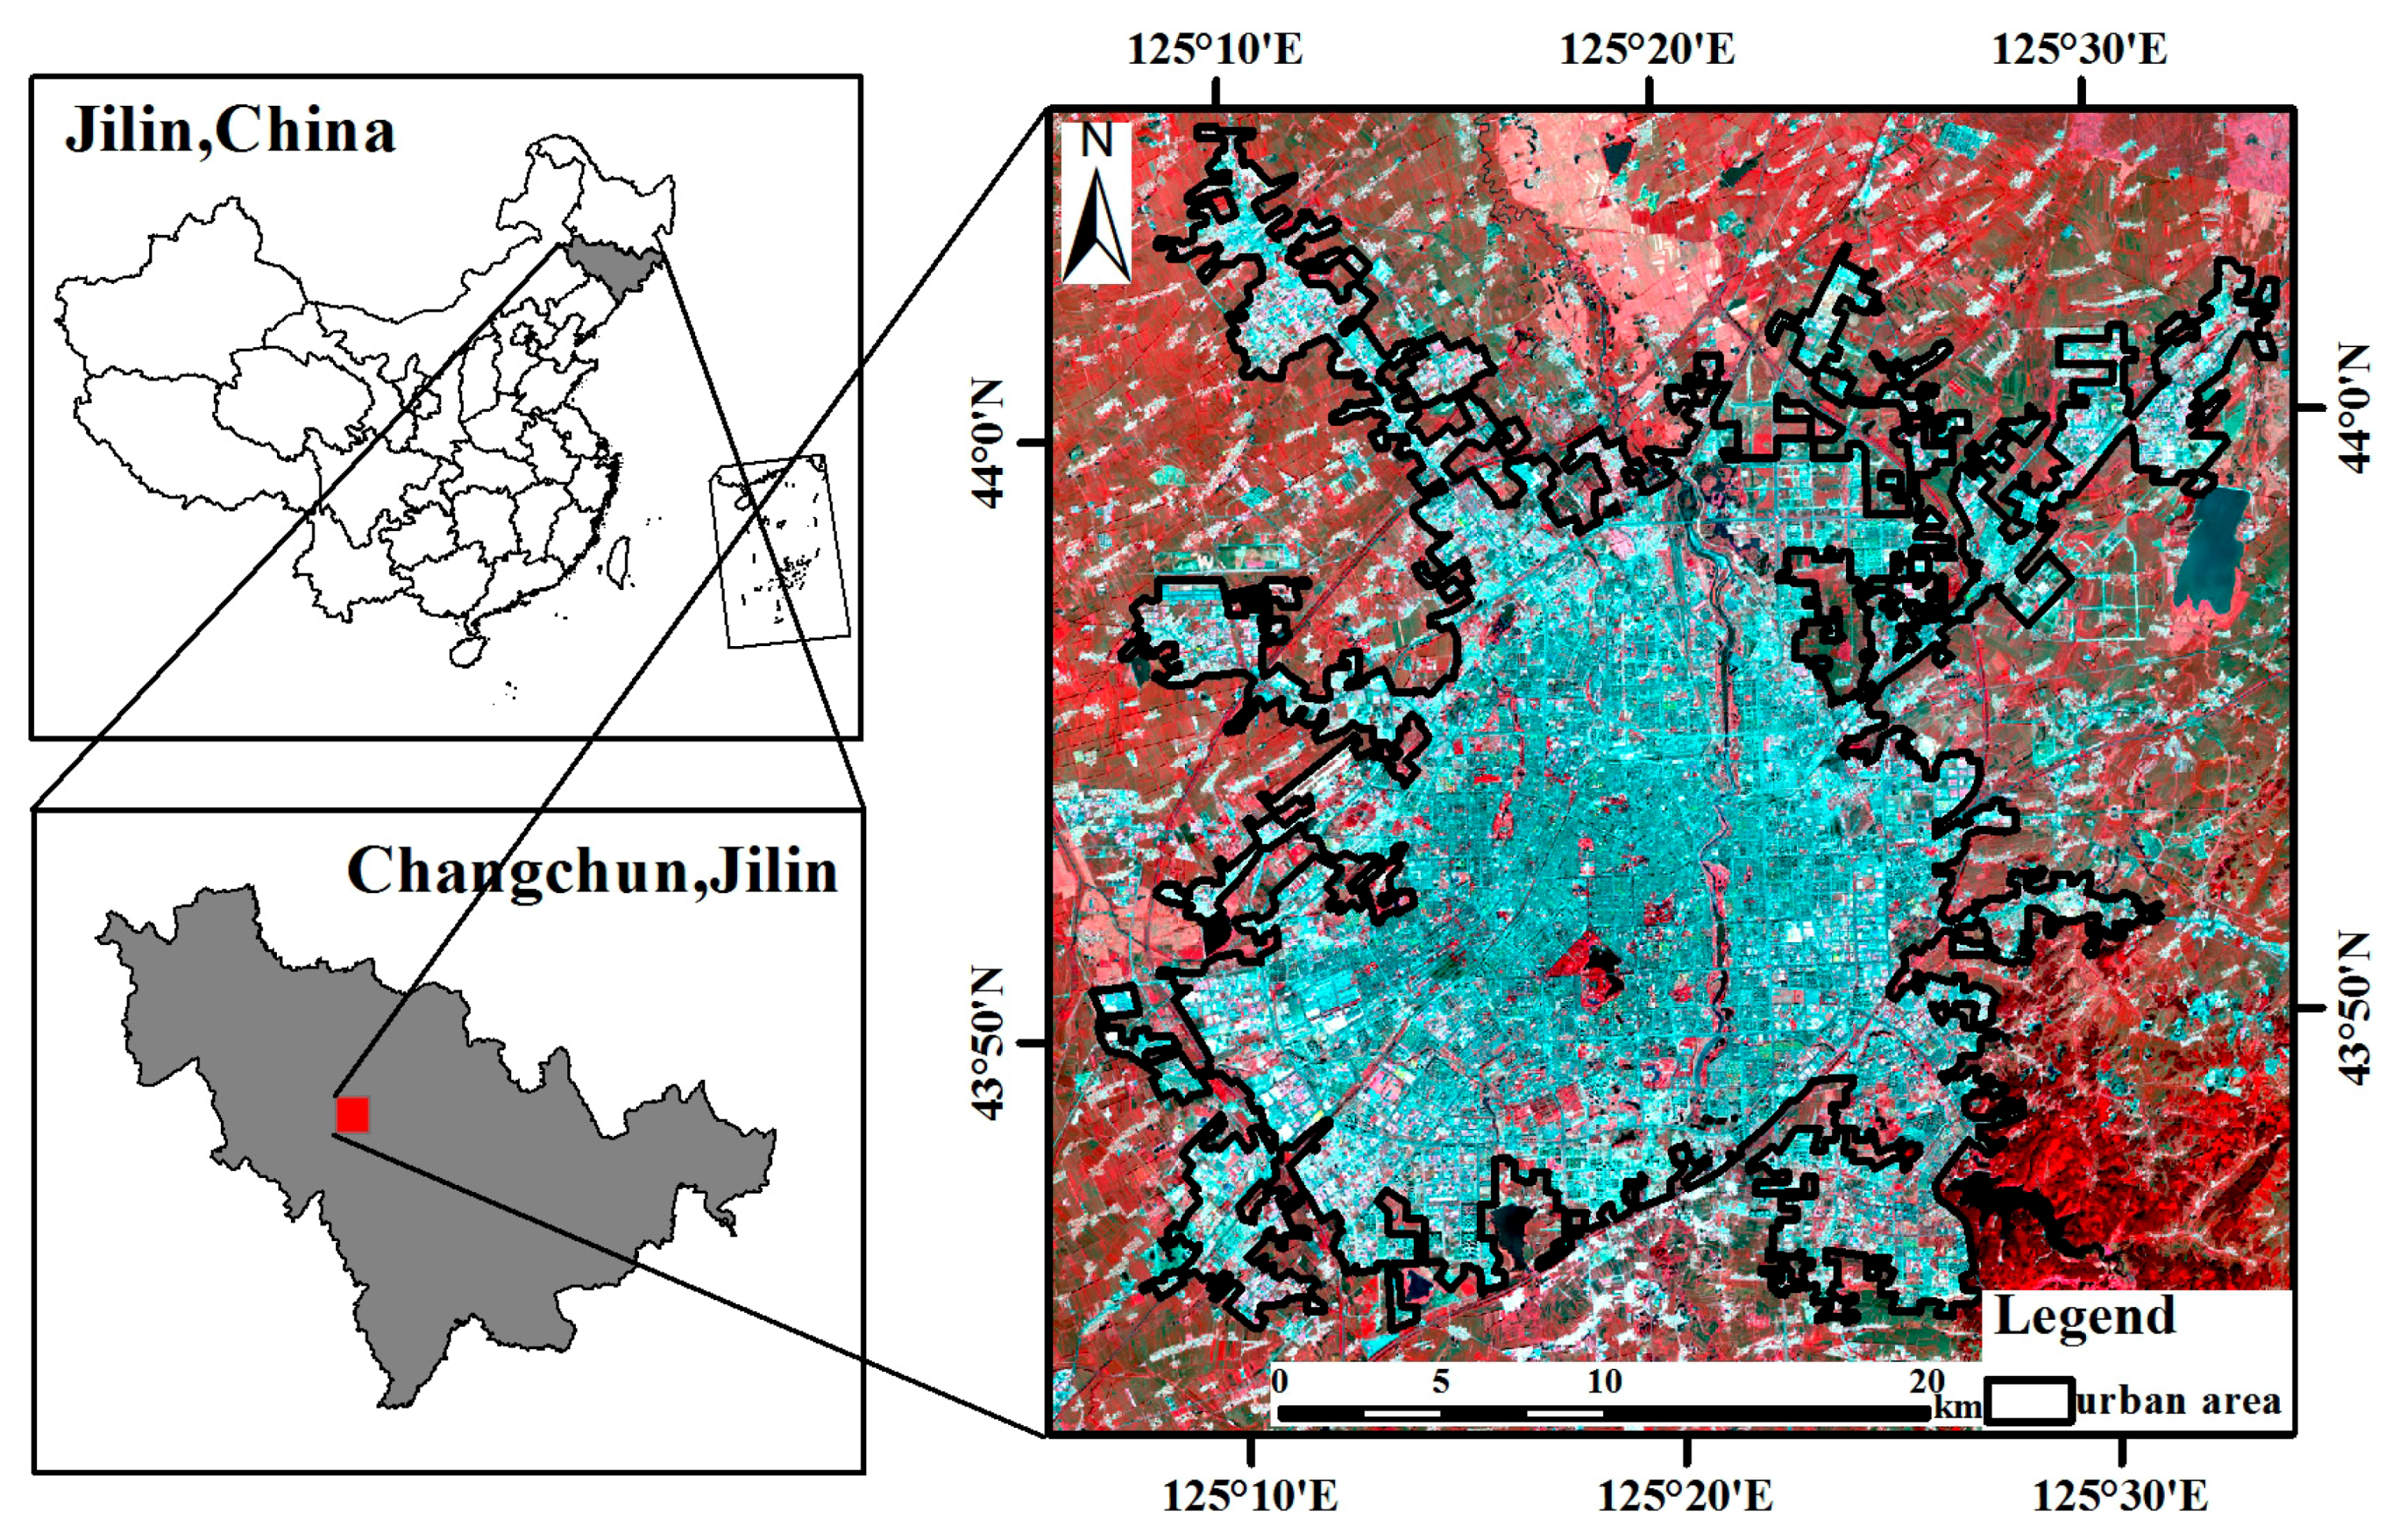
2.1. Study Site

Changchun (125°06′–125°36′E, 43°43′–44°04′N), known as “China’s Detroit”, is the capital city of Jilin province in Northeast China and serves as the province’s financial, political, and cultural center with an estimated population of 3.66 million in 2014 (Figure 1). Changchun has a sub-humid continental climate with long extremely cold winters and short hot summers. According to the local meteorological records, the average mean air temperature of Changchun (1984–2014) is 5.5 °C (Figure 2) and there has been an obvious increasing trend in the mean air temperature. The highest monthly average temperature is 23.1 °C in July and the lowest is −15.6 °C in January. The average annual precipitation of Changchun is 561.6 mm, most of which occurs from June to August when the temperature and humidity are highly persistent. The topography of the study area is flat with minimal elevation changes from 250 m to 350 m. Like many other megacities, Changchun has been undergoing an accelerated rate of urbanization and population explosion. In the past 30 years, dramatic changes have occurred in land use and landscape patterns, which have altered the thermal environment significantly.

2.2. Data Sources

Landsat images provide the longest continuous records of earth’s surface since 1972 and meet the requirements to capture the changes of Earth’s land cover and conditions [36]. Available Landsat-5 and Landsat-8 images (Table 1), collected from US Geological Survey (USGS) in the years from 1984 to 2014, were used to construct time series data to obtain the information of LUCC and to characterize the thermal environment in this study. All of the images were of good quality with no cloud or less than 10% cloud coverage. Prior to interpretation and LST retrievals, both radiometric correction and co-registration were applied to these images, which were corrected to the UTM projection system based on the images of 2014 by using the nearest-neighbor algorithm through ENVI 5.3 (provided by Exelis Visual Information Solutions). GF-1 images with 2 m spatial resolution, acquired on 22 June 2015 from the China Center for Resources Satellite Data and Application (CRESDA), were georeferenced to Landsat images to assess the accuracy of the classification.

2.3. Methods

2.3.1. LST Retrieval and Its Normalization

Through the radiative transfer equation, Landsat thermal infrared (TIR) data can establish a direct contact with LST [25]. The history of surface temperature (ST) retrieval by remote sensing dates back to 1980s [42]. Since then, many retrieval algorithms have been proposed based on different assumptions for different data sources [43,44,45,46]. Among these algorithms, the mono window algorithm (MWA), developed for Landsat TM6 by Qin [45], was used to map LST in which only three parameters were required: emissivity, transmittance, and effective mean atmospheric temperature, and its basic form can be written as:
T s = [ a ( 1 C D ) + ( b ( 1 C D ) + C + D ) T i D T a ] / C
where a = −67.366351, b = 0.458606, C = ε τ , D = ( 1 τ ) [ 1 + ( 1 ε ) ] . T s is LST; T i is the at-sensor brightness temperature of TIR bands i; ε is the land surface emissivity (LSE) of band i; τ is the atmospheric transmittance of band i which can be obtained on the USGS website based on the time of image acquisition and the central latitude and longitude of image; T a is the effective mean atmospheric temperature which can be calculated by using air temperature. T i can be calculated as follows:
T i = K 2 / l n ( K 1 L λ + 1 )
where the values of constants K 1 and K 2 can be gained from the metadata of Landsat images (USGS). L λ is the top of atmosphere (TOA) spectral radiance (W/(m2∙sr∙μm)) and can be calculated by the pixel values (DN, digital number) of the images.
LSE that can change substantially over short distances is one of the most important inputs in LST retrieval algorithms. The NDVI threshold method, which uses certain NDVI values to distinguish different land use types, is chosen to estimate LSE in this study [47]. According to the previous studies [48] and LSE libraries, the LSE for vegetation, buildings, soil, and water are 0.9844, 0.9700, 0.9731, and 0.9950, respectively. The NDVI of vegetation (NDVIV) and buildings (NDVIB) can be extracted from the NDVI histograms. For those pixels composed of vegetation and buildings (NDVIBNDVINDVIv), LSE can be estimated as follows [49]:
ε m i x = ε b + ( ε v ε b ) P V
where ε m i x is the LSE of mixed pixel; ε b is the LSE of buildings; ε v is the LSE of vegetation; P V is the fractional vegetation cover. P V can be obtained from the NDVI according to Carlson and Ripley [50]:
P V = ( N D V I N D V I B N D V I V N D V I B ) 2
According to the location of Changchun and the time of image acquisition, the following equation can be used for the estimation of the mean atmospheric temperature, as shown below [45]:
T a = 16.011 + 0.92621 T o
where T a is mean atmospheric temperature (K), and T o is the near-surface air temperature (K) that can be obtained from meteorological station.
It is not proper to directly analyze the differences of LST of multiple year periods due to the seasonality and the inter-annual variability. As a result, LST maps need to be normalized before quantitative analysis, as follows [51]:
N L S T = T i T min T max T min
where N L S T is the normalized LST value of pixel i; T i is the initial LST of pixel i; T max and T min are the maximum and minimum LSTs of the whole area, respectively. Then the NLST maps were classified into seven zones: lowest, lower, low, medium, high, higher, and highest using ArcGIS 10.2 (provided by Environmental Systems Research Institute) (Table 2) [18]. Areas where NLST belong to high, higher, or highest zones were defined as the UHI regions (UHIR) in this study.

2.3.2. Land Use Classification

Based on the environment of the study area, prior knowledge, and previous studies [52], eight land use/land cover types, as defined in Table 3, were identified from false-color Landsat images in 2014 by visual interpretation through ArcGIS 10.2. Compared to the computer-based interpretation of remote sensing images, visual interpretation usually takes more time and effort, but yields a more accurate result. The land use type of each patch was identified according to the color, size, shape, texture, and its spatial relationships with neighbors. During this process, when it comes to an unknown type, Google Earth with high spatial resolution images and other auxiliary data including soil and vegetation type, DEM (digital elevation model), and climate data were combined to help identify the land use type. Three hundred samples of reference data acquired from GF-1 were used for accuracy assessment. Overall, the total accuracy of the land use map achieves 91.6%, meeting the recommended value [53]. For other years, an interpreter with rich experience drew the land-use changes by comparing the Landsat images.

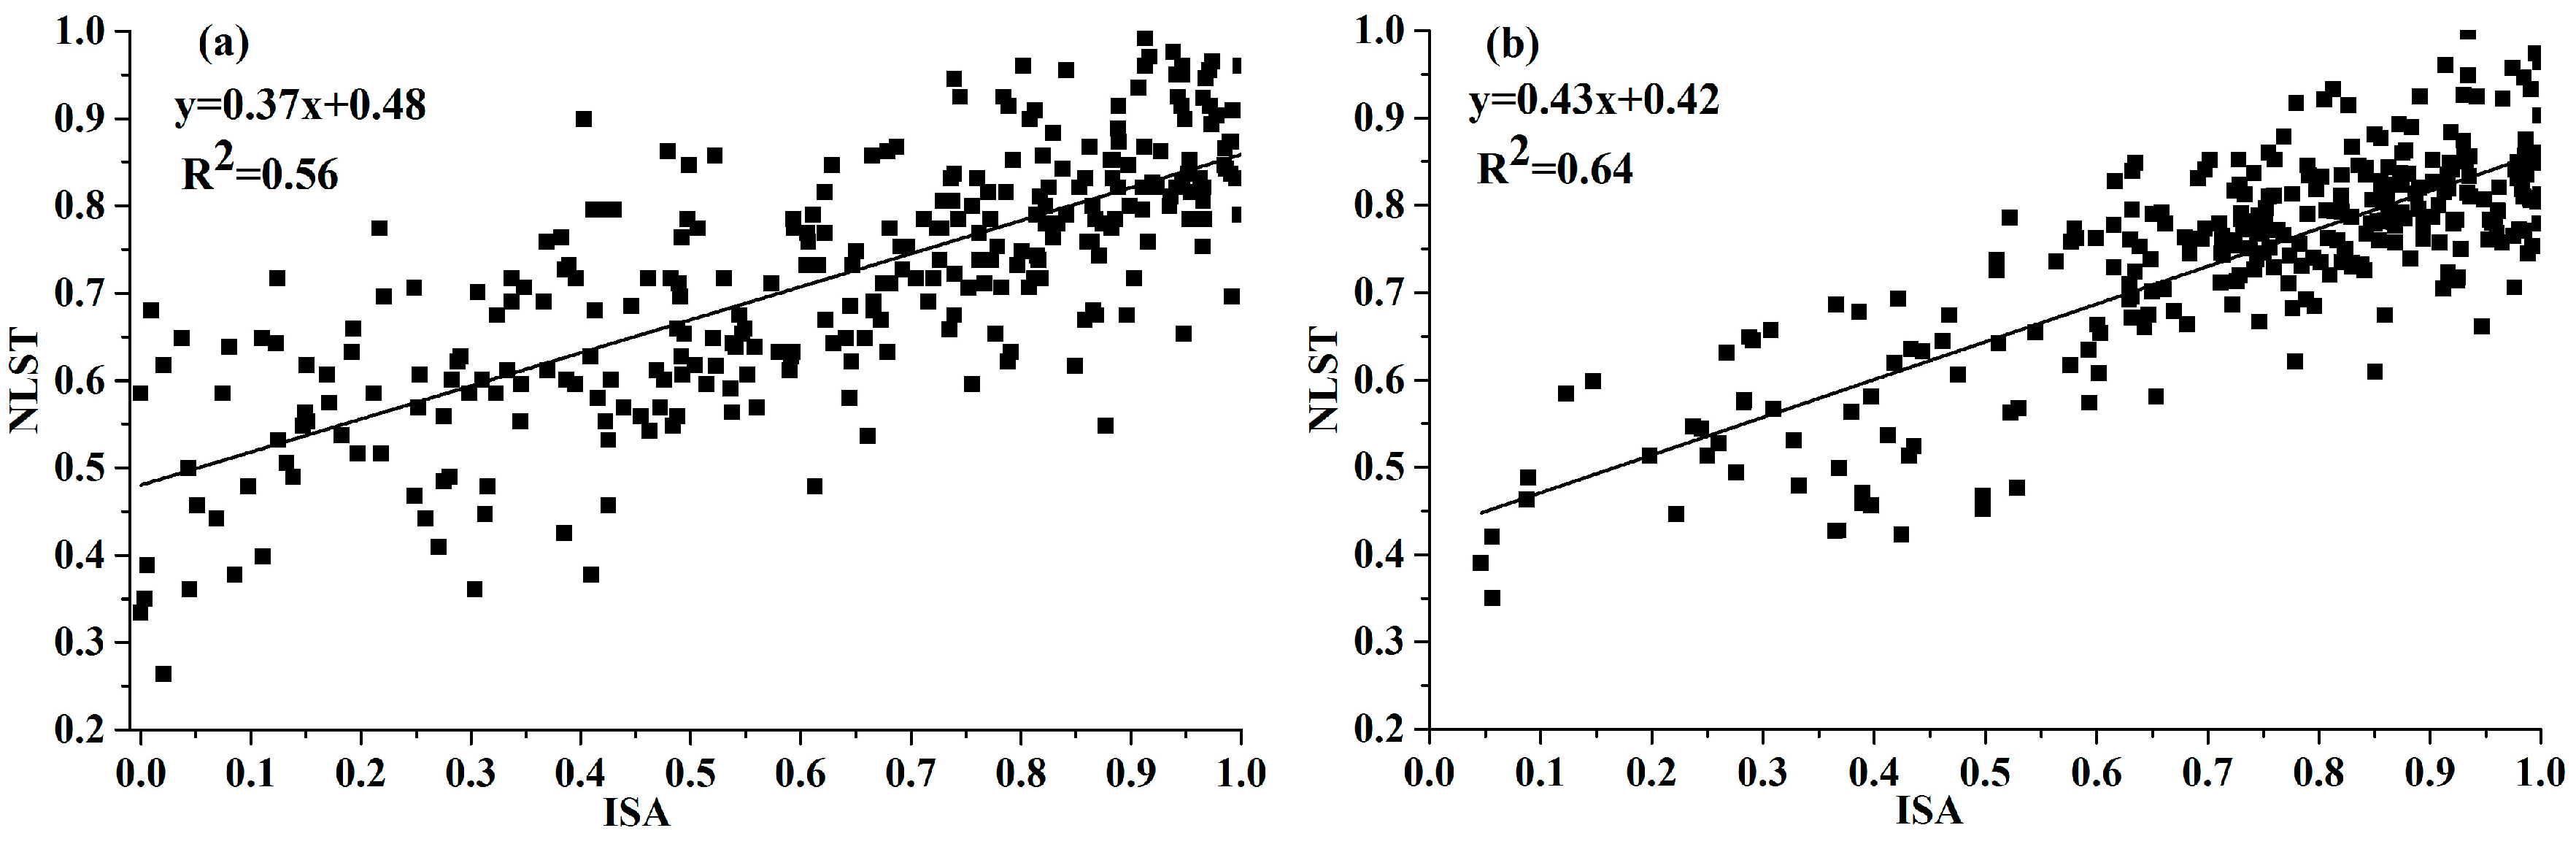
2.3.3. Impervious Surface Area

According to the theoretical model “vegetation-impervious surface-soil” (V-I-S) and the characteristics of the urban environment, a linear spectral mixture analysis (LSMA) with an improved method to extract and synthesize the “most representative” endmembers was selected to estimate the urban impervious surface area [54,55]. LSMA assumes that there is no intersection between endmembers, and it can be described as a linear combination of these endmembers:
R b = i = 1 N f i R ( i , b ) + e b
where R b is the reflectance for band b; N is the number of endmembers; f i is the fraction of endmember; R ( i , b ) is the reflectance of endmember i in band b; and e b is the residual. Additionally, another two restrictive conditions, where: i = 1 N f i = 1   and   o f i 1 , were implemented to guarantee the real meaning of impervious surface and avoid unreasonable values. One hundred fifty samples with 5 × 5 pixels selected from the estimated impervious surface images were used to conduct accuracy assessment. At the same time, the impervious surface areas of the identical samples on GF-1 images were interpreted visually. The accuracy assessment indicates that more than 80% of the sample’s absolute errors are less than 0.1 and the correlation coefficient of estimated and interpreted values is 0.94 which is significant at the 0.05 level of confidence.

2.3.4. The Intensity of UHI

According to the definition of UHI, in this study, the intensity of SUHI was calculated from:
SUHI = N L S T u r b a n N L S T r u r a l
where N L S T u r b a n is the mean NLST of the urban area, and N L S T r u r a l is the mean NLST out of urban area. Additionally, in order to make a comparison with SUHI, ISUHI (Inner SUHI) was defined as follows:
ISUHI = N L S T i n n e r _ u r b a n N L S T r u r a l
where N L S T i n n e r _ u r b a n is the mean NLST of the first traffic ring line in this study. Compared to the N L S T u r b a n , the area of N L S T i n n e r _ u r b a n was identical during the study periods.

3. Results

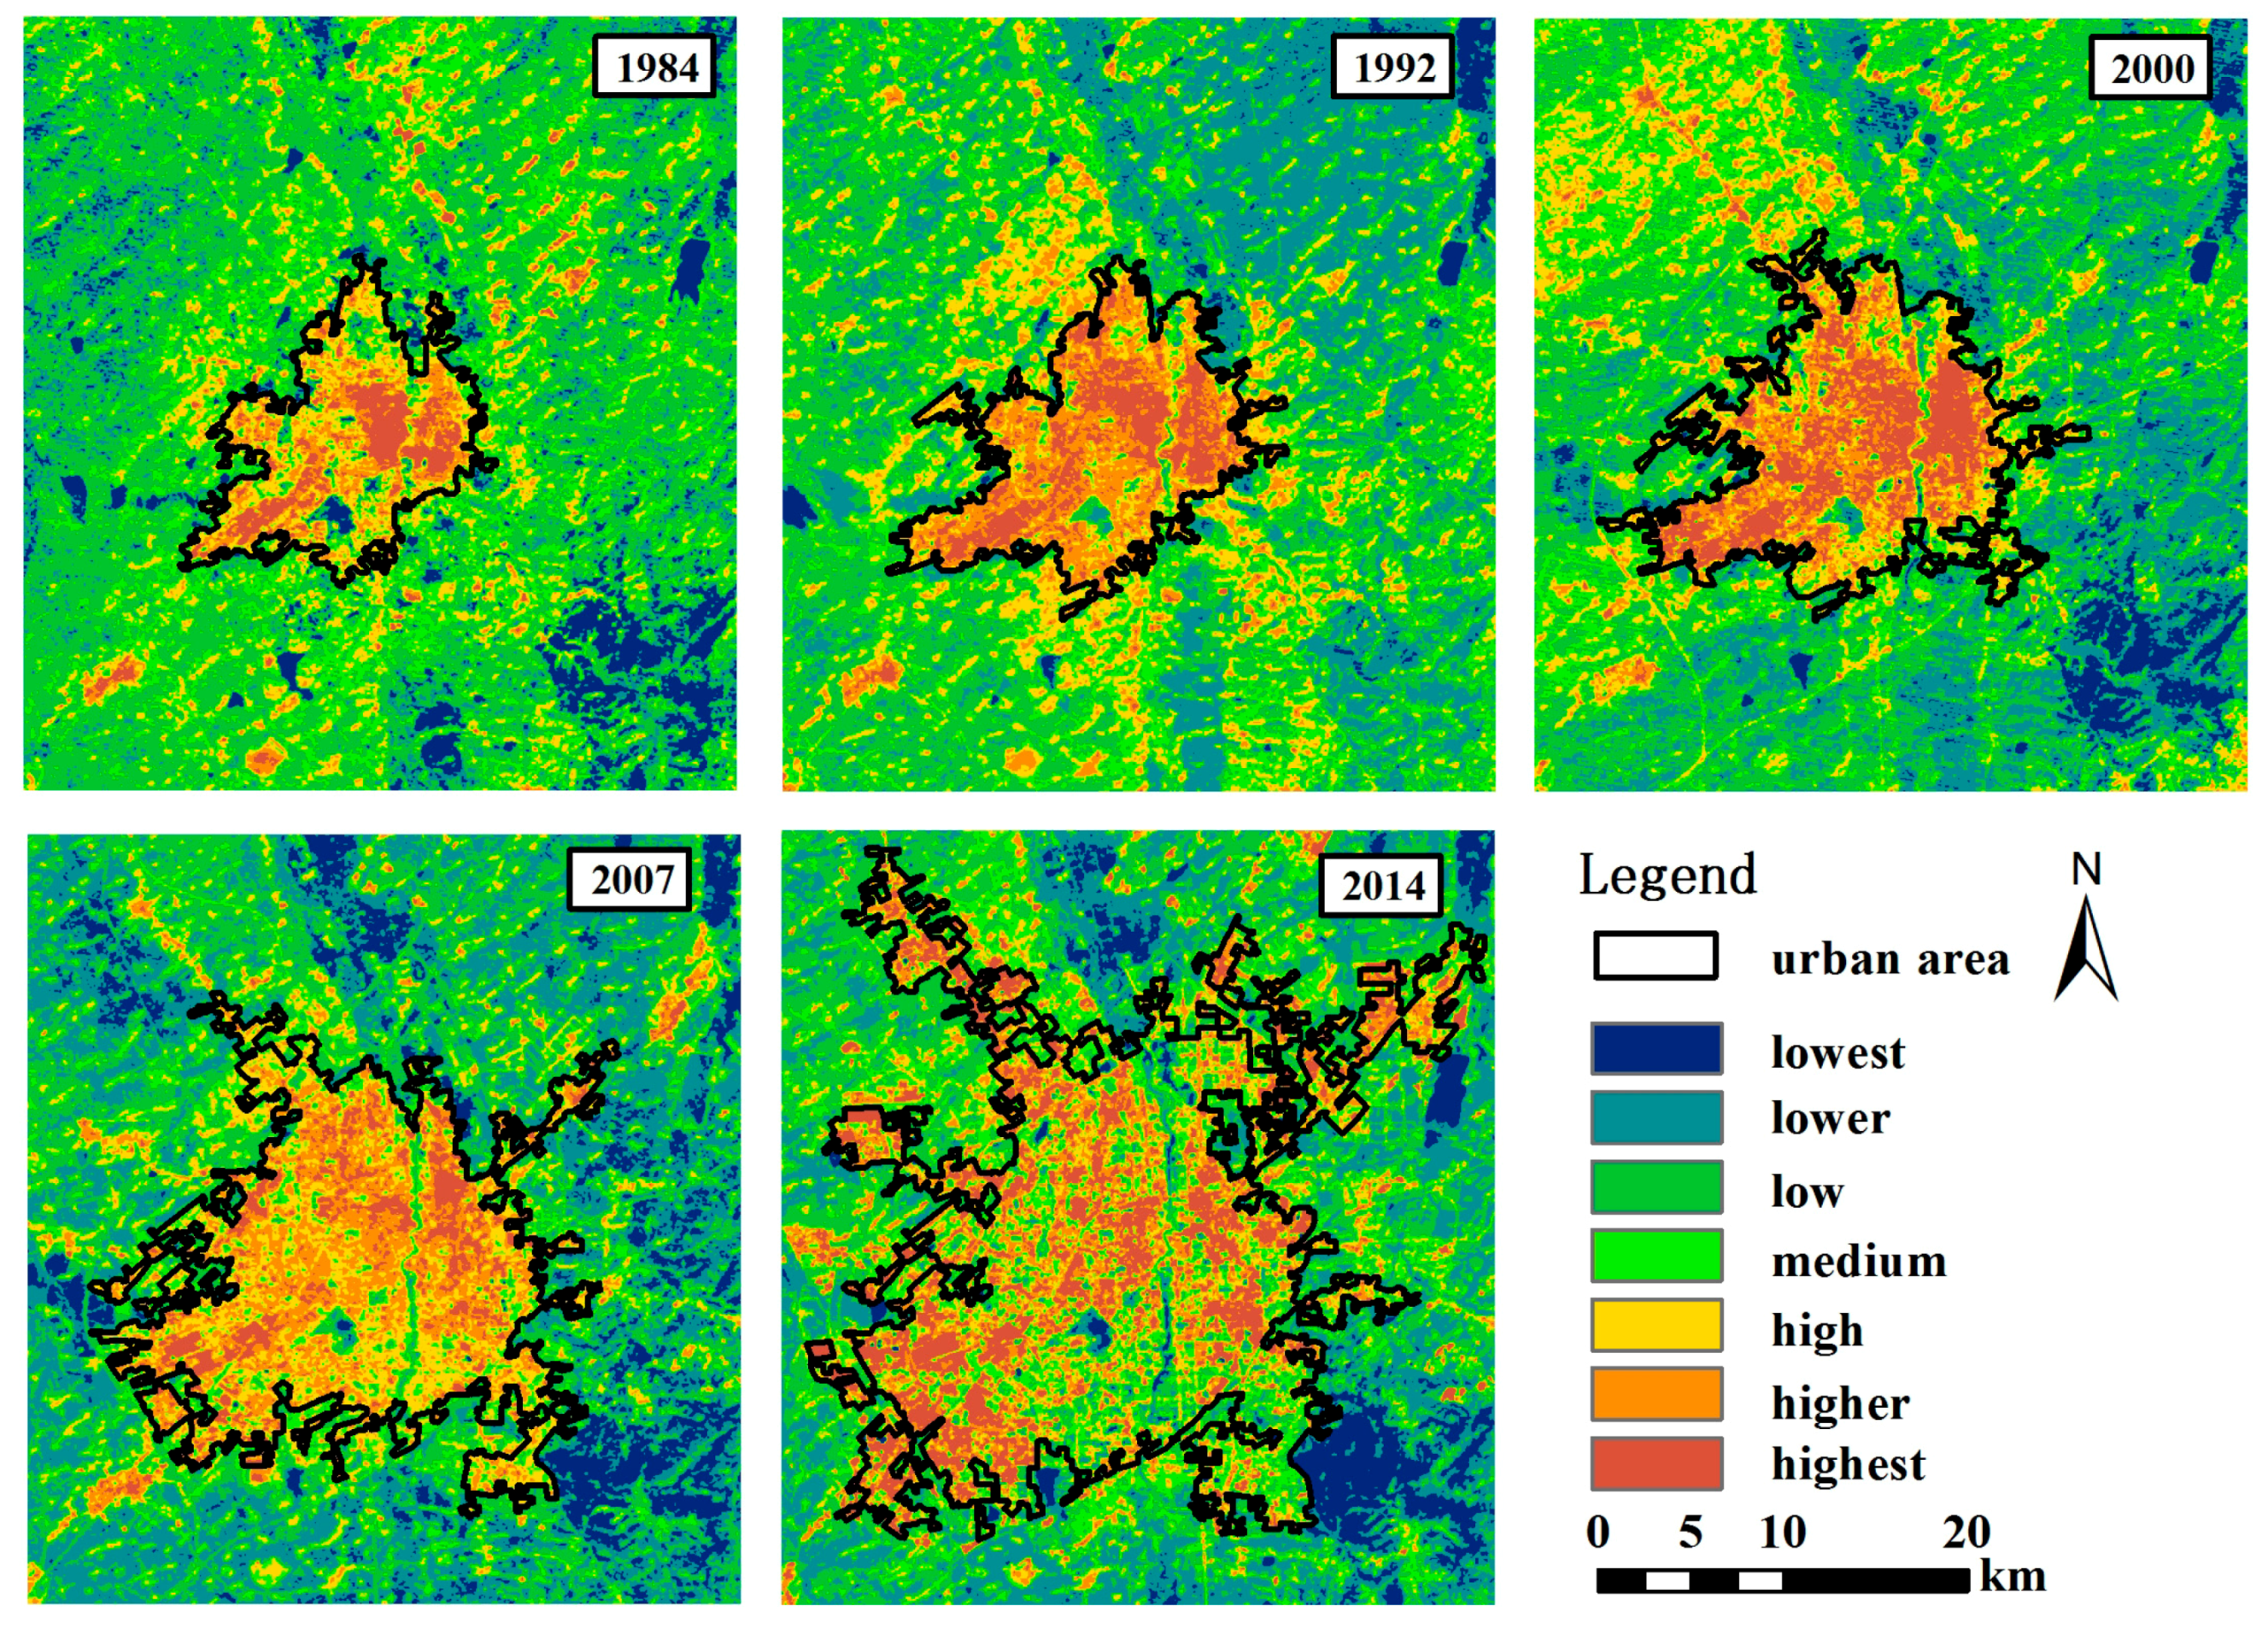
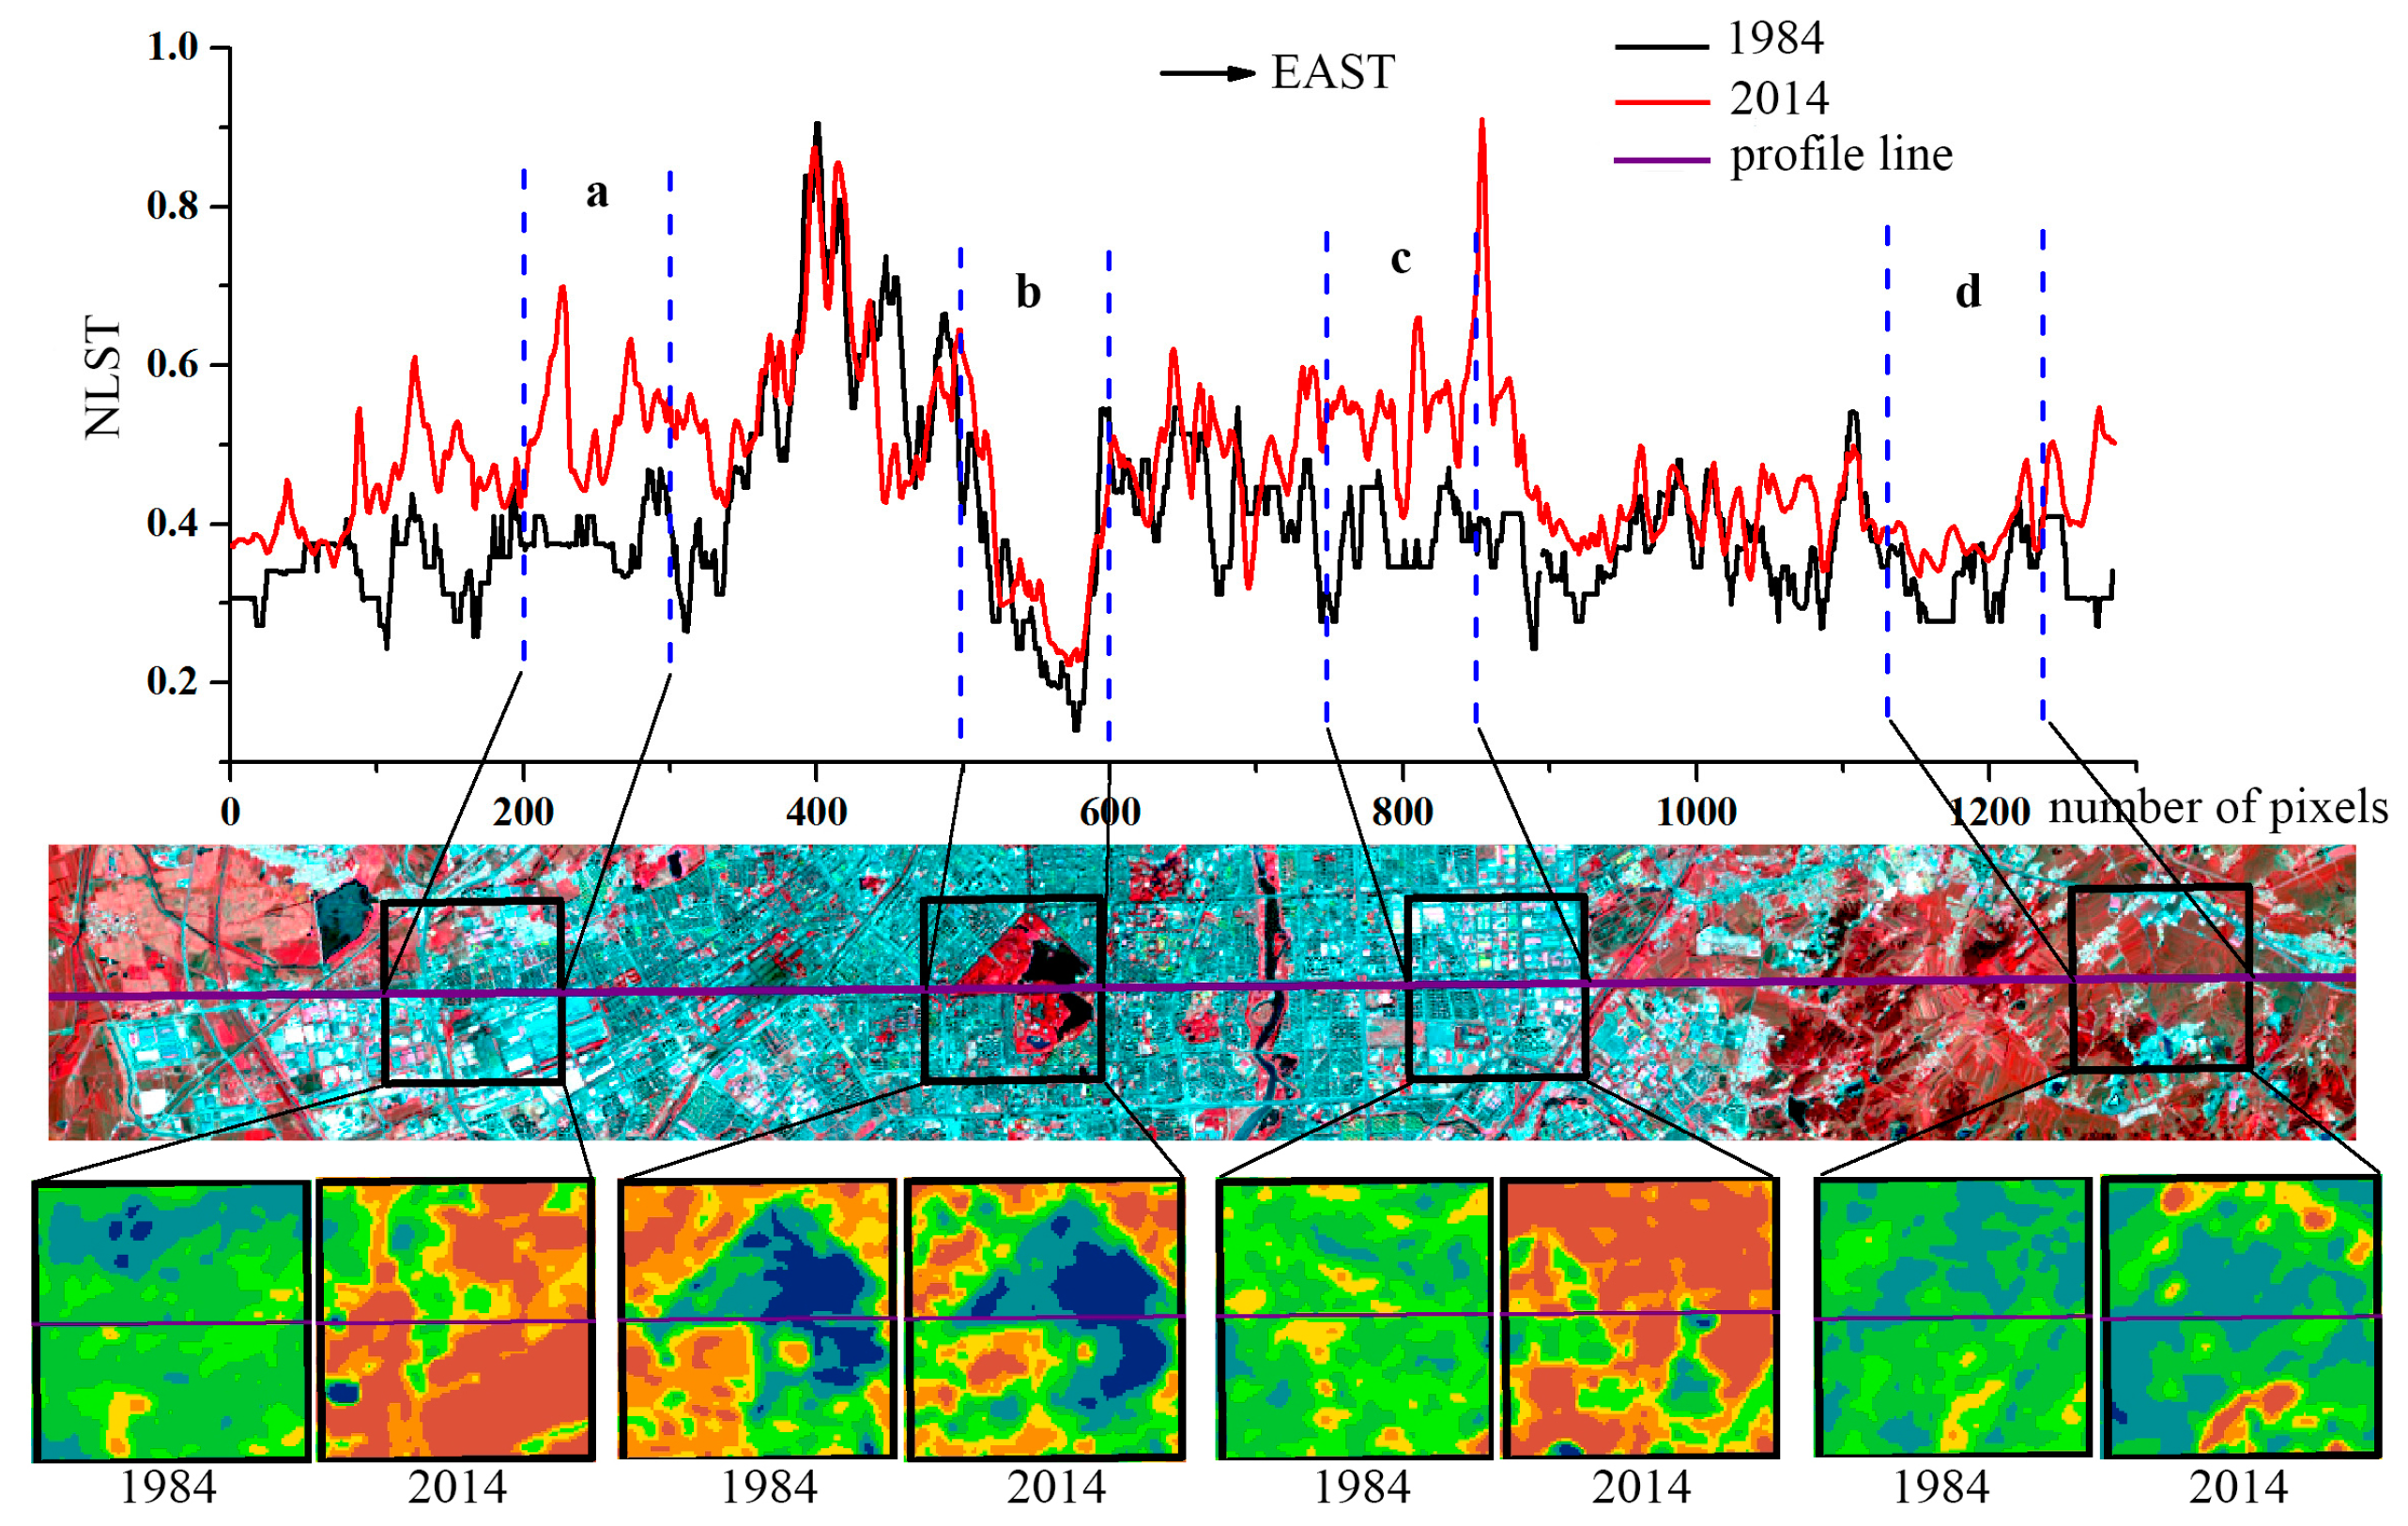
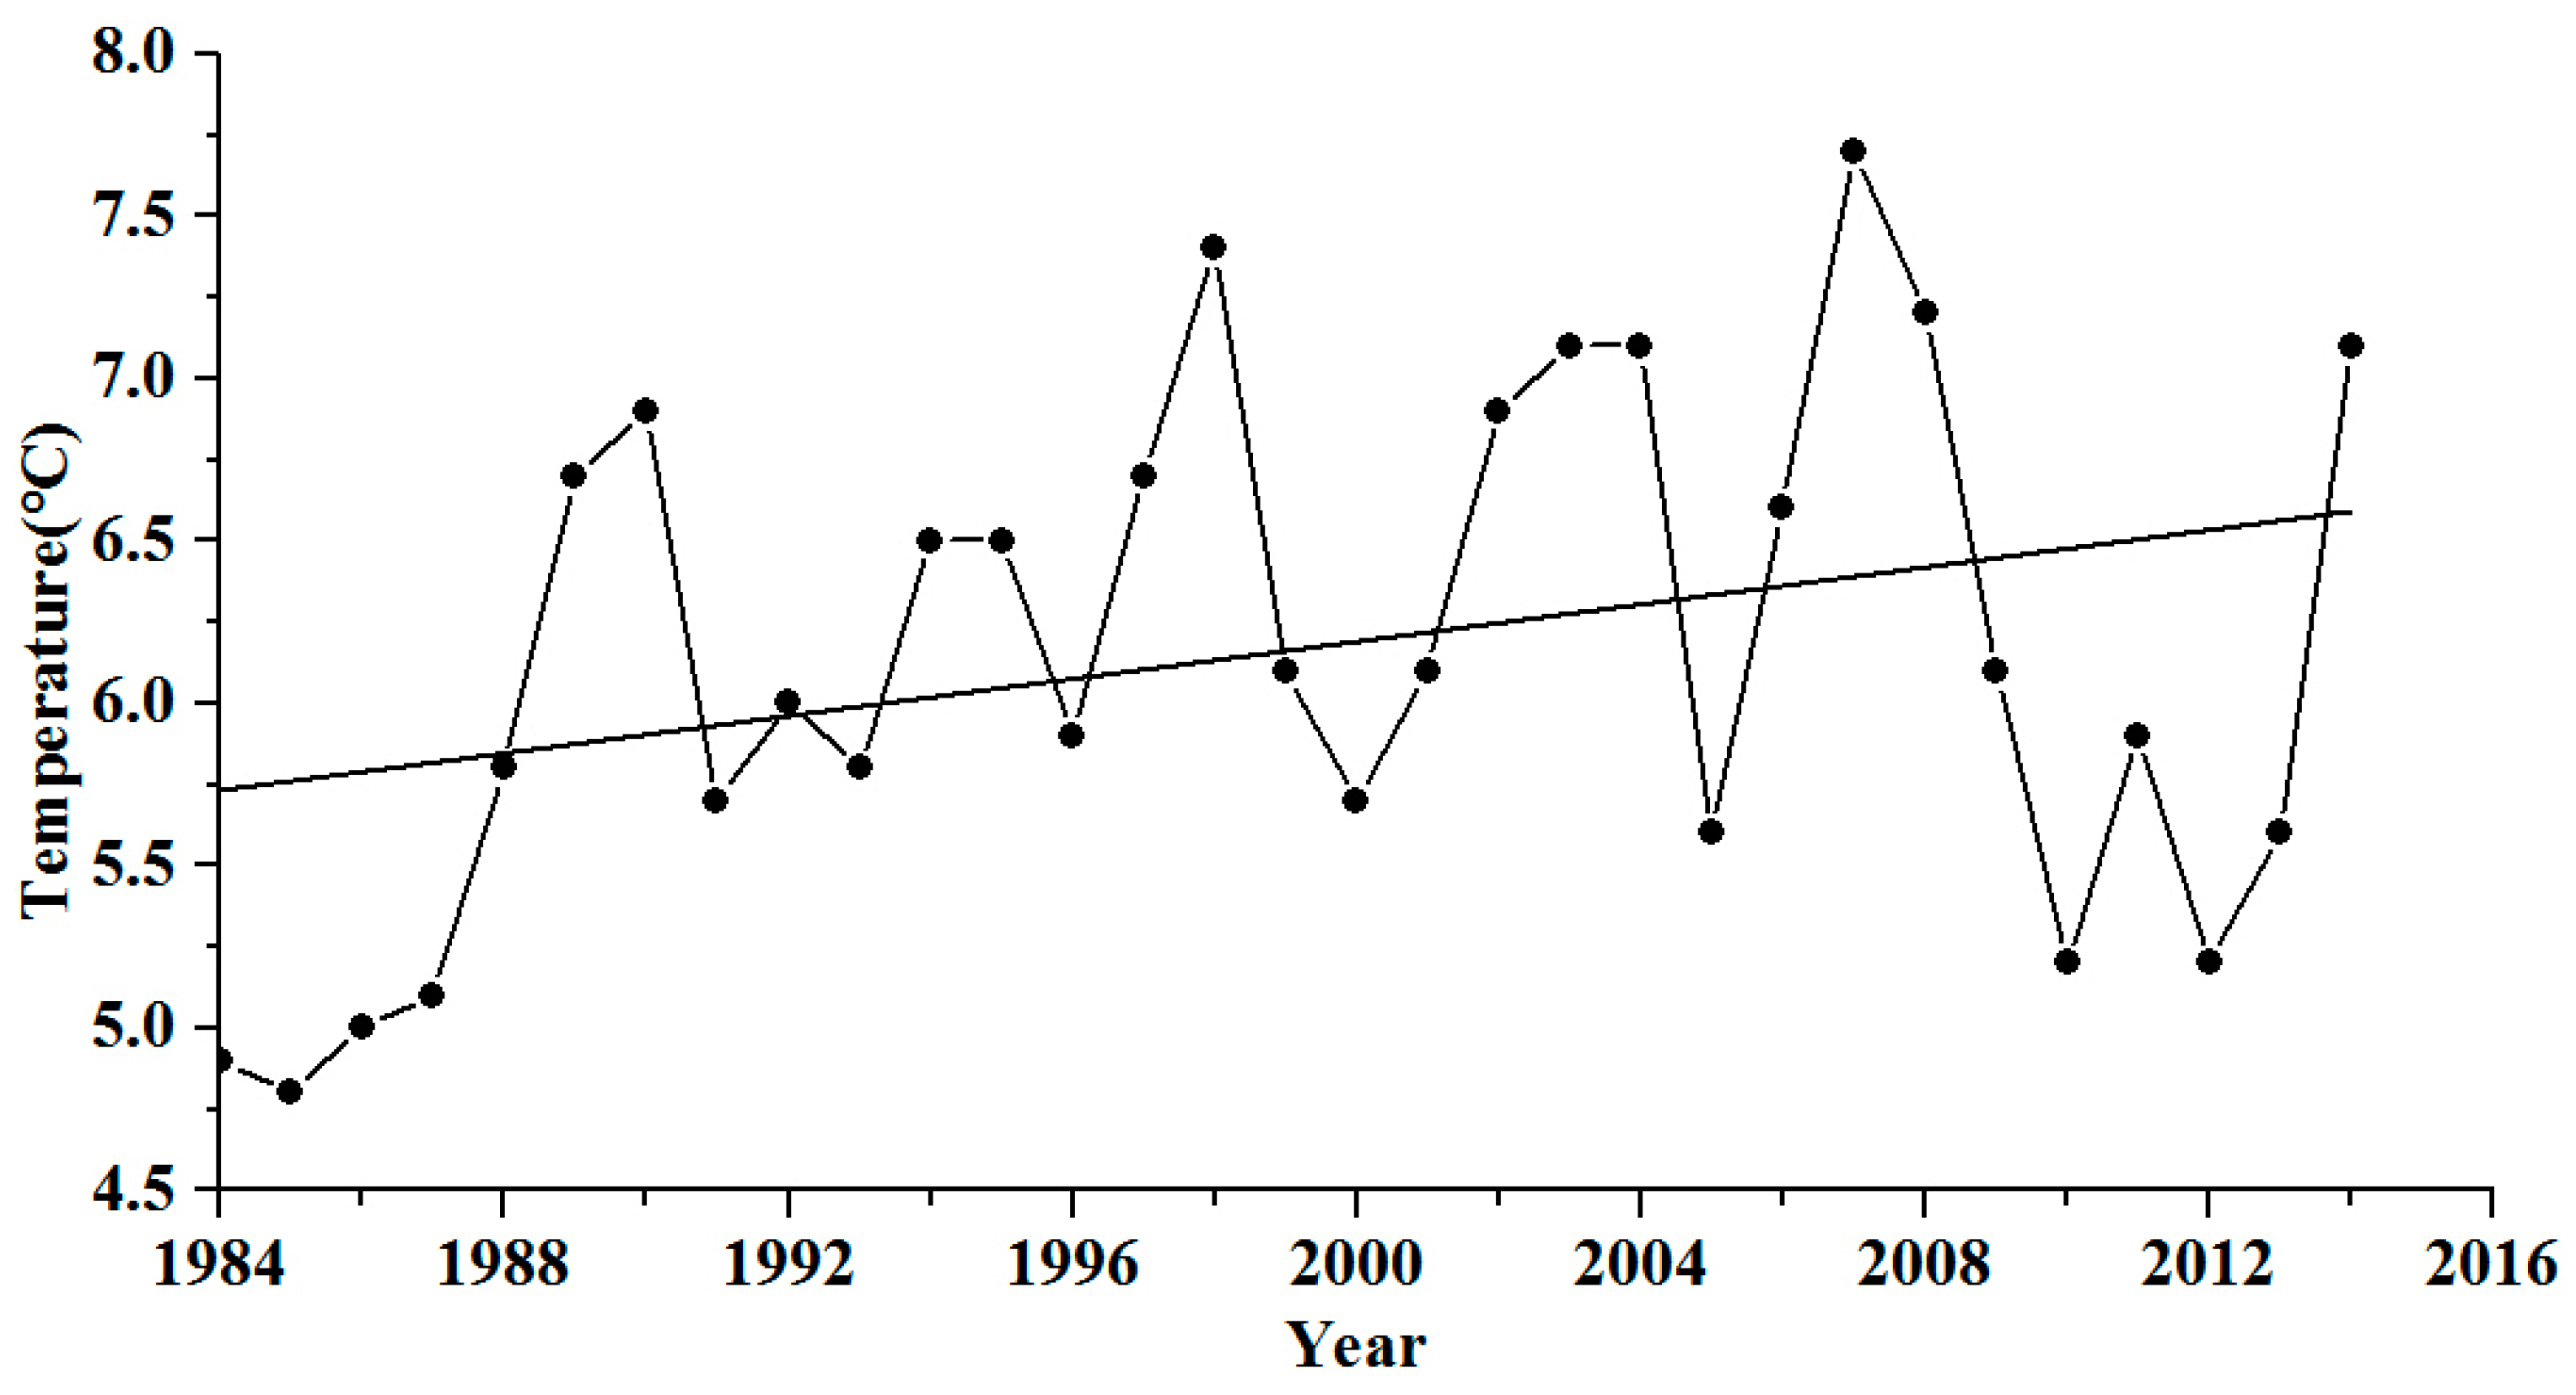
3.1. Spatiotemporal Distribution of LST and Statistics
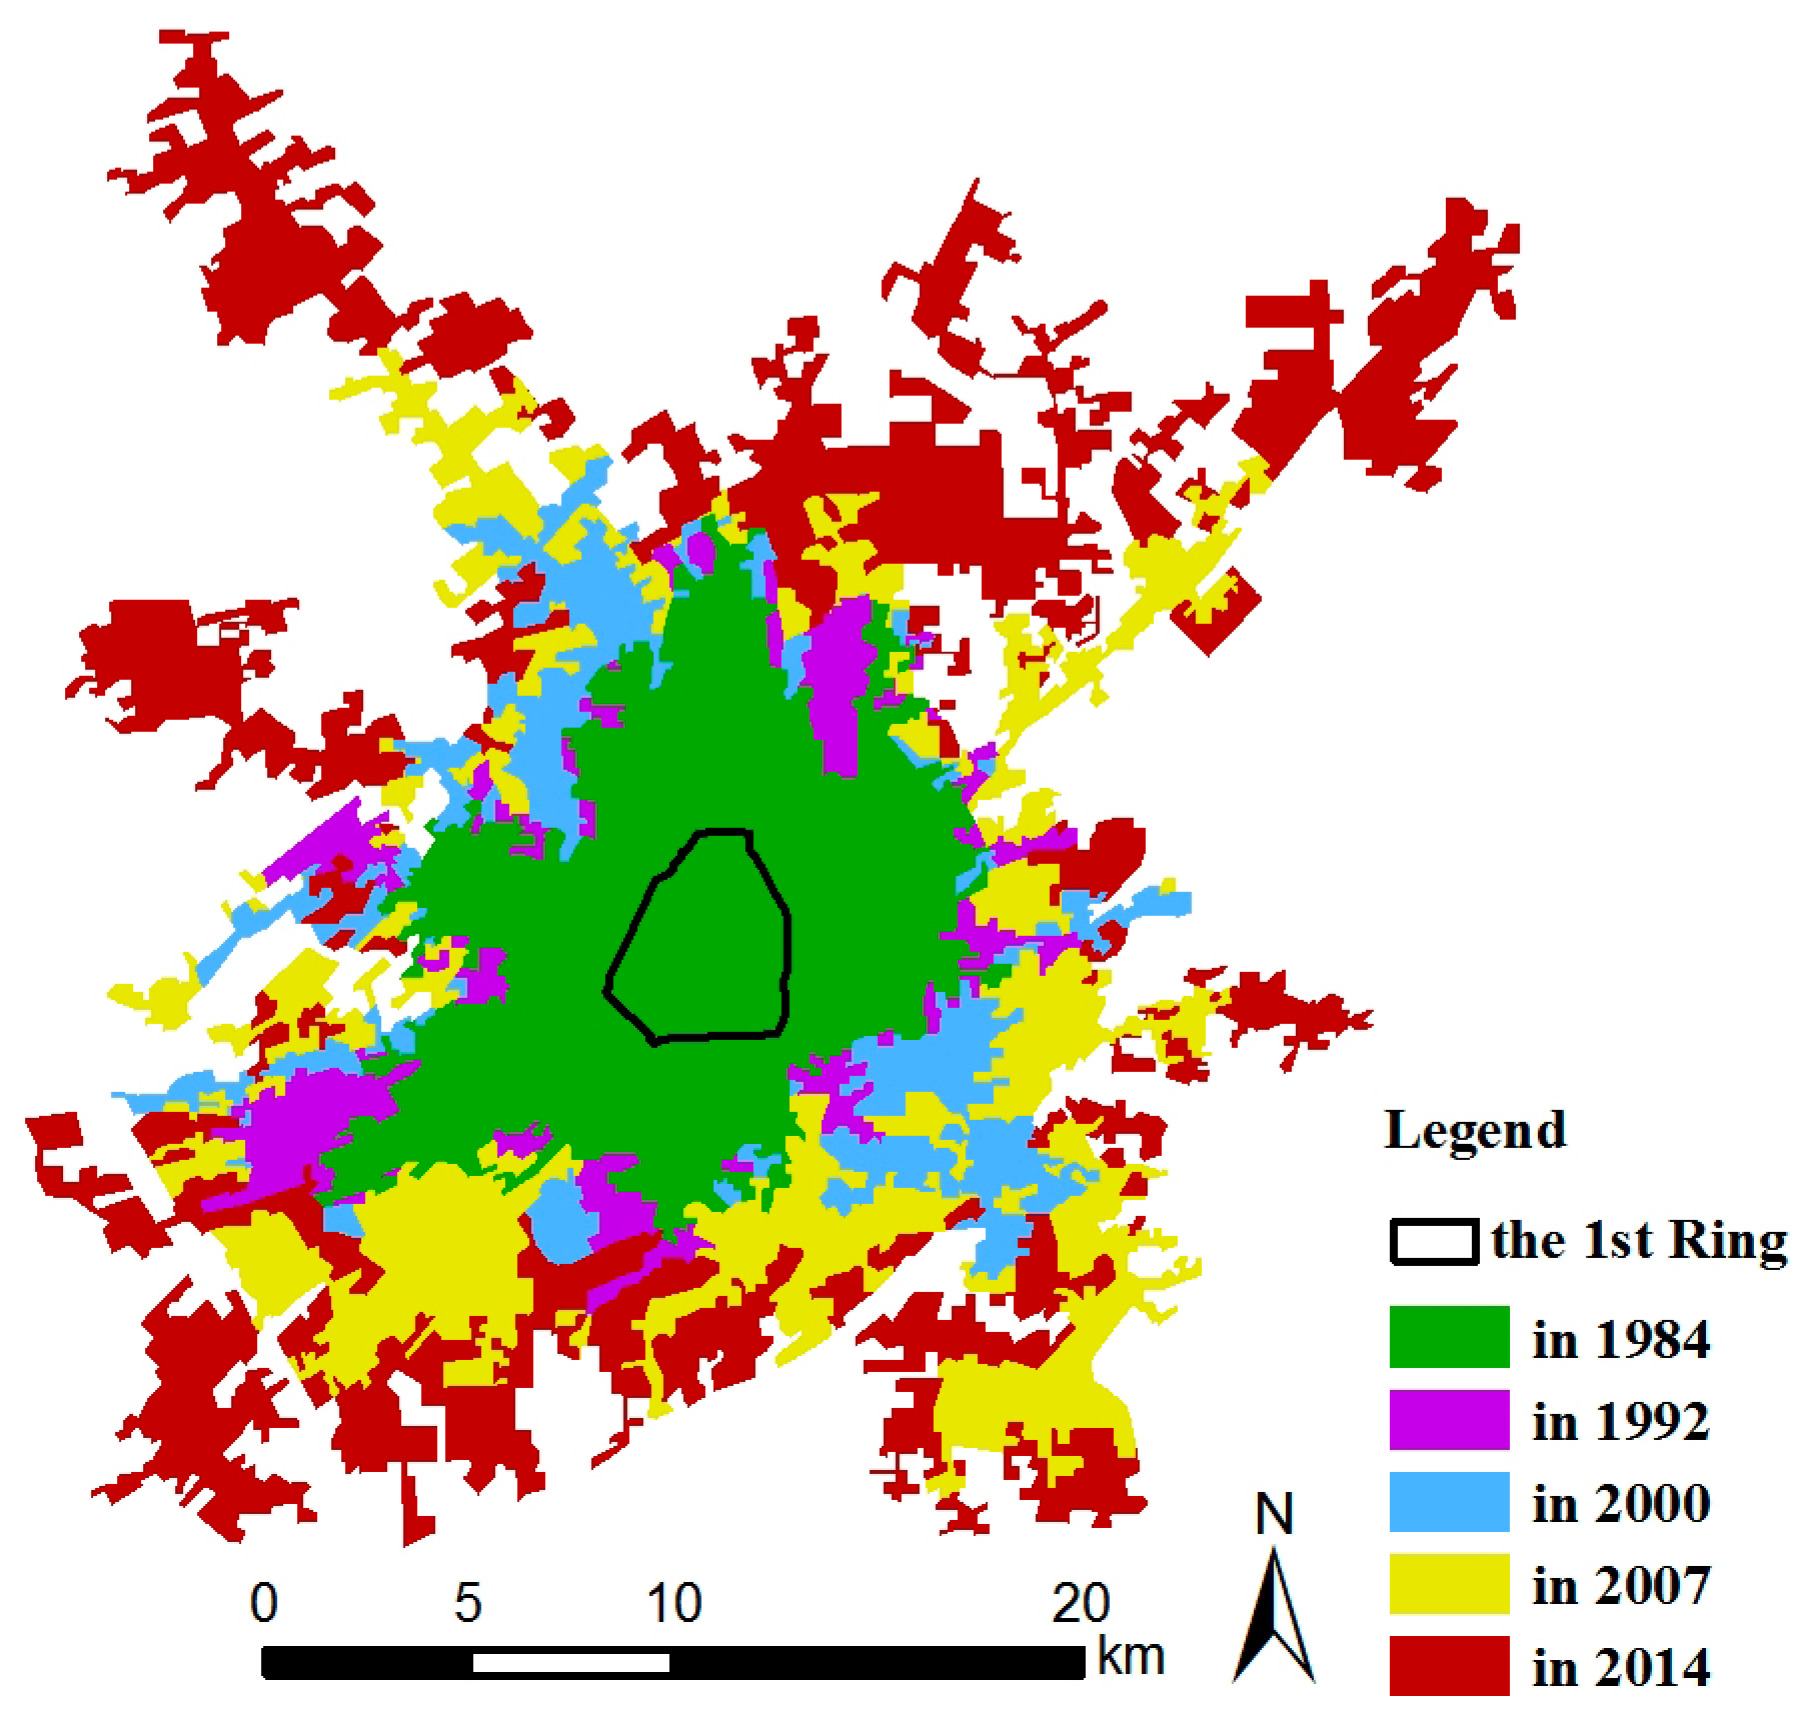
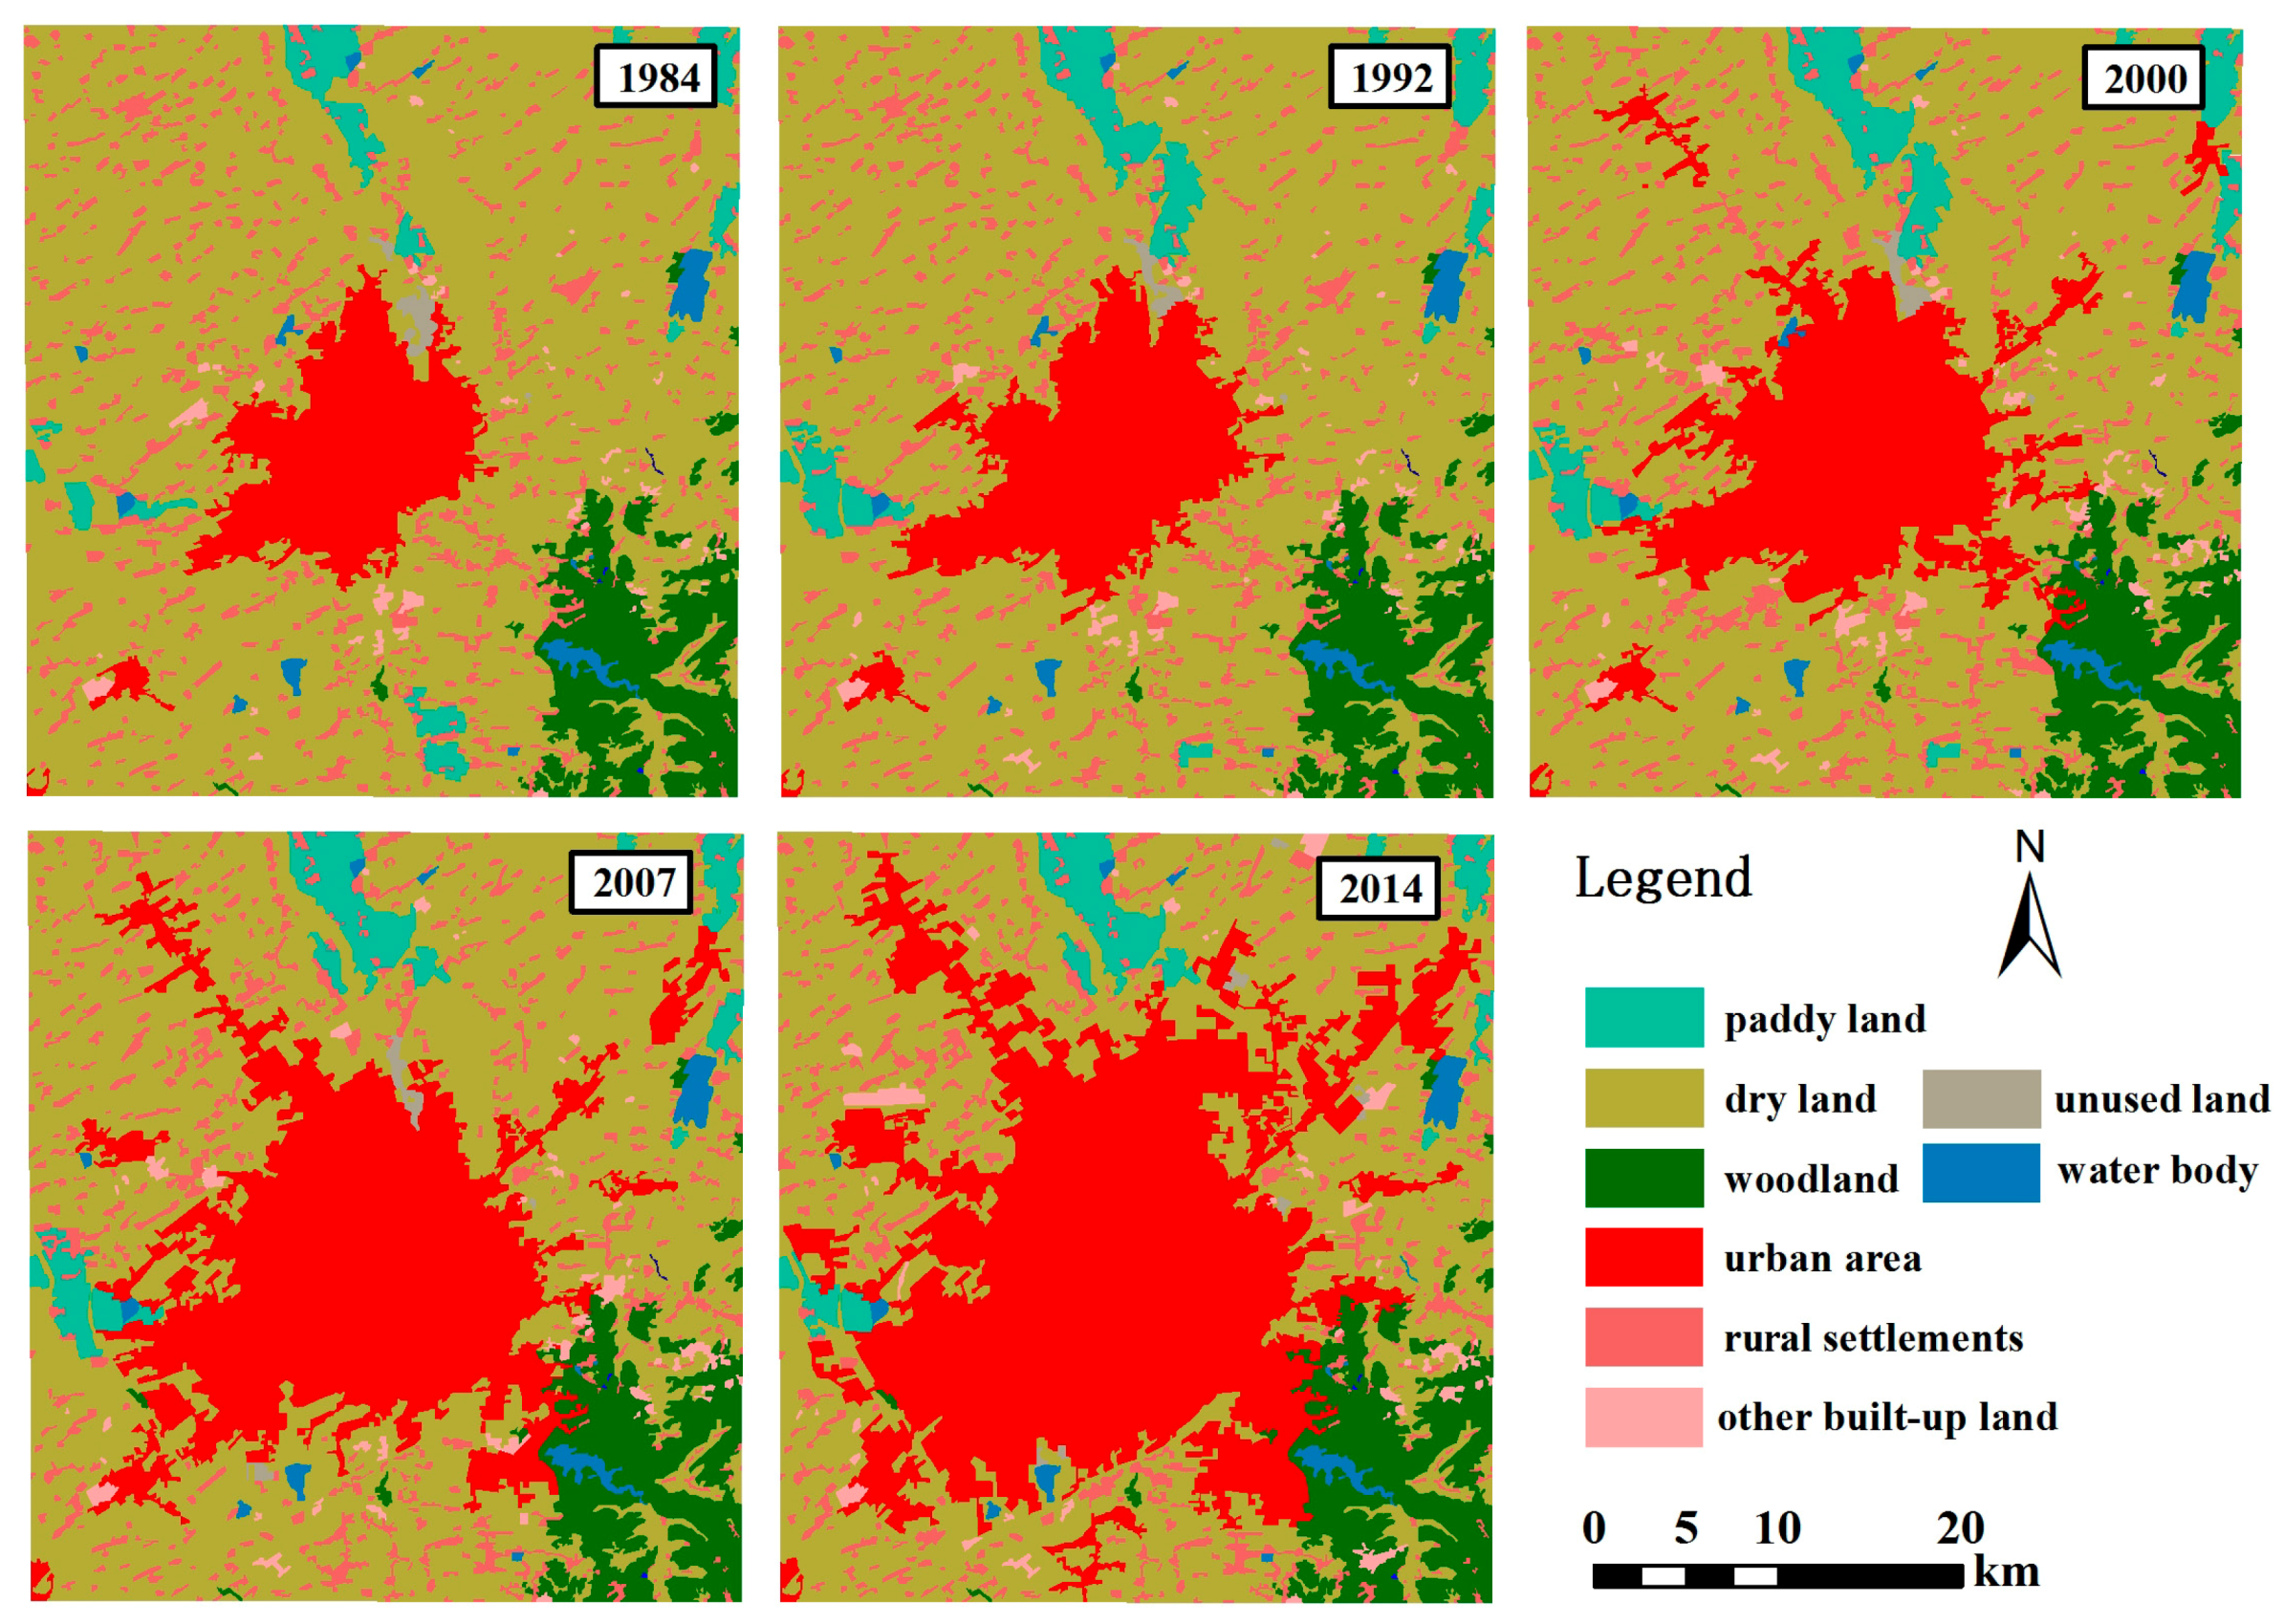
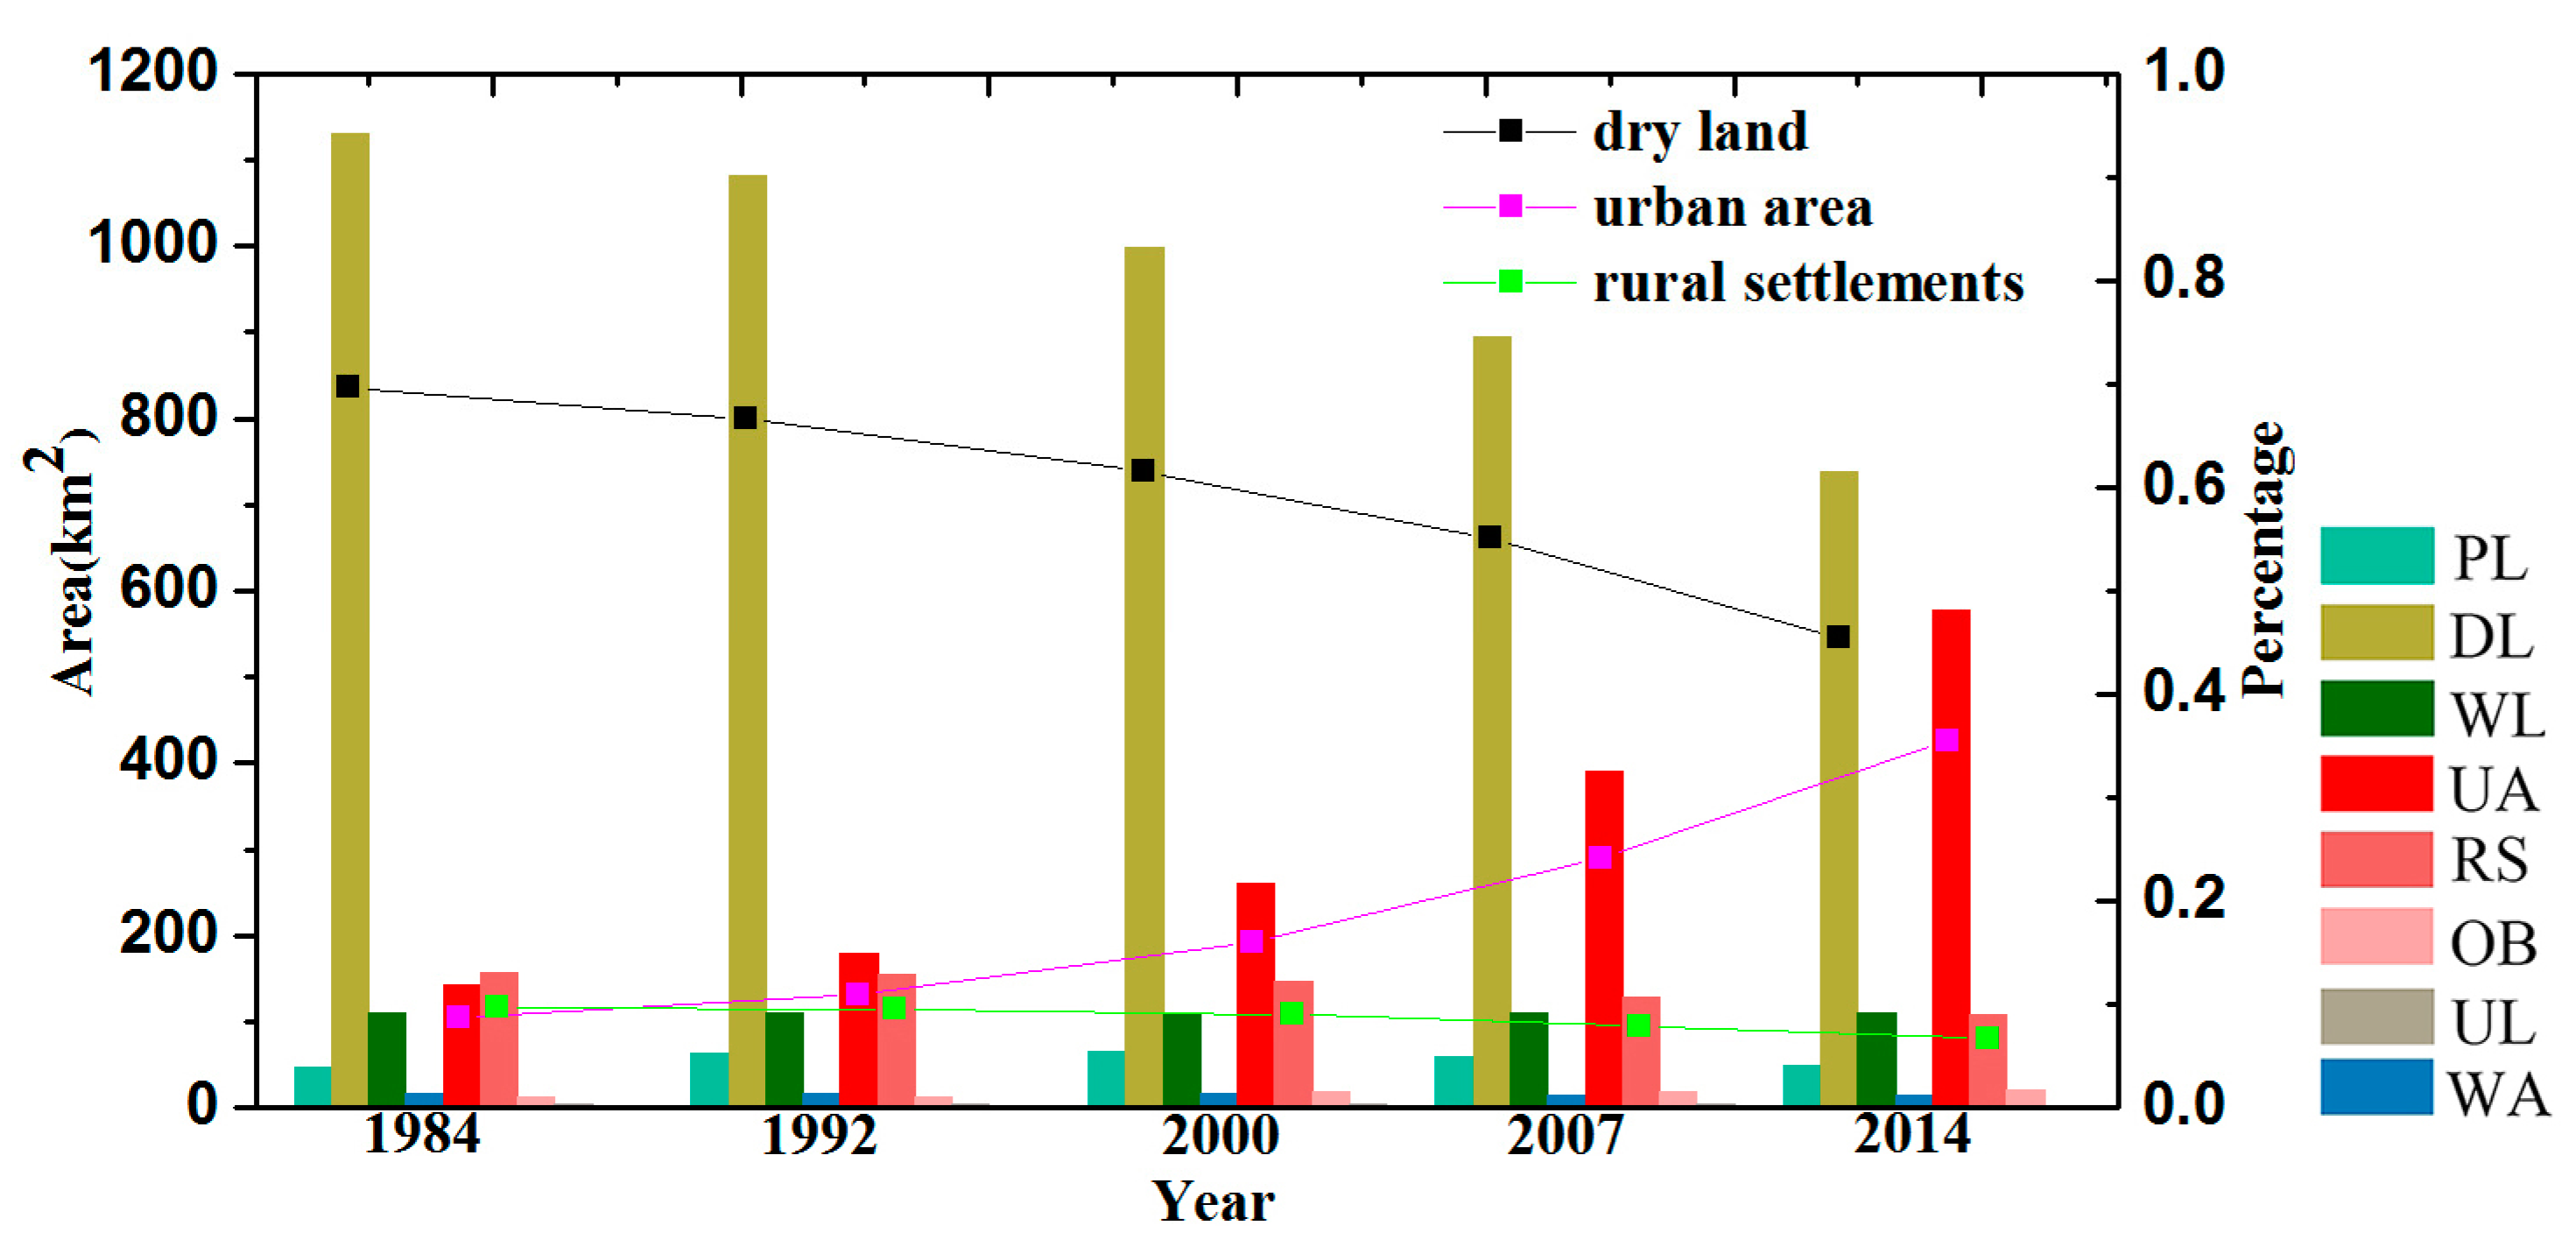
Based on the LST retrieval algorithm mentioned above, the 30-year Landsat LST maps were generated and are shown in Figure 3 to not only measure the magnitude of LST, but also to make it possible to quantify LST spatially explicit over the whole study area. In order to display the LST map clearly, the density slice function in ArcGIS 10.2 was used to distinguish the LST zones by different colors.
From the perspective of the spatial characteristics, it showed that the temperature of urban areas was consistently higher than that of rural areas for all the years. In urban areas, the apparent hot spots with the highest LST—the China FAW Group in the southwest, the commercial district in the central area, and the industrial district in the east—could be identified easily. Although the LST in urban areas tended to have higher values, there were still relatively low LST zones, especially in 2014, indicating that both the water and vegetation areas were among the lowest or lower LST zones. By comparison, in rural areas, the forest in the southeast region of the study area and the lake areas had the lowest LST values. Similarly, there were also some high or higher LST regions in the rural areas where there were rural settlements and not much else.
The spatial dynamics of LST showed dramatic changes during 1984–2014. The most remarkable phenomenon was that the area of UHIR had increased tremendously. This was mainly because dramatic changes had taken place in the LUCC patterns which had great influence on the thermal environment. A large amount of cropland, including paddy land and dry land, have been translated to artificial buildings consisting of asphalt, cement, metal, and other chemical materials during this period. In the early years, the highest zones were found inside the urban area, and the higher or high zones had a scattered distribution that looked like an isolated island. As time went by, the isolated hot island had been merged into the central area gradually, creating a larger heat island.
Different from the early years, there were several hot spots in 2014 and the distribution of higher and highest zones were not as concentrated as before. It may be due to the fact that the city had been divided into several different function zones. The average NLST values of the whole study area were 0.51, 0.55, 0.63, 0.62, and 0.68 in 1984, 1992, 2000, 2007, and 2014, respectively. Table 4 showed the area proportion of different NLST zones and UHIR of the whole study area in different years. The UHIR in 2014 accounted for 29.62% of the whole area, which was 15.27% in 1984, indicating that more area would suffer from the effects of UHI. Both the area of higher zone and highest zone have increased, generally, from 1984 to 2014, and after 2007, there was a more obvious increase rate. The area of the low zone had decreased from 45.89% in 1984 to 26.38% in 2014, indicating that a large amount of natural surfaces had been transformed into artificial surfaces.
Near-ground air temperature collected from local meteorological stations were used to validate the precision of the retrieved LST from Landsat images. The average LST of the 9 × 9 pixels near the meteorological station was compared to the air temperature, and the average satellite-based LST was about 3.8 °C higher than the average air temperature in 2014, which was reasonable in terms of previous studies [56]. It is well known that performing LST accuracy assessments is a complex and difficult task due to the scale effect and the difficulty to obtain in situ LST data [25]. After the process of normalization, in summary, the retrieved LST can reflect the evolution process of the thermal environment.

3.2. LUCC Dynamics

Figure 4 demonstrated the dynamics of LUCC in the study area in the past 30 years. It is clear that Changchun has experienced a rapid process of urbanization and the LUCC patterns have changed considerably. Among the eight land use classes, the area of woodland, water, and unused land changed little; the area of paddy land had fluctuations depending on the availability of water; the area of dry land and rural settlements had a continuously decreasing trend, while the urban area and other built-up land had been expanding continuously.
Thus, we focused on the changes of the urban area, rural settlements and dry land (Figure 5 and Table 5). The urban area had increased from 143.51 km2 in 1984 to 577.45 km2 in 2014 with a mean annual expansion area of 14.46 km2. Especially, from 2007 to 2014, the urban area increased by 185.87 km2 with the largest expansion rate. During the whole study period, dry land was the major contributor (76.82%) followed by rural settlements (17.81%) to the new emerging urban area. For the latter transformation, small towns expanded gradually by merging surrounding smaller settlements and becoming small urban areas. These small urban areas were ultimately merged into the main urban areas. The area of dry land has decreased from 1130.12 km2 in 1984 to 737.70 km2 in 2014, a decrease of 34.72%.

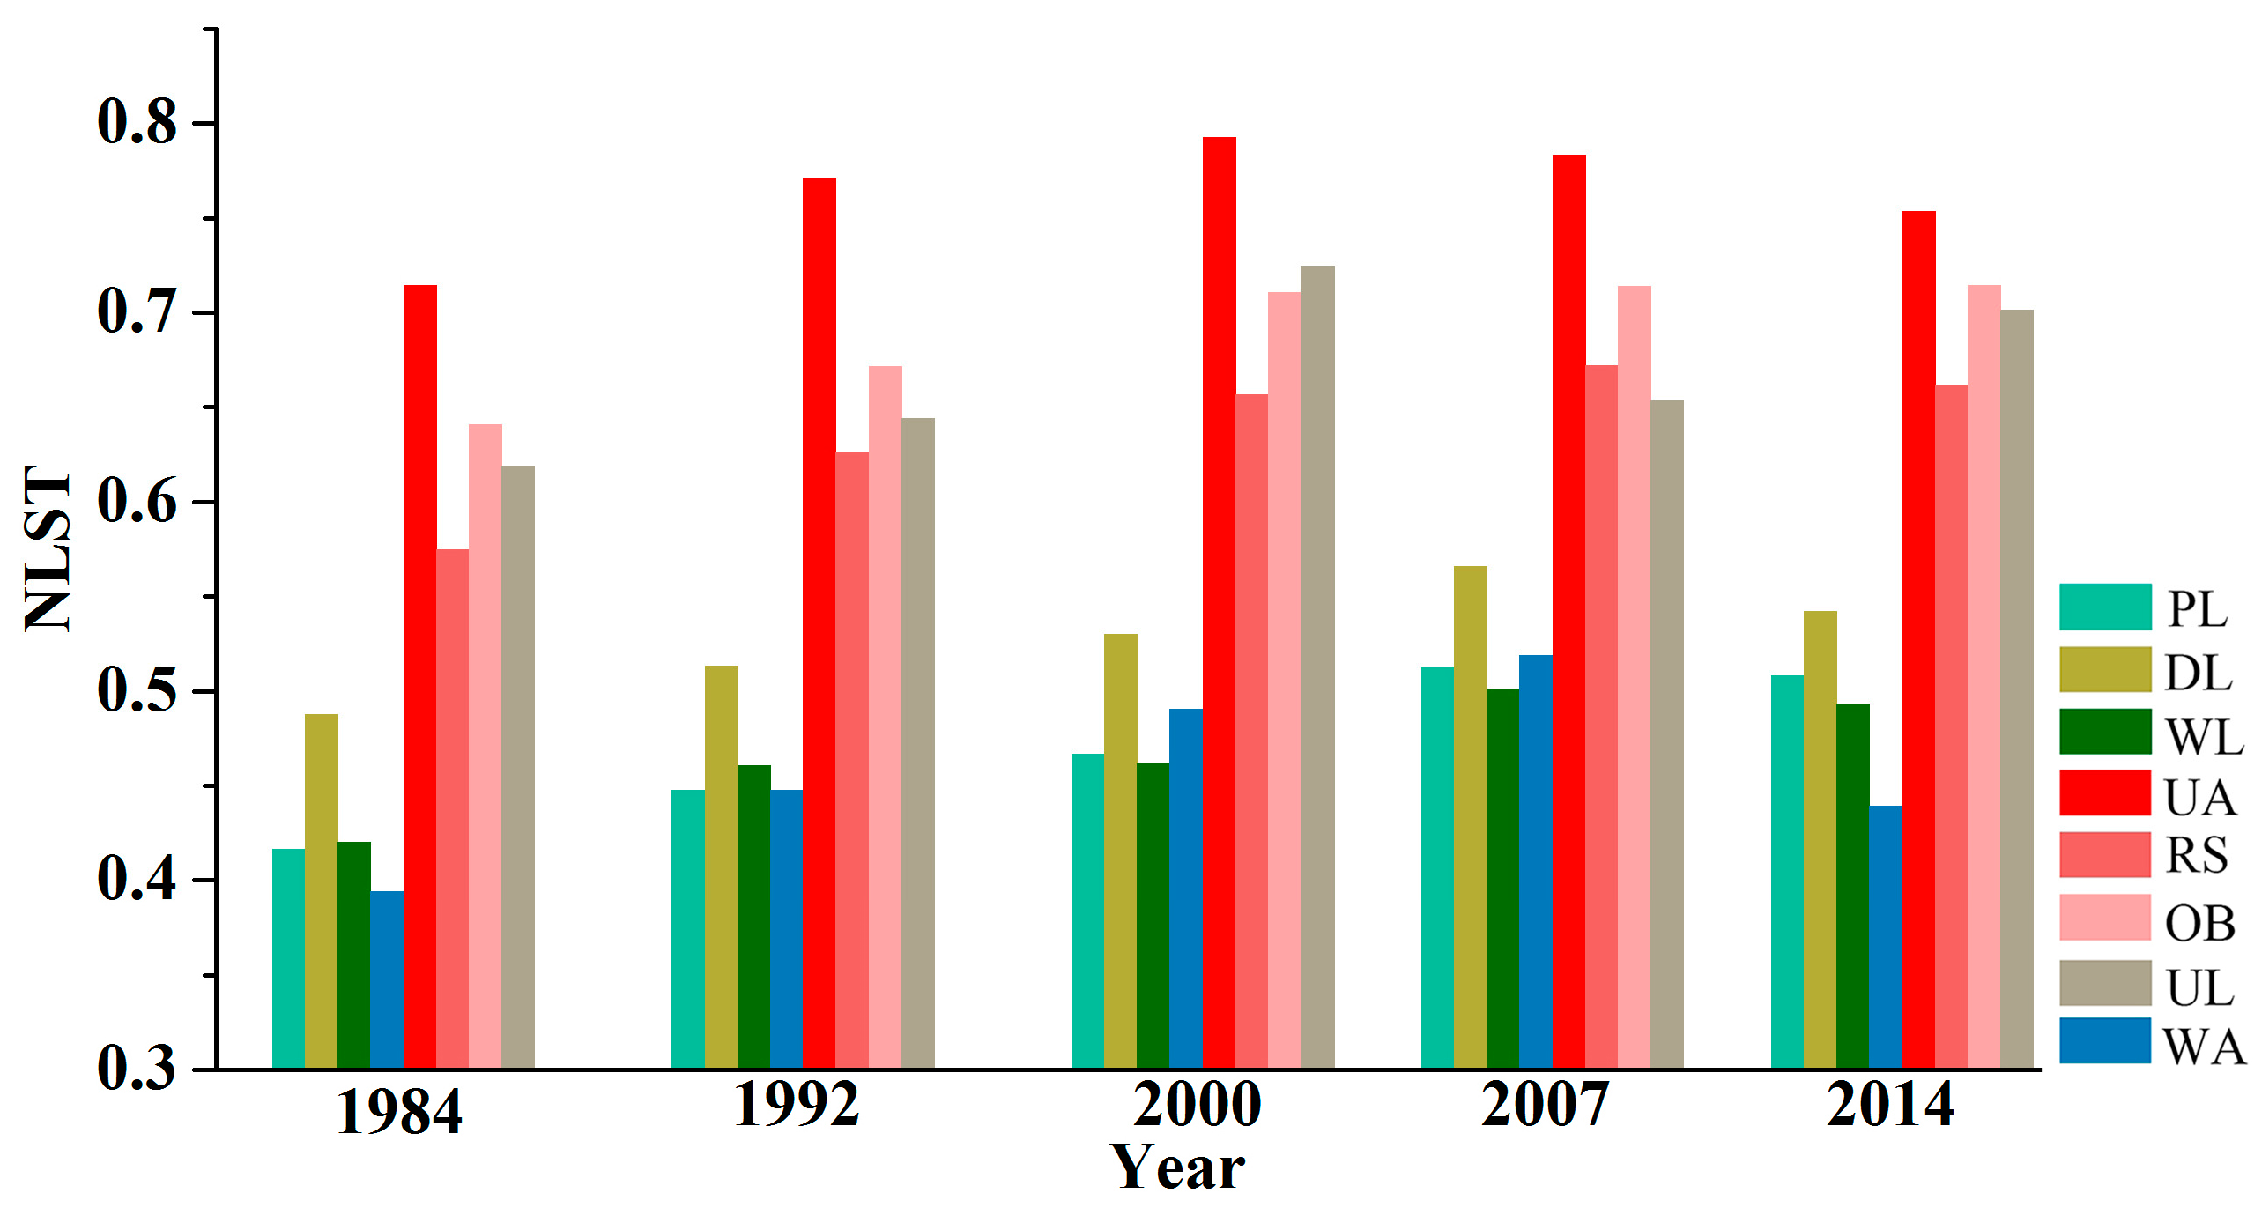
3.3. The Difference of NLST among Land Use Classes

The distribution of LST is the reflection of the patterns of land use types with different thermal characteristics. Zonal Statistic in ArcGIS 10.2 was used to quantify the differences of NLST among different land use classes, and the results were shown in Figure 6. It showed that the NLST of different land use types had obvious differences. Based on the mean annual values of NLST, urban areas had the highest NLST (0.76) and was followed by other the built-up areas (0.69), unused land (0.67), rural settlements (0.64), dry land (0.53), paddy land (0.49), woodland (0.47), and water areas (0.42). Urban areas are always linked to buildings and denser population. The thermal characteristics of chemical materials abates surface evaporation and enhances the sensible heat flux, together with anthropogenic heat sources, making the urban area become the hottest regions. Other built-up areas and unused land usually have little vegetation cover. As a result, both of them have relatively higher NLST. Previous studies showed that the vegetation could reduce UHI through two major processes: shading and evapotranspiration [57,58]. Thus, land use types with high vegetation cover tend to have lower NLST. The heat capacity of water is higher than other types, so the temperature of water bodies is lower in the daytime.
In order to investigate the impacts of LUCC on LST, and to show the explicit spatial influence, a profile from west to east was generated through the profiles tool in Envi5.3. Additionally, four samples with 100 × 100 pixels were selected on the profile. Two of them (a and c) were on the edge of the urban boundary and had dramatic changes in land use. The left side of sample (a) and the right side of sample (c) were the left and right boundaries of the city, respectively. Sample (b), which had little changes in land use, was located inside the city while (d) was in the rural area and also faced few land use changes.
As shown clearly in Figure 7, the NLST on the profile had considerable fluctuations from west to east. The phenomenon that the temperature of urban areas tended to be higher than that of rural areas was apparent in both 1984 and 2014. The NLST of urban areas also had big differences. This was because the environment of the urban area was very complicated and the surface features can change greatly in a very short distance. For example, sample (b) is the largest park, named “South Lake Park”, in Changchun whose NLST is lower compared to surrounding areas. For samples (a) and (c), the changes of land use patterns lead to the significant changes of the NLST distribution. Based on the statistics in this study, on average, the NLST can increase by 0.21 when the natural landscape was transformed to impervious surfaces. For sample (b), there were almost no changes in NLST as the surface features were almost identical. For sample (d), compared to 1984, several small hot spots emerged as some industrial or mining districts appeared. There is no denying that urbanization can change the thermal environment considerably. Therefore, when mitigating the negative effects of UHI, it counts a significant amount to optimize the land use planning by reasonable allocations of different land use types.

3.4. The Changes of UHI Intensity

As mentioned before, two kinds of UHI intensity were used in this study, SUHI and ISUHI. The largest difference between them lies in how to represent the NSLT of urban areas. In the traditional ways, the mean NLST of the whole urban area is used to represent the NSLT of urban areas. While, the mean NLST of the first traffic ring inside the city is used in ISHUI. Figure 8 showed the boundary of the urban area in different years and the same first traffic ring boundary.
Figure 9 shows the changes of the intensity of UHI during the study periods. From Figure 9, a very interesting phenomenon was that the SUHI and ISUHI showed different change trends. The values of ISUHI in 1984, 1992, 2000, 2007, and 2014 were 0.341, 0.348, 0.346, 0.359, and 0.374, respectively. The ISUHI generally has an upward trend. In comparison, the values of SUHI in 1984, 1992, 2000, 2007, and 2014 were 0.225, 0.249, 0.252, 0.243, and 0.239. SUHI increased before 2000, but decreased from 2000 to 2014. According to the information collected from the National Economy and Society statistical bulletin of Changchun from 2000 to 2014, the area of green space in the built-up area of Changchun has increased from 6058 ha (38.1%) in 2000 to 18,244 ha (41.5%) in 2014. The increase of the area proportion of the green space may explain the decrease of the SUHI of Changchun since 2000, to some extent. As shown in Figure 8, the area of urban regions has increased a great deal since 1984. Therefore, it does not mean that the larger area of urban regions can generate stronger UHI intensity. This interesting question motivated us to conduct further research.
Urban impervious surface area (ISA) is one of the most important indicators to characterize the degree of urbanization and environmental quality [56]. Using the methods mentioned above, Figure 10 showed the statistics of the ISA of the whole urban area and first traffic ring line. It can be seen that the percentage of ISA in the first ring has continuously increased from 1984 to 2007 and approached saturation since 2007. Although the area of urban region has been increasing since 1984, on the contrary, the percentage of ISA of the whole urban area has decreased since 2000. This can be explained by two main reasons. First, the new emerging urban area added to the old ones may have a low ISA value; Second, more water and green space were placed in the old regions to decrease the ISA of the whole urban area.
Comparing Figure 9 and Figure 10, the intensity of UHI corresponds well with the ISA values. The correlation coefficient of UHI intensity and ISA is 0.97 which indicates that the UHI intensity possess a strong correlation with the ISA. The intensity of UHI is influenced by many factors, such as the definition of UHI, the components and structure of urban area and the proportion of cooling land use types like water bodies and woodland.
In order to quantify the relationships between NLST and ISA, 300 samples with 3 × 3 pixels were selected in the urban area in the year 1984 and 2014. A zonal statistics tool was used to calculate the mean values of NLST and ISA for each sample. Then regression models were further performed with the help of SPSS 19.0 (provided by International Business Machines Corporation). The two dimensional scatter plots between NLST and ISA were shown in Figure 11. We can see that there are more high values in 2014 than 1984, indicating that there are more artificial surfaces in these samples.
Additionally, positive linear relationships between them were found in both years, but in 2014 the NLST had a stronger relationship with ISA than that of 1984. Why is the relationship stronger and the scope larger in 2014? In other words, why is the UHI intensity stronger in the sample with the same values of ISA in 2014 compared to that of 1984? One possible reason is that although the value of ISA is same, there are more buildings in the sample (the sample is more dense) or the buildings are taller, which would generate more heat.

4. Discussion

As an emerging science, remote sensing, with the advantages of wide coverage, good temporal synchronization and various data sources, has been widely used in UHI studies as a supplement to traditional approaches, which have been conducted by ground-based observation taken from standard height metrological stations [24,26,59]. The definition of UHI is clear. However, the most fundamental issue are the ways to measure UHI from the perspective of remote sensing. In this study, five-stages of Landsat data were used to provide a clear picture of the spatio-temporal changes in the patterns of LUCC and the thermal environment. Mapping the UHI intensity is very important because it can provide more explicit spatial information about the thermal environment. Additionally, two methods were used in this study to quantify the changes of UHI intensity, but yielded different results. It is difficult to say which method is better than the other and difficult to conclude the change trend of UHI intensity of Changchun in the past 30 years; is it stronger or weaker? Both of the methods are reasonable. However, it will help to generalize a better understanding of the definition and measurement of UHI.
Based on the information provided by the maps of LUCC and NLST, we found several important characteristics of the process of urbanization and the impacts of LUCC on NLST. Firstly, in general, the urban regions have increased continuously since 1984, but after 2000 the expansion rate was much larger. This was because the central government of China proposed a policy to help promote the development of the northeast part of China in 2003 and 2006. With the stimulation policy, several small local towns around Changchun began to develop quickly and, ultimately, merged into the main urban area. Thus, the land use and development policy do make differences on urbanization; Secondly, the differences of mean NLST among land use types can be as high as 0.34. Therefore, the land use changes could lead to considerable changes on the thermal environment. In general, the most common transformation is from cropland to urban areas in our case. According to the mean values of NLST, when this transformation took place, the land would change from low or lower LST zones directly to higher or highest LST zones. During the analysis process, the profile method with samples made it very clear to show the impacts of LUCC on LST. This approach may provide some implications for other similar research.
This study also has some implications for urban and land use planning. Our results showed that inside the urban area, the LST could change dramatically in a short distance as a result of the complicated urban environment. We found that there was a very strong positive relationship between LST and ISA, which was similar to other studies [56,60]. A higher percentage of ISA leads to higher LST, and the effect of ISA on LST has become more and more apparent in recent years. That is because urban expansion not only lies in the size, but also in the height and density, of those spaces. In our case, a larger urban area does not mean a stronger UHI intensity. It is our opinion that the negative effect of UHI could be mitigated by altering the ISA of the urban regions. Specific advice and measures include adding more cooling land use, such as water bodies and woodlands in urban areas. We found, in our study, that the new land merged into urban regions had the effect of lowering UHI intensity because of a relatively low value of the ISA.
There are also some limitations in this study. It is better to use year by year Landsat data to explore the impacts of LUCC on thermal environments in a finer time scale which may provide more effective information for both the readers and policy-makers. However, it is difficult to gain quality images because of the poor atmospheric conditions. Second, more attention should be paid to the validation of satellite-derived LST, since no results from remote sensing data without validation can be used with confidence [25]. Finally, the characteristics of the thermal environment inside the urban area should be given more attention in future research.

5. Conclusions

It is important to understand the mechanism of the impacts of LUCC on the thermal environment for better urban planning and UHI mitigation. In this paper, taking Changchun, a cold temperature zone city, as a case study, both qualitative and quantitative analyses were used to investigate a long term LUCC and UHI dynamics based on the information extracted form Landsat series data from 1984 to 2014. Particularly, we used NLST to characterize the patterns of the thermal environment and analyzed the differences of NLST among land use types, and then quantified the effects of urbanization on UHI intensity.
Three main conclusions can be made from the results of this study. First, both of the patterns of LUCC and the thermal environment have had dramatic changes in the past 30 years. The urban area of Changchun increased more than four times from 143.15 km2 in 1984 to 577.45 km2 in 2014. The proportion of UHI regions in the whole study area has increased from 15.27% in 1984 to 29.62% in 2014; Second, the changes of LUCC do have a great influence on the thermal environment. In other words, the spatiotemporal changes in thermal environments were consistent with the process of urbanization. Based on the mean NLST values of different land use types, urban areas have the highest NLST. Thus, the average NLST of the study area has been continuously increasing as many other land use types have been transformed to urban regions during the process. Additionally, the mean temperatures were higher in urban regions than rural ones over all the periods, but the UHI intensity varied based on different measurements. Third, the thermal environment inside the city changes considerably in a very short distance. The NLST possessed a very strong positive relationship with ISA, and the positive relationship has become stronger in recent years. In our case, a larger urban area does not mean a stronger UHI intensity.
The UHI effect will be a continuing challenge as the world continues to urbanize, as cities grow in size and density. With the development of remote sensing TIR sensors and LST retrieval algorithms, we can gather more accurate and comprehensive LST data to characterize UHI. On this basis, remote sensing with the help of other discipline’s methods will allow us to conduct UHI studies at wide temporal and spatial scales with different themes. The development of UHI studies is a great challenge that requires the concerted effort of multiple disciplines. However, such an effort would contribute substantially to advance our analytical capacity for understanding UHI and, thus, ultimately provide a basis for forging sustainable urban strategies.

Acknowledgments

This research was supported by Youth Science fund project (41301466) approved by the National Natural Science Foundation of China. Thanks the Weather Bureau of Changchun for providing local meteorological data. Thanks to the China Scholarship Council for funding me to study and conduct scientific research at the University of North Carolina at Charlotte (UNCC) in the USA. Thanks to the Writing Resources Center of UNCC for helping with the English editing.

Author Contributions

Chaobin Yang analyzed the data and wrote the paper. Xingyuan He and Shuwen Zhang conceived and designed the research; Liping Chang, Kun Bu, and Jiuchun Yang helped to gain data and extract LUCC information. Lingxue Yu and Fengqin Yan assisted in data analysis and editing the manuscript.

Conflicts of Interest

The authors declare no conflict of interest.

References

  1. Rizwan, A.M.; Dennis, L.Y.; Chunho, L. A review on the generation, determination and mitigation of urban heat island. J. Environ. Sci. 2008, 20, 120–128. [Google Scholar] [CrossRef]
  2. Kim, H.H. Urban heat island. Int. J. Remote Sens. 1992, 13, 2319–2336. [Google Scholar] [CrossRef]
  3. Peng, S.; Piao, S.; Ciais, P.; Friedlingstein, P.; Ottle, C.; Bréon, F.M.; Nan, H.; Zhou, L.; Myneni, R.B. Surface urban heat island across 419 global big cities. Environ. Sci. Technol. 2011, 46, 696–703. [Google Scholar] [CrossRef] [PubMed]
  4. Carlson, T.N.; Dodd, J.K.; Benjamin, S.G.; Cooper, J.N. Satellite estimation of the surface energy balance, moisture availability and thermal inertia. J. Appl. Meteorol. 1981, 20, 67–87. [Google Scholar] [CrossRef]
  5. Owen, T.; Carlson, T.; Gillies, R. An assessment of satellite remotely-sensed land cover parameters in quantitatively describing the climatic effect of urbanization. Int. J. Remote Sens. 1998, 19, 1663–1681. [Google Scholar] [CrossRef]
  6. Hart, M.A.; Sailor, D.J. Quantifying the influence of land-use and surface characteristics on spatial variability in the urban heat island. Theor. Appl. Climatol. 2009, 95, 397–406. [Google Scholar] [CrossRef]
  7. Patz, J.A.; Campbell-Lendrum, D.; Holloway, T.; Foley, J.A. Impact of regional climate change on human health. Nature 2005, 438, 310–317. [Google Scholar] [CrossRef] [PubMed]
  8. O’Loughlin, J.; Witmer, F.D.; Linke, A.M.; Laing, A.; Gettelman, A.; Dudhia, J. Climate variability and conflict risk in east africa, 1990–2009. Proc. Natl. Acad. Sci. USA 2012, 109, 18344–18349. [Google Scholar] [CrossRef] [PubMed]
  9. Santamouris, M. Cooling the cities—A review of reflective and green roof mitigation technologies to fight heat island and improve comfort in urban environments. Sol. Energy 2014, 103, 682–703. [Google Scholar] [CrossRef]
  10. Feizizadeh, B.; Blaschke, T. Examining urban heat island relations to land use and air pollution: Multiple endmember spectral mixture analysis for thermal remote sensing. IEEE J. Sel. Top. Appl. Earth Obs. Remote Sens. 2013, 6, 1749–1756. [Google Scholar] [CrossRef]
  11. Stewart, I.D. A systematic review and scientific critique of methodology in modern urban heat island literature. Int. J. Climatol. 2011, 31, 200–217. [Google Scholar] [CrossRef]
  12. Rossi, F.; Morini, E.; Castellani, B.; Nicolini, A.; Bonamente, E.; Anderini, E.; Cotana, F. Beneficial effects of retroreflective materials in urban canyons: Results from seasonal monitoring campaign. J. Phys. Conf. Ser. 2015, 655, 012012. [Google Scholar] [CrossRef]
  13. Rossi, F.; Anderini, E.; Castellani, B.; Nicolini, A.; Morini, E. Integrated improvement of occupants’ comfort in urban areas during outdoor events. Build. Environ. 2015, 93, 285–292. [Google Scholar] [CrossRef]
  14. Rossi, F.; Castellani, B.; Presciutti, A.; Morini, E.; Anderini, E.; Filipponi, M.; Nicolini, A. Experimental evaluation of urban heat island mitigation potential of retro-reflective pavement in urban canyons. Energy Build. 2016, 126, 340–352. [Google Scholar] [CrossRef]
  15. Tan, Z.; Lau, K.K.; Ng, E. Urban tree design approaches for mitigating daytime urban heat island effects in a high-density urban environment. Energy Build. 2016, 114, 265–274. [Google Scholar] [CrossRef]
  16. Howard, L. The Climate of London: Deduced from Meteorological Observations, Made at Different Places in the Neighbourhood of the Metropolis. Available online: https://books.google.com/books?id=7skTAAAAYAAJ&printsec=frontcover&source=gbs_ge_summary_r&cad=0#v=onepage&q&f=false (accessed on 3 February 2017).
  17. Morini, E.; Touchaei, A.G.; Castellani, B.; Rossi, F.; Cotana, F. The impact of albedo increase to mitigate the urban heat island in Terni (Italy) using the WRF model. Sustainability 2016, 8, 999. [Google Scholar] [CrossRef]
  18. Cui, Y.; Xu, X.; Dong, J.; Qin, Y. Influence of urbanization factors on surface urban heat island intensity: A comparison of countries at different developmental phases. Sustainability 2016, 8, 706. [Google Scholar] [CrossRef]
  19. Oke, T.R. City size and the urban heat island. Atmos. Environ. 1973, 7, 769–779. [Google Scholar] [CrossRef]
  20. Streutker, D.R. A remote sensing study of the urban heat island of Houston, Texas. Int. J. Remote Sens. 2002, 23, 2595–2608. [Google Scholar] [CrossRef]
  21. Gallo, K.P.; Tarpley, J.D.; McNab, A.L.; Karl, T.R. Assessment of urban heat islands: A satellite perspective. Atmos. Res. 1995, 37, 37–43. [Google Scholar] [CrossRef]
  22. Hu, L.; Brunsell, N.A. A new perspective to assess the urban heat island through remotely sensed atmospheric profiles. Remote Sens. Environ. 2015, 158, 393–406. [Google Scholar] [CrossRef]
  23. Shen, H.; Huang, L.; Zhang, L.; Wu, P.; Zeng, C. Long-term and fine-scale satellite monitoring of the urban heat island effect by the fusion of multi-temporal and multi-sensor remote sensed data: A 26-year case study of the city of Wuhan in China. Remote Sens. Environ. 2016, 172, 109–125. [Google Scholar] [CrossRef]
  24. Weng, Q. Thermal infrared remote sensing for urban climate and environmental studies: Methods, applications, and trends. ISPRS J. Photogramm. Remote Sens. 2009, 64, 335–344. [Google Scholar] [CrossRef]
  25. Li, Z.-L.; Tang, B.-H.; Wu, H.; Ren, H.; Yan, G.; Wan, Z.; Trigo, I.F.; Sobrino, J.A. Satellite-derived land surface temperature: Current status and perspectives. Remote Sens. Environ. 2013, 131, 14–37. [Google Scholar] [CrossRef]
  26. Voogt, J.A.; Oke, T.R. Thermal remote sensing of urban climates. Remote Sens. Environ. 2003, 86, 370–384. [Google Scholar] [CrossRef]
  27. Liu, G.; Zhang, Q.; Li, G.; Doronzo, D.M. Response of land cover types to land surface temperature derived from landsat-5 tm in Nanjing metropolitan region, China. Environ. Earth Sci. 2016, 75, 1386. [Google Scholar] [CrossRef]
  28. Du, H.; Wang, D.; Wang, Y.; Zhao, X.; Qin, F.; Jiang, H.; Cai, Y. Influences of land cover types, meteorological conditions, anthropogenic heat and urban area on surface urban heat island in the Yangtze river delta urban agglomeration. Sci. Total Environ. 2016, 571, 461–470. [Google Scholar] [CrossRef] [PubMed]
  29. Guo, G.; Wu, Z.; Xiao, R.; Chen, Y.; Liu, X.; Zhang, X. Impacts of urban biophysical composition on land surface temperature in urban heat island clusters. Landsc. Urban Plan. 2015, 135, 1–10. [Google Scholar] [CrossRef]
  30. Jusuf, S.K.; Wong, N.; Hagen, E.; Anggoro, R.; Hong, Y. The influence of land use on the urban heat island in singapore. Habitat Int. 2007, 31, 232–242. [Google Scholar] [CrossRef]
  31. Zhang, H.; Qi, Z.-F.; Ye, X.-Y.; Cai, Y.-B.; Ma, W.-C.; Chen, M.-N. Analysis of land use/land cover change, population shift, and their effects on spatiotemporal patterns of urban heat islands in metropolitan Shanghai, China. Appl. Geogr. 2013, 44, 121–133. [Google Scholar] [CrossRef]
  32. Rao, P. Remote sensing of urban heat islands from an environmental satellite. Bull. Am. Meteorol. Soc. 1972, 53, 647–648. [Google Scholar]
  33. Kerr, Y.H.; Lagouarde, J.P.; Imbernon, J. Accurate land surface temperature retrieval from AVHRR data with use of an improved split window algorithm. Remote Sens. Environ. 1992, 41, 197–209. [Google Scholar] [CrossRef]
  34. Wan, Z. Modis Land-Surface Temperature Algorithm Theoretical Basis Document (LST ATBD); Institute for Computational Earth System Science: Santa Barbara, CA, USA, 1999. [Google Scholar]
  35. Weng, Q. A remote sensing? GIs evaluation of urban expansion and its impact on surface temperature in the Zhujiang delta, China. Int. J. Remote Sens. 2001, 22, 1999–2014. [Google Scholar] [CrossRef]
  36. Roy, D.P.; Wulder, M.; Loveland, T.; Woodcock, C.; Allen, R.; Anderson, M.; Helder, D.; Irons, J.; Johnson, D.; Kennedy, R. Landsat-8: Science and product vision for terrestrial global change research. Remote Sens. Environ. 2014, 145, 154–172. [Google Scholar] [CrossRef]
  37. Weng, Q.; Lu, D.; Schubring, J. Estimation of land surface temperature–vegetation abundance relationship for urban heat island studies. Remote Sens. Environ. 2004, 89, 467–483. [Google Scholar] [CrossRef]
  38. Small, C. Estimation of urban vegetation abundance by spectral mixture analysis. Int. J. Remote Sens. 2001, 22, 1305–1334. [Google Scholar] [CrossRef]
  39. Goward, S.N. Thermal behavior of urban landscapes and the urban heat island. Phys. Geogr. 1981, 2, 19–33. [Google Scholar]
  40. Li, Y.-Y.; Zhang, H.; Kainz, W. Monitoring patterns of urban heat islands of the fast-growing Shanghai metropolis, China: Using time-series of Landsat TM/ETM+ data. Int. J. Appl. Earth Obs. Geoinf. 2012, 19, 127–138. [Google Scholar] [CrossRef]
  41. Cao, X.; Onishi, A.; Chen, J.; Imura, H. Quantifying the cool island intensity of urban parks using aster and ikonos data. Landsc. Urban Plan. 2010, 96, 224–231. [Google Scholar] [CrossRef]
  42. McMillin, L.M. Estimation of sea surface temperatures from two infrared window measurements with different absorption. J. Geophys. Res. 1975, 80, 5113–5117. [Google Scholar] [CrossRef]
  43. Price, J.C. Estimating surface temperatures from satellite thermal infrared data—A simple formulation for the atmospheric effect. Remote Sens. Environ. 1983, 13, 353–361. [Google Scholar] [CrossRef]
  44. Price, J.C. Land surface temperature measurements from the split window channels of the NOAA 7 advanced very high resolution radiometer. J. Geophys. Res. Atmos. 1984, 89, 7231–7237. [Google Scholar] [CrossRef]
  45. Qin, Z.-H.; Karnieli, A.; Berliner, P. A mono-window algorithm for retrieving land surface temperature from Landsat TM data and its application to the Israel-Egypt border region. Int. J. Remote Sens. 2001, 22, 3719–3746. [Google Scholar] [CrossRef]
  46. Rozenstein, O.; Qin, Z.; Derimian, Y.; Karnieli, A. Derivation of land surface temperature for landsat-8 tirs using a split window algorithm. Sensors 2014, 14, 5768–5780. [Google Scholar] [CrossRef] [PubMed]
  47. Gallo, K.; McNab, A.; Karl, T.; Brown, J.; Hood, J.; Tarpley, J. The use of NOAA AVHRR data for assessment of the urban heat island effect. J. Appl. Meteorol. 1993, 32, 899–908. [Google Scholar] [CrossRef]
  48. Sobrino, J.; Raissouni, N.; Li, Z.-L. A comparative study of land surface emissivity retrieval from NOAA data. Remote Sens. Environ. 2001, 75, 256–266. [Google Scholar] [CrossRef]
  49. Sobrino, J.A.; Jiménez-Muñoz, J.C.; Sòria, G.; Romaguera, M.; Guanter, L.; Moreno, J.; Plaza, A.; Martínez, P. Land surface emissivity retrieval from different VNIR and TIR sensors. IEEE Trans. Geosci. Remote Sens. 2008, 46, 316–327. [Google Scholar] [CrossRef]
  50. Carlson, T.N.; Ripley, D.A. On the relation between NDVI, fractional vegetation cover, and leaf area index. Remote Sens. Environ. 1997, 62, 241–252. [Google Scholar] [CrossRef]
  51. Xiong, Y.; Huang, S.; Chen, F.; Ye, H.; Wang, C.; Zhu, C. The impacts of rapid urbanization on the thermal environment: A remote sensing study of Guangzhou, South China. Remote Sens. 2012, 4, 2033–2056. [Google Scholar] [CrossRef]
  52. Liu, J.; Liu, M.; Tian, H.; Zhuang, D.; Zhang, Z.; Zhang, W.; Tang, X.; Deng, X. Spatial and temporal patterns of China’s cropland during 1990–2000: An analysis based on Landsat TM data. Remote Sens. Environ. 2005, 98, 442–456. [Google Scholar] [CrossRef]
  53. Janssen, L.L.; Vanderwel, F.J. Accuracy assessment of satellite derived land-cover data: A review. Photogramm. Eng. Remote Sens. 1994, 60, 419–426. [Google Scholar]
  54. Ridd, M.K. Exploring a VIS (vegetation-impervious surface-soil) model for urban ecosystem analysis through remote sensing: Comparative anatomy for cities. Int. J. Remote Sens. 1995, 16, 2165–2185. [Google Scholar] [CrossRef]
  55. Weng, Q.; Lu, D. A sub-pixel analysis of urbanization effect on land surface temperature and its interplay with impervious surface and vegetation coverage in Indianapolis, United States. Int. J. Appl. Earth Obs. Geoinf. 2008, 10, 68–83. [Google Scholar] [CrossRef]
  56. Yuan, F.; Bauer, M.E. Comparison of impervious surface area and normalized difference vegetation index as indicators of surface urban heat island effects in landsat imagery. Remote Sens. Environ. 2007, 106, 375–386. [Google Scholar] [CrossRef]
  57. Souch, C.A.; Souch, C. The effect of trees on summertime below canopy urban climates. J. Arboric. 1993, 19, 303–312. [Google Scholar]
  58. Santamouris, M. The role of green spaces. Energy Clim. Urban Built Environ. 2001, 145–159. [Google Scholar]
  59. Weng, Q.; Quattrochi, D.A. Thermal remote sensing of urban areas: An introduction to the special issue. Remote Sens. Environ. 2006, 104, 119–122. [Google Scholar] [CrossRef]
  60. Mallick, J.; Rahman, A.; Singh, C.K. Modeling urban heat islands in heterogeneous land surface and its correlation with impervious surface area by using night-time ASTER satellite data in highly urbanizing city, Delhi-India. Adv. Space Res. 2013, 52, 639–655. [Google Scholar] [CrossRef]
Figure 1. Location of the study site.
Sustainability 09 00312 g001
Figure 2. The average mean air temperature of Changchun from 1984–2014.
Sustainability 09 00312 g002
Figure 3. The NLST maps of the study area in different years.
Sustainability 09 00312 g003
Figure 4. The LUCC of Changchun from 1984 to 2014.
Sustainability 09 00312 g004
Figure 5. The LUCC statistics of Changchun from 1984 to 2014.
Sustainability 09 00312 g005
Figure 6. The statistics of NLST for different land use types.
Sustainability 09 00312 g006
Figure 7. The profile of NLST in 1984 and 2014 from west to east with samples (a–d) in 100 × 100 pixels.
Sustainability 09 00312 g007
Figure 8. The urbanization of Changchun from 1984 to 2014.
Sustainability 09 00312 g008
Figure 9. The changes of SUHI and ISUHI in Changchun.
Sustainability 09 00312 g009
Figure 10. The percentage ISA of the whole urban area and first traffic ring.
Sustainability 09 00312 g010
Figure 11. The regression results between NLST and ISA in (a) 1984 and (b) 2014.
Sustainability 09 00312 g011
Table 1. The satellite data used in the study.
SensorDatePath/RowSpatial Resolution (m)
Landsat-5 TM14 September 1984, 4 September 1992
10 September 2000, 29 August 2007
118/29
118/30
30, (120 for band 6)
Landsat-8 OLI/TIRS29 August 2014118/29
118/30
30, (100 for TIR bands but resampled to 30)
GF-122 June 20152 for the pan band
Table 2. The classification of NLST zones based on the NLST range.
NLST Zones NLST Range
lowestNLST < NLSTmean − 1.5S
lowerNLSTmean − 1.5SNLST < NLSTmean − 1.0S
lowNLSTmean − 1.0SNLST < NLSTmean − 0.5S
mediumNLSTmean − 0.5SNLST < NLSTmean + 0.5S
highNLSTmean + 0.5SNLST < NLSTmean + 1.0S
higherNLSTmean + 1.0SNLST < NLSTmean + 1.5S
highestNLSTNLSTmean + 1.5S
NLSTmean is the mean value of NLST of the study area, and S is the standard deviation of NLST.
Table 3. The land use classification system and the details can be seen in [52].
Land Use Class (Abbreviation)Descriptions
Paddy land (PL)Cropland that has enough water supply
Dry land (DL)Cropland without water supply
Woodland (WL)Including forest, shrub and woods
Urban area (UA)Land used for urban regions
Rural settlements (RS)Land used for settlements in villages
Other built-up area (OB)Land used for industry and mining
Water (WA)River, lake, pond
Unused land (UL)Bare land without vegetation cover and other unused land
Table 4. The area proportion (%) of different NLST zones and UHIR in different years.
YearsLowestLowerlowMediumHighHigherHighestUHIR
19846.119.7745.8922.9610.013.172.0915.27
19921.6621.1735.2318.9712.927.082.9722.97
20004.2418.4934.4520.1812.485.744.4222.64
20077.7225.2229.7113.8211.856.465.2223.53
20145.3618.1226.3820.5210.5710.588.4729.62
Table 5. Area (km2) and proportion (%) of dry land, rural settlements, and urban area.
YearDLRSUA
AreaProAreaProAreaPro
19841130.1269.65157.899.73143.518.84
19921081.1166.63155.069.55179.2311.04
2000998.8361.56146.549.03260.8716.07
2007894.7755.15128.387.91391.5824.13
2014737.7045.46108.726.70577.4535.59

