Analyzing Agricultural Agglomeration in China


1
Collaborative Innovation Center on Yellow River Civilization of Henan Province, Centre for Coordinative Development in Zhongyuan Economic Region & Institute for Regional Development and Planning, Henan University, Kaifeng 475004, China
2
Johnson Shoyama Graduate School of Public Policy, University of Saskatchewan, Saskatoon, SK S7N 5B8, Canada
3
Centre for Coordinative Development in Zhongyuan Economic Region, Henan University of Economics and Law, Zhengzhou 450000, China
4
Department of Geography, Kent State University, Kent, OH 44242, USA
5
Department of Geography & Geology, Sam Houston State University, Huntsville, TX 77340, USA
*
Authors to whom correspondence should be addressed.
Sustainability 2017, 9(2), 313; https://doi.org/10.3390/su9020313
Submission received: 9 January 2017
/
Accepted: 4 February 2017
/
Published: 20 February 2017
Abstract
:There has been little scholarly research on Chinese agriculture’s geographic pattern of agglomeration and its evolutionary mechanisms, which are essential to sustainable development in China. By calculating the barycenter coordinates, the Gini coefficient, spatial autocorrelation and specialization indices for 11 crops during 1981–2012, we analyze the evolutionary pattern and mechanisms of agricultural agglomeration. We argue that the degree of spatial concentration of Chinese planting has been gradually increasing and that regional specialization and diversification have progressively been strengthened. Furthermore, Chinese crop production is moving from the eastern provinces to the central and western provinces. This is in contrast to Chinese manufacturing growth which has continued to be concentrated in the coastal and southeastern regions. In Northeast China, the Sanjiang and Songnen plains have become agricultural clustering regions, and the earlier domination of aquaculture and rice production in Southeast China has gradually decreased. In summary, this paper provides a political economy framework for understanding the regionalization of Chinese agriculture, focusing on the interaction among the objectives, decision-making behavior, path dependencies and spatial effects.
1. Introduction
Industrial agglomeration largely promotes regional economic development all over the world. In particular, the industrial concentration in manufacturing and service sectors has attracted the interests of scholars for nearly 30 years [1,2,3,4]. In addition, with the use of large specialized equipment in agriculture, the geographic agglomeration and specialized production in agriculture recently demonstrated their competitiveness [5]. This is highlighted in examples such as the U.S. corn belt, the French grape and wine industrial districts, and the Dutch flower belt. The Chinese practice on agricultural industrialized districts, such as the Shouguang vegetable district in Shandong Province and the Lankao superior wheat district in Henan Province, also show that agricultural agglomeration and specialization could be an effective way for China to achieve agricultural modernization.
Since the reform and opening of the Chinese economy, Chinese agriculture has shown rapid growth such as grain output. Chinese grain output is considered to include barley, corn, millet, oats, rice, rye, sorghum, and wheat, as well as beans and potatoes. China’s grain output reached 601.9 million metric tons in 2013 to be the world’s largest producer. However, the potential increases from system reform and improved land productivity might stop due to urbanization of the best agricultural lands in coastal zones as well as drought and erosion, perhaps exacerbated by global climatic change. Thus, what can provide the next impetus for Chinese agriculture? The answer could be agricultural innovation in production organization, especially scale management and specialized production based on agricultural agglomeration (that is, the geographic agglomeration trend of crop production), a process which the Chinese government has been encouraging. It could break through the scale limitation of small individual rural households by the division of labor, thus achieving the economies of scale and division of the economy, connecting small farmers with big market. This could easily establish the geographical indication of a crop to improve the international competitiveness of Chinese agriculture, and even contend against the large-scale enterprises or farms.
However, Chinese agriculture is different from other economies because of its unique land policy. Since 1978, in rural China, farmers just have the land contractual management rights with the collective ownership of their village. Rural households are the basic agricultural economic unit, but their spatial scale is extremely small with a cultivated land area of just 1.38 mu per capita (equivalent to 0.093 hectares or 0.23 acres per person, based on the arable land and current gross population of China). In contrast, the average farm in the USA in 2007 was approximately 449 acres (181 hectares) in extent (USDA, Census of Agriculture, 2007). Thus, typical farms in the USA are more than 1900 times larger than typical “farms” in China. Thus, small-scaled operation of lands by individual households has led to the dispersion of Chinese agricultural production. Therefore, this paper explores the following research questions:
(1) Can agglomeration in agriculture emerge, especially given China’s unique political and economic system and small-scale peasant economy? If agglomerations are present, how are they distributed across space and how did they evolve with the speeding up of Chinese agricultural industrialization, scale management, and intensive characterization during the 30 years of reforms? Spatial analysis methods and study of Chinese political economy can elucidate these patterns and processes. As a centralized state with a policy of local responsibility, China is a valuable area to explore the impact of policy choices on agricultural evolution.
(2) What is the evolutionary mechanism of agricultural agglomeration and specialization in the Chinese context? The geographic distribution of agriculture was historically restricted by the local characteristics of the climate and the soil, which are difficult to change over the short-term. However, new factors now affect agricultural geographic distribution, such as the displacement of cultivation due to industrialization and urbanization, improvements in transportation networks, and the development of new global markets. In particular, the emergence of agricultural clusters, a new mode of agricultural organization [6], has accelerated the social agglomeration of agriculture. This is the process of agricultural agglomeration affected by social factors. In China, this has led to a significant change in the spatial distribution of agricultural production. How do social agglomeration factors such as the political orientation, technological innovation and institutional change produce regulatory outcomes? China has witnessed dramatic changes in its agricultural sector and as a nation that have shown the ability to overcome past shortages that produced devastating famines as recently as the 1950s and feed about 20% of the total world population today.
Answering these questions may significantly enhance the prospects for Chinese agriculture to strategically adjust its structure, foster regionalized agriculture and clusters, and enhance the transformation from traditional to modern agriculture. The objectives of this paper are: (1) explore the evolution of Chinese agricultural agglomeration and specialization over the last 30 years; and (2) analyze the mechanisms underlying the evolution of Chinese agricultural agglomeration from a political economic perspective. In order to do this, the paper measures the extent of agglomeration between 1981 and 2012, tracing both the evolution of the spatial distribution of Chinese agriculture as a whole as well as the “path” of specific crops with respect to their geographic clustering patterns. Finally, based on a political and economic perspective, it builds an analytical framework to explore the mechanisms underlying this process.
Current research on agglomeration mainly focused on the manufacturing and service sectors [1,2,3,4]. Marshall (1890) explained the reason for the concentration of specialized industries in particular localities, and described three original and classic contributors: technology spillovers, a constant market for skilled workers, and sharing of infrastructure and materials with subsidiary industries [7]. Because Marshall worked on the assumption of constant returns to scale and a perfectly competitive market structure, he attributed the agglomeration of enterprises to factors in the external economy; that is, constant returns at the firm level, and increasing returns at the social level. Marshall’s conception of external economies explained, to a certain extent, the reasons for industrial agglomeration, but did not clarify their original source in the external economy. He only discussed the advantages of gathered production, but did not describe the process that could lead to the concentration. This shortcoming was only partly addressed by Weber (1929) who suggested that industrial agglomeration would take place only when the benefits for firms from agglomerating more than covered the costs of moving together from the original least-cost locations [8].
Since the 1990s, new economic geographers (NEGs) have presented a theoretical explanation for the spatial agglomeration of industry based on the Dixit–Stiglitz model. It stresses the interaction among increasing returns, transport costs and factor mobility, and the self-reinforcing mechanisms of industrial agglomeration connected to industrial back-and-forth linkages [9]. New classical economics considers that industrial agglomeration is determined by the division of labor in the economy and transaction efficiency, and it is based on an infra-marginal analysis of the division of labor [10].
Fan and Scott (2003) empirically analyzed the positive correlation between the Chinese manufacturing sector’s industrial agglomeration and economic performance [1]. He, Pan and Sun (2007) found that the Chinese manufacturing sector is highly concentrated in the Pearl River Delta, Yangtze River Delta and the Bohai Rim. They found that agglomeration economies, foreign direct investment, and participation in international trade are conducive to industrial geographic agglomeration. However, industrial linkages failed to maintain manufacturing agglomeration [11]. In China, regional decentralization prompted manufacturing to disperse. Although theoretically the mechanisms of industrial agglomeration should also apply to the agglomeration of agriculture as an industry, the authors cited above mostly considered agriculture as an industry with a constant return to scale in their model building. They showed no particular interest in the possibility of agricultural agglomeration, and did not consider institutional effects on industrial or agricultural agglomeration.
Quantitative measurement of the pattern of agricultural geographic agglomeration and its evolutionary dynamics are rarely examined [5,12,13]. Compared with other industries, agriculture has unique agglomeration patterns and mechanisms. For example, agriculture has biological characteristics, is greatly dependent on inter-related natural conditions such as climate, elevation, drainage and soil suitability, and is considerably affected by social agglomeration factors, such as historical traditions, land tenure and ownership patterns, institutions, culture and regulation and especially in China, the policies of the central government.
The physical geophysical conditions that can alter the most appropriate location for planting a specific crop accumulate over the long-term. Some studies have shown that, although climate change has a significant influence on grain production, this kind of impact is homogeneous over the whole country [14]. However, Chinese agricultural geographic distribution has changed markedly in a very short period. The speed of its evolution is faster than that which would be attributable to alternation of the natural environment or patterns of global climate change alone. Why agriculture’s geographical distribution has changed so much in such a short time in China is an important research question addressed in this paper.
Compared with other industries, there are different issues in agriculture compared to the crucial factors driving agglomeration in manufacturing. The key actors are different, product types are of course different, and the industrial supply chain is different. In agriculture, supply and distribution chains can be longer and more complex, and they are locally embedded. Especially in China, the basic actors in agricultural production are rural households (or small multi-family farms), which have a natural geographic clustering, local embedding and successional characteristics, as well as a hierarchy relating the farmers to other actors (such as leading enterprises), central government planning organizations, government ownership of land and key natural resources like water and rail and a variety of other factors. Therefore, the formation and evolution of Chinese agricultural agglomeration is unique to China. The political economy perspective (or “turn”) in research on agricultural geography [15,16] provides a valuable means of exploring the macroscopic evolutionary mechanisms and the processes of agricultural agglomeration by looking at the decision-making behavior of the economic and political actors.
2. Methodology and Data Sources
The temporal path of the geographical center of Chinese agriculture is traced using a weighted centroid or barycenter. The overall extent and patterns of spatial agglomeration are assessed using the Gini Coefficient and the Index of Spatial Autocorrelation. The spatial contiguity and specific distribution patterns of individual crops at the provincial level, and their evolution over time, are examined using the Gini Coefficient and the Location Quotient (LQ) as an index of specialization.
The data used in the analysis are drawn from the “China Statistical Yearbook” in the years 1982–1996 and 2009–2013; the “China Rural Statistical Yearbook” in 1996, 2009, and 2013; and the publication “60 Years of Agricultural Statistics of New China”. The analysis units are the 31 provincial level units of the Chinese mainland (thus excluding Hong Kong, Macao and Taiwan). Although the discussion references agriculture, the analysis is limited to crops and excludes livestock (crops planting occupied 52.48% of agriculture in 2012, and 53.6% in 2014). Based on the standard industrial classification code of the national economy in China, and the availability of data, 11 categories of crops are examined: cereals, potatoes, oilseeds, beans, cotton, hemp, sugar, tobacco, vegetables, fruits and tea. The investigation period is from 1981 to 2012. The variable measured is crop output.
2.1. Barycenter Analysis
The paper uses the concept of a barycenter or weighted centroid to determine the location and characteristics of various crops in different years. Assuming that one region is composed of n sub-regions, and the coordinate of the barycenter of the sub-region i is (Xi, Yi), while, Mi is the “weight” of sub-region i on a specific attribute, then the regional barycenter coordinate (, ) of this attribute is defined as:
where (Xi, Yi) is taken as the coordinates of the centroid of Province i and Mi is taken as the output of a specific crop [17].
2.2. The Gini Coefficient
Agricultural production is unevenly distributed across space. The Gini coefficient can be used to measure the degree to which production is concentrated in a particular region, a concept referred to as agricultural agglomeration. A simplified formula derived from Zhang (2007) for the Gini coefficient is defined as [18]:
where AGj is the Gini coefficient for the crop j, and n is the number of groups. This paper divided the 31 mainland Chinese provinces into five groups by putting the crops’ output in order from low to high, so here n = 5. Lij is the ratio of the output of crop j in group i to the national output of crop j. The smaller the value, the more decentralized the distribution; a larger number indicates that the spatial distribution of this crop tends to be more concentrated.
2.3. Global Spatial Autocorrelation
Global spatial autocorrelation provides another approach for examining the degree of agglomeration for each crop at the provincial level. The most common measure of global spatial autocorrelation, the Moran’s I index, is defined by Moran (1950) as [19]:
where n is the number of provincial units in China, Wij is the spatial weight which depicts whether two regions (here, Chinese provinces) are contiguous (Wij = 1) or not (Wij = 0) and Xi is the crop’s output in province i, the average of which is . Contiguous provinces are neighbors which share a common border. A positive value for I indicates that a crop’s output in one province is similar to that of its neighbors; that is, there is a tendency toward spatial concentration or agglomeration for this crop; a negative value for I indicates a decentralized spatial distribution for that crop.
2.4. Specialization Index
The location quotient (LQ) provides a specialization index to illustrate where crops tend to concentrate at the provincial level. The location quotient of crop j is calculated as follows:
where Qj is the location quotient of crop j in one province, Ej is the output of crop j in this province, Et is the total output in this province of all crops, Aj is the output of crop j in the whole country, and At is the total output of all crops in the whole country. If Qj > 1, then the degree of specialization of crop j in the province is higher than the national average; if Qj = 1, the degree of specialization of crop j in the province is equal to the national average level; and if Qj < 1, the degree of specialization of crop j in the province is lower than the national average. If high values of Qj are concentrated in a few provinces, then the planting of crop j is relatively concentrated and specialized; if the value of Qj differs little among provinces, then the distribution of this crop is decentralized. Since the LQ is a relative and not an absolute measure, the index may be very large in a province, but the actual level of a crop’s output in that province could be quite small. To overcome this drawback, this paper lists the top five provinces by both output and LQ value. By comparing these, locations where Chinese agriculture tends to be clustered can be identified.
3. Results
3.1. Evolution of the Agricultural Agglomeration Pattern, 1981–2012
3.1.1. The Path of the Centroid of Chinese Agriculture
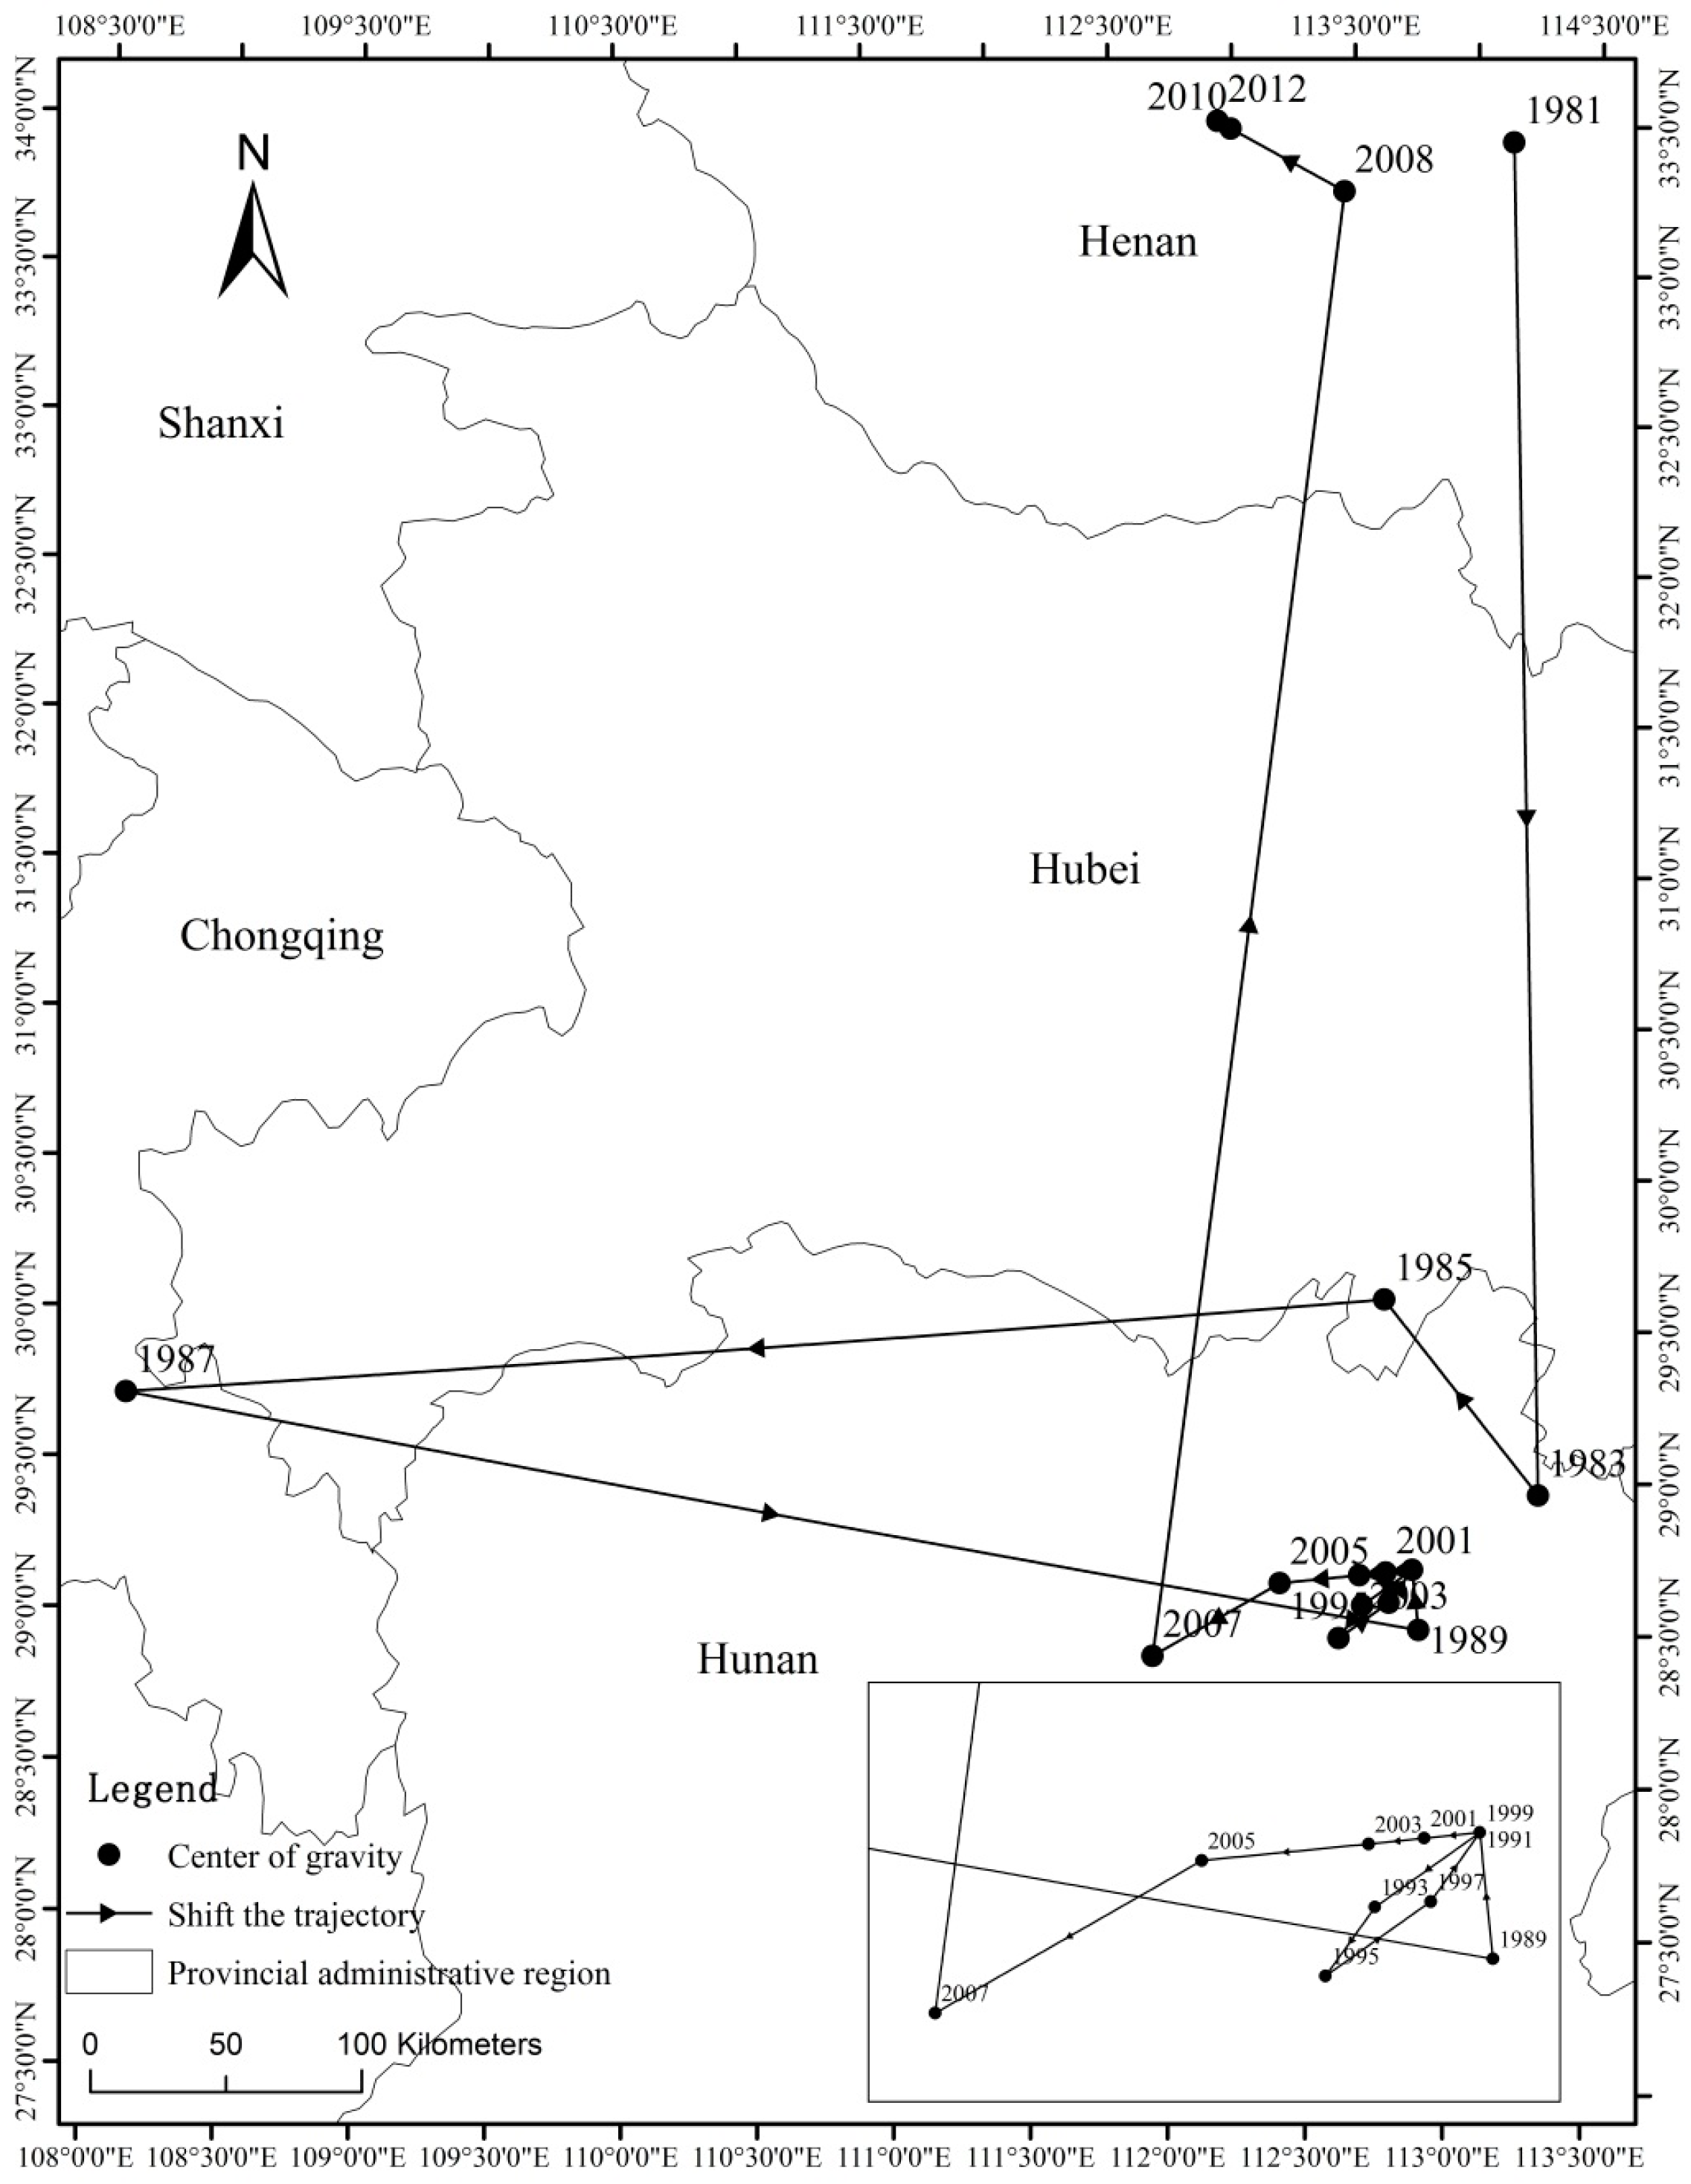
The path traced by the barycenter for all crop production over several decades reflects the overall change in the location of agriculture in China. Using Equation (1), Figure 1 shows these coordinates for every other year between 1981 and 2012. Three main conclusions can be drawn from examination of this spatial pattern.
From a spatial perspective, the barycenter of planting during the years from 1981 to 2012 is always located in the southeast of China. Over the last 31 years, the barycenter has been located in a range of longitudes from 108.3° to 114.1°E, and in a range of latitudes from 28.6° to 33.7°N. Relative to the geometric center of China (which is at 103°50′E and 36°N), the foci have been to the southeast. This shows agricultural production in the eastern part of China is greater than in the western part, and greater in the south than in the north. This is primarily attributable to rainfall and temperature patterns and mountainous and arid regions in the West.
In terms of the barycenter trajectory, the production initially shifted toward the southwest but moved toward the northeast after 2007. From 1981 to 2007, the barycenter in the east–west direction moved from 114.1° to 112.1° longitude, with slight fluctuations, suggesting a westward migration, but reversed after 2007. The longitude value of 108.3° in 1987 appears to be an aberration, due to widespread downstream spring flooding that year. In the north–south direction, from 1981 to 2007 the latitude of the center of gravity decreased from 33.5° in 1981 to 28.6° in 2007, which illustrates that production moved gradually to the south but with a sharp northward trend after 2007. In summary, the barycenter of the industry shifted to the southwest before 2007, but afterwards there was a substantial movement toward the northeast ending at 112.9°E, 33.7°N. The main factor behind the shift after 2007 was that production of many crops, particularly cereals and hemp, suddenly and sharply shifted to the northeast. This represents a significant recent structural adjustment in Chinese agriculture. In contrast in the period from 1981 to 2003, the location of the barycenter changed little, always being near 113.0°E, 28.7°N.
The shift toward the south is faster than the westward shift. The barycenter moved to the southwest, from Luohe City, Henan Province (114.1°E, 33.5°N) to Yueyang City, Hunan Province (113.1°E, 28.6°N) between 1981 and 1989. In the east–west direction, the focus moved 1.0° to the west, an average of 0.125° or 13.9 km per year, thus the speed was relatively slow. However, in the north–south direction, the foci moved 4.9° to the South, with an average 0.61° per year, or 41.5 km, which was significantly faster. After 1990, the center of gravity was relatively stable, with longitude at 112.1° to 113.1°E and latitude at 28.6° to 28.8°N between 1991 and 2007. However, after 2007, the barycenter shifted rapidly toward the northeast, faster to the north and slower to the east (increasing 5.1° in the latitude, but only 0.7° in the longitude from 2007 to 2012).
3.1.2. The Evolution of Agglomeration
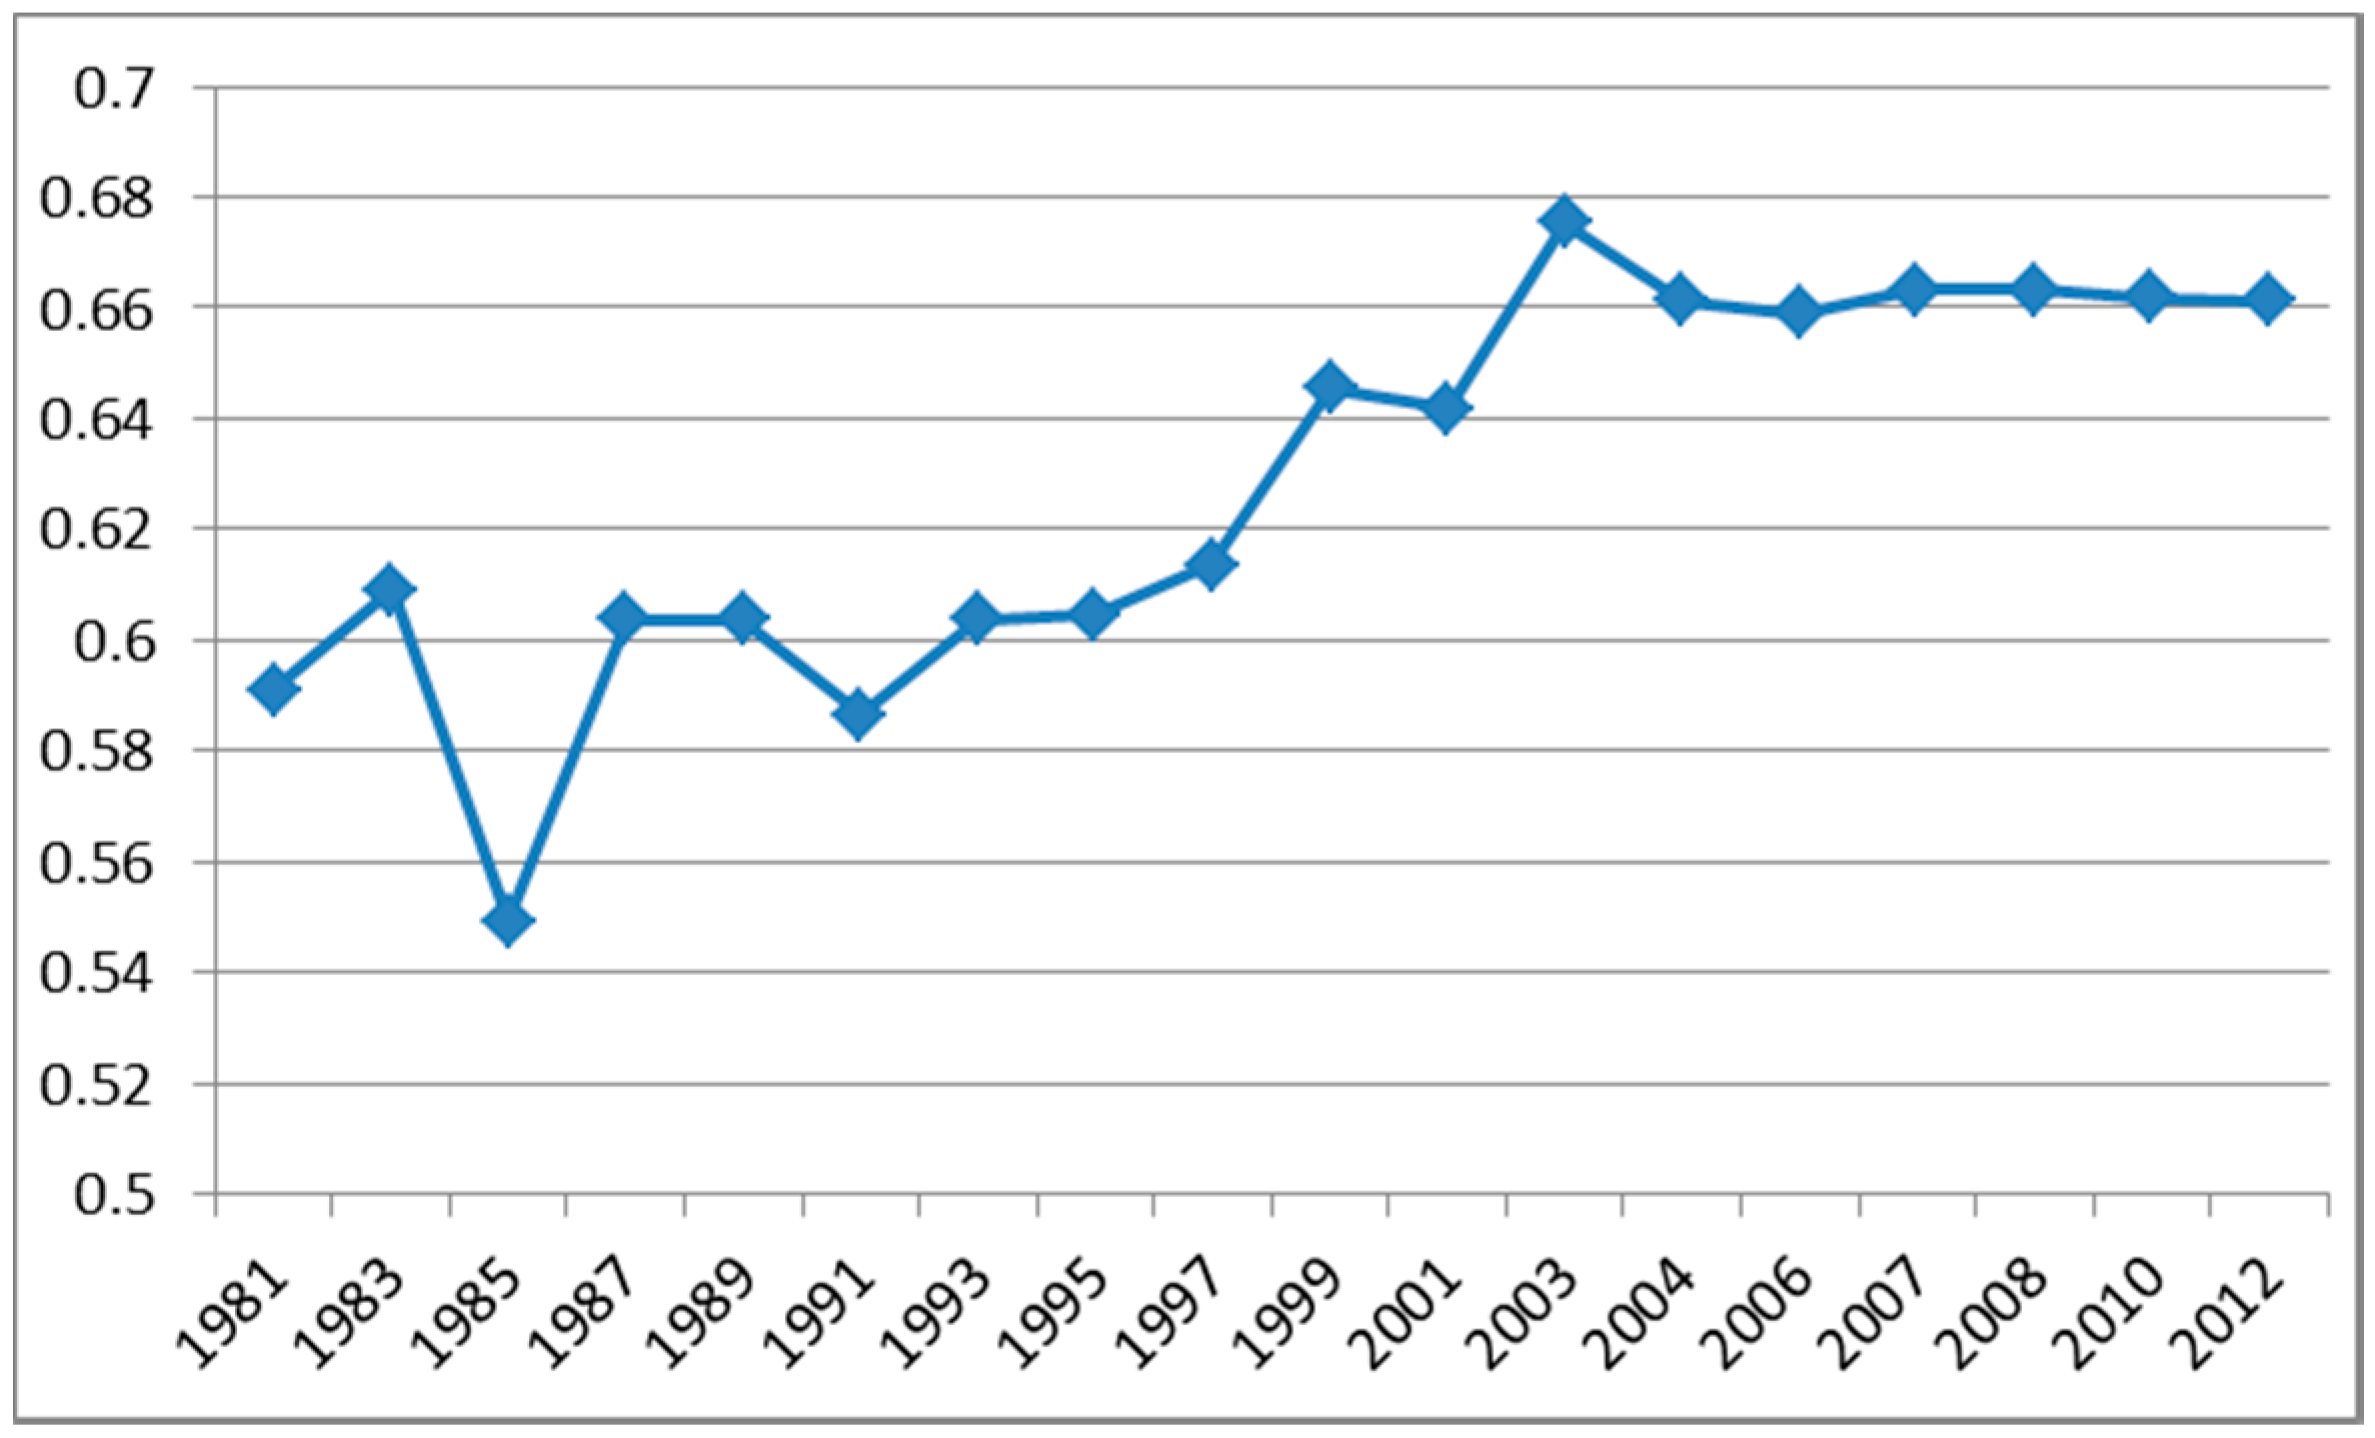
Using Equation (2), we calculated the average Gini coefficient of eleven major crops (listed in Section 2) from 1981 to 2012 to examine the change of the degree of spatial concentration of Chinese agriculture (see Figure 2). Over time, the average Gini coefficient increased from 0.591 in 1981 to 0.661 in 2012, indicating that the distribution of crops overall at the provincial-level was increasingly uneven. From Equation (3), we calculated the average Moran’s I index for each of eleven crops using four years: 1981, 1995, 2008 and 2012. It was positive and gradually increased from 0.072 in 1981 to 0.148 in 2012, indicating that the degree of spatial concentration of Chinese planting is gradually increasing. From Equation (4), the specialization index was measured for the eleven crops and the average LQ value for the top five provinces for each crop was also calculated in each of the four years, again suggesting that geographical agglomeration and regional specialization have progressively strengthened over the entire period from 1981 to 2012.
3.2. The Evolution of Each Crop’s Agglomeration Pattern
3.2.1. The Path of Each Crop’s Barycenter
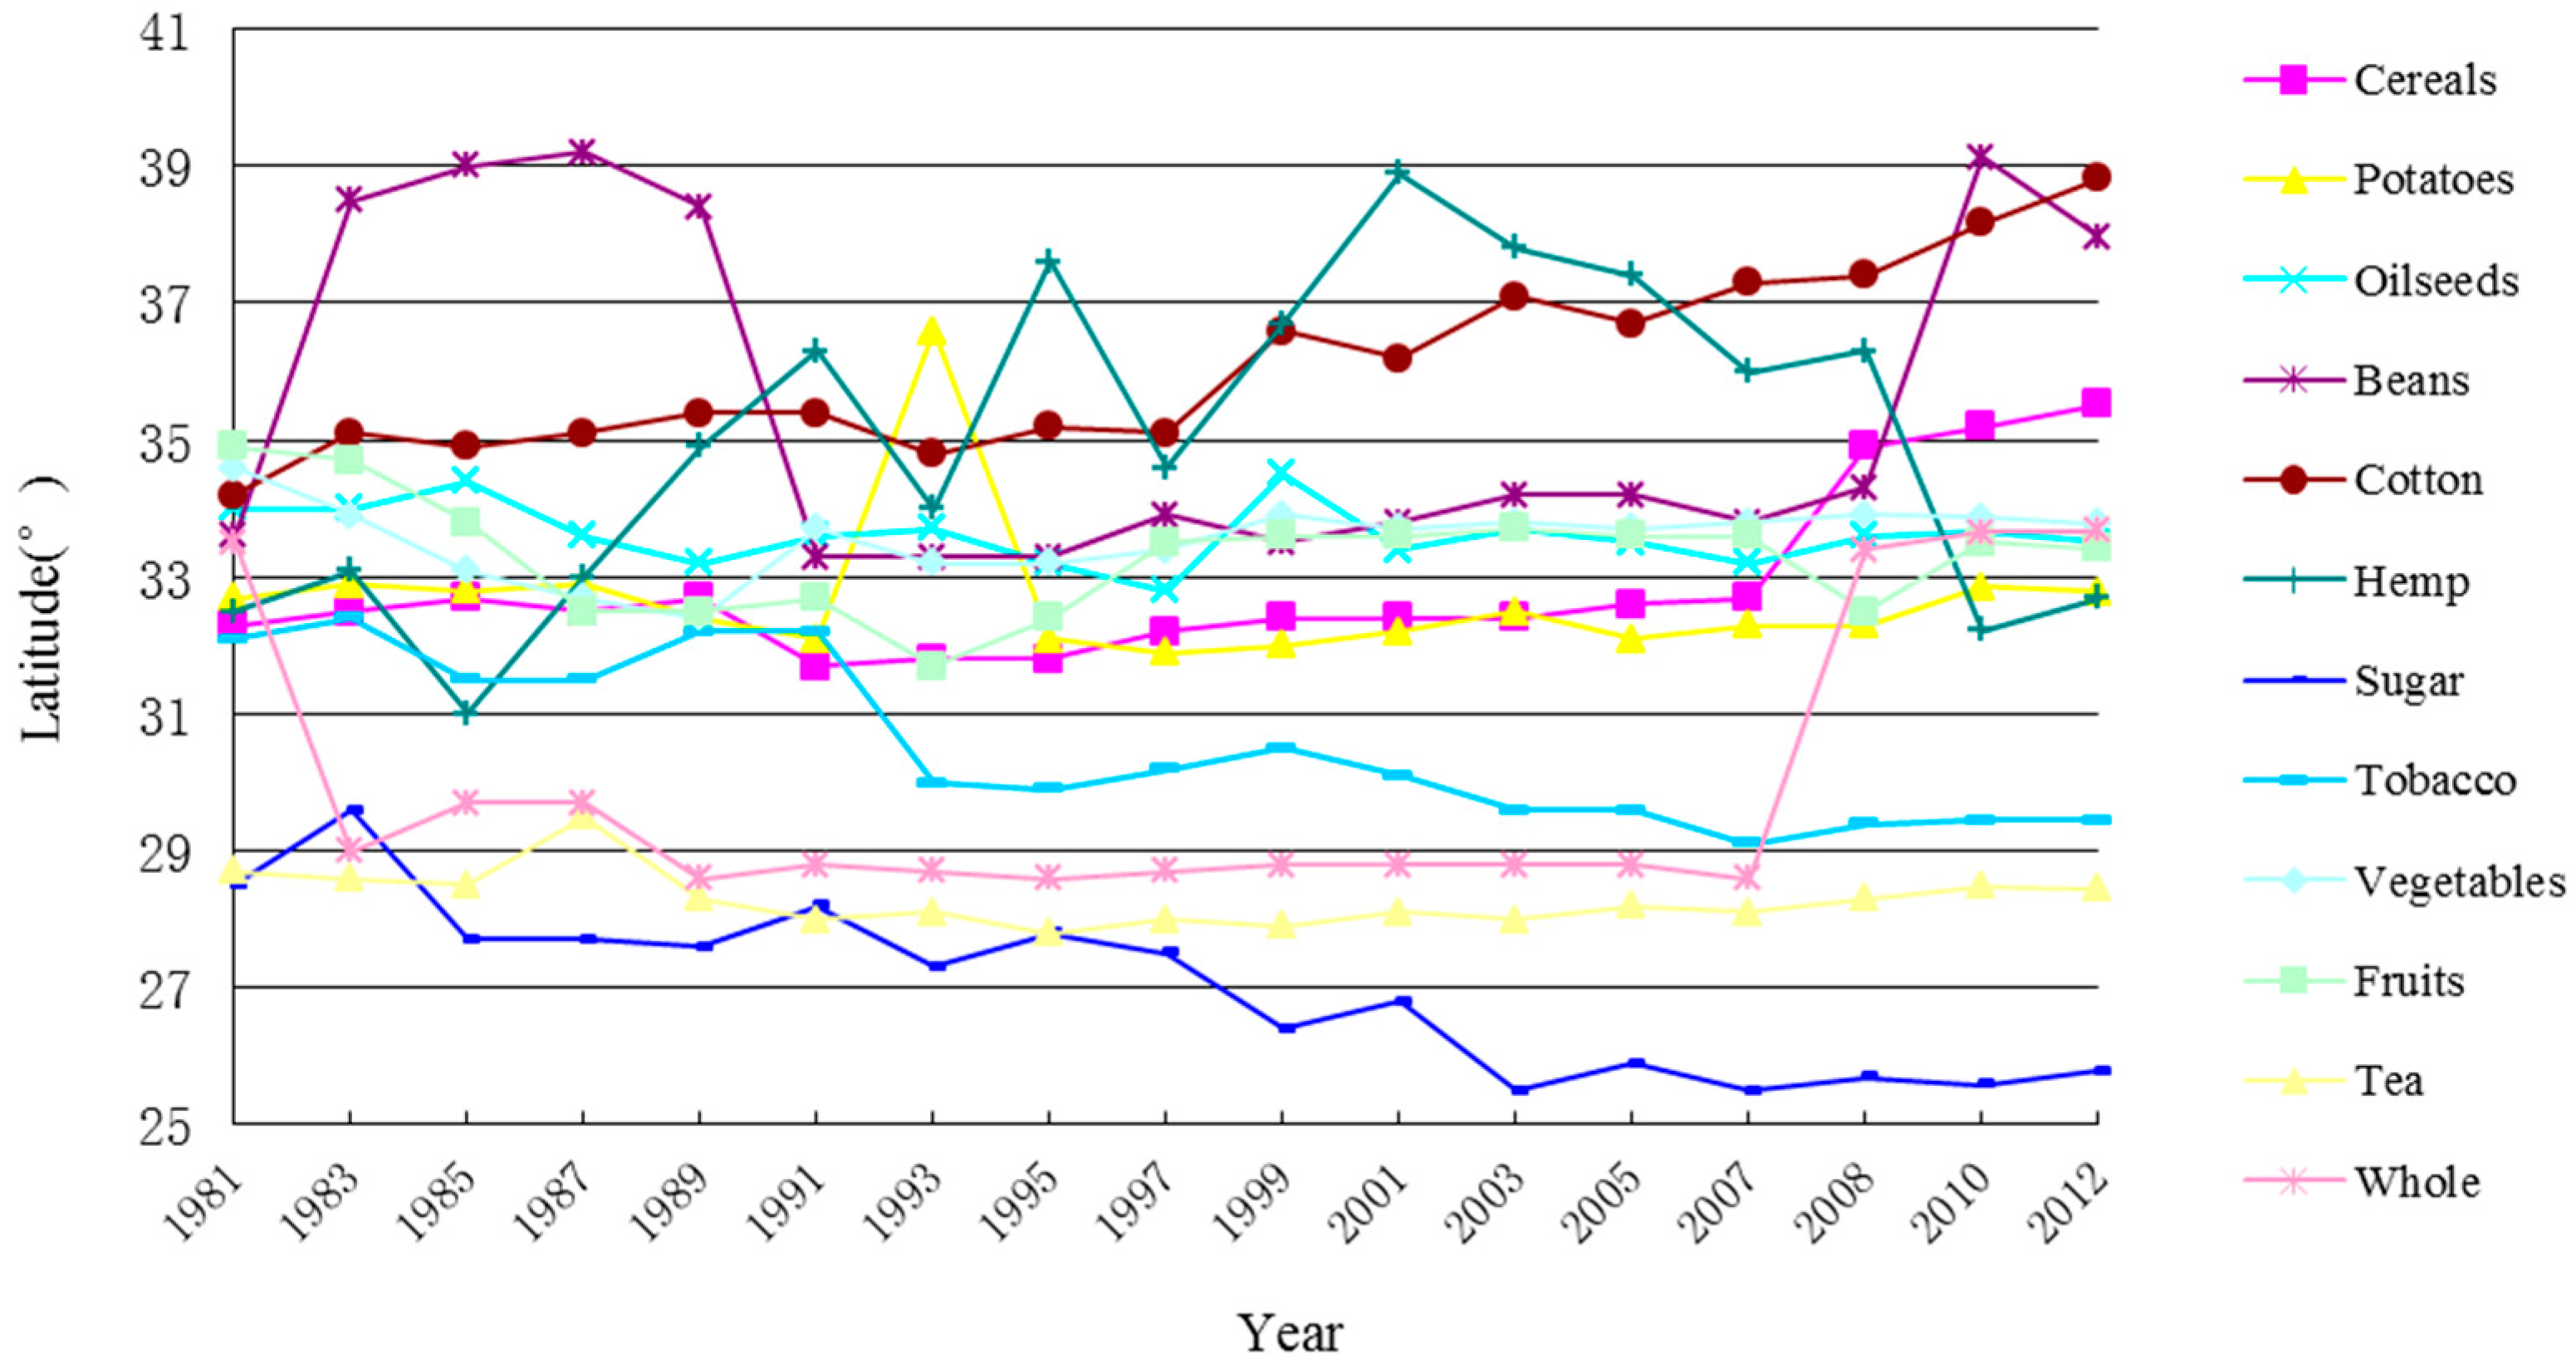
The barycenter of each crop from 1981 to 2012 was calculated using Equation (1). As Figure 3 and Figure 4 show, from 1981 to 2012, overall, the barycenter of cereals moved to the northeast from 113.6°E, 32.3°N in 1981 to 114.4°E, 35.5°N in 2012, although the specific path was more complex. From 1981 to 1993 the center of gravity gradually moved toward the southwest but after 1995 it returned to the northeast, especially after 2007. The barycenter for beans also moved to the northeast on the whole, but the process was again more complex. In the 1980s, the path was toward the northeast, it returned quickly toward the southwest in the 1990s, but moved sharply toward the northeast again after 2007. The direction of movement of the barycenter of potatoes, oilseeds, vegetables and tea in the north–south direction showed little change, basically moving to the west. The direction of movement of the barycenter of cotton constantly moved to the northwest. The direction of movement of the barycenter of sugar and tobacco constantly moved toward the southwest. The direction of movement of the barycenter of hemp was toward the northeast at first, then returned to the southwest after 2000 in a fluctuating pattern. The direction of movement of the barycenter of fruits moved to the southwest, but again with fluctuations. Overall, a comparison of Figure 3 and Figure 4 shows that the barycenter of all 11 crops moved, in varying degrees, to the west before 2008, while after 2008 the direction of movement of the barycenter of beans moved sharply to the northeast and the direction of movement of the barycenter of cotton moved largely to the northwest.
3.2.2. Agglomeration and Specialization by Crop
The Gini coefficient, which provides an index of concentration, rose for all 11 crops from 1981 to 2007 (Figure 5), although with some fluctuations, thus indicating that the degree of agglomeration of crops increased over time. However, it declined slightly from 2008 to 2012. Over time, the pattern for all 11 crops remained relatively consistent, with four main stages. The planting of crops tended to be geographically dispersed during 1981–1985, slowly concentrated during 1986–1995, and rapidly concentrated during 1996–2007, but reconfigured or adjusted after 2007, presumably because of the global financial crisis. Perhaps because of routine localized demand related to the necessity for meeting needs for daily consumption, cereals, vegetables and fruits had a lower degree of concentration, but relatively luxurious goods (export or cash crops) such as sugar, tobacco, tea and cotton had a higher degree of agglomeration.
Specialized factors such as the need for specific soils, topography and climate can account for some of this agglomeration, particularly in a case such as that of tea which has very specific climatic, drainage and topographic factors linked to production of a high quality product.
Using Equation (4), Table 1, Table 2, Table 3 and Table 4 were constructed for four time points for each of the 11 crops. The dates selected were 1981, 1995, 2008 and 2012. These provide an indication of the future location of crop clusters. The changes can be seen by comparing, for each crop at each time period, the top five provinces for a crop’s output with its LQ. This enables us to see the evolution of the pattern of geographic agglomeration and specialization. For example, the planting barycenter of cereals and beans moved toward the northeast because of being liable to large scale mechanized operations, the Sanjiang and Songnen Plains have become important agricultural clustering locations. The rank of the top five provinces in LQ of cereals altered from Jiangxi, Hubei, Shanghai, Jiangsu, and Hunan in 1981 to Heilongjiang, Jilin, Tibet, Jiangxi, and Inner Mongolia in 2012. Meanwhile, the arable land decreased and agriculture was squeezed out by urbanization and industrialization in the southeast coastal provinces. That is, the earlier domination of aquaculture and rice production in the southeast of China has gradually decreased. However, national strategy for “major grain producing areas” protected the production of crops in Shandong and Henan Provinces. Fresh-needed and demand-oriented vegetables were largely planted in highly populated provinces such as Shandong and Henan, while cotton moved from Shandong, Jiangsu, and Henan to Xinjiang Province located in the northwest of China owing to incentives for planting cotton strategy from Xinjiang government. However, the planting of beans in northeast sharply decreased after 2008 because of the lower price of importing soybean.
4. Discussion
In this paper, we measure the geographical agglomeration of Chinese planting. Why does Chinese agricultural agglomeration evolve such a path? What are the evolutionary mechanisms of agricultural agglomeration in China? There is more in-depth research about the agglomeration of the manufacturing sector than agriculture in the current literature. Scholars have been debating that agglomeration might be caused by external economies or economies of scale [7], division of labor or economies of specialization [10], backward and forward or input–output linkages [9], or innovation economies [20]. These theories established their models based on constant returns to scale in agriculture and zero transportation costs [7,21], which is not consistent with the modern, increasingly concentrated, spatial distribution of agriculture. Thus, it is difficult to explain current agricultural agglomeration using existing theories.
Agriculture is unique compared to other sectors. For example, agriculture depends on the physical environment. It is a long process for the physical environment to be altered so as to change the most appropriate place for a crop, although irrigating a dry but fertile river valley is an exception. However, changes in the environment are not the mechanism which can explain the rapid change in the pattern of agricultural distribution in China. This study found that the initial agglomeration of agriculture was indeed governed by the physical environment, but in the short-term was greatly influenced by the political environment, policy incentives, and household decision making. The demonstration effect and government guidance had a profound impact on farmers’ planting decisions. Therefore, a political economy perspective can provide valuable insights into agricultural agglomeration in China.
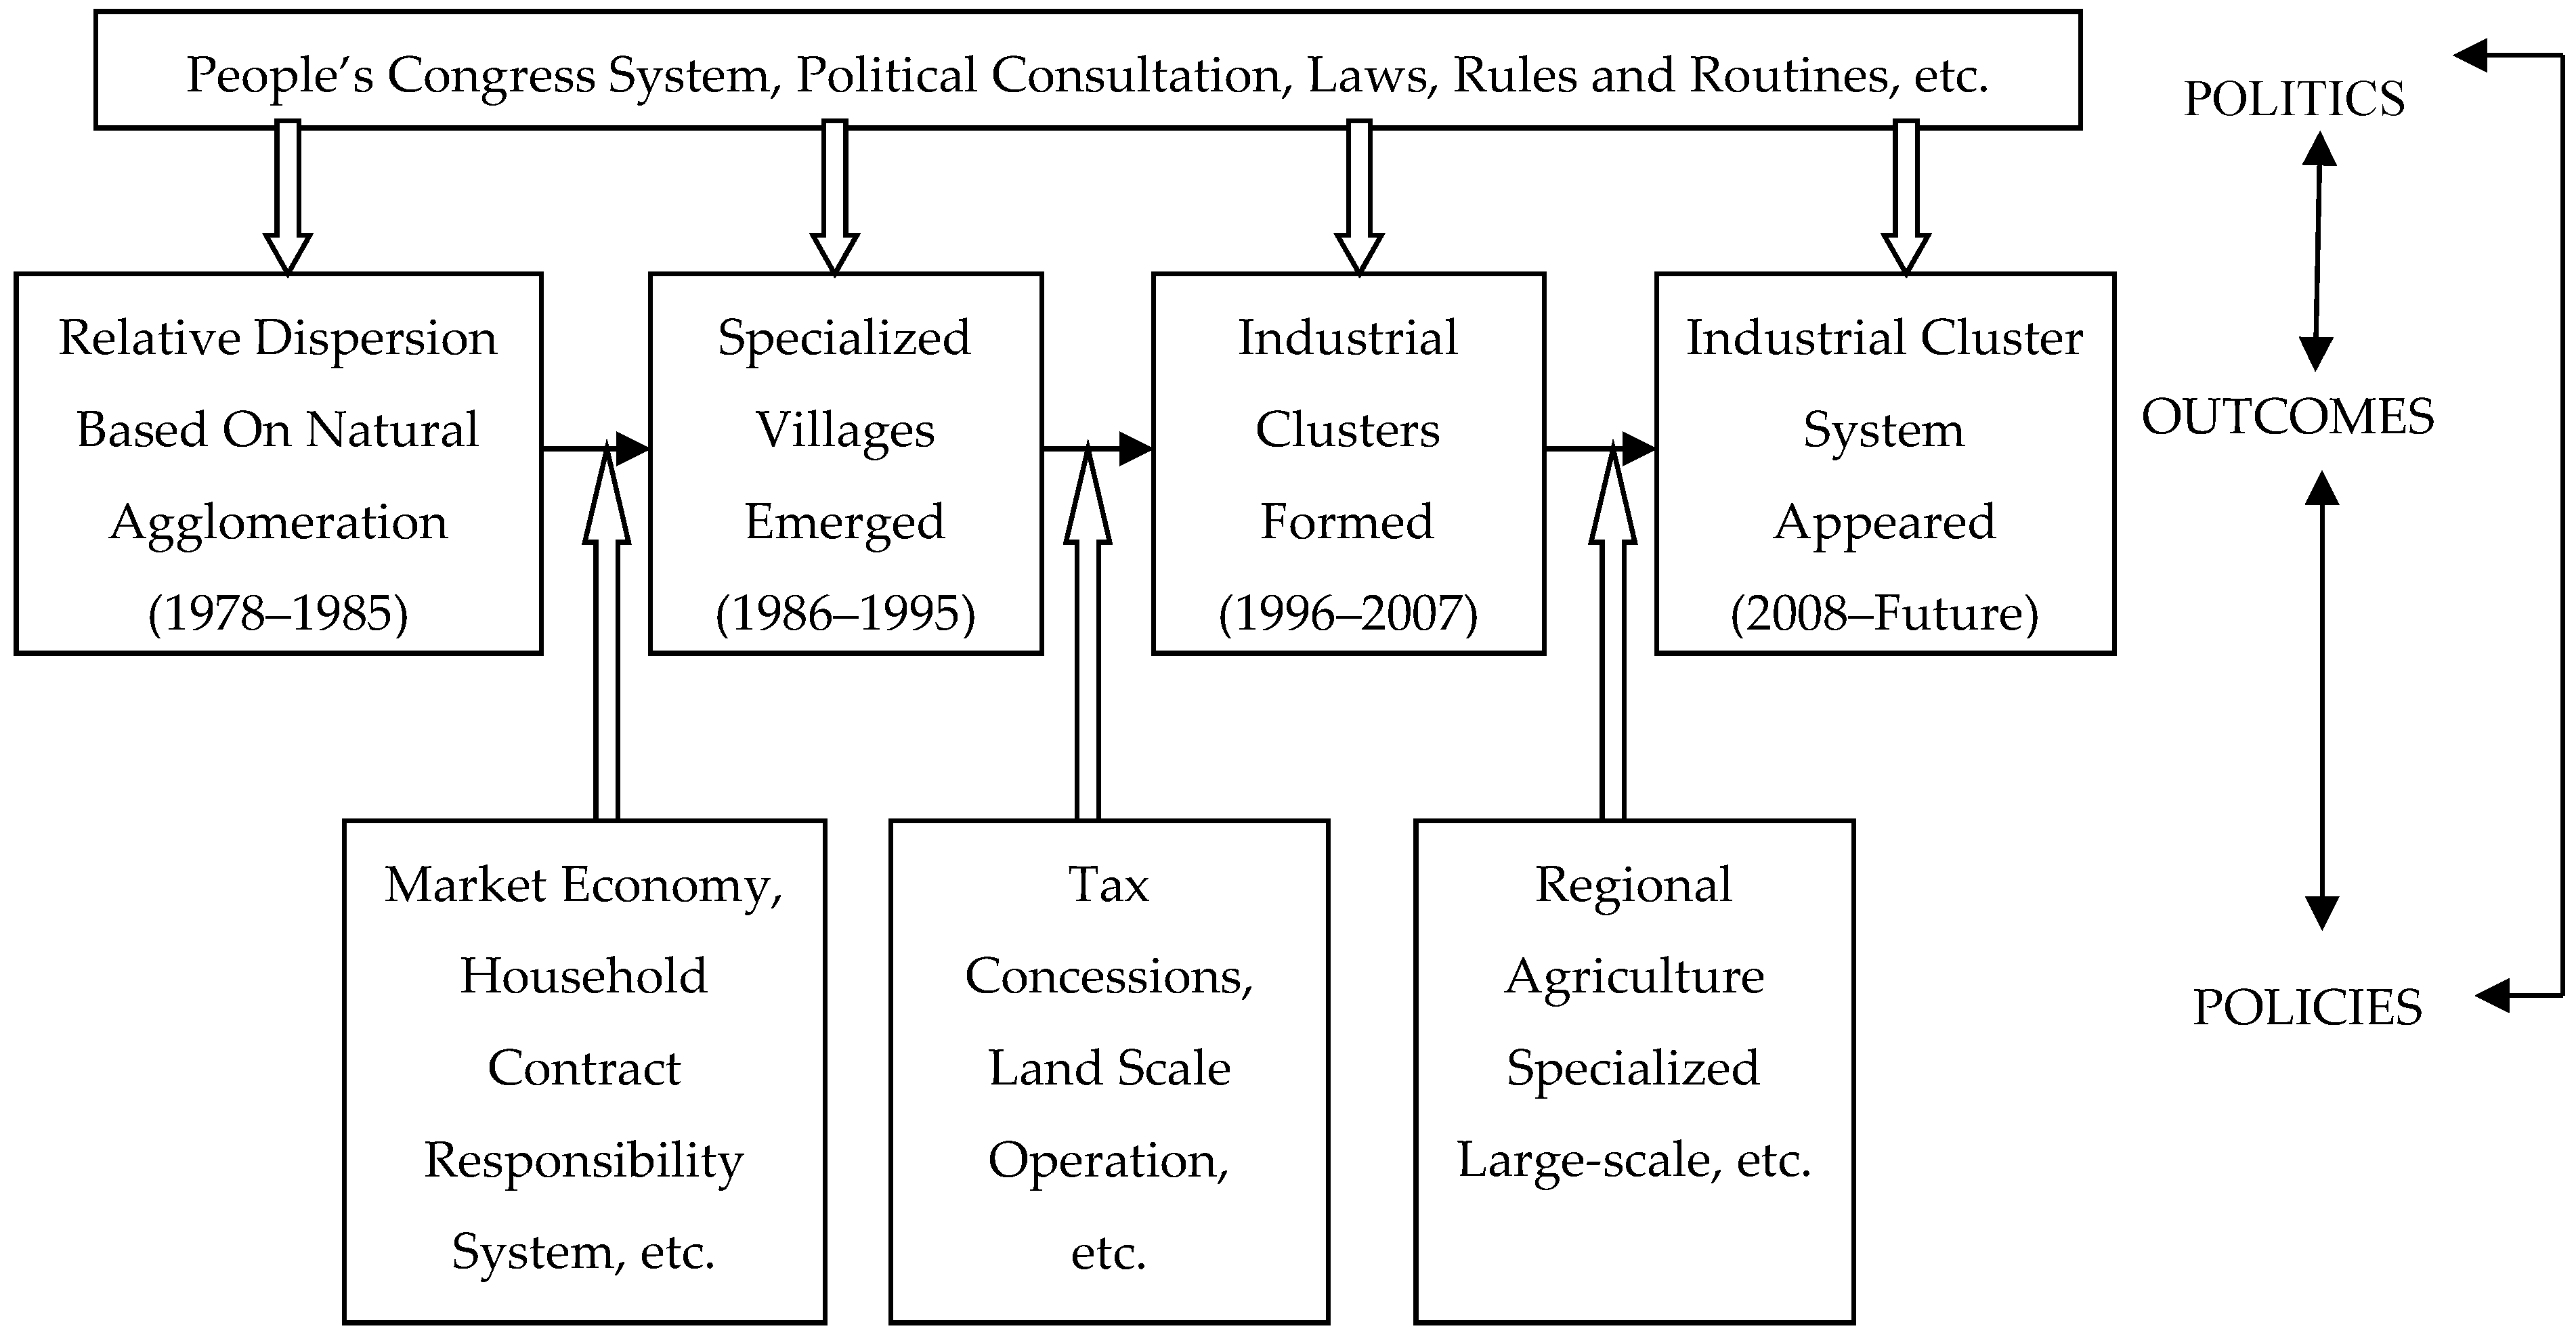
The analytical viewpoint of evolutionary economic geography (EEG) has been used to examine enterprise evolution [22], industrial evolution [23], network evolution [24] and regional evolution [25], but it lacks in-depth joint analysis among the micro-, meso- and macro-levels. In contrast, political economic perspectives emphasize macro-level changes in industrial production and distribution from the microscopic perspective of stakeholder behavior of decision-makers by analyzing the interaction between politics, policies, and industrial outcomes [26]. In this section, we build a political economic framework to discuss the evolution process and evolution mechanism of agricultural cluster. The framework is presented in Figure 6.
Politics is the process of collective decision-making by a variety of groups (or parties). The aggregation of individual preferences and the maximization of benefits is the basis of collective decision-making. Choices reflect the group’s interests. Policy is a reflection of the interests of a national or regional power elite. It is a set of guidelines for action that nations or political parties establish for their institutions or organizations in order to achieve certain goals or accomplish tasks. Political institutions mediate the aggregation of individual preferences to shape policy in the public arena, and policies are the output of preference and power resources mediated by political institutions [26]. Those policies shape the incentives that establish patterns of industrial distribution, be they agglomeration or decentralization. These patterns have a feedback effect on preferences. Being in one system, or another, influences what actors want. Thus, implementing the policies established by these groups eventually achieves their desired results through path dependence (positive feedback). The impact of preferences on policy outcomes is refracted by political institutions [26]. Based on this perspective, in this section, the authors construct an analytical framework to explore the evolutionary mechanism of agricultural agglomeration in China by examining the interests and objectives, decision-making behavior, path dependency (positive feedback) and geographic effects involved in agricultural decision-making from the perspective of political economy (Figure 7).
China’s economic reform is carried out by way of gradual stages under the socialist market economy. China’s policy-making process is different from that found in Western countries [26]. It can be understood as an iterative investigation and implementation process. Good policies usually come from best practices which are identified from various practices observed in the field. These best practices are tested repeatedly, with continuous learning and adjustment through policy models such as pilot projects, demonstration sites, special zones or proposed regulations, eventually forming the applicable (public) policy. Furthermore, just as the traditional approach to policy formulation of the Chinese Communist Party leadership is from the “point to the surface”, with adjustments for local conditions (see Heilmann (2008) [27] for more discussion), so are the policy implementation modalities. The national political hierarchy determines which policy options can be generally adopted. For the policy option to be tested properly, the leading political decision makers will make it a general application (formal) policy. Democratic centralism, the people’s congress system and regional systems affect the selection process and the policy implementation process by the central government to some degree.
China’s agricultural and rural policy changed from the “people’s commune system” characterized by egalitarianism or “the same big pot” to the “household contract responsibility system” originated in Fengyang County and Feixi County, Anhui Province after reform and opening up, and went through four stages: (1) Promote and perfect the household contract responsibility system (1978–1984); (2) Deepen and improve the agricultural product circulation system reform (1985–1997). Therein, agricultural product marketing system shifts from the state monopoly for purchase and marketing to the “double track order” (contract order and market order). Meanwhile, adjust and optimize agricultural structure, and encouraging farmers to develop an agriculture with diversified, high yield, high quality and high efficiency; (3) Improve the comprehensive agricultural production capacity, and strengthen the construction of irrigation and water conservancy, cultivated land quality and ecological environment (1997–2007); (4) Develop modern agriculture with Chinese characteristics and vigorously encourage and support the contracted land flow to professional investors, family farms and farmer cooperatives (after 2007). These four phases are consistent with the evolutionary stages of the agricultural agglomeration and specialization driven by politics, policy and the interaction among the interests, objectives, decision-making behavior, path dependencies and geographic effects.
Economic actors in agricultural development in China include households, enterprises, cooperatives, and village leaders among others. These grassroots actors often have good ideas related to thorny problems. These ideas may be adopted by a few pioneers and if successful may become models. These models spread rapidly among local neighborhoods, and are gradually paid attention to by grassroots political actors. They then become local policies. These policies will be identified by higher-level political operatives and these places will be observed as pilot or demonstration sites. After extensive trials, the most popular of these policies becomes the county, provincial or even national policy. Different agricultural policies, implemented at different stages in China’s development, were all drafted and executed in this way, such as the land contract responsibility system (1978), agricultural tax reduction, appropriate scale of operation and layout and regional specialization of production. Earlier (and less successful policies) which had agricultural aspects such as the campaign against the landlords, the Great Leap Forward and Cultural Revolution did not follow this model [28]. Today, households (or other actors) choose their planting practices under the direction of agricultural policy incentives, while also considering natural endowments, local institutions (such as historical tradition and technical capability) and market prospects. Once a farmer chooses to plant a specific crop, and obtains benefits, a demonstration effect on the surrounding farmers occurs. The preference of more and more farmers is consistent with the original farmer, thus a positive feedback loop forms. Under this mechanism of path-dependence [29], regional agricultural agglomerations appear in the environment. In this process, the incentive rules are derived from the political process, and the changes in geographic outcome largely reflect variations in incentives.
4.1. Natural Agglomeration Pattern Are Dominant (1978–1985)
Agriculture is a natural resource dependent industry. Because of a crop’s growth characteristics, its original production location depends on natural endowments such as climate and soil which leads to a specific crop or crops being predominant in a local area. For example, the locations where appropriate arable land was concentrated determined the location of the nine major Chinese commodity grain areas: the Pearl River Delta Plain, Jianghan Plain, Jianghuai Plain, Taihu Plain, Sanjiang Plain, Dongting Lake Plain, Poyang Lake Plain, Chengdu Plain and Songnen Plain. The Yellow River Basin, because of its loose and fertile soil and warm and dry climate with easy access to irrigation water, became the earliest area where primitive agriculture emerged. Northern China, with its drier climate, developed dryland farming with wheat, cotton, peanuts and sugar beets being dominant, while southern China developed paddy field agriculture cultivating rice, rapeseed, sugar-cane and aquaculture.
Before the major reforms beginning in 1978, China had a highly centralized socialist-planned economic system. Agricultural production emphasized the basic role of grain, a single crop structure in which farmers had no individual decision making or operational rights to land. Historical norms and planting conventions in specific locations determined the initial pattern of agricultural agglomeration. Since grains were purchased and marketed by the Chinese state in a unified manner, market principles largely did not operate. This paper does not focus on analyzing this early stage.
After reforms, China implemented a socialist market “household responsibility” economic system, canceling the unified purchase and sale policy and adjusting the price of agricultural products based on market demand. The household contract responsibility system made households the basic production and interest unit in the Chinese rural economy, with independent management and planting decision rights to their land. Before 1985, Chinese households planted the crops most necessary for adequate food and clothing, which largely defined the geographical pattern of Chinese crops during this time period.
4.2. Specialized Villages Emerge (1986–1995)
By 1986, China had basically solved the problem of meeting subsistence level needs for food and clothing for farmers. Economic behavior changed from survival rationality to economic rationality. Driven by the goal of benefit maximization, elite entrepreneurial farmers could quickly capture market information and create a new economic activity. If this economic activity was successful, the demonstration effect on the surrounding households occurred, leading them to imitate that approach. Then, professional farmer groups developed and, depending on the local culture, lowered the technological thresholds for this economic activity. Local political actors often encouraged and magnified this demonstration effect to foster development of the local economy and increase their personal achievement, and even more farmers were stimulated to become engaged in this economic activity. Specialized villages, specialized towns and even highly specialized counties emerged, based on focusing on a particular agricultural production related activity, for example raising wheat, growing vegetables, planting and nurturing apple trees for export, etc.
In the autumn of 1992 in Wangmao Village, Zhuji Town, Sheqi County, Henan Province, the Wenxing Li couple (the economic actors) sought success through specialized agriculture. They made a decision to cultivate mushrooms, and were very successful. In 1993, the county and town leaders (the political actors) decided to spread these planting techniques and focus on the crop of mushrooms throughout the county. They held repeated on-site meetings in Wangmao Village and invited the “mushroom couple” to describe their experiences. The government’s encouragement stimulated the “mushroom couple” to teach their methods to other local households. They launched a “midday 5 min mushrooms report” program on the village broadcasting system, and answered farmers’ questions about problems with mushroom planting. It was reported that, by the winter of 1993, 1403 households had started cultivating mushrooms in the county. By 1996, the example of the “mushroom couple” had led to the creation of 12 specialized villages in the county focused on mushroom production.
Agricultural tax relief, especially the reduction of taxes on special agricultural products, encouraged farmers to focus on production of specific crops. However, the crops that a village focused on were determined by natural resources, geographical location, economic base and traditional practices in that village. The number and size of specialized villages is determined by government promotion, market capacity, technological diffusion and the macroeconomic environment. Policies to encourage larger scale operations also incentivized the emergence of specialized villages. For example, the creation of roving teams of wheat harvesters during this period allowed smaller farmers in the Northeast to obtain access to costly and technologically sophisticated wheat harvesting combines which in turn facilitated larger scale farming. Thus, a village could specialize in wheat in a larger jointly managed field that was suitable for combine harvesting, as opposed to farming small mixed plots of a variety of crops in close proximity to an individual farmers home as was the case formerly.
Generally speaking, in the process of specialized village development, the leading farmers with entrepreneurial spirit led the adjustment of the industrial structure of each village, in some cases changing the dominant industry of the village from agriculture to the processing of agricultural products, or even to an unrelated industry. For example, under the inspiration of this policy, eastern regions were encouraged to develop priority and export-oriented industries, thus many eastern provinces developed many non-farming specialized villages based on their local handicraft industry or their original collective industry. This greatly accelerated industrialization and urbanization in eastern provinces, and a large amount of loss of agricultural lands occurred. The abolition of the taxes on special agricultural products encouraged farmers to plant flowers, tea, fruits and other economic export crops in the mountainous areas in the southwest of China. These are some of the reasons why the barycenter of Chinese agriculture shifted toward Southwest China. The trend is more obvious for non-food crops than for food crops. This coincided with the emergence of the “One Village, One Product” phenomena of specialized villages and towns in rural China.
4.3. Industrial Clusters Form (1996–2007)
By 1995, the economic performance and demonstration effects of specialized villages resulted in a preference of households and governments for larger scale operations with respect to land. The State Council of China approved the suggestion from the Ministry of Agriculture for setting up a mechanism for the right of collective land contract operation in 1995. For example, multiple rural households could contract together to operate a larger parcel of land, or land could be leased by one farmer to another. In 2002, the report of the 16th Congress of the Chinese Communist Party highlighted that “places can distribute their rights of land contract management in accordance with the principle of the law, voluntary choice, and compensation, so as to develop larger scale agricultural operations step by step”. This was also written into the reports of the 17th Congress and the property law. Thus, limiting households to small scale land operations was to a certain extent broken. With stimulation from political institutions, land legislation and policies on appropriate scales of operation, the number of specialized villages rose sharply. By the end of 2010, there were 51,486 specialized villages in the country [30]. The per capita net income of farmers was 15.56% higher than the national average, and for farmers focused on the dominant agricultural crop in each province, it was 25.82% higher [30].
Specialized villages can be reproduced to some extent and thus generate region-wide specialization and agglomeration. The core technology of specialized villages can be spatially diffused, not only by intra-village example but by inter-village contacts as well. This can be facilitated by government promotional efforts, geographical proximity, or relationship/kinship ties. At this village level, the diffusion of the technology follows the standard laws of geographic diffusion; that is, from point domain diffusion to transport axis diffusion to local surface diffusion to wide area diffusion and finally “edge area” diffusion to adjoining regions. This process is well described for the diffusion of capsicum planting in Zhecheng County, Henan Province [31].
With large-scale planting of selected crops, new enterprises and institutions were created, driven by governments or market profits. Industrial chains developed higher degrees of specialization [32]. Local governments, households, enterprises, universities and research institutions cooperated closely and aligned themselves with each other [33]. Meanwhile, export oriented enterprises expanded, so that the sizes of agglomerations further increased. Thus, with the co-function of economies of scale, economies from division of labor, or economies of specialization, network linkages and innovation economies, industrial development progressed rapidly (at least until the 2008 global financial crisis) with path dependence and self-reinforcement [34]. At the same time, these processes were accompanied by the accumulation of professional knowledge, the creation of independent innovations, and their spillover through diffusion within short distances [35]. Thus, within the agglomeration region, a culture of goodwill and an atmosphere of innovation emerged, and agricultural industrial clusters formed, such as the Shandong Shouguang vegetable industrial cluster.
4.4. Industrial Cluster Systems Appear (2008–Future)
With the development of agricultural regional specialization and policies promoting land transfer, each region became eager to identify their own most suitable specialized agriculture. Areas formed industrial clusters, creating large scale production, achieving a huge competitive advantage and making it hard for enterprises or regions outside the cluster to compete successfully [36,37,38,39]. Accordingly, political actors in non-cluster regions searched for and filled market gaps to produce different kinds of crops from the original cluster regions [40,41]. In turn, these differentiated crops form their own cluster-based system with a division of labor and collaboration in the whole region. An entire system of regional division of labor and agricultural specialization has been formed and is further spreading.
Thus, it can be seen that the evolution of geographic agglomeration patterns in agriculture is a process of extensive co-evolution and spatial reconstruction, including the evolution of household or business organization at the micro level, the evolution of industrial networks at the meso level and the evolution of regional infrastructure, institutions and spatial patterns at the macro level. The spatial pattern of agricultural cluster regions is reconstructed based on the evolution of household organization and industrial networks in rural areas. With the development of the economy and advancement in technology, the differentiation among farmers’ occupations and their division of labor will become more and more obvious. Simultaneous specialization and diversification in agriculture is the fundamental driving force for agricultural cluster regions to spatially evolve. Part-time farmers and traditional agriculture areas will decline, gradually expanding big farm businesses, specialized production regions or cluster–based differentiated function among regions will grow. In the special institutional context of China, governmental promotion and institutional innovation are necessary for the continuation of the successful evolutionary process described above. National regional agricultural product planning, both during 2003–2007 and 2008–2015, emphasized concentrated large-scale production, specialized management and market orientation based on agricultural agglomeration, which will promote further industrial agglomeration and spatial reconstruction in Chinese agriculture.
Nevertheless, challenges will remain and some will grow. In many coastal areas, highly fertile soils and specialized areas of rice production, silk production and aquaculture will be squeezed out by urbanization and industrialization. In particular, growing ownership of cars, spreading of paved road networks and growing use of rail and air travel will take over prime agricultural lands. In other areas drought and overdraft of aquifers pose a challenge to established large scale grain production. Degradation of the land due to erosion, desertification, salinization and over use of chemical pesticides and fertilizers is also taking place, as is widespread water pollution that has an indirect effect on production downstream.
5. Conclusions
In the process of China’s rapid industrialization and urbanization, the spatial distribution of agriculture has undergone great change. Since crops are the largest and most intensive of the two main components of agriculture (livestock being the other), the spatial distribution of crops largely determines the spatial layout of agriculture. Therefore, this study quantitatively analyzed the patterns and the evolution of the geographic clustering of crop production at the provincial level for the Chinese mainland (excluding Hong Kong, Macao and Taiwan), and reached the following three main conclusions.
By calculating the barycenter coordinates, the Gini coefficient, spatial autocorrelation and specialization index for 11 crops over the 1981–2012 period, we found that, different from the agglomeration of manufacturing with an overall shift toward the south and the east of China, the agglomeration of crop production moved gradually toward the south and the west, specifically, from the eastern provinces to the central and western provinces. The advantages of the former breadbasket in the northeast and Yangtze plain and Pearl River deltas have been gradually declining. This is related to China’s export-oriented policy of prioritizing industrial development in the eastern region, and coincides with rapid urbanization and thus displacement of agriculture from the eastern coastal provinces.
The spatial concentration and regional specialization of Chinese planting has emerged and the degree of spatial concentration of Chinese production increased overall. Although the similarity of crops in adjacent or similar provinces weakened, the degree of the regional specialization and diversification strengthened. Given China’s unique political and economic system, the agglomeration pattern of Chinese planting is undergoing the evolutionary path of agglomeration, specialized villages emerging, industrial clusters forming to industrial cluster systems appearing, which is different from “the expansion by reclaiming wasteland” in North America on evolution pattern of agricultural production. In general, the distribution pattern of the initial geographic concentration of agriculture is determined by natural conditions. The interactions among actors’ preferences in decision-making, regional systems, and economic policies together determined the current outcome, namely the evolution of an agglomeration pattern of Chinese agriculture.
This paper’s analytical framework examined the interests and objectives, decision-making behavior, path dependency (positive feedback) and geographic effects involved in agricultural decision-making in order to analyze the process behind its evolution. The decision-making behavior of the actors and the preferences of institutions were consistent with the incentives that produced the macroscopic outcome. The interactions between them determined whether a pattern of geographical agglomeration or the dispersion occurred in Chinese agriculture, and drove the evolutionary process along the path of agglomeration, creating specialized villages, agricultural clusters, and an industrial cluster system. Environment factors have different impacts on the pattern of agricultural agglomeration and specialization, such as rapid urbanization and industrialization have had negative effects due to decreasing the agricultural acreage, while national policies on tax burden relief have had positive impacts. Furthermore, globalization would result in mixed effects. With the penetration of high-tech agriculture, the natural constraints on agricultural production are being reduced. With the development of modern suburban agriculture, the dependency of urban areas on rural districts has gradually weakened. In the evolution of agriculture from natural agglomeration to agricultural production systems, the role of natural agglomeration has diminished while the role of social gathering has gradually increased. The processes of technological innovation and institutional innovation have also accelerated, which also accelerates the evolution of agricultural agglomeration patterns. Therefore, for each stage of agricultural agglomeration development, growth potential should be realized relatively rapidly. If China can continue to identify the most appropriate policies and encourage the best behavioral decision-making by its economic and political actors, the regional industry should continue to develop, resulting in optimal geographic outcomes.
Acknowledgments
We would like to thank the anonymous referee whose comments and suggestions were very helpful in improving the quality of this paper. We also acknowledge the funding of the National Natural Science Foundation of China (41471105; 41430637; 41471117; and 41329001), China Postdoctoral Science Foundation (2013M531667; 2014T70672), the program for Innovative Research Team (in Science and Technology) in University of Henan Province (16IRTSTHN012) and The major projects of Ministry of education for humanities and social science key research base, China (15JJDZONGHE008, and 13JJD790008). We also would like to greatly thank Professor Murray Fulton, Johnson-Shoyama Graduate School of Public Policy, University of Saskatchewan for his helpful comments on the analytical framework, and we would like to greatly thank Professor Ronald Briggs, GIS Programs, University of Texas at Dallas, for his constructive suggestions and comments on this paper.
Author Contributions
Erling Li performed the statistical analysis, designed the analytical framework of this study, wrote the manuscript and made revisions; Ken Coates and Xinyue Ye made major revisions of the manuscript and coordinated the research team; Xiaojian Li revised the analytical framework of this study; and Mark Leipnik made revisions of the manuscript.
Conflicts of Interest
The authors declare no conflict of interest.
References
- Fan, C.; Scott, A. Industrial Agglomeration and Development: A Survey of Spatial Economic Issues in East-Asia and a Statistical Analysis of Chinese Regions. Econ. Geogr. 2003, 79, 295–319. [Google Scholar] [CrossRef]
- Li, E.; Li, X.; Liu, Z. Relationships and Evolving Networks of Rural Manufacturing Clusters: A Case Study in Yucheng County, Henan Province of China. Chin. Geogr. Sci. 2011, 21, 364–376. [Google Scholar] [CrossRef]
- Simon, S.-M. Industrial Clusters and New Firm Creation in the Manufacturing Sector of Madrid’s Metropolitan Region. Reg. Stud. 2009, 43, 949–965. [Google Scholar]
- Mao, Q.; Wang, F.; Li, J.; Dong, S. Evolving a Core–Periphery Pattern of Manufacturing Industries across Chinese Provinces. J. Geogr. Sci. 2014, 24, 924–942. [Google Scholar] [CrossRef]
- Hyeon, C.; Byung-Joon, W. Agro-Industry Cluster Development in Five Transition Economies. J. Rural Dev. 2006, 29, 85–119. [Google Scholar]
- Bjørnar, S. Socio-economic Unity in the Evolution of an Agricultural Cluster. Eur. Plan. Stud. 2014, 22, 2605–2619. [Google Scholar]
- Marshall, A. Principles of Economics; Macmillan and Company: London, UK, 1890. [Google Scholar]
- Weber, A. Theory of the Location of Industries; The University of Chicago Press: Chicago, IL, USA, 1929. [Google Scholar]
- Krugman, P. Increasing Returns and Economic Geography. J. Political Econ. 1991, 99, 483–499. [Google Scholar] [CrossRef]
- Yang, X.; Ng, Y. Specialization and Economic Organization: A New Classical Microeconomic Framework; Elsevier: Amsterdam, The Netherlands, 1993. [Google Scholar]
- He, C.; Pan, F.; Sun, L. Geographical Concentration of Manufacturing Industries in China. ACTA Geogr. Sin. 2007, 62, 1253–1264. (In Chinese) [Google Scholar]
- Porter, M.E. The Competitive Advantage of Nations; Macmillan: London, UK, 1990. [Google Scholar]
- Phillips, P.; Ryan, C.; Karwandy, J.; Procyshyn, T.; Parchewski, J. The Saskatoon Agricultural Biotechnology Cluster. In Handbook of Research on Clusters: Theories, Policies and Case Studies; Karlsson, C., Ed.; Edward Elgar: Cheltenham, UK, 2008; pp. 233–252. [Google Scholar]
- Xie, Y.; Liu, J. Impact of Climate on Grain Yield per Unit Area in China during the Years of 1949–1992. Chin. Geogr. Sci. 1998, 8, 309–316. [Google Scholar] [CrossRef]
- Marsden, T.; Munton, R.; Ward, N.; Whatmore, S. Agricultural geography and the political economy approach: A review. Econ. Geogr. 1996, 72, 361–375. [Google Scholar] [CrossRef]
- Buttel, F. Some reflections on late twentieth century agrarian political economy. Sociol. Rural. 2001, 41, 165–181. [Google Scholar] [CrossRef]
- William, W.; David, N. Contributions to a Statistical Methodology for Areal Distributions. J. Reg. Sci. 1960, 2, 47–66. [Google Scholar]
- Zhang, J. A Convenient Method to Calculate Gini Coefficient. J. Shanxi Agric. Univ. 2007, 6, 275–283. (In Chinese) [Google Scholar]
- Moran, P.A.P. Notes on continuous stochastic phenomena. Biometrika 1950, 37, 17. [Google Scholar] [CrossRef] [PubMed]
- Nooteboom, B. Learning and Innovation in Organizations and Economies; Oxford University Press: New York, NY, USA, 2000. [Google Scholar]
- Fujita, M.; Krugman, P.; Venables, A.J. The Spatial Economy: Cities, Regions and International Trade; The MIT Press: Cambridge, UK, 1999. [Google Scholar]
- Eun, J.-H. An Empirical Inquiry into “Academy-Run Enterprises” in China: Unique Characteristics and Evolutionary Changes. Int. J. Innov. Manag. 2010, 14, 123–150. [Google Scholar] [CrossRef]
- Bottazzi, G.; Dosi, G.; Fagiolo, G.; Secchi, A. Modeling Industrial Evolution in Geographical Space. J. Econ. Geogr. 2007, 7, 651–672. [Google Scholar] [CrossRef]
- Gluckler, J. Economic Geography and the Evolution of Networks. J. Econ. Geogr. 2007, 7, 619–634. [Google Scholar] [CrossRef]
- Boschma, R.A. The Competitiveness of Regions from an Evolutionary Perspective. Reg. Stud. 2004, 3, 993–1006. [Google Scholar] [CrossRef]
- Gourevitch, P.A.; Shinn, J. Political Power and Corporate Control: The New Global Politics of Corporate Governance; Princeton University Press: Princeton, NJ, USA, 2005. [Google Scholar]
- Heilmann, S. From Local Experiments to National Policy: The Origins of China’s Distinctive Policy Process. China J. 2008, 59, 1–30. [Google Scholar] [CrossRef]
- Han, D. Farmers, Mao and Discontent in China. Mon. Rev. 2009, 61, 271–298. [Google Scholar] [CrossRef]
- Hägerstrand, T. The Propagation of Innovation Waves. Lund Studies in Geography, Series B. Hum. Geogr. 1952, 4, 3–9. [Google Scholar]
- Li, X.; Zhou, X.; Zheng, C.; Rozelle, S. Development of Specialized Villages in Various Environments of Less Developed China. Acta Geogr. Sin. 2012, 67, 783–792. [Google Scholar]
- Wu, N.; Li, E.; Li, X. Spatial Distribution of Specialized Vegetable Cultivation Villages and Its Influencing Factors: A Case Study of Capsicum Plantation in Zhecheng County, Henan Province. Geogr. Res. 2013, 7, 1303–1315. (In Chinese) [Google Scholar]
- Chong, Z.; Qin, C.; Ye, X. Environmental Regulation, Economic Network and Sustainable Growth of Urban Agglomerations in China. Sustainability 2016, 8, 467. [Google Scholar] [CrossRef]
- Ye, X.; Wei, Y.D. Geospatial analysis of regional development in China: The case of Zhejiang Province and the Wenzhou model. Eurasian Geogr. Econ. 2005, 46, 445–464. [Google Scholar] [CrossRef]
- Wei, Y.D.; Ye, X. Beyond convergence: Space, scale, and regional inequality in China. Tijdschrift Voor Economische en Sociale Geografie 2009, 100, 59–80. [Google Scholar] [CrossRef]
- Ye, X.; Carroll, M.C. Exploratory space-time analysis of local economic development. Appl. Geogr. 2011, 31, 1049–1058. [Google Scholar] [CrossRef]
- Yue, W.; Zhang, Y.; Ye, X.; Cheng, Y.; Leipnik, M.R. Dynamics of multi-scale intra-provincial regional inequality in Zhejiang, China. Sustainability 2014, 6, 5763–5784. [Google Scholar] [CrossRef]
- He, C.; Ye, X.; Wang, J. Industrial agglomeration and exporting in China: What is the link? Reg. Sci. Policy Pract. 2012, 4, 317–333. [Google Scholar] [CrossRef]
- Zhang, H.; Qiu, F.; Wei, Q.; Tong, L.; Ye, X.; Cheng, Y. Economic development and energy efficiency in Jilin Province, China. J. Geogr. Sci. 2014, 24, 875–888. [Google Scholar] [CrossRef]
- Qiao, J.; Lee, J.; Ye, X. Spatiotemporal evolution of specialized villages and rural development: A case study of Henan province, China. Ann. Am. Assoc. Geogr. 2016, 106, 57–75. [Google Scholar] [CrossRef]
- Leipnik, M.; Su, Y.; Lane, R.; Ye, X. Agriculture and Food Production in China and the US. In A Comparative Geography of China and the US; Springer: Berlin, Germany, 2014; pp. 117–158. [Google Scholar]
- Ye, X.; Leipnik, M. Beyond Small Business and Private Enterprises in China: Global and Spatial Perspectives. In Entrepreneurship and Economic Growth in China; World Scientific: Singapore, 2013; pp. 289–316. [Google Scholar]
Figure 1.
The path of the center of gravity of Chinese crops.

Figure 2.
The average Gini coefficient for the eleven crops over time.

Figure 3.
The longitude coordinates of the barycenter of 11 major crops from 1981 to 2012.
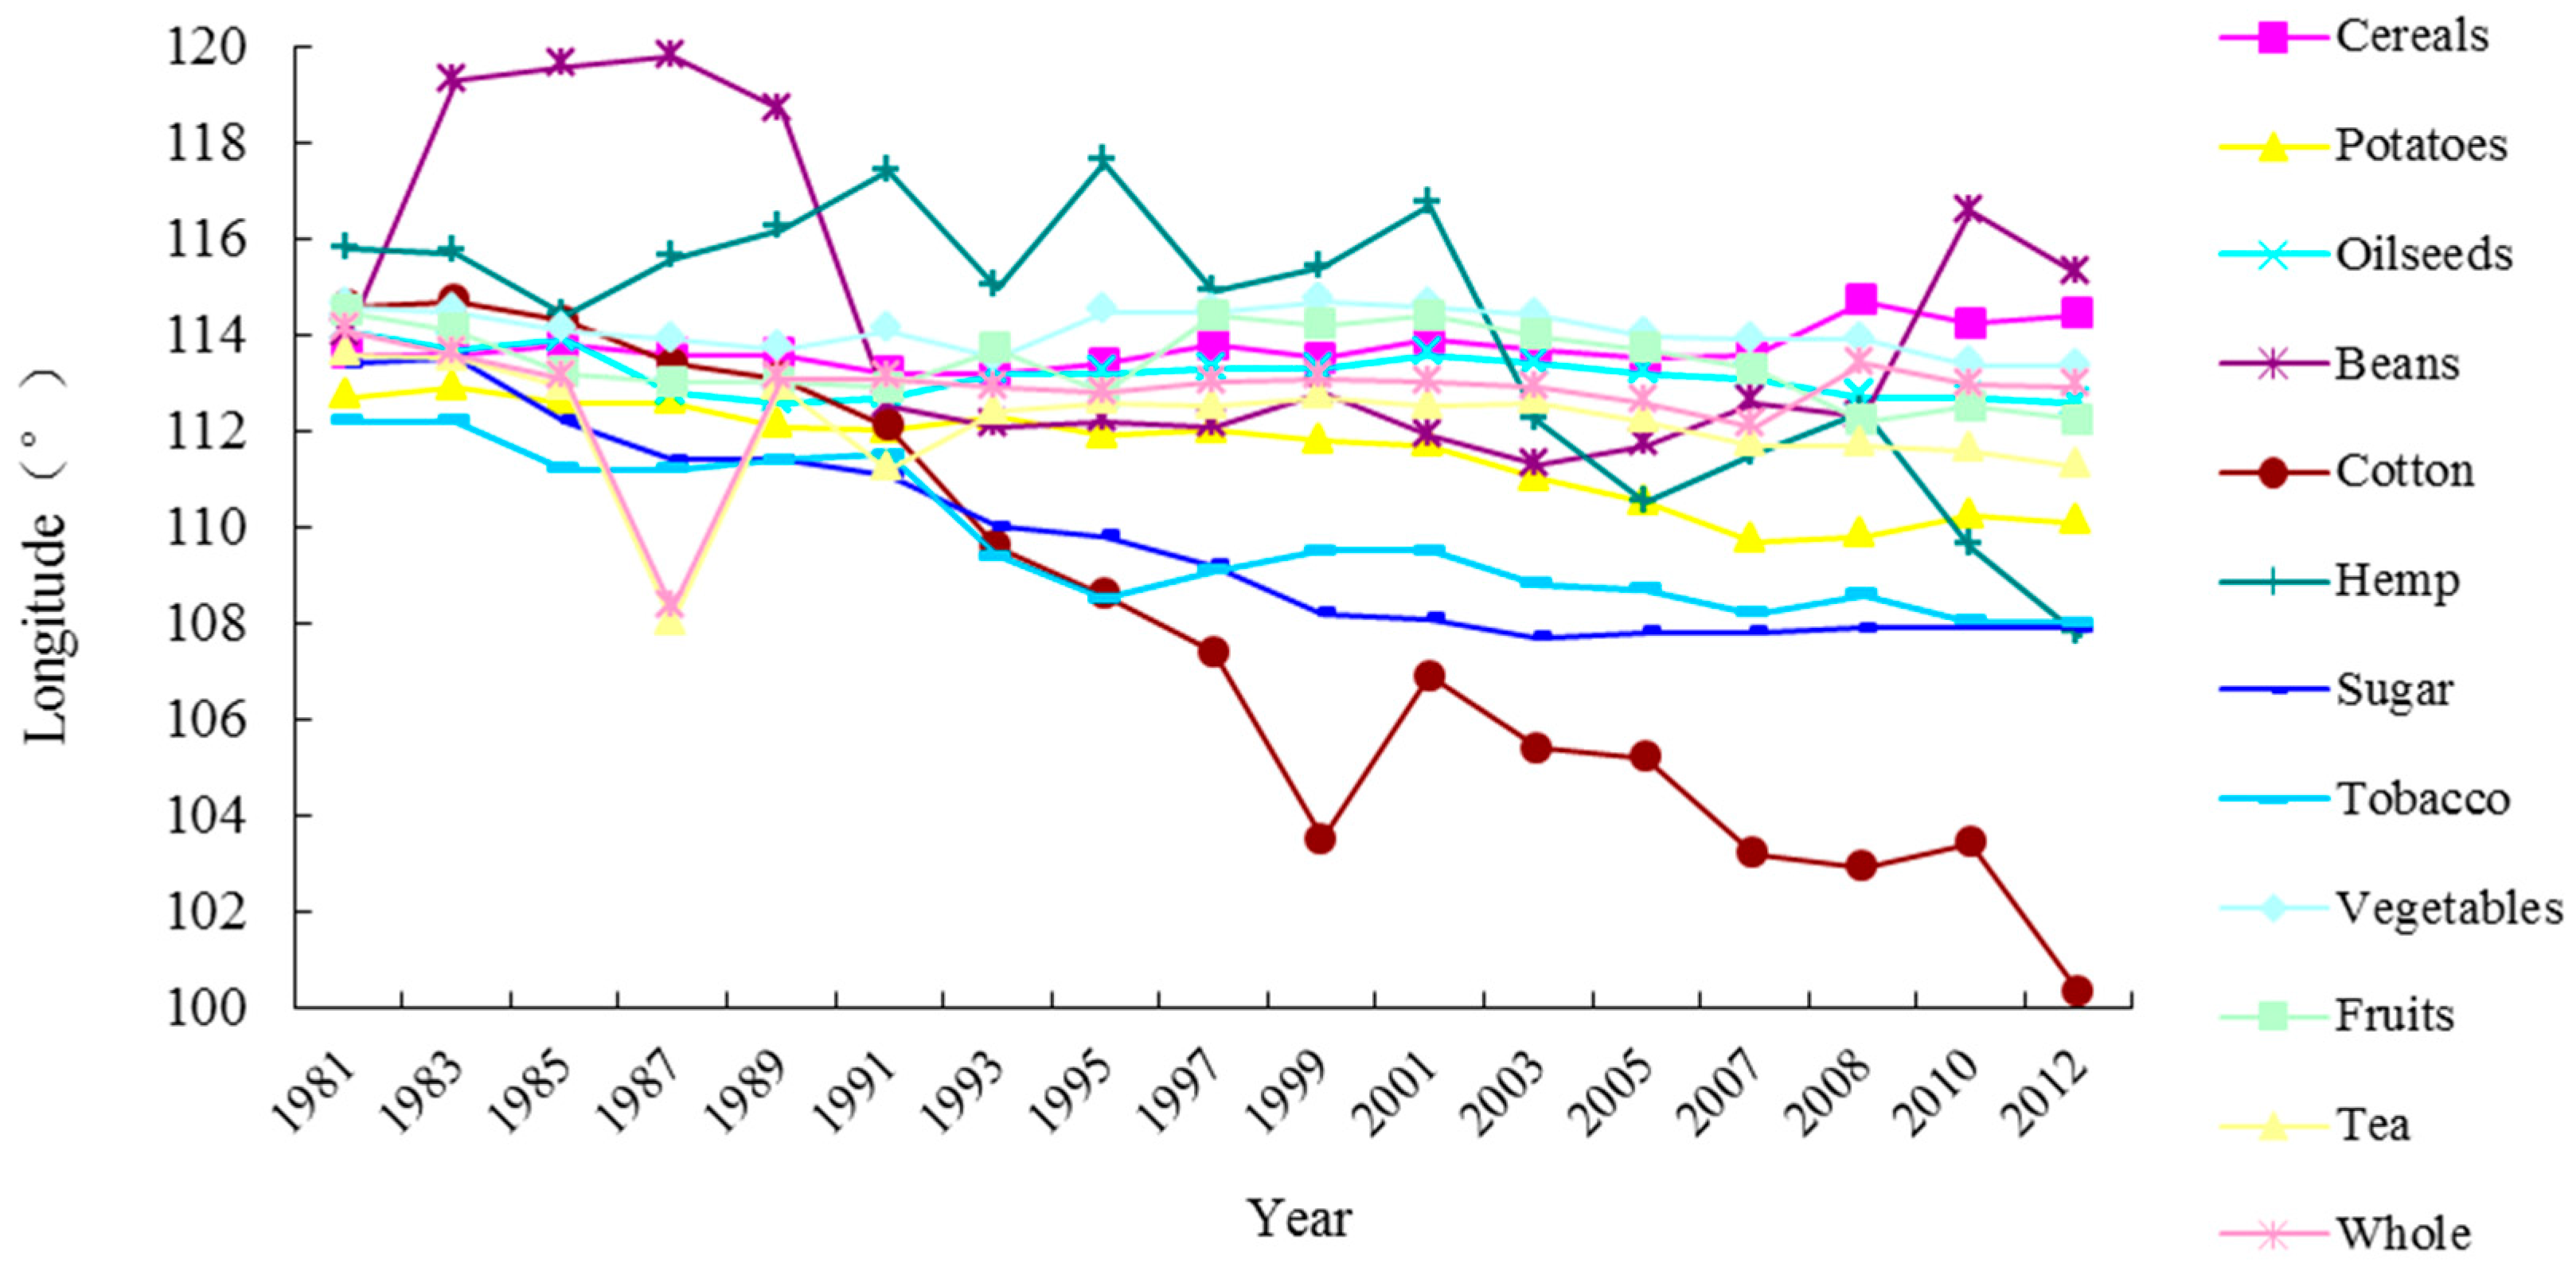
Figure 4.
The latitude coordinates of the barycenter of 11 major crops from 1981 to 2012.

Figure 5.
The change of the Gini coefficient of 11 crops across the period from 1981 to 2012.
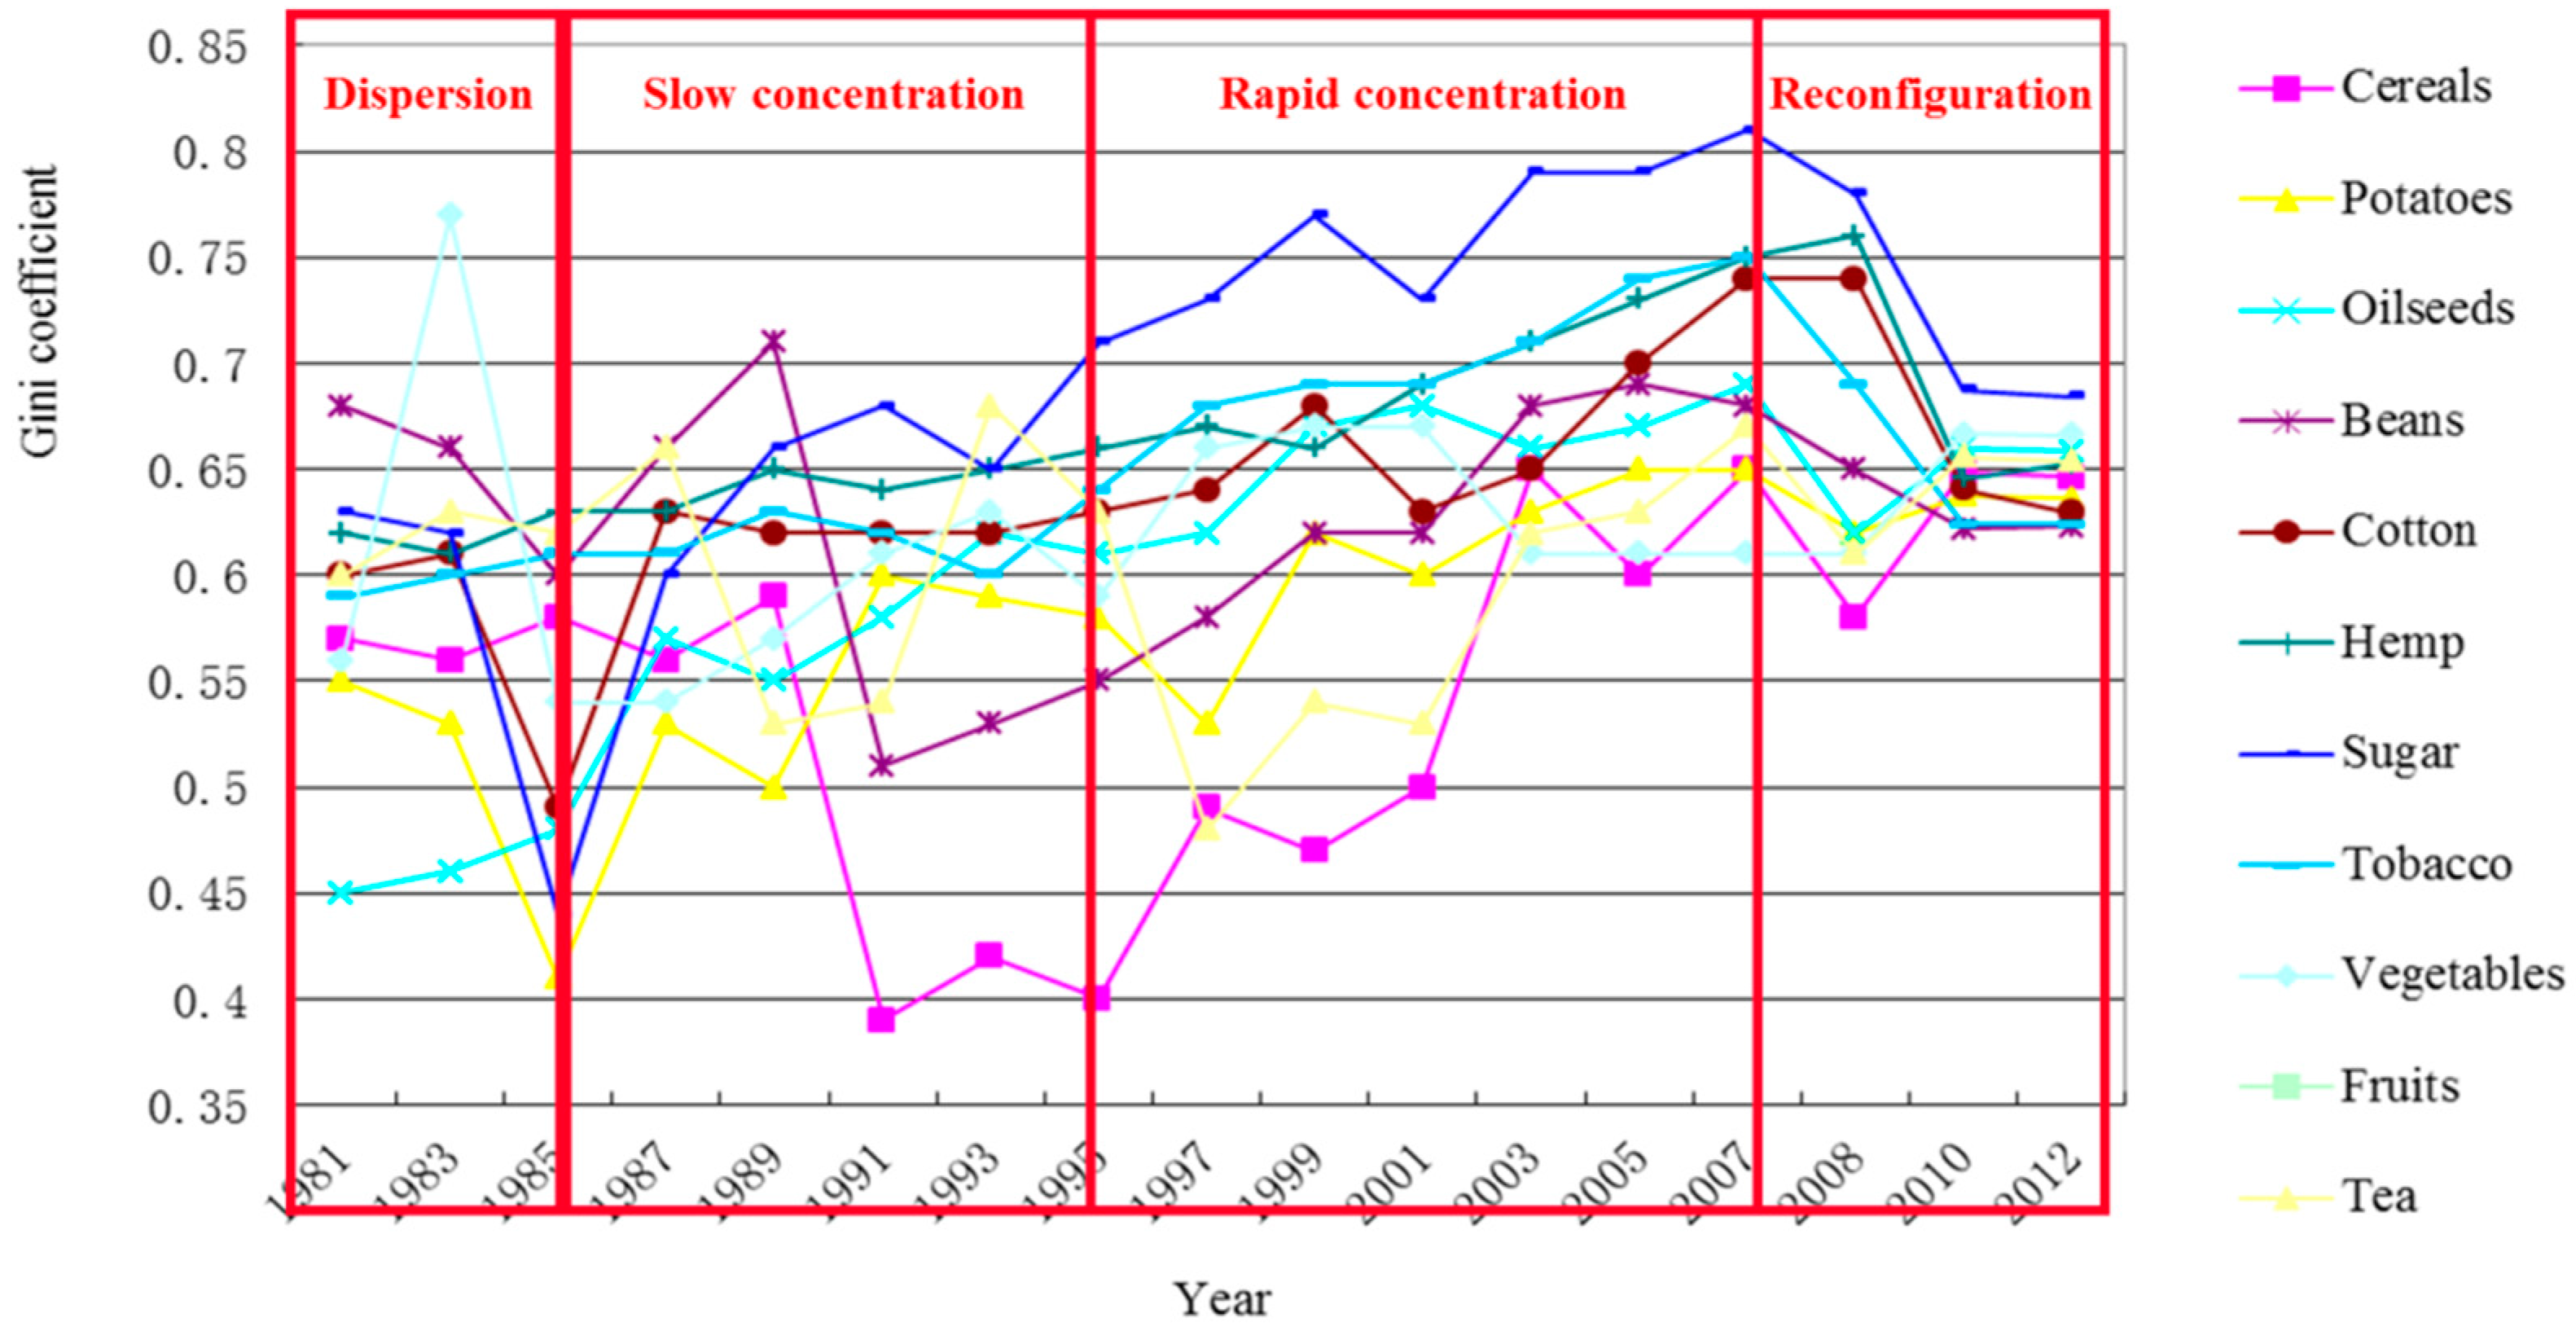
Figure 6.
A political economy analytical framework for the evolution of agricultural agglomeration.
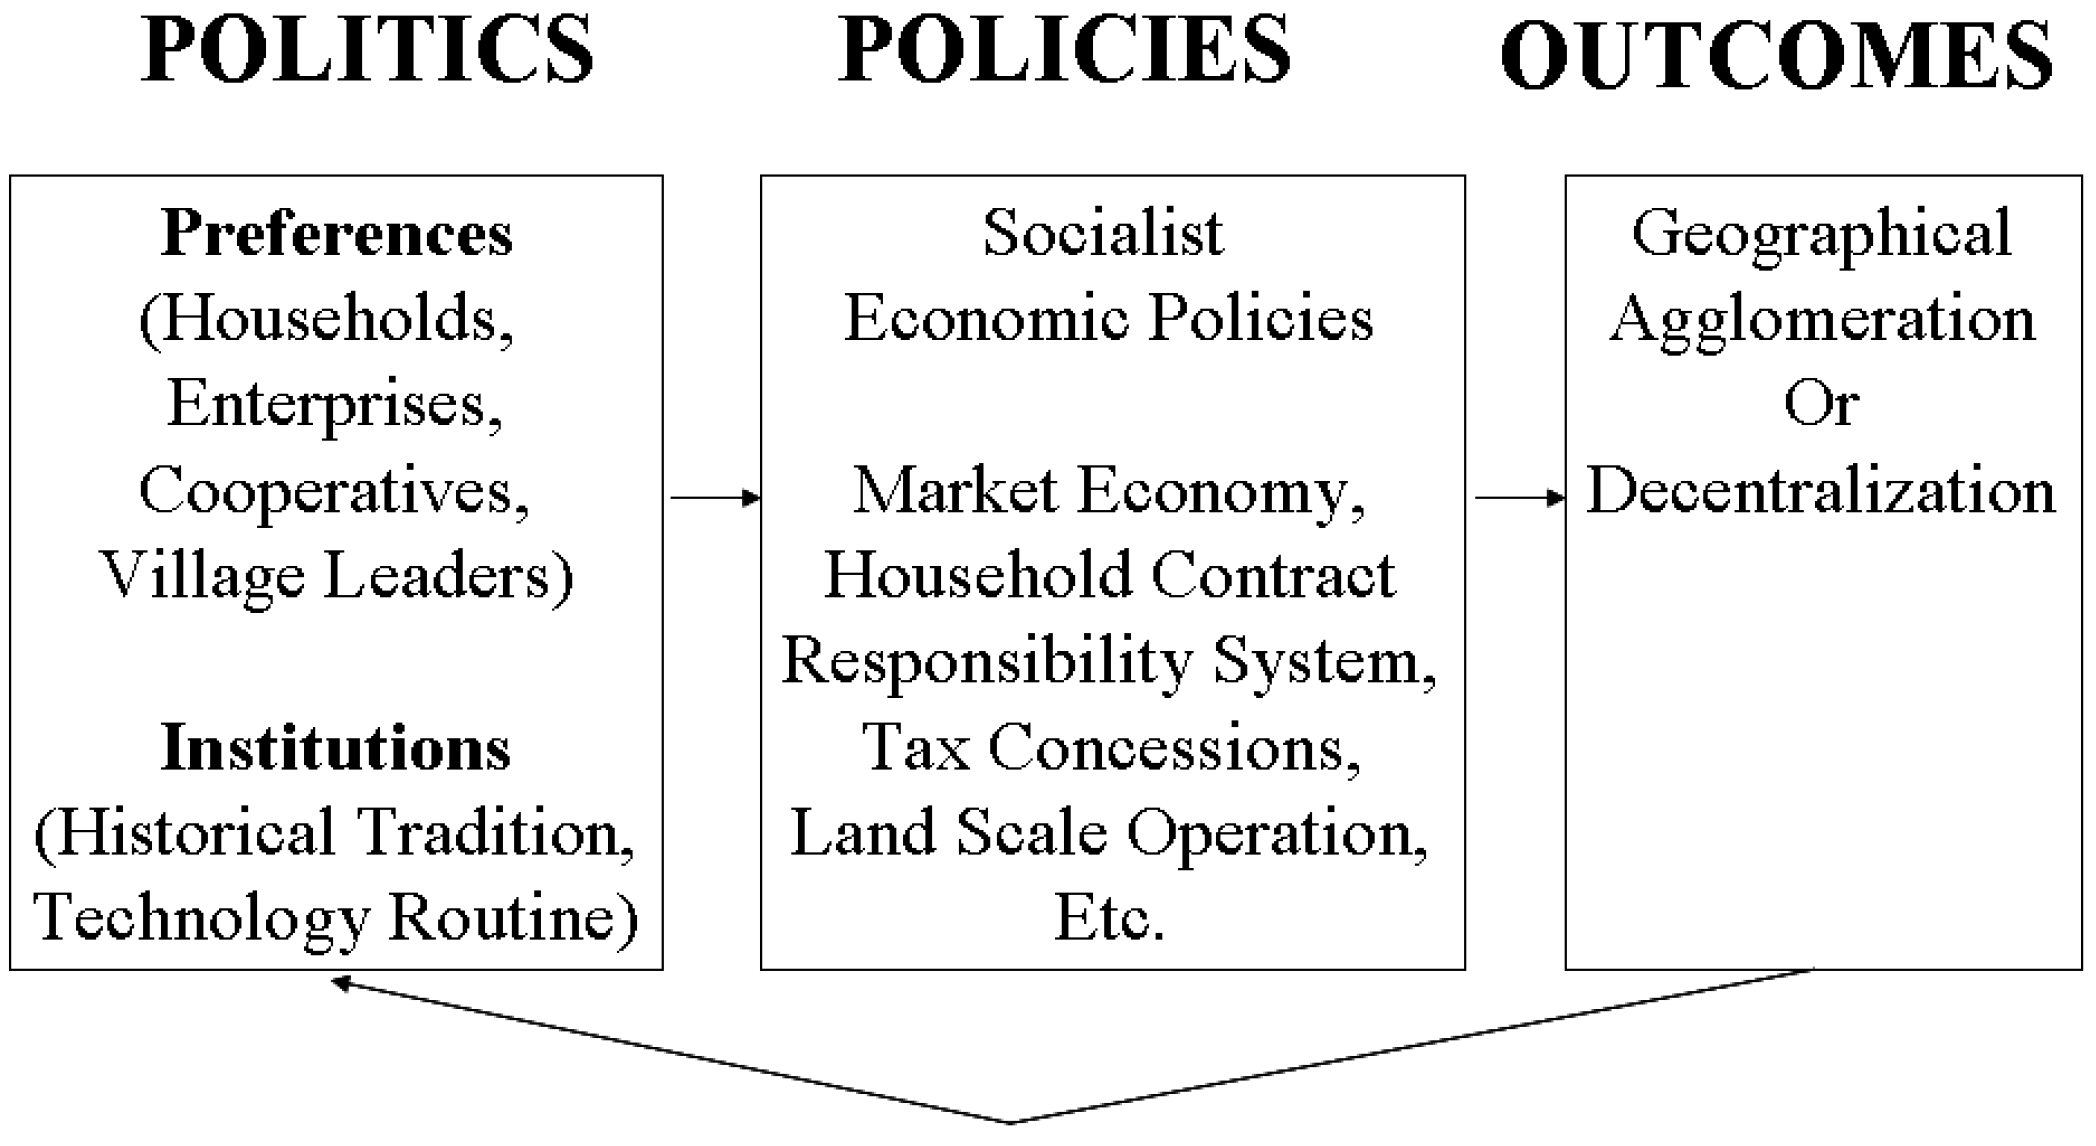
Figure 7.
The Evolution Process of Agricultural Agglomeration Pattern in China.


| Crops | The LQ of the Top Five Provinces in Descending Order (The Average LQ of Five Provinces Is in Parentheses) | The Top Five Producers in Descending Order |
|---|---|---|
| Cereals | Jiangxi, Hubei, Shanghai, Jiangsu, Hunan (1.21) | Sichuan, Shandong, Henan, Jiangsu, Hunan |
| Potatoes | Shandong, Sichuan, Anhui, Henan, Qinghai (1.61) | Sichuan, Shandong, Henan, Anhui, Jiangsu |
| Oilseeds | Qinghai, Inner Mongolia, Tibet, Guizhou, Anhui (2.54) | Shandong, Anhui, Sichuan, Jiangsu, Guangdong |
| Beans | Shandong, Heilongjiang, Sichuan, Anhui, Henan (1.64) | Sichuan, Shandong, Henan, Anhui, Heilongjiang |
| Cotton | Jiangsu, Xinjiang, Shandong, Hubei, Shanghai (2.81) | Shandong, Jiangsu, Henan, Hubei, Hebei |
| Hemp | Anhui, Zhejiang, Heilongjiang, Henan, Guangxi (2.41) | Anhui, Henan, Heilongjiang, Zhejiang, Sichuan |
| Sugar | Guangdong, Guangxi, Fujian, Yunnan, Heilongjiang (3.14) | Guangdong, Guangxi, Fujian, Heilongjiang, Yunnan |
| Tobacco | Guizhou, Yunnan, Henan, Shandong, Anhui (3.14) | Henan, Shandong, Yunnan, Guizhou, Anhui |
| Vegetables | Tibet, Tianjin, Beijing, Liaoning, Heilongjiang(3.07) | Sichuan, Heilongjiang, Shandong, Hunan, Hebei |
| Fruits | Liaoning, Beijing, Hebei, Shandong, Shanxi (3.16) | Shandong, Hebei, Liaoning, Henan, Guangdong |
| Tea | Zhejiang, Hunan, Fujian, Yunnan, Anhui (3.22) | Zhejiang, Hunan, Anhui, Sichuan, Fujian |
| Crops | The LQ of the Top Five Provinces in Descending Order (The Average LQ of Five Provinces Is in Parentheses) | The Top Five Producers in Descending Order |
|---|---|---|
| Cereals | Tibet, Jilin, Jiangsu, Hunan, Heilongjiang (1.4) | Shandong, Sichuan, Jiangsu, Henan, Hunan |
| Potatoes | Sichuan, Guizhou, Qinghai, Fujian, Anhui (2.2) | Sichuan, Shandong, Henan, Anhui, Guangdong |
| Oilseeds | Qinghai, Henan, Anhui, Hubei, Inner Mongolia (2.2) | Shandong, Henan, Anhui, Hubei, Sichuan |
| Beans | Heilongjiang, Qinghai, Tibet, Inner Mongolia, Jilin(3.2) | Heilongjiang, Shandong, Sichuan, Henan, Hebei |
| Cotton | Xinjiang, Henan, Hubei, Jiangsu, Auhui (4.0) | Xinjiang, Henan, Hubei, Jiangsu, Shandong |
| Hemp | Heilongjiang, Anhui, Henan, Hubei, Hunan (3.3) | Heilongjiang, Henan, Anhui, Hubei, Sichuan |
| Sugar | Hainan, Guangxi, Yunnan, Guangdong, Xinjiang (1.2) | Guangxi, Guangdong, Yunnan, Heilongjiang, Hainan |
| Tobacco | Yunnan, Guizhou, Shaanxi, Gansu, Henan (4.9) | Yunnan, Guizhou, Henan, Sichuan, Heilongjiang |
| Vegetables | Tianjin, Beijing, Shanghai, Liaoning , Shandong (1.7) | Shandong, Hebei, Guangdong, Hubei, Henan |
| Fruits | Shaanxi, Fujian, Zhejiang, Shandong, Hebei (2.2) | Shandong, Hebei, Guangdong, Shaanxi, Guangxi |
| Tea | Fujian, Zhejiang, Yunnan, Hunan, Anhui (3.9) | Zhejiang, Fujian, Yunnan, Hunan, Sichuan |
| Crops | The LQ of the Top Five Provinces in Descending Order (The Average LQ of Five Provinces Are in Parentheses) | The Top Five Producers in Descending Order |
|---|---|---|
| Cereals | Jilin, Tibet, Heilongjiang, Jiangxi, Anhui (1.78) | Henan, Shandong, Heilongjiang, Jiangsu, Anhui |
| Potatoes | Qinghai, Chongqing, Guizhou, Gansu, Sichuan (4.9) | Sichuan, Chongqing, Guizhou, Gansu, Inner Mongolia |
| Oilseeds | Qinghai, Hubei, Tibet, Anhui, Henan (3.0) | Henan, Shandong, Hubei, Sichuan, Anhui |
| Beans | Heilongjiang, Qinghai, Inner Mongolia, Jilin, Yunnan, (3.5) | Heilongjiang, Inner Mongolia, Anhui, Sichuan, Yunnan |
| Cotton | Xinjiang, Tianjin, Hubei, Shandong, Hebei (4.8) | Xinjiang, Shandong, Hebei, Henan, Hubei |
| Hemp | Heilongjiang, Xinjiang, Hunan, Sichuan, Hubei (3.7) | Heilongjiang, Hunan, Sichuan, Xinjiang, Hubei |
| Sugar | Guangxi, Yunnan, Hainan, Guangdong, Xinjiang (3.8) | Guangxi, Yunnan, Guangdong, Hainan, Xinjiang |
| Tobacco | Yunnan, Guizhou, Fujian, Chongqing, Sichuan (4.7) | Yunnan, Guizhou, Henan, Sichuan, Hunan |
| Vegetables | Shanghai, Tianjin, Hebei, Beijing, Shandong (1.4) | Shandong, Hebei, Henan, Jiangsu, Sichuan |
| Fruits | Shaanxi, Xinjiang, Hainan, Ningxia, Zhejiang (2.0) | Shandong, Henan, Hebei, Shaanxi, Guangdong |
| Tea | Fujian, Zhejiang, Yunnan, Hubei, Sichuan (4.9) | Fujian, Yunnan, Zhejiang, Sichuan, Hubei |
Note: Chongqing was separated from Sichuan province in 1996.
| Crops | The LQ of the Top Five Provinces Listed in Descending Order (The Average LQ of Five Provinces Are in Parentheses) | The Top Five Producers in Descending Order |
|---|---|---|
| Cereals | Heilongjiang, Jilin, Tibet, Jiangxi, Inner Mongolia (1.9) | Henan, Heilongjiang, Shandong, Jiangsu, Jinlin |
| Potatoes | Beijing, Tianjin, Hebei, Shanxi, Inner Mongolia (4.4) | Sichuan, Chongqing, Gansu, Guizhou, Shandong |
| Oilseeds | Qinghai, Hubei, Tibet, Henan, Sichuan (2.7) | Henan, Shandong, Hubei, Sichuan, Anhui |
| Beans | Heilongjiang, Inner Mongolia, Qinghai, Yunnan, Anhui (3.3) | Heilongjiang, Inner Mongolia, Yunnan, Anhui, Sichuan |
| Cotton | Xinjiang, Tianjin, Hubei, Hebei, Anhui (4.7) | Xinjiang, Shandong, Hebei, Hubei, Anhui |
| Hemp | Sichuan, Xinjiang, Anhui, Hubei, Chongqing (3.1) | Sichuan, Henan, Xinjiang, Anhui, Hubei |
| Sugar | Guangxi, Yunnan, Hainan, Guangdong, Xinjiang (3.9) | Guangxi, Yunnan, Guangdong, Xinjiang, Hainan |
| Tobacco | Yunnan, Guizhou, Fujian, Chongqing, Sichuan (4.5) | Yunan, Guizhou, Henan, Sichuan, Hunan |
| Vegetables | Tianjin, Shanghai, Hebei, Beijing, Shandong (1.5) | Shandong, Hebei, Henan, Jiangsu, Sichuan |
| Fruits | Shaanxi, Hainan, Xinjiang, Ningxia, Beijing (1.9) | Shandong, Henan, Hebei, Shaanxi, Guangdong |
| Tea | Fujian, Zhejiang, Yunnan, Hubei, Guizhou (4.8) | Fujian, Yunnan, Sichuan, Hubei, Zhejiang |
© 2017 by the authors. Licensee MDPI, Basel, Switzerland. This article is an open access article distributed under the terms and conditions of the Creative Commons Attribution (CC BY) license ( http://creativecommons.org/licenses/by/4.0/).
Share and Cite
MDPI and ACS Style
Li, E.; Coates, K.; Li, X.; Ye, X.; Leipnik, M. Analyzing Agricultural Agglomeration in China. Sustainability 2017, 9, 313. https://doi.org/10.3390/su9020313
AMA Style
Li E, Coates K, Li X, Ye X, Leipnik M. Analyzing Agricultural Agglomeration in China. Sustainability. 2017; 9(2):313. https://doi.org/10.3390/su9020313
Chicago/Turabian StyleLi, Erling, Ken Coates, Xiaojian Li, Xinyue Ye, and Mark Leipnik. 2017. "Analyzing Agricultural Agglomeration in China" Sustainability 9, no. 2: 313. https://doi.org/10.3390/su9020313
Note that from the first issue of 2016, this journal uses article numbers instead of page numbers. See further details here.