Article

Temperature and Cardiovascular Mortality Associations in Four Southern Chinese Cities: A Time-Series Study Using a Distributed Lag Non-Linear Model

1
Precision Forestry Key Laboratory of Beijing, Beijing Forestry University, Beijing 100083, China
2
The Key Laboratory of Land Surface Pattern and Simulation, Chinese Academy of Science, Beijing 100101, China
3
Beijing Aerospace TITAN Technology Co., LTD, Beijing 100083, China
4
School of Public Health, University of Queensland, Brisbane QLD 4072, Australia
*
Author to whom correspondence should be addressed.
Sustainability 2017, 9(3), 321; https://doi.org/10.3390/su9030321
Submission received: 10 November 2016 / Revised: 13 February 2017 / Accepted: 15 February 2017 / Published: 23 February 2017

Abstract

:
Few studies on population-specific health effects of extreme temperature on cardiovascular diseases (CVDs) deaths have been conducted in the subtropical and tropical climates of China. We examined the association between extreme temperature and CVD across four cities in China. We performed a two-stage analysis; we generated city-specific estimates using a distributed lag non-linear model (DLNM) and estimated the overall effects by conducting a meta-analysis. Heat thresholds of 29 °C, 29 °C, 29 °C, and 30 °C and cold thresholds of 6 °C, 10 °C, 14 °C, and 15 °C were observed in Hefei, Changsha, Nanning, and Haikou, respectively. The lag periods for heat-related CVD mortality were observed only for 0–2 days, while those of cold-related CVD mortality were observed for 10–15 days. The meta-analysis showed that a 1 °C increase above the city-specific heat threshold was associated with average overall CVD mortality increases of 4.6% (3.0%–6.2%), 6.4% (3.4%–9.4%), and 0.2% (−4.8%–5.2%) for all ages, ≥65 years, and <65 years over a lag period of 0–2 days, respectively. Similarly, a 1 °C decrease below the city-specific cold threshold was associated with average overall CVD mortality increases of 4.2% (3.0%–5.4%), 4.9% (3.5%–6.3%), and 3.1% (1.7%–4.5%), for all ages, ≥65 years, and <65 years over a lag period of 0–15 days, respectively. This work will help to take appropriate measures to reduce temperature-mortality risk in different populations in the subtropical and tropical climates of China.

1. Introduction

Determining the potential health impacts of climate change is an important but complex issue [1]. In the last century, global temperatures have undergone dramatic changes [2,3]. According to the fourth International Panel of Climate Change, the number of warm days and nights has significantly increased for 70% to 75% of land regions [4]. In recent years, the frequency of warm days and nights has also increased, which increases the relative risk of extreme temperature exposure [5].
Because of these dramatic global temperature changes, temperature-related mortality studies have become increasingly important, especially for cardiovascular disease (CVD) [6,7]. Many studies have shown that extreme temperatures seriously impact CVD [8,9,10,11,12,13]. Both heat waves and cold snaps significantly increase CVD mortality [14,15]. To date, studies of the temperature and CVD mortality have been primarily conducted in Europe and the United States [6,16]. In contrast, studies of temperature-related CVD mortality in China are lacking and typically focus on northern China [17,18]. For southern China, only some large cities have been studied, such as Changsha, Kunming, Guangzhou, and Zhuhai [19,20,21,22,23]. Furthermore, these studies mainly focused on the impact of temperature on total mortality not the CVD mortality.
Moreover, these studies focused on single cities, and few multi-site studies have been conducted in southern China [24]. Studying the relationship between extreme temperatures and CVD mortality in the southern cities of China is important since their climate and socio-economic status are different from the northern cities.
Previous studies have reported a non-linear (U, V, or J shaped) association between ambient temperature and CVD mortality [7,25]. In U-shaped associations, when temperature is above or below the hot or cold threshold, the relative risk for CVD mortality increases with increases and decreases in temperature. CVD mortality gradually changes when temperatures fall between these two thresholds. Temperature thresholds usually vary by location and are strongly associated with latitude [26,27].
Temperature-related mortality also varies with age, gender, and socio-economic status [28,29]. Previous studies indicate that older individuals and females are more sensitive to extreme temperatures than young individuals and males [8,18,30]. In addition, black men with low income, and those who spend significant time outdoors are more affected than white men and highly educated individuals [31].
Here, we analyzed temperature-related CVD mortality in four cities from southern China (Hefei, Changsha, Nanning, and Haikou, Figure 1). We first used a distributed lag non-linear model (DLNM) to estimate the effects of temperature on CVD mortality in individual cities. A meta-analysis was then used to stratify these results by age and gender [27].

2. Materials and Methods
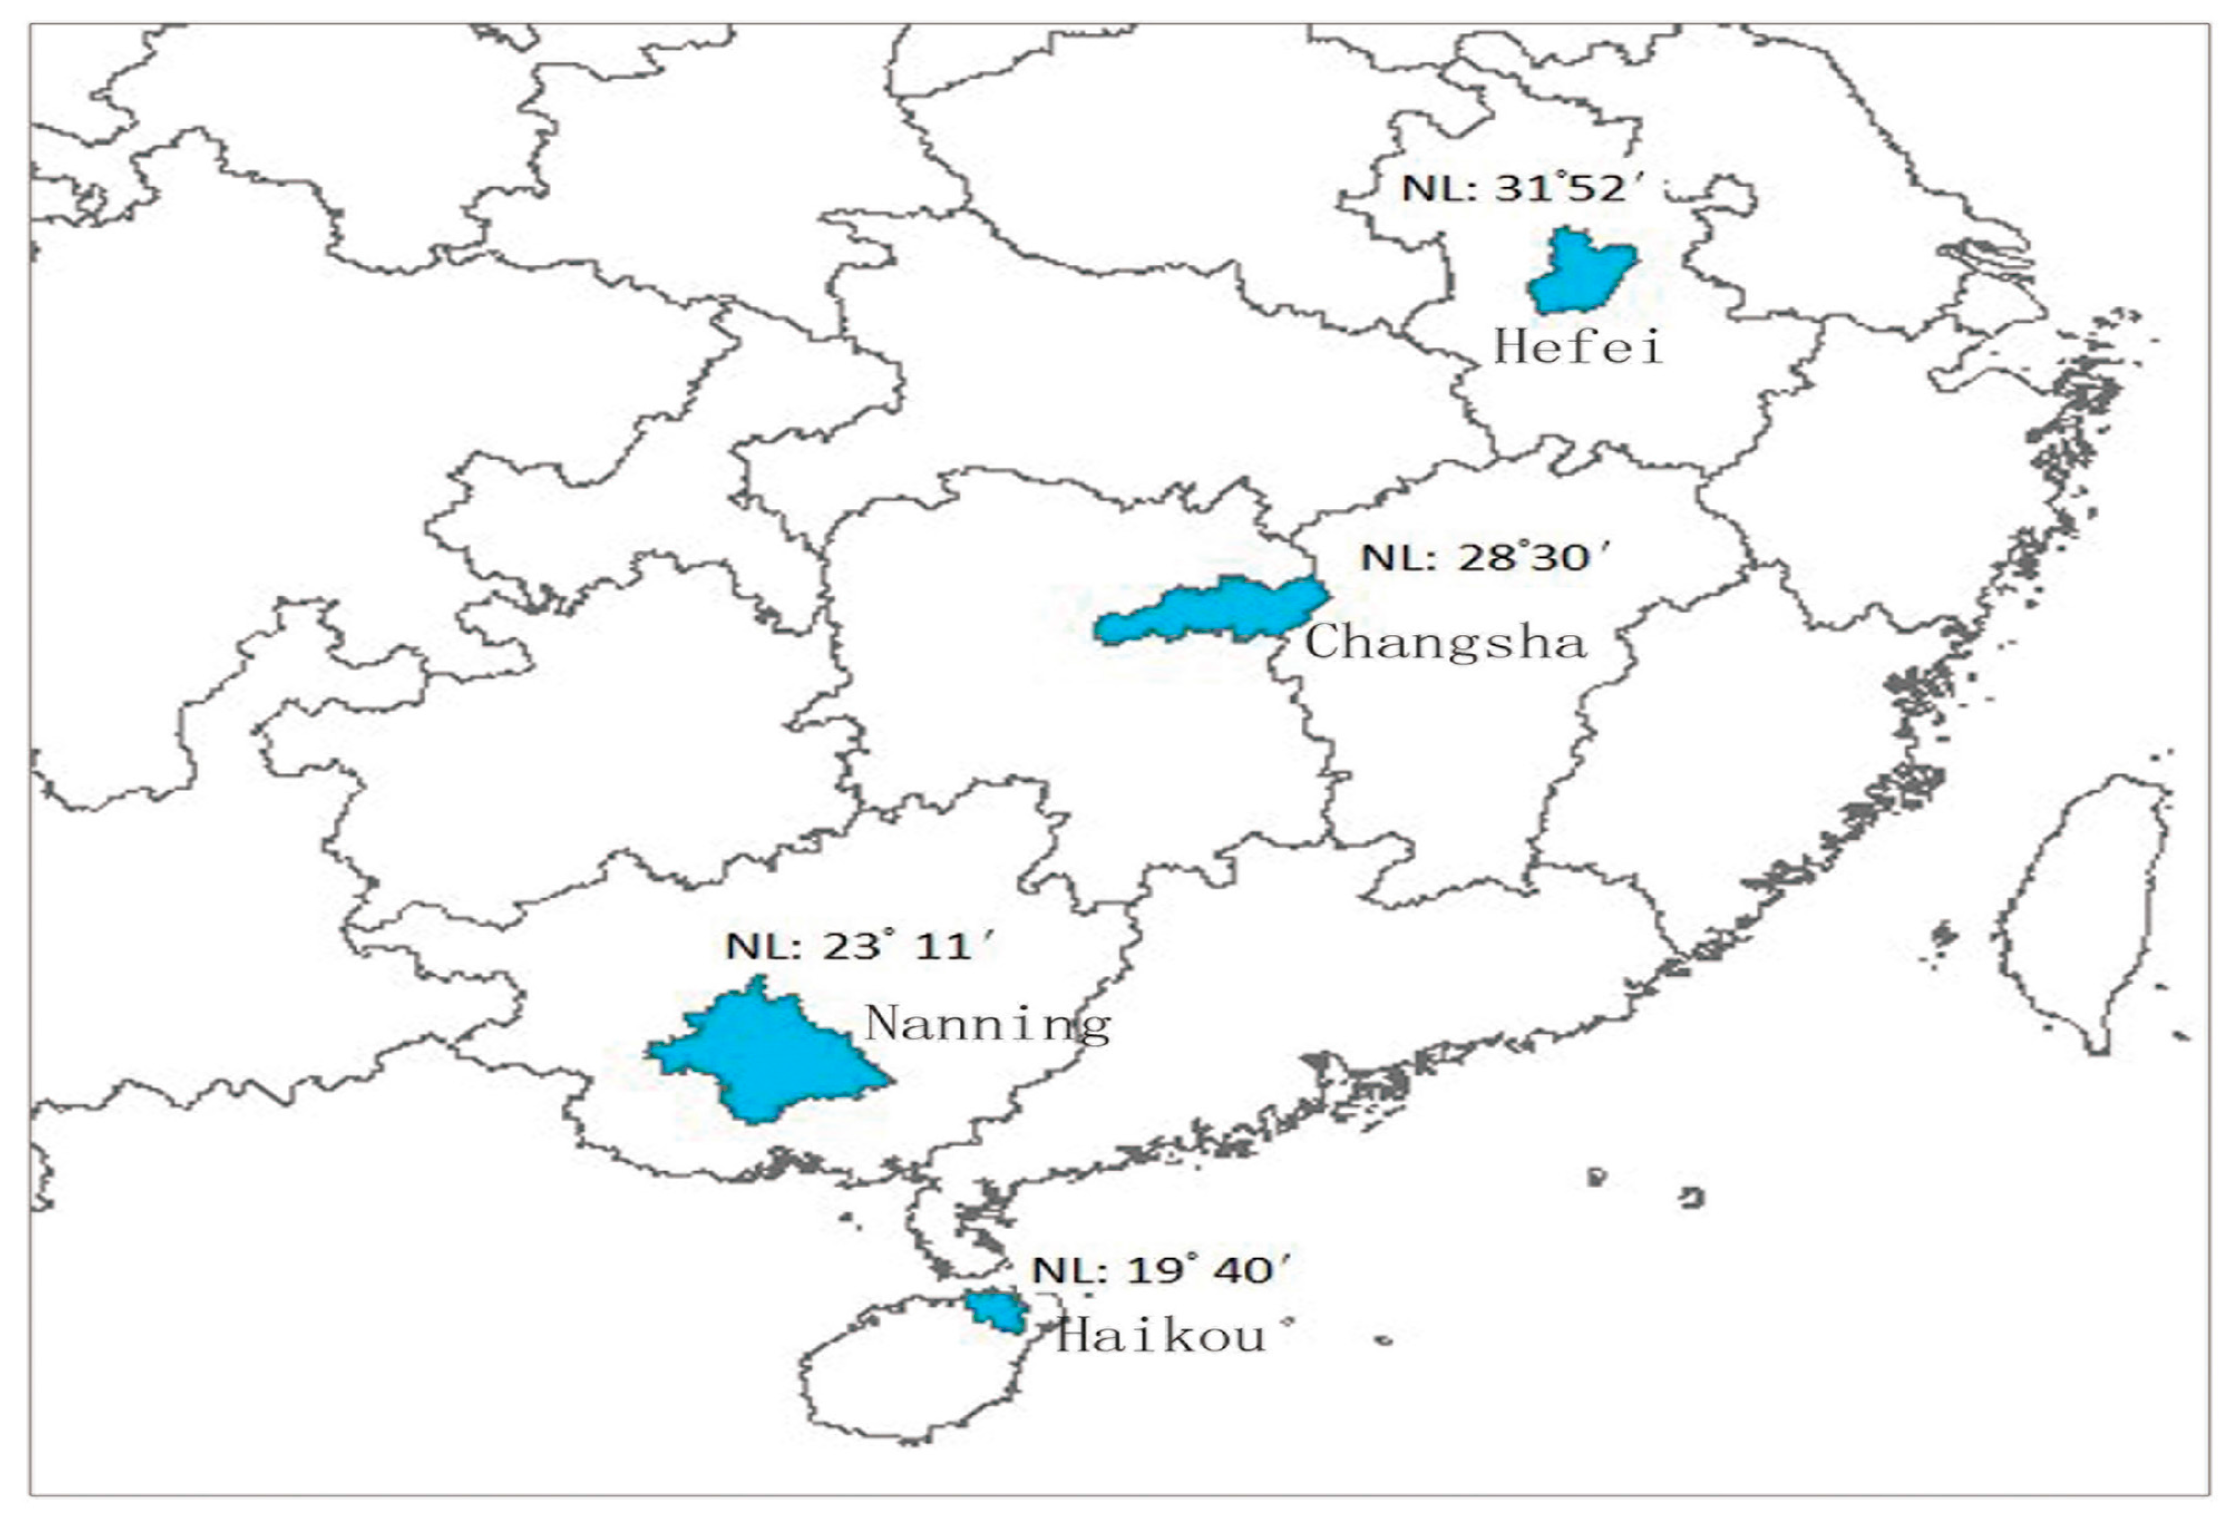
2.1. Study Area

Four capital cities in southern China were selected in this study: Hefei, the capital of Anhui province; Changsha, the capital of Hunan province; Nanning, the capital of Guangxi province; and Haikou, the capital of Hainan province (Figure 1). The first three cities are located in a subtropical zone, while Haikou is located in a tropical zone. Hefei and Changsha have subtropical monsoon climates with high summer temperatures and low winter temperatures. Nanning is located along the Tropic of Cancer with a wet summer climate and a dry winter climate. Haikou has a typical tropical maritime monsoon climate with high summer temperatures and relatively warm winter temperatures.
Socio-economic data was only available for one county from Hefei (Chaohu County), one district and one county from Changsha (Tianxin District and Liuyang County), one county from Nanning (Laiyang County), and one district from Haikou (Meilan District). In 2011, the populations in each city were 0.89, 1.82, 1.01, and 0.5 million, respectively, while their Gross Regional Domestic Products were 17.1, 46.5, 13.7, and 17.4 billion CNY, respectively [32].

2.2. Data Collection

Daily CVD mortality data between 2008 and 2011 were collected for the four cities from the Chinese Center for Disease Control and Prevention. The causes of CVD were classified according to the 10th International Classification of Disease (ICD-10:I00-I79). In order to analyze the impact of temperature on different populations, we divided the whole population into four subgroups; ≥65 years, <65 years, males, and females.
Table 1 displays the distributions of daily CVD mortality, and Table 2 displays the meteorological factors. There were a total of 41,577 CVD deaths between January 2008 and December 2011. Mortality was highest among those aged ≥65 years and was slightly higher in men than in women. Older individuals (≥65) accounted for 85.4%, 82.5%, 80.2%, and 78.3% of total deaths for Hefei, Changsha, Nanning, and Haikou, respectively.
Daily meteorological data (maximum, minimum, and mean temperature and atmospheric pressure and relative humidity) for the same time period was collected from the China Meteorological Data Sharing Service System. Each city has two meteorological monitoring stations; the average of the meteorological data from both stations was used. The daily mean temperatures were 16.4 °C, 18.3 °C, 21.4 °C, and 23.9 °C for Hefei, Changsha, Nanning, and Haikou, respectively. The diurnal temperature ranges were 38.6 °C, 37.8 °C, 27.6 °C, and 22.9 °C for Hefei, Changsha, Nanning, and Haikou, respectively.
China’s State Environment Protection Agency (SEPA) is responsible for measuring the level of air pollution in China. The air pollution indices (API) level was based on the level of five atmospheric pollutants, namely sulfur dioxide (SO2), nitrogen dioxide (NO2), suspended particulates (PM10), carbon monoxide (CO), and ozone (O3), measured at the monitoring stations throughout each city. An individual score is assigned to the level of each pollutant and the final API is the highest of those five scores. The pollutants can be measured quite differently. SO2, NO2, and PM10 concentration are measured as the average per day. CO and O3 are more harmful and are measured as the average per hour. The final API value is calculated per day [33]. For every station, each pollutant’s daily individual API was calculated from the 24 h average mass concentration. The highest individual API was selected and reported as the daily API. The API can replace detailed air pollution data (such as PM10 and SO2) and act as an ambient air quality indicator [33,34]. In this study, the APIs were obtained from the Chinese Environmental Protection Agency. The API in the four cities were 83.5, 68.7, 52.4, and 38.4, respectively.

2.3. Data Analysis

We used a generalized additive model (GAM) to analyze the association between temperature and CVD mortality [29,35]. In order to explore the non-linear impacts of daily temperature on CVD mortality during different lag periods, a DLNM (DLNM) [36] was used in this study, and Akaike information criterion (AIC) [37] were used to test model fitting. The analysis was conducted in two stages. First, we estimated city-specific effects using data from each city. Then, we used a meta-analysis to estimate the overall effects and the spatial heterogeneity [38].
In the first stage, for city-specific analyses, we adopted the GAM to analyze time series data. Each city had an outcome variable (daily CVD death counts for all ages and genders) and several covariates, such as temperature and API. We assumed that the outcome variable followed a Poisson distribution [38]. Daily CVD deaths can be affected by long-term and seasonal trends, holidays, the day of the week (DOW), and meteorological factors [27]. Therefore, these variables were included in our models. In addition, because confounding variables such as API, barometric pressure, and relative humidity have lag effects on mortality, we examined a lag period of 0–7 days for these confounders. The AIC value of the model was lowest when all confounding variables had a lag period of 7 days, except API, which had a lag period of 3 days. We divided the CVD mortality data into five groups (all ages, ≥65 years, <65 years, males, and females) and analyzed the associations with each group. The detailed GAM was as follows [35]:
L o g ( Y t ) = α + β C ( T t τ C ) + β H ( T t τ H ) + i = 1 m s ( x i t , 4 ) + s ( t i m e t , 7 × y e a r ) + j = 1 n δ j z j + ε t
where Y t represents the number of daily CVD deaths on day t; T t denotes the daily mean temperature; τ H and τ C are the heat and cold temperature thresholds, respectively; s ( . ) denotes the smoothing splines function; x i t denotes API and meteorological factors; t i m e t refers to calendar time; z j represents DOW and public holidays; α is the intercept term; β C , β H , and δ j are coefficients; and ε t is the residual [39].
First, we estimated the shape of the exposure-response curve between temperature and CVD mortality for all ages as previously described [38]. The lag-stratified natural cubic spline models were used to analyze the non-linear and lag characteristics of temperature-associated CVD mortality. Mean temperature at the lowest city-specific mortality was used as a reference value. A natural cubic spline with seven degrees of freedom (df)/year for calendar time was used to control for long-term and seasonal trends, and natural cubic splines with five df/year were used to smooth the API and other confounders [6,29]. We first plotted three-dimensional associations between mean temperature and CVD mortality with a lag period of 30 days (Figure 2). We then analyzed the association between temperature and relative mortality risks with lag periods of 1, 7, 14, 21, and 28 day (Figure 3). Here, Lag0_7 denotes the cumulative impact of the temperatures from the prior seven days and the current day on the current day’s mortality [27].
Next, we calculated temperature thresholds for the four cities. The previous research showed that the association between temperature and CVD mortality was U shaped [19,25]; therefore, we used the double threshold-natural cubic spline DLNM from a previous study [17]. We assumed both heat- and cold-related CVD mortality were linear, and the temperature thresholds were calculated as previously described [25].
We then estimated the heat- and cold-related CVD mortality for the different population groups (all ages, ≥65 years, <65 years, males, and females) in each city. The DLNM framework [36] was used to account for lag effects. We calculated a relative increase in CVD mortality risk for every 1 °C increase or decrease above or below the hot and cold thresholds [27].
In the second stage, we quantitatively summarized the results for each city using a meta-analysis [38,40]. To combine the city-specific effect estimates of temperature on mortality, we used random-effects meta-analysis [41]. So, if bi is the coefficient of interest in city i, we assume that bi ~N (b, Vi+ S), where b is the summary estimate from all cities, Vi is the estimated variance in city i, and S is the random variance component among cities. Variables representing potential effect modifiers were introduced in second-stage regression models to investigate the causes of heterogeneity [38]. The meta-analysis further estimated the effects of heat (1 °C increase above the heat threshold) and cold (1 °C decrease below the cold threshold) for different population groups. The analyses were performed in R2.14.2 with the ‘dlnm1.6.5’ package for the DLNM and the ‘metafor’ package for the meta-analysis [40].

2.4. Sensitivity Analyses

In this study, we varied the degree freedom for long-term trends and other variants, such as API and air pressure, from 2 to 10 df/year. No significant changes were observed in these analyses.

3. Results

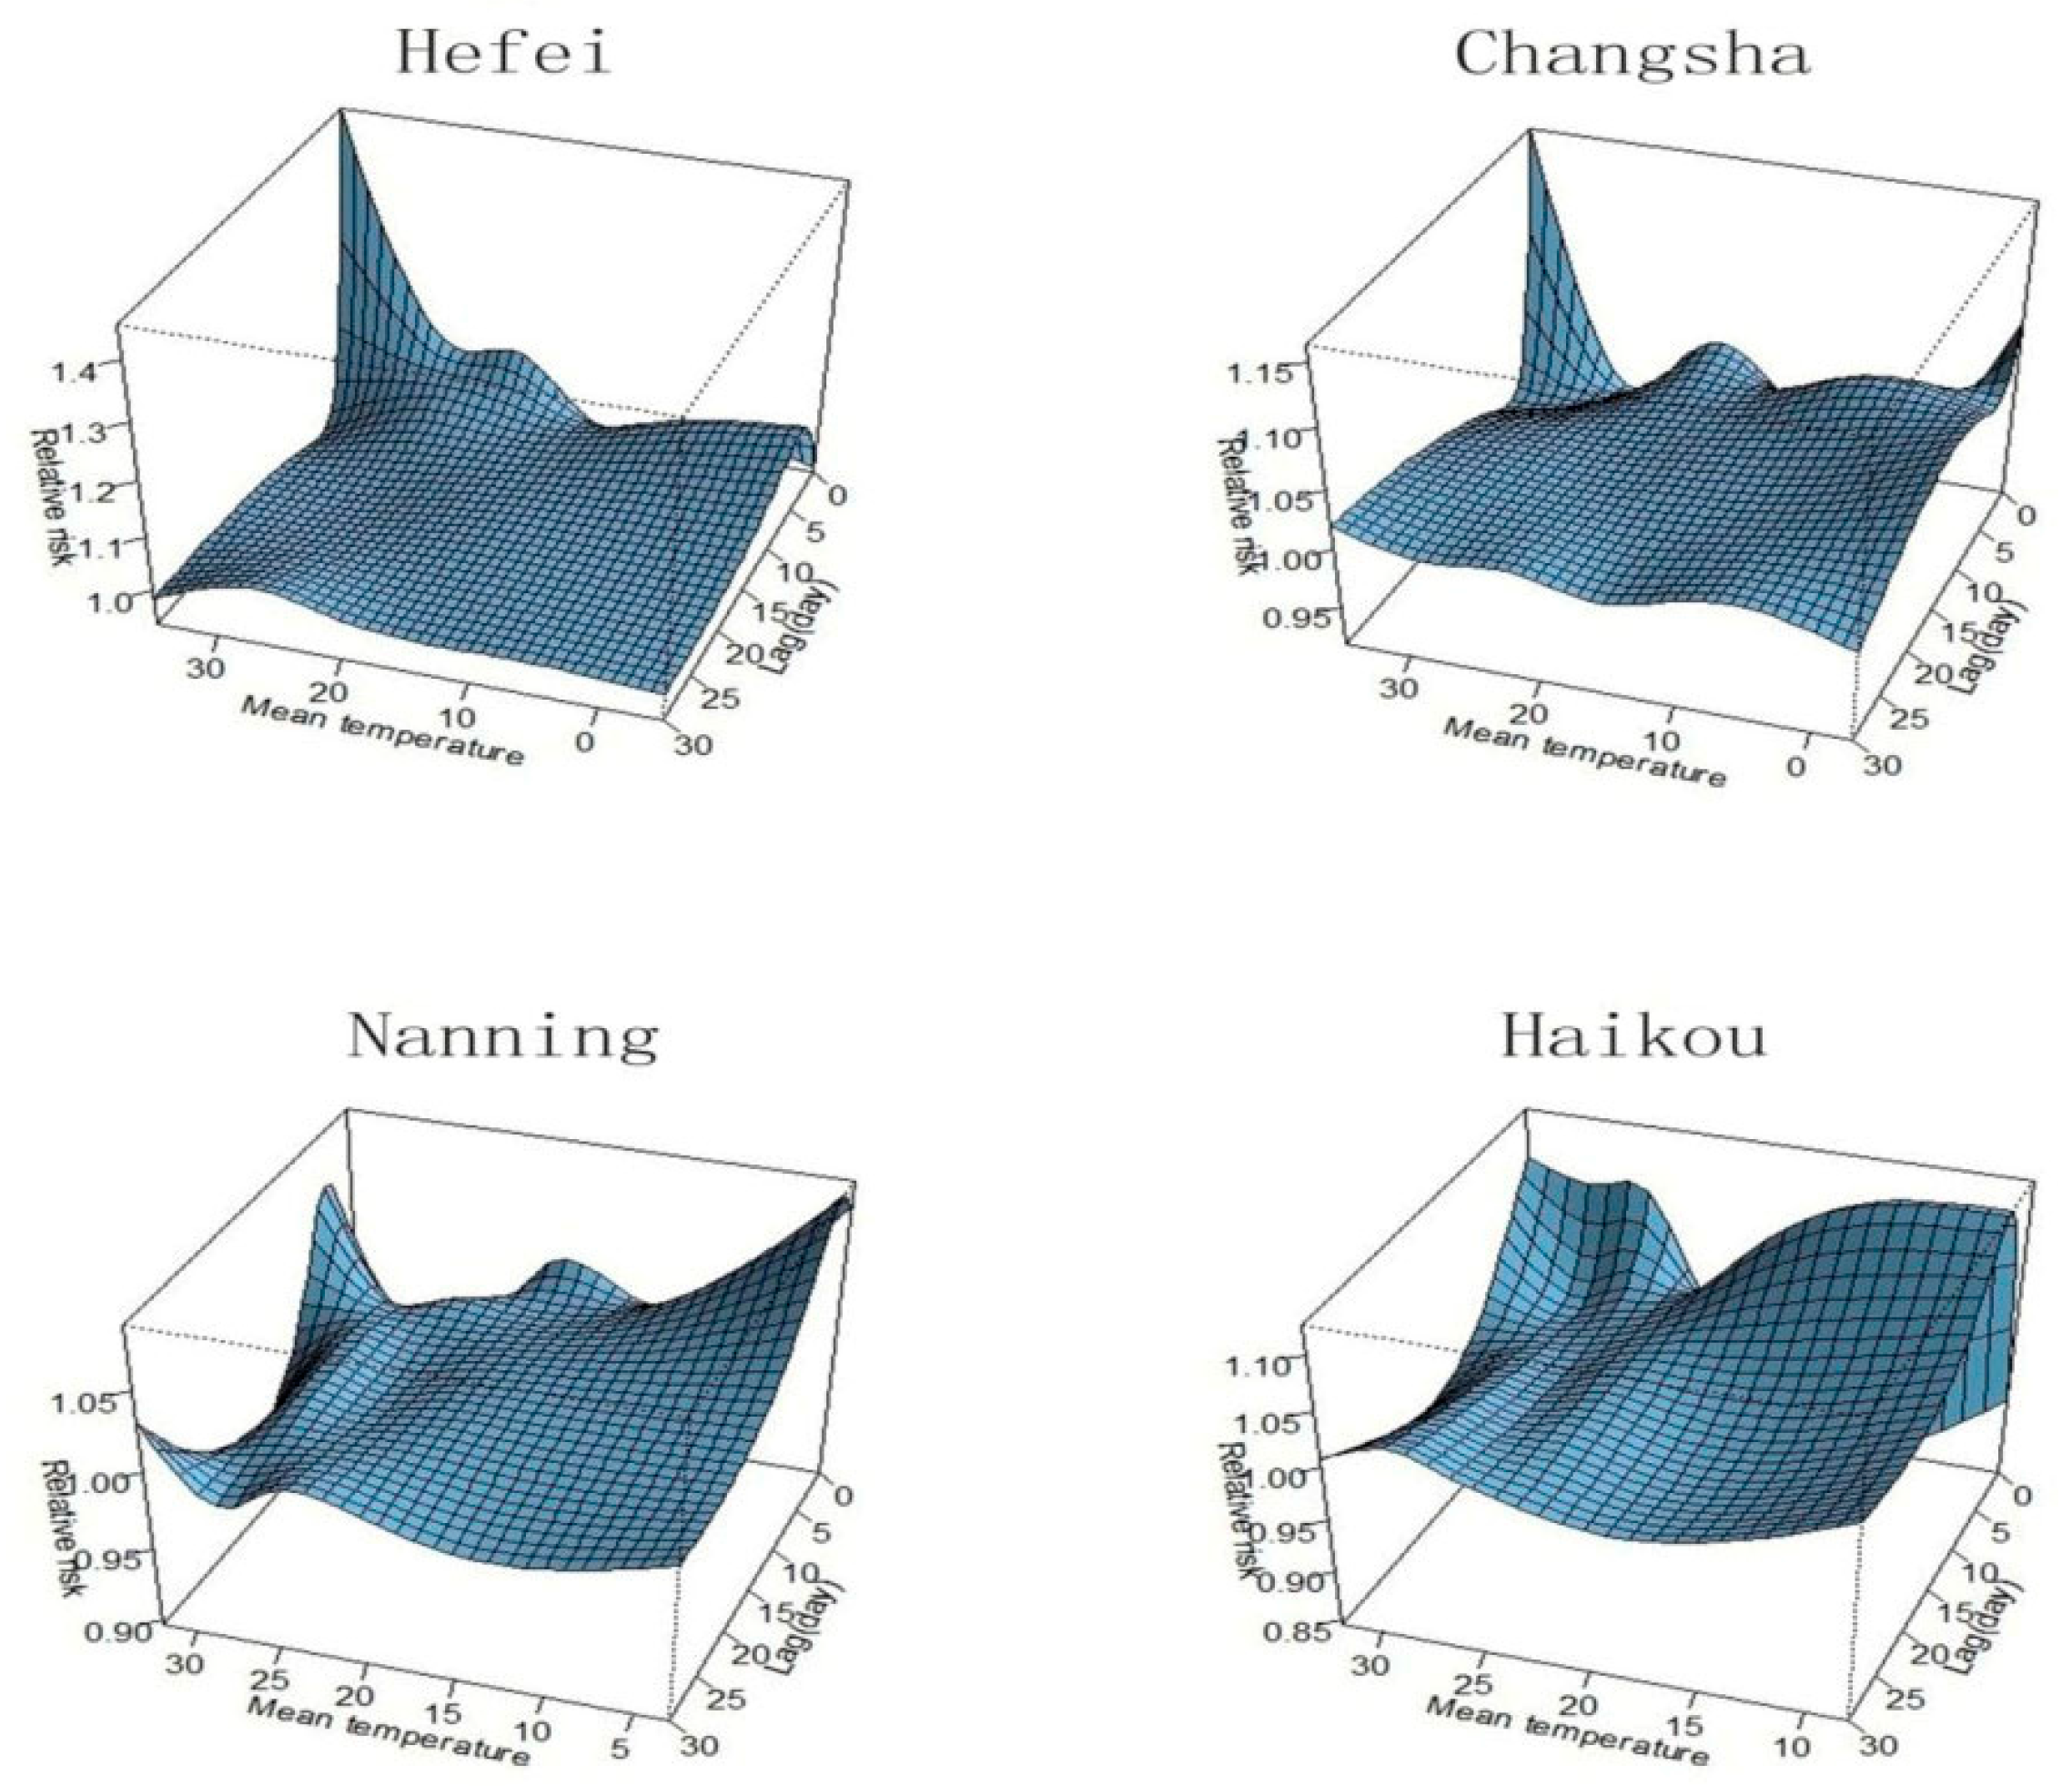
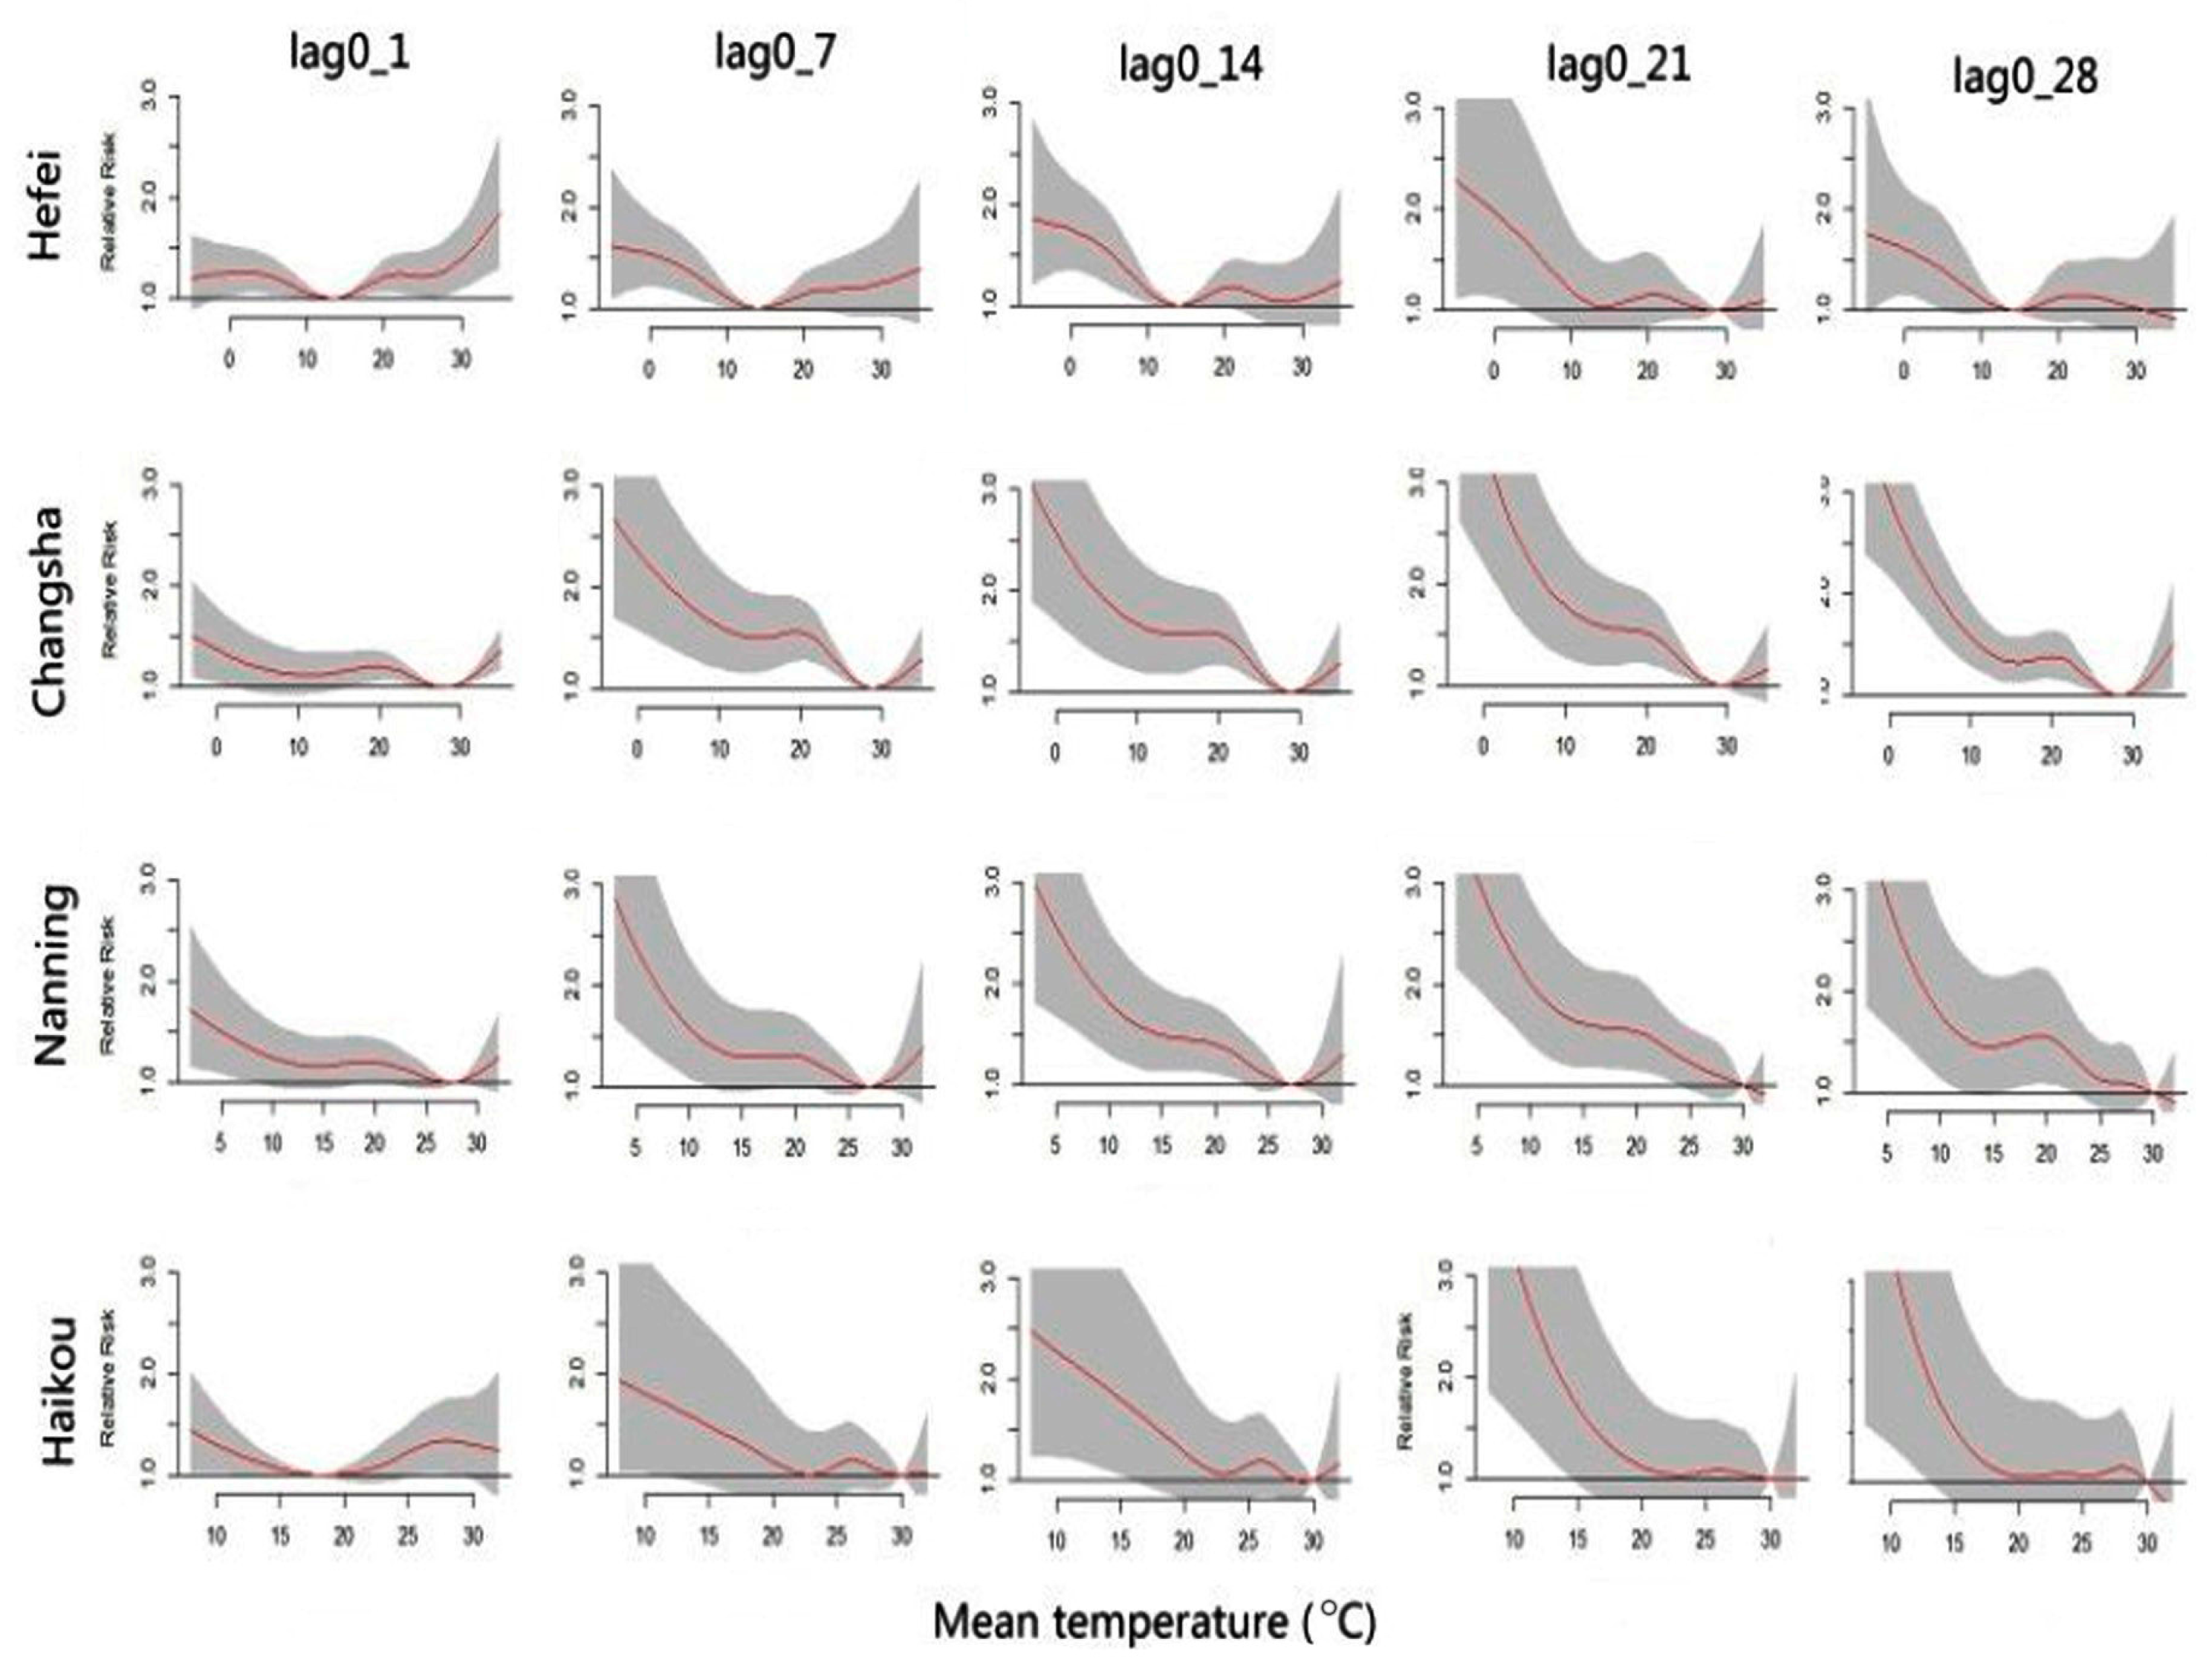
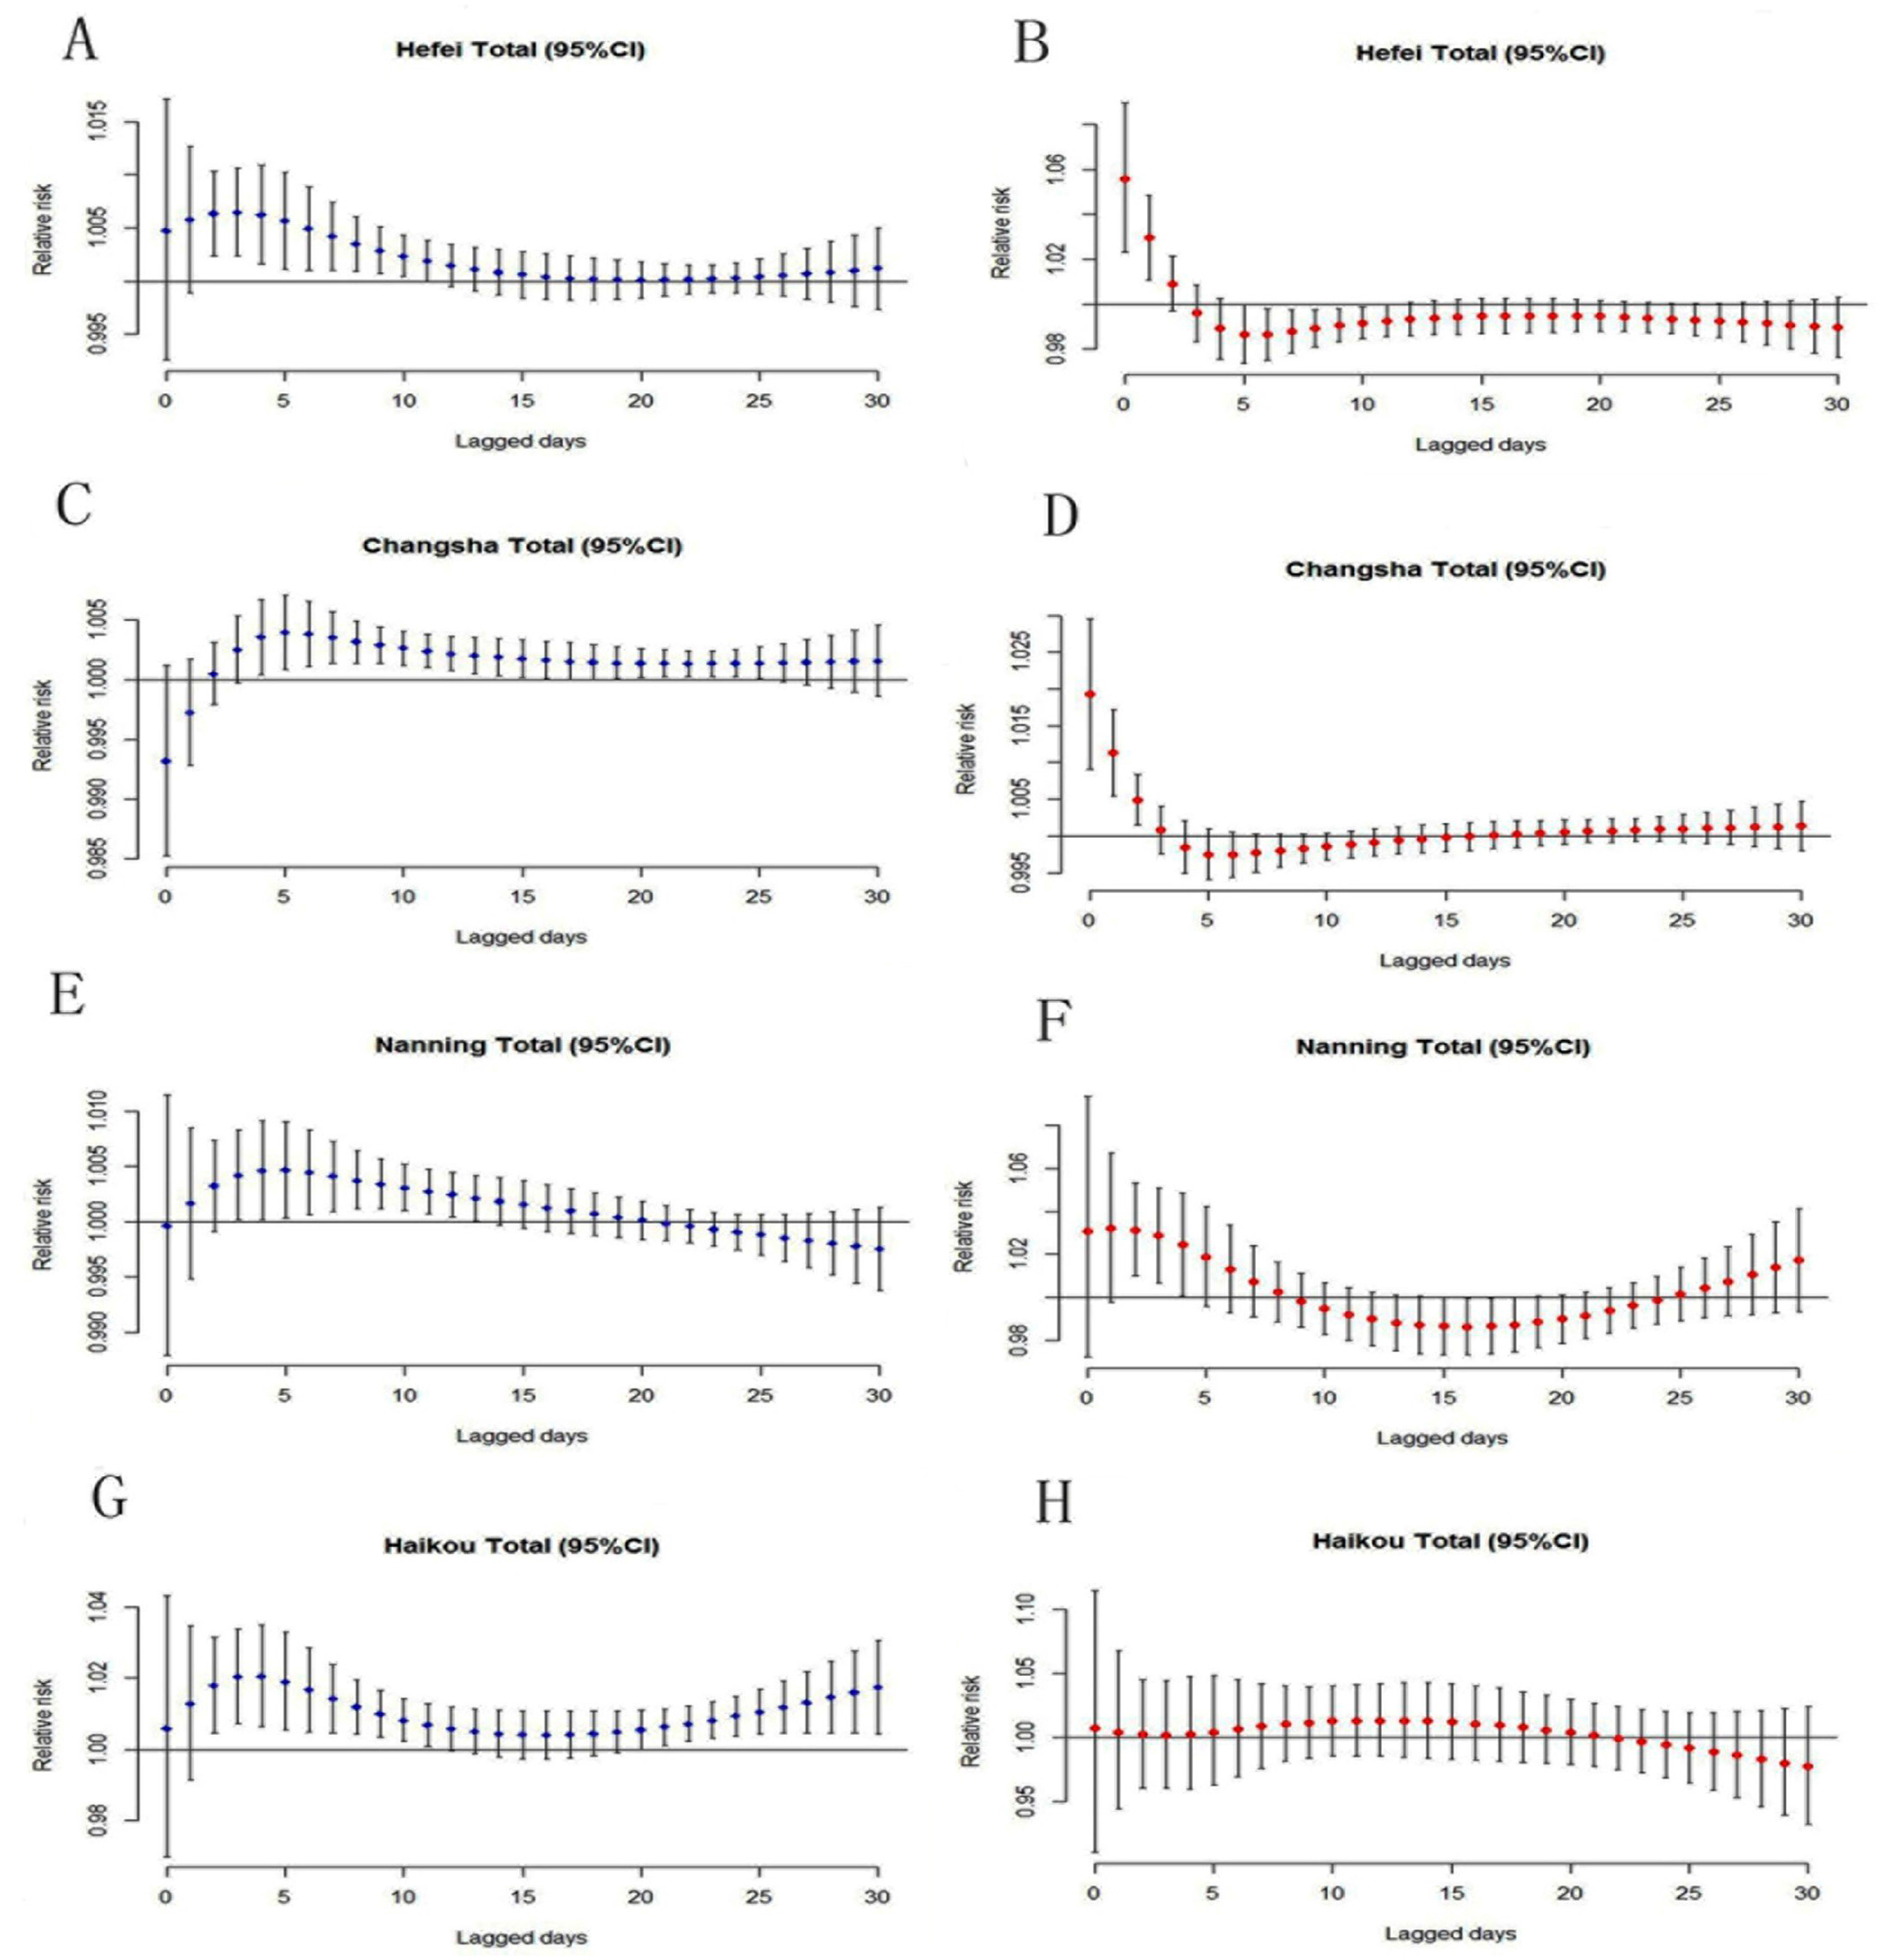
3.1. Temperature Thresholds and Lag Periods

Three-dimensional associations between mean temperature and CVD mortality with a lag period of 30 days are shown in Figure 2. The shapes of the temperature-CVD mortality association were similar between Hefei and Changsha. Their relationships with heat-related mortality were very obvious, while those with cold-related mortality were not. For Nanning and Haikou, the relationships with cold-related mortality were more apparent than those with heat-related mortality. The city-specific temperature-CVD mortality curves appeared to be U shaped (Figure 3).The AIC values were used to determine the hot and cold temperature thresholds for each city. The heat thresholds were 29 °C, 29 °C, 29 °C, and 30 °C and the cold thresholds were 6 °C, 10 °C, 14 °C, and 15 °C for Hefei, Changsha, Nanning, and Haikou, respectively.
The lag periods for heat- and cold-related CVD mortality in each city are shown in Figure 4. Cold-related CVD mortality had lag periods of 2–11 days, 3–15 days, 3–13 days, and 2–12 days for all ages in Hefei, Changsha, Nanning, and Haikou, respectively (Figure 4A,C,E,G). Statistically significant heat-related CVD mortality was observed in Hefei, Changsha, and Nanning (Figure 4B,D,F) but not in Haikou (Figure 4H). Moreover, we found that the lag periods of heat-related CVD mortality were very short, only 0–2 days.

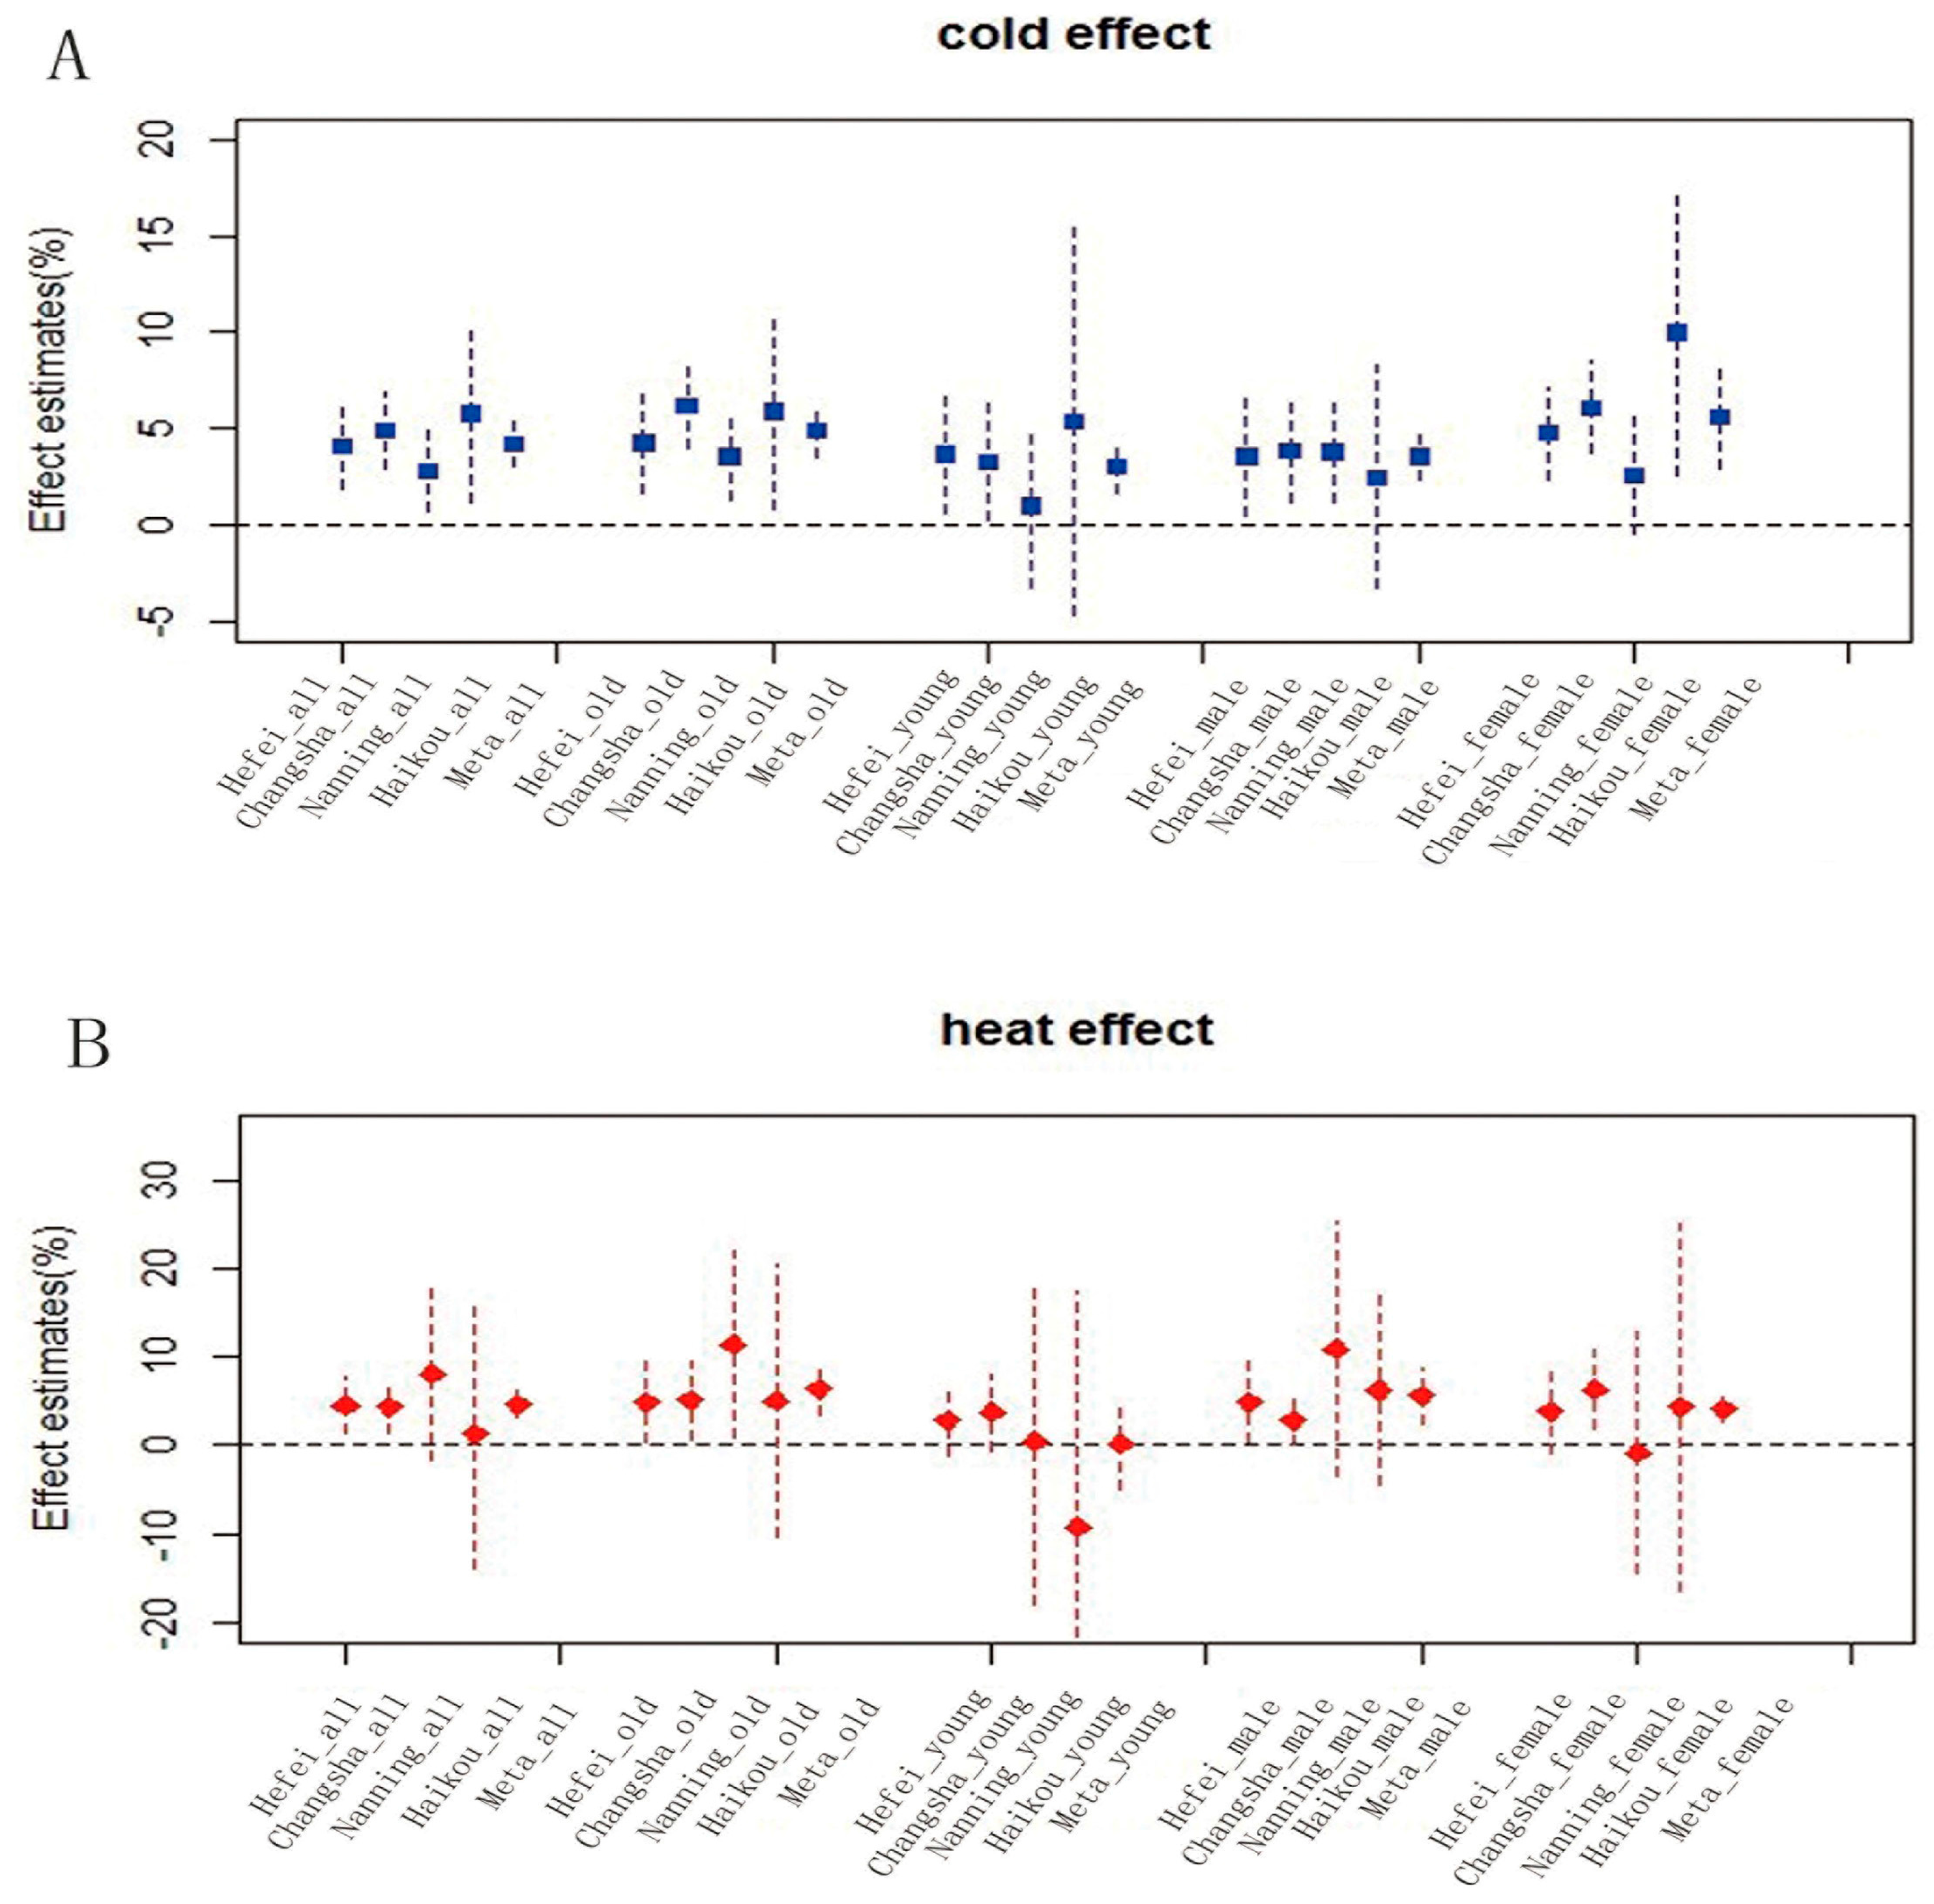
3.2. Temperature-Related CVD Mortality Effects

The cumulative effect of heat-(2 day lag period) and cold-(15 day lag period) related CVD mortality for each city were calculated in Table 3. A 1 °C decrease below each cold threshold temperature was associated with an overall increase in CVD mortality of 4.1% (95% CI: 1.9%–6.2%), 4.9% (95% CI: 2.9%–6.9%), 2.8% (95% CI: 0.7%–5.1%), and 5.8% (95% CI: 1.2%–10.7%) for Hefei, Changsha, Nanning, and Haikou, respectively. A 1 °C increase above each heat threshold temperature was associated with an overall increase in CVD mortality of 4.5% (95% CI: 1.2%–7.9%), 4.4% (95% CI: 1.4%–7.5%), 9.8% (95% CI: −1.7%–18.7%), and 4.2% (95% CI: −13.9%–17.9%) for Hefei, Changsha, Nanning, and Haikou, respectively.
We also calculated the cumulative effect of the heat-(2 day lag period) and cold-(15 day lag period) related CVD mortality of the subgroups in each city. For cold-related CVD mortality, the cumulative effects on the aged (those ages > 65) were always higher than the effects on young people (those ages < 65). The aged in Changsha was most seriously affected by the extreme cold temperature, wherein a 1 °C decrease below the cold threshold was associated with increase in CVD mortality of 6.2% (95% CI: 4.0%–8.3%). In addition, we found that the cold effect for the young people was not significant in lower latitudes (Nanning and Haikou). Females in all cities were more seriously affected by the extreme cold temperature than men except Nanning, where the cold effect for females was not significant. Furthermore, we found an interesting phenomenon; the cold-related CVD mortality for females in Haikou was very high, wherein 1 °C decrease below the cold threshold was associated with an increase in CVD mortality of 10.0% (95% CI: 2.6%–17.9%).
We also found that the aged in all cities were more affected by extreme hot temperatures, especially in Nanning, where the relative risk of CVD mortality will increase 11.4% (0.9%–22.8%) with a 1 °C increase above the heat threshold. In addition, the cumulative effect of heat-related CVD mortality was not significant in lower latitudes (such as Nanning and Haikou) (Table 3).
Meta-analysis results are shown in Table 4 and Figure 5. A 1 °C increase above each heat threshold was associated with overall increases in CVD mortality of 4.6% (3.0%–6.2%), 6.4% (3.4%–9.4%), 0.2% (−4.8%–5.2%), 5.6% (2.5%–8.7%), and 4.1% (2.7%–5.5%) for all ages, ≥65 years, <65 years, males, and female, respectively. A 1 °C decrease below each cold threshold was associated with overall increases in CVD mortality of 4.2% (3.0%–5.4%), 4.9% (3.5%–6.3%), 3.1% (1.7%-4.5%), 3.6% (2.2%–5.0%), and 5.6% (3.9%–8.3%) for all ages, ≥65 years, <65 years, males, and females (Table 4). The relative risk of cold-related CVD mortality was higher for females than males, while males were more sensitive to extreme hot temperatures than females (Figure 5).

4. Discussion

Previous studies of temperature-related CVD mortality have been mostly conducted in Europe and the United States [6,16]. Recently, studies are emerging with thorough investigations in developing countries such as Vietnam, Thailand, and particularly China [42]. Temperature-related mortality exhibits spatial heterogeneity [43]. In China, studies of this association have been conducted in the large cities of China such as Beijing, Shanghai, and Tianjin [17,18,44], or some small communities in sub-tropical and tropical climates. This research focused on the temperature related CVD mortality in four medium cities of southern China; Hefei, Changsha, Nanning, and Haikou.
This study found that extreme temperatures can affect CVD mortality in southern China. In cold environments, this could be because, when exposed in cold air conditions, the blood supplied to the skin decreases, which results in an accumulation of blood in central organs, and salt and water removes the excess blood. In hot environments, in order to maintain body temperature, sweat is expelled from the body, decreasing salt and water in the body. This increases blood density and may lead to haemoconcentration and the risk of thrombosis [45].
There was a non-linear lag effect between temperature and CVD mortality and these effects were different across the four cities. The discrepancy of the heat thresholds in the four cities was not significantly different from that of the cold thresholds. The results showed that the heat thresholds were 29 °C, 29 °C, 29 °C, and 30 °C and the cold thresholds were 6 °C, 10 °C, 14 °C, and 15 °C for Hefei, Changsha, Nanning, and Haikou, respectively. Previous studies showed that the temperature threshold effect exhibits spatial heterogeneity [19,20,21,22,23]. We compared the results with previous studies that were conducted in East Asia. Guo et al. found the cold and heat thresholds were 0.6 °C and 25.1 °C in Tianjin [17]. In the research by Chung et al., the heat thresholds were 32 °C, 33 °C, 30 °C, and 25 °C for Beijing, Seoul, Tokyo, and Taipei, respectively [7]. For another research of all-cause mortality, Wu et al. disclosed the cold thresholds were 7 °C, 15 °C, 13 °C, and 15 °C for Changsha, Kunming, Guangzhou, and Zhuhai, respectively [27]. Although the research conditions were different for these studies, we clearly found that the heat thresholds were close to each other, while the discrepancy in cold thresholds was huge. Hefei and Changsha are located in the Yangtze River basin, while Haikou is located in a tropical maritime monsoon climate. Compared to Haikou, temperatures were lower in the Yangtze River basin in the winter (Table 2).In contrast, there is no significant difference in temperature between Haikou and the Yangtze River basin in summer. This may explain the differences observed for cold but not heat thresholds.
The lag period for heat-related CVD mortality was very short (0–2 days), while that of cold-related CVD mortality was longer (11–15 days). Many previous studies found that the heat effects were all very short [1,6,25]. Anderson et al. observed that the heat waves on the current day and the day before would affect the CVD mortality in 107 American communities [6]. In Brisbane, the lag period for heat effect lasted for only one day [25]. In our research, the heat-related mortality curve was initially very high and then rapidly decreased. This may be because hot temperatures directly cause CVD deaths, such as congestive heart failure [45]. Compared with the stable lag period of the heat effect, the cold effect always showed various lag periods. Most US studies applied 2- to 5-day lags for cold-related mortality [1,46,47,48,49], whereas other researchers found cold effects delayed for one or more weeks [6,50,51,52]. In our study, we found that the cold-related mortality curve was low at first and then continually rose throughout the lag period (Figure 3). The reason that the cold effect lasted for more days may be that cold temperatures indirectly affect CVD by triggering acute myocardial infarction and myocardial ischemia [53,54].
We found that hot temperatures had a stronger effect at higher latitudes (Hefei and Changsha), while cold effects were more severe at lower latitudes (Haikou; Table 3). A 1 °C increase above each heat threshold temperature was associated with overall increases in CVD mortality of 4.5% (1.2%–7.9%) and 4.4% (1.4%–7.5%) for Hefei and Changsha, respectively. In a previous research, the relative risk of heat-related CVD mortality would increase 29.5% (22.9%–36.6%) and 13.4% (10.6%–16.2%) for lag 1 day in Beijing and Seoul, respectively [7]. Despite the fact that the cardiovascular deaths in Chung’s study were different than the deaths in ours, the higher latitudes may explain why Beijing and Seoul had a higher relative risk. In Haikou, the CVD mortality would increase by 5.8% (1.2%–10.7%) with a 1 °C decrease below its cold threshold temperature. These results further verified the spatial heterogeneity of the association between extreme temperature and CVD mortality [26,27,55]. People in cold areas are more sensitive to hot temperatures and vice versa [6]. In recent years, the number of warm days and heat waves has increased [3,56]. Therefore, governments, especially at higher latitudes, should enact measures that prevent harm from extreme hot temperatures.
In this study, older individuals were more sensitive to extreme temperatures than younger individuals. For those ≥65 years, both high and low temperatures affected CVD mortality in all four cities. The heat-related CVD mortality was relatively small for those <65 ages, especially in Nanning and Haikou (Table 3). Previous studies have also shown that extreme temperatures affect older individuals more [28]. The extreme temperature increases the risk of arterial thrombosis for old people, but for young people the impact is tiny [44]. The results of meta-analysis showed that the cold effect was 4.9% (95% CI: 3.5%–6.3%) and the hot effect was 6.4% (95% CI: 3.4%–9.4%) for those ≥65 years (Table 4). Some previous researchers also revealed that the heat effect was stronger than the cold effect [1,48] because cold temperatures might have an indirect impact on CVD mortality, but the impact of hot temperatures is usually direct [57].
Females tend to be more sensitive to extreme temperatures than males because they may have a higher risk of high blood pressure and arrhythmia [8,18,30]. Furthermore, the relative risk of cold-related CVD mortality was higher for females than males, while men were more sensitive to extreme heat temperatures than women. This finding is consistent with previous studies [27,57,58,59]. The meta-analysis also showed that female CVD mortality was influenced more by cold temperatures, while males were more affected by hot temperatures (Figure 3). One possible explanation for these findings is that males are more likely to work outdoors; therefore, they may be exposed to hotter temperatures than females [60].
Several limitations to this study should be considered. First, as an ecologic study, the temperature-related mortality focused on population-level exposure, and the conclusion may not be applied at an individual level. Second, because detailed air pollution data (such as PM10, SO2, and NO2) was not available, APIs were used; however, this method has been successfully used in previous research [27]. Third, for socio-economic data in each city, only one county was chosen, and the four years of data available for the four cities may not be sufficient. It is our target to collect more socio-economic data and long-term data in future studies.

5. Conclusions

The study found that temperature-related CVD mortality in southern China is spatially heterogeneous. The discrepancy between cold thresholds was significantly different, while that of heat thresholds was not, and the hot temperatures had a stronger effect at higher latitudes, while cold effects were more severe at lower latitudes. These findings on the association of temperature with CVD mortality have implications for policymakers and future scientific work. The application of the research could be in assisting governments to establish a warning system for heat waves or cold spells in these four cities. The threshold provided here can help set up a warning threshold for each city. Females and older people may need to pay more attention to the heat waves or cold spells because they are more vulnerable to other groups. The community based warning system can help these people to avoid exposure and prevent further harm to their health. The lag times of the heat and cold effects will help to determine the maintenance of the alert before returning to normal conditions.

Acknowledgments

This study was supported through funding from the following grants: Open Fund of State Key Laboratory of Remote Sensing Science (OFSLRSS201513); Open Fund of State Key Laboratory of Resources and Environmental Information System; NSFC (41501426); Open Fund of Big Data Engineering Research Center of Civil Air Defense, Guiyang.

Author Contributions

Jixia Huang conducted the data analysis and preparation of the paper. Jixia Huang contributed to the conception, design, and data acquisition. Jixia Huang, Jing Tang, and Weiwei Yu contributed to the interpretation of the data and critical revision of the manuscript. All authors read and approved the final manuscript.

Conflicts of Interest

The authors declare no conflict of interest.

References

  1. Medina-Ramon, M.; Schwartz, J. Temperature, temperature extremes, and mortality: A study of acclimatization and effect modification in 50 US cities. Occup. Environ. Med. 2007, 64, 827–833. [Google Scholar] [CrossRef] [PubMed]
  2. Alexander, L.V.; Zhang, X.; Peterson, T.C.; Caesar, J.; Gleason, B.; Klein Tank, A.M.G.; Haylock, M.; Collins, D.; Trewin, B.; Rahimzadeh, F.; et al. Global observed changes in daily climate extremes of temperature and precipitation. J. Geophys. Res. Atmos. 2006, 111. [Google Scholar] [CrossRef]
  3. Peterson, T.C.; Zhang, X.; Brunet-India, M.; Vazquez-Aguirre, J.L. Changes in North American extremes derived from daily weather data. J. Geophys. Res. Atmos. 2008, 113. [Google Scholar] [CrossRef]
  4. Trenberth, K.E.; Jones, P.D.; Ambenje, P. Observations: Surface and atmospheric climate change. In Climate Change 2007: The Physical Science Basis; Contribution of Working Group I to the Fourth Assessment Report of the Intergovernmental Panel on Climate Change; Solomon, S., Qin, D., Manning, M., Chen, Z., Marquis, M., Averyt, K.B., Tignorand, M., Miller, H.L., Eds.; Cambridge University Press: Cambridge, UK; New York, NY, USA, 2007; pp. 235–336. [Google Scholar]
  5. Intergovernmental Panel on Climate Change. Climate Change. The Physical Science Basis; Working Group I Contribution to the Fifth Assessment Report of the Intergovernmental Panel on Climate Change; Cambridge University Press: Cambridge, UK, 2013. [Google Scholar]
  6. Anderson, B.G.; Bell, M.L. Weather-related mortality: How heat, cold, and heat waves affect mortality in the United States. Epidemiology 2009, 20, 205–213. [Google Scholar] [CrossRef] [PubMed]
  7. Chung, J.Y.; Honda, Y.; Hong, Y.C.; Pan, X.C.; Guo, Y.L.; Kim, H. Ambient temperature and mortality: An international study in four capital cities of East Asia. Sci. Total Environ. 2009, 408, 390–396. [Google Scholar] [CrossRef] [PubMed]
  8. Douglas, A.S.; Dunnigan, M.G.; Allan, T.M.; Rawles, J.M. Seasonal variation in coronary heart disease in Scotland. J. Epidemiol. Community Health 1995, 49, 575–582. [Google Scholar] [CrossRef] [PubMed]
  9. Lawlor, D.A.; Smith, G.D.; Mitchell, R.; Ebrahim, S. Temperature at birth, coronary heart disease, and insulin resistance: Cross sectional analysis of the brithsh women’s heart and health study. Heart 2004, 90, 381–388. [Google Scholar] [CrossRef] [PubMed]
  10. Liu, F.; Zhang, J.; Lu, C. Review of researches on relationship of meteorological factors and cardiovascular diseases in China. Meteorol. Sci. Technol. 2004, 32, 425–428. (In Chinese) [Google Scholar]
  11. Basu, R. High ambient temperature and mortality: A review of epidemiologic studies from 2001 to 2008. Environ. Health 2009, 8, 40. [Google Scholar] [CrossRef] [PubMed]
  12. Gasparrini, A.; Guo, Y.; Hashizume, M.; Lavigne, E.; Zanobetti, A.; Schwartz, J.; Tobias, A.; Tong, S.; Rocklöv, J.; Forsber, B.; et al. Mortality risk attributable to high and low ambient temperature: A multi country observational study. Lancet 2015, 386, 369–375. [Google Scholar] [CrossRef]
  13. Amegah, A.K.; Rezza, G.; Jaakkola, J.J. Temperature-related morbidity and mortality in Sub-Saharan Africa: A systematic review of the empirical evidence. Environ. Int. 2016, 91, 133–149. [Google Scholar] [CrossRef] [PubMed]
  14. Spencer, F.A.; Goldberg, R.J.; Becker, R.C.; Gore, J.M. Seasonal distribution of acute myocardial infarction in the second national registry of myocardial infarction. J. Am. Coll. Cardiol. 1998, 31, 1226–1233. [Google Scholar] [CrossRef]
  15. Pan, W.H.; Li, L.A.; Tsai, M.J. Temperature extremes and mortality from coronary heart disease and cerebral infarction in elderly Chinese. Lancet 1995, 345, 353–355. [Google Scholar] [CrossRef]
  16. Filleul, L.; Cassadou, S.; Medina, S.; Fabres, P.; Lefranc, A.; Eilstein, D.; Le Tertre, A.; Pascal, L.; Chardon, B.; Blanchard, M.; et al. The relation between temperature, ozone, and mortality in nine French cities during the heat waves of 2003. Environ. Health Perspect. 2006, 114, 1344–1347. [Google Scholar] [CrossRef] [PubMed]
  17. Guo, Y.M.; Barnett, A.G.; Pan, X.C.; Yu, W.W.; Tong, S.L. The impact of temperature on mortality in Tianjin, China: A case-crossover design with a distributed lag nonlinear model. Environ. Health Perspect. 2011, 119, 1719–1725. [Google Scholar] [CrossRef] [PubMed] [Green Version]
  18. Tian, Z.X.; Li, S.S.; Zhang, J.L.; Jaakkola, J.; Guo, Y.M. Ambient temperature and coronary heart disease mortality in Beijing, China: A time series study. Environ. Health 2012, 11, 56. [Google Scholar] [CrossRef] [PubMed]
  19. Huang, J.X.; Wang, J.F.; Yu, W.W. The lag Effects and Vulnerabilities of Temperature Effects on Cardiovascular Disease Mortality in a Subtropical Climate Zone in China. Int. J. Environ. Res. Public Health 2014, 11, 3982–3994. [Google Scholar] [CrossRef] [PubMed]
  20. Ma, W.; Wang, L.; Lin, H.; Zhang, Y.; Rutherford, S.; Luo, Y.; Zeng, W.; Zhang, Y.; Wang, X.; et al. The temperature-mortality relationship in China: An analysis from 66 Chinese communities. Environ. Res. 2015, 137, 72–77. [Google Scholar] [CrossRef] [PubMed]
  21. Yang, J.; Ou, C.Q.; Ding, Y.; Zhou, Y.X.; Chen, P.Y. Daily temperature and mortality: A study of distributed lag non-linear effect and effect modification in Guangzhou. Environ. Health 2012, 11, 63. [Google Scholar] [CrossRef] [PubMed]
  22. Zhang, J.; Li, T.T.; Tan, J.G.; Huang, C.R.; Kan, H.D. Impact of temperature on mortality in three major Chinese cities. Biomed. Environ. Sci. 2014, 27, 485–494. [Google Scholar] [PubMed]
  23. Zeng, W.L.; Li, G.C.; Xiao, Y.Z.; Xu, Y.J.; Xu, X.J.; Liu, T.; Luo, Y.; Xiao, J.P.; Ma, W.J. The impact of temperature on cardiovascular disease deaths in 4 cities, China: A time-series study. Chin. J. Epidemiol. 2012, 33, 1021–1025. (In Chinese) [Google Scholar]
  24. Lin, Y.K.; Ho, T.J.; Wang, Y.C. Mortality risk associated with temperature and prolonged temperature extremes in elderly populations in Taiwan. Environ. Res. 2011, 111, 1156–1163. [Google Scholar] [CrossRef] [PubMed]
  25. Yu, W.W.; Hu, W.B.; Mengersen, K.; Guo, Y.; Pan, X.; Connel, D.; Tong, S. Time course of temperature effects on cardiovascular mortality in Brisbane, Australia. Heart 2011, 97, 1089–1093. [Google Scholar] [CrossRef] [PubMed] [Green Version]
  26. Bayentin, L.; EI Adlouni, S.; Quarda, T.B.; Gosselin, P.; Doyon, B.; Chebana, F. Spatial variability of climate effects on ischemic heart disease hospitalization rates for the period 1989–2006 in Quebec, Canada. Int. J. Health Geogr. 2010, 9, 5. [Google Scholar] [CrossRef] [PubMed]
  27. Wu, W.; Xiao, Y.; Li, G.; Zeng, W.; Lin, H.; Rutherford, S.; Xu, Y.; Luo, Y.; Xu, X.; Chu, C.; et al. Temperature-mortality relationship in four subtropical Chinsese cities: A time-series study using a distributed lag non-linear model. Sci. Total Environ. 2013, 449, 355–362. [Google Scholar] [CrossRef] [PubMed]
  28. Healy, J.D. Excess winter mortality in Europe: A cross county analysis identifying key risk factors. J. Epidemiol. Community Health 2003, 57, 784–789. [Google Scholar] [CrossRef] [PubMed]
  29. Schwartz, J. The distributed lag between air pollution and daily deaths. Epidemiology 2000, 11, 320–326. [Google Scholar] [CrossRef] [PubMed]
  30. Schwartz, J. Who is sensitive to extremes of temperature?: A case-only analysis. Epidemiology 2005, 16, 67–72. [Google Scholar] [CrossRef] [PubMed]
  31. O’Neill, M.S.; Zanobetti, A.; Schwartz, J. Modifiers of the temperature and mortality association in seven US cities. Am. J. Epidemiol. 2003, 157, 1074–1082. [Google Scholar] [CrossRef] [PubMed]
  32. National Bureau of Statistics of China. China Statistic Year Book 2010; China Statistics Press: Beijing, China, 2010.
  33. Maynard, R.L.; Coster, S.M. Informing the Public about Air Pollution. In Air Pollution and Health; Academic Press: London, UK, 1999. [Google Scholar]
  34. Hu, M.; Jia, L.; Wang, J.; Pan, Y. Spatial and temporal characteristics of particulate matter in Beijing, China using the Empirical Mode Decomposition method. Sci. Total Environ. 2013, 458–460, 70–80. [Google Scholar] [CrossRef] [PubMed]
  35. Dominici, F.; McDermott, A.; Hastie, T.J. Improved semiparametric time series models of air pollution and mortality. J. Am. Stat. Assoc. 2004, 99, 938–949. [Google Scholar] [CrossRef]
  36. Gasparrini, A.; Armstrong, B.; Kenward, M.G. Distributed lag non-linear models. Stat. Med. 2010, 29, 2224–2234. [Google Scholar] [CrossRef] [PubMed]
  37. Akaike, H. Information theory and an extension of the maximum likelihood principle. In Second International Symposium on Information Theory; Petrov, B.N., Caski, F., Eds.; AkademiaiKiado: Budapest, Hungary, 1973; pp. 267–281. [Google Scholar]
  38. Analitis, A.; Katsouyanni, K.; Biggeri, A.; Baccini, M. Effects of cold weather on mortality: Results from 15 European cities within the PHEWE project. Am. J. Epidemiol. 2008, 168, 1397–1408. [Google Scholar] [CrossRef] [PubMed]
  39. Yu, W.; Vaneckova, P.; Mengersen, K.; Pan, X.; Tong, S. Is the association between temperature and mortality modified by age, gender and socio-economic status? Sci. Total Environ. 2010, 408, 3513–3518. [Google Scholar] [CrossRef] [PubMed]
  40. Viechtbauer, W. Conducting meta-analyses in R with the metafor package. J. Stat. Softw. 2010, 36, 1–48. [Google Scholar] [CrossRef]
  41. Berkey, C.S.; Hoaglin, D.C.; Mosteller, F.; Colditz, G.A. A random-effects regression model for meta-analysis. Stat. Med. 1995, 14, 395–411. [Google Scholar] [CrossRef] [PubMed]
  42. Liu, C.; Yavar, Z.; Sun, Q. Cardiovascular response to thermoregulatory challenges. Am. J. Physiol. Heart Circ. Physiol. 2015, 309, 1793–1812. [Google Scholar] [CrossRef] [PubMed]
  43. Eurowinter Group. Cold exposure and winter mortality from ischaemic heart disease, cerebrovascular disease, respiratory disease and all causes in warm and cold regions of Europe. Lancet 1997, 349, 1341–1346. [Google Scholar]
  44. Yang, C.; Meng, X.; Chen, R.; Cai, J.; Zhao, Z.; Wan, Y.; Kan, H. Long-term variations in the association between ambient temperature and daily cardiovascular mortality in Shanghai, China. Sci. Total Environ. 2015, 538, 524–530. [Google Scholar] [CrossRef] [PubMed]
  45. Keatinge, W.R.; Coleshaw, S.R.; Easton, J.C.; Cotter, F.; Mattock, M.B.; Chelliah, R. Increased platelet and red cell counts, blood viscosity, and plasma cholesterol levels during heat stress, and mortality from coronary and cerebral thrombosis. Am. J. Med. 1986, 81, 795–800. [Google Scholar] [PubMed]
  46. Nordio, F.; Zanobetti, A.; Colicino, E.; Kloog, I.; Schwartz, J. Changing patterns of the temperature-mortality association by time and location in the US, and implications for climate change. Environ. Int. 2015, 81, 80–86. [Google Scholar] [CrossRef] [PubMed]
  47. Barnett, A.G. Temperature and cardiovascular deaths in the US elderly: Changes over time. Epidemiology 2007, 18, 369–372. [Google Scholar] [CrossRef] [PubMed]
  48. Curriero, F.C.; Heiner, K.S.; Samet, J.M.; Zeger, S.L.; Strug, L.; Patz, J.A. Temperature and mortality in 11 cities of the eastern United States. Am. J. Epidemiol. 2002, 155, 80–87. [Google Scholar] [CrossRef] [PubMed]
  49. Kalkstein, L.S.; Davis, R.E. Weather and human mortality: An evaluation of demographic and inter regional responses in the United States. Ann. Assoc. Am. Geogr. 1989, 79, 44–64. [Google Scholar] [CrossRef]
  50. Xiao, J.; Peng, J.; Zhang, Y.; Liu, T.; Rutherford, S.; Lin, H. How much does latitude modify temperature-mortality relationship in 13 eastern US cities? Int. J. Biometeorol. 2015, 59, 365–372. [Google Scholar] [CrossRef] [PubMed]
  51. Braga, A.L.; Zanobetti, A.; Schwartz, J. The time course of weather-related deaths. Epidemiology 2001, 12, 662–667. [Google Scholar] [CrossRef] [PubMed]
  52. Pattenden, S.; Nikiforov, B.; Armstrong, B.G. Mortality and temperature in Sofia and London. J. Epidemiol. Community Health 2003, 57, 628–633. [Google Scholar] [CrossRef] [PubMed]
  53. Hong, Y.C.; Rha, J.H.; Lee, J.T.; Ha, E.H.; Kwon, H.J.; Kim, H. Ischemic stroke associated with decrease in temperature. Epidemiology 2003, 14, 473–478. [Google Scholar] [CrossRef] [PubMed]
  54. Stewart, S.; Mcintyre, K.; Capewell, S.; McMurray, J. Heart failure in a cold climate: seasonal variation in heart failure-related morbidity and mortality. J. Am. Coll. Cardiol. 2002, 39, 760–766. [Google Scholar] [CrossRef]
  55. Zeka, A.; Browne, S.; McAvoy, H.; Goodman, P. The association of cold weather and all-cause and cause-specific mortality in the island of Ireland between 1984 and 2007. Environ. Health 2014, 13, 104. [Google Scholar] [CrossRef] [PubMed]
  56. Meehl, G.; Tebaldi, C.; Walton, G.; Easterling, D.; McDaniel, L.R. Relative increase of record high maximum temperatures compared to record low minimum temperatures in the U.S. Geophys. Res. Lett. 2009, 36. [Google Scholar] [CrossRef]
  57. Guo, C.Y.; Pan, W.C.; Chen, M.J.; Tsai, C.W.; Chen, N.T.; Su, H.J. When are we most vulnerable to temperature variations in a day? PLoS ONE 2014, 9, e113195. [Google Scholar] [CrossRef] [PubMed]
  58. Chen, R.; Wang, C.; Meng, X.; Chen, H.; Thach, T.Q.; Wong, C.M. Both low and high temperature may increase the risk of stroke mortality. Neurology 2013, 81, 1064–1070. [Google Scholar] [CrossRef] [PubMed]
  59. Xie, H.; Yao, Z.; Zhang, Y.; Xu, Y.; Xu, X.; Liu, T.; Lin, H.; Lao, X.; Rutherford, S.; Chu, C.; et al. Short-term effects of the 2008 cold spell on mortality in three subtropical cities in Guangdong province, China. Environ. Health Perspect. 2013, 121, 210–216. [Google Scholar] [PubMed]
  60. Ayyappan, R.; Sankar, S.; Rajkumar, P.; Balakrishnan, K. Work-related heat stress concerns in automotive industries: A case study from Chennai, India. Glob. Health Action 2009, 2. [Google Scholar] [CrossRef] [PubMed]
Figure 1. Geographical distribution of study areas in China.
Sustainability 09 00321 g001
Figure 2. Three-dimensional plots of the relationship between mean temperature and CVD mortality with a 30 day lag period.
Sustainability 09 00321 g002
Figure 3. The estimated effects of temperature on mortality with different lag periods. The red lines are relative risks, and the gray regions are the 95% confidence intervals.
Sustainability 09 00321 g003
Figure 4. The distributed lag periods of temperature-related mortality for all ages. (A) Hefei cold effect; (B) Hefei heat effect; (C) Changsha cold effect; (D) Changsha heat effect; (E) Nanning cold effect; (F) Nanning heat effect; (G) Haikou cold effect; and (H) Haikou heat effect.
Sustainability 09 00321 g004
Figure 5. Overall effects of heat and cold over different lag periods in four cities.
Sustainability 09 00321 g005
Table 1. The distribution of cardiovascular disease (CVD) mortality.
VariablesCityDaily MinDaily MaxTotalDeath Per 100,000Proportion
All agesHefei0187483958100%
Changsha13819,4181107100%
Nanning01992421181100%
Haikou0165434598100%
≥65 yearsHefei016639281985.4%
Changsha03416,01491382.5%
Nanning017740994780.2%
Haikou016425746978.3%
<65 yearsHefei05109113914.6%
Changsha09340419417.5%
Nanning06183223419.8%
Haikou06117712921.7%
MaleHefei011388449751.9%
Changsha02310,91262256.2%
Nanning012516566055.9%
Haikou012315034758.0%
FemaleHefei09359946148.1%
Changsha021850648543.8%
Nanning013407752144.1%
Haikou012228425142.0%
Table 2. The distribution of meteorological data.
VariablesCityMeanSTDMedianMinMax
Daily temperature (°C)Hefei16.49.617.8−4.334.3
Changsha18.39.319.2−2.835
Nanning21.46.723.23.731.3
Haikou23.94.725.48.731.6
Relative humidity (%)Hefei73.616.17623100
Changsha74.812.5762997
Nanning76.29.3773996
Haikou80.58.0814798
Air PressHefei10,1329510,133994410,386
Changsha10,08692.110,085991110,322
Nanning998271.69977979810,167
Haikou10,03660.810,029978110,207
APIHefei83.537.1800500
Changsha68.727.16711443
Nanning52.422.9520163
Haikou38.414.435099
Table 3. The cumulative effects of heat-(2 day lag period) and cold-(15 day lag period) related CVD mortality in four cities.
CityGroupCold EffectHeat Effect
Estimate (%)95% CIEstimate (%)95% CI
HefeiAll ages4.1 *1.9–6.24.5 *1.2–7.9
≥654.3 *1.6–7.04.9 *0.4–9.4
<653.7 *0.6–6.82.8−1.2–6.8
Males3.6 *0.5–6.84.9 *0.4–9.7
Females4.8 *2.4–7.23.9−0.9–8.9
ChangshaAll ages4.9 *2.9–6.94.4 *1.4–7.5
≥656.2 *4.0–8.35.1 *0.6–9.6
<653.3 *0.2–6.53.7−0.6–7.6
Males3.9 *1.2–6.62.8 *0.2–5.4
Females6.1 *3.7–8.56.3 *1.9–10.8
NanningAll ages2.8 *0.7–5.19.8−1.7–18.7
≥653.6 *1.3–5.911.4 *0.9–22.8
<651.0−3.1–5.30.4−17.9–20.2
Males3.8 *1.2–6.410.9−3.5–25.3
Females2.6−0.4–5.76.2−4.6–17
HaikouAll ages5.8 *1.2–10.74.2−13.9–17.9
≥655.9 *0.8–11.25.0−11.4–24.5
<655.4−5.5–17.4−9.3−35.9–28.3
Males2.5−3.3–8.6−3.1−20.9–18.7
Females10.0 *2.6–17.94.3−16.5–30.4
Note: * p < 0.05; 95% CI: 95% confidence interval.
Table 4. Overall effects of cold and heat in four cities (meta-analysis).
GroupCold EffectHeat Effect
Estimate (%)95%CIEstimate (%)95%CI
All ages4.23.0–5.44.63.0–6.2
≥654.93.5–6.36.43.4–9.4
<653.11.7–4.50.2−4.8–5.2
Males3.62.2–5.05.62.5–8.7
Females5.63.9–8.34.12.7–5.5

