Article

Environmental Impact Analysis on Residential Building in Malaysia Using Life Cycle Assessment

by
Ahmad Faiz Abd Rashid
1,2,3,
Juferi Idris
4,5 and
Sumiani Yusoff
1,*
1
Department of Civil Engineering, Faculty of Engineering, University of Malaya, Kuala Lumpur 50603, Malaysia
2
Department of Quantity Surveying, Faculty of Architecture, Planning, and Surveying, Universiti Teknologi MARA (UiTM), Sarawak Branch, Kota Samarahan 94300, Malaysia
3
Department of Quantity Surveying, Faculty of Architecture, Planning, and Surveying, Universiti Teknologi MARA (UiTM), Shah Alam 40450, Malaysia
4
Faculty of Chemical Engineering, Universiti Teknologi MARA (UiTM), Sarawak Branch, Kota Samarahan 94300, Malaysia
5
Faculty of Chemical Engineering, Universiti Teknologi MARA (UiTM), Shah Alam 40450, Malaysia
*
Author to whom correspondence should be addressed.
Sustainability 2017, 9(3), 329; https://doi.org/10.3390/su9030329
Submission received: 31 December 2016 / Revised: 13 February 2017 / Accepted: 20 February 2017 / Published: 23 February 2017

Abstract

:
The building industry has a significant impact on the environment due to massive natural resources and energy it uses throughout its life cycle. This study presents a life cycle assessment of a semi-detached residential building in Malaysia as a case study and assesses the environmental impact under cradle-to-grave which consists of pre-use, construction, use, and end-of-life phases by using Centre of Environmental Science of Leiden University (CML) 2001. Four impact categories were evaluated, namely, acidification, eutrophication, global warming potential (GWP), and ozone layer depletion (ODP). The building operation under use phase contributed the highest global warming potential and acidification with 2.41 × 10³ kg CO2 eq and 1.10 × 101 kg SO2 eq, respectively. In the pre-use phase, concrete in the substructure has the most significant overall impact with cement as the primary raw material. The results showed that the residential building in Malaysia has a fairly high impact in GWP but lower in acidification and ODP compared to other studies.

1. Introduction

The building industry contributed significantly to the economy and social development. However, it also responsible for the massive impact on the environment due to natural resource consumption and emission released [1]. Roodman et al. [2] suggested that buildings are responsible for world’s fresh water withdrawals, wood harvest and material and energy flow that consist of 17%, 25%, and 40%, respectively. Because of the significant effect, the industry gives to the environment, numerous studies have been conducted to reduce the energy consumption and its environmental impact [3].
Life cycle assessment (LCA) has been accepted as a tool to evaluate the environmental impact throughout product life cycle [4,5]. The life cycle of a product or cradle-to-grave, which consists of the pre-use (extraction and acquisition of raw materials, material production, and manufacturing process), use, and end-of-life (EOL), is used to identify systematically and avoid the potential impact on the environment [6]. The introduction of LCA to the building is relatively recent. The first study conducted by Adalberth [7] paved the way for the research in this area. Recent reviews suggested that LCA studies on buildings were conducted all over the world using ISO 14040 series as a basis, but the methodologies were varied [8].
In Malaysia, LCA was initially introduced to assess the sustainability of palm oil production [9]. Since then, it has been used in other industries such as electronics, consumer goods, potable water production, electricity generation, waste management and buildings [10,11,12,13,14,15,16,17,18,19,20,21,22]. Buildings’ studies in Malaysia are mainly focused on the impact assessment of different materials. The studies also compared the benefit of integration of an industrialised building system (IBS) to a conventional construction system. Fujita et al. [19] used LCA to estimate CO2 emission for a concrete and timber based house using an input–output method during the pre-use and operation phase. Omar et al. [20] compared the pre-use phase of two-storey houses with a conventional concrete house and an IBS system house with a precast wall panel using a hybrid method for concrete and steel reinforcement. Wen et al. [21] compared a four-storey conventional apartment in Johor Bahru, Malaysia and a four-storey IBS apartment in Iskandar Malaysia, Johor. Bin Marsono and Balasbaneh [22] compared seven different materials used for the wall of a single-family unit house in Johor, but only global warming potential (GWP) impact category was assessed.
All studies mentioned were conducted without considering a full building life cycle or ‘cradle-to-grave’, which consist of pre-use, construction, use, and end-of-life (EOL) phases. Moreover, the full environmental impact on residential buildings in Malaysia has yet to be evaluated especially on the global warming impact. The findings from this study can provide useful information to the government agencies and building professionals prior to future developments in terms of the environmental impact of building materials and energy consumption in the building life cycle in Malaysia. Thus, the aim of this study is to estimate the life cycle impact of a residential building in Malaysia from cradle-to-grave in four impact categories specifically on global warming potential (GWP), acidification, ozone depletion (ODP), and eutrophication.

2. Methods

This study follows the LCA method standardised by an ISO 14040 series, which includes four stages: goal and scope definition, life cycle inventory (LCI), life cycle impact assessment (LCIA), and interpretation [6,23].

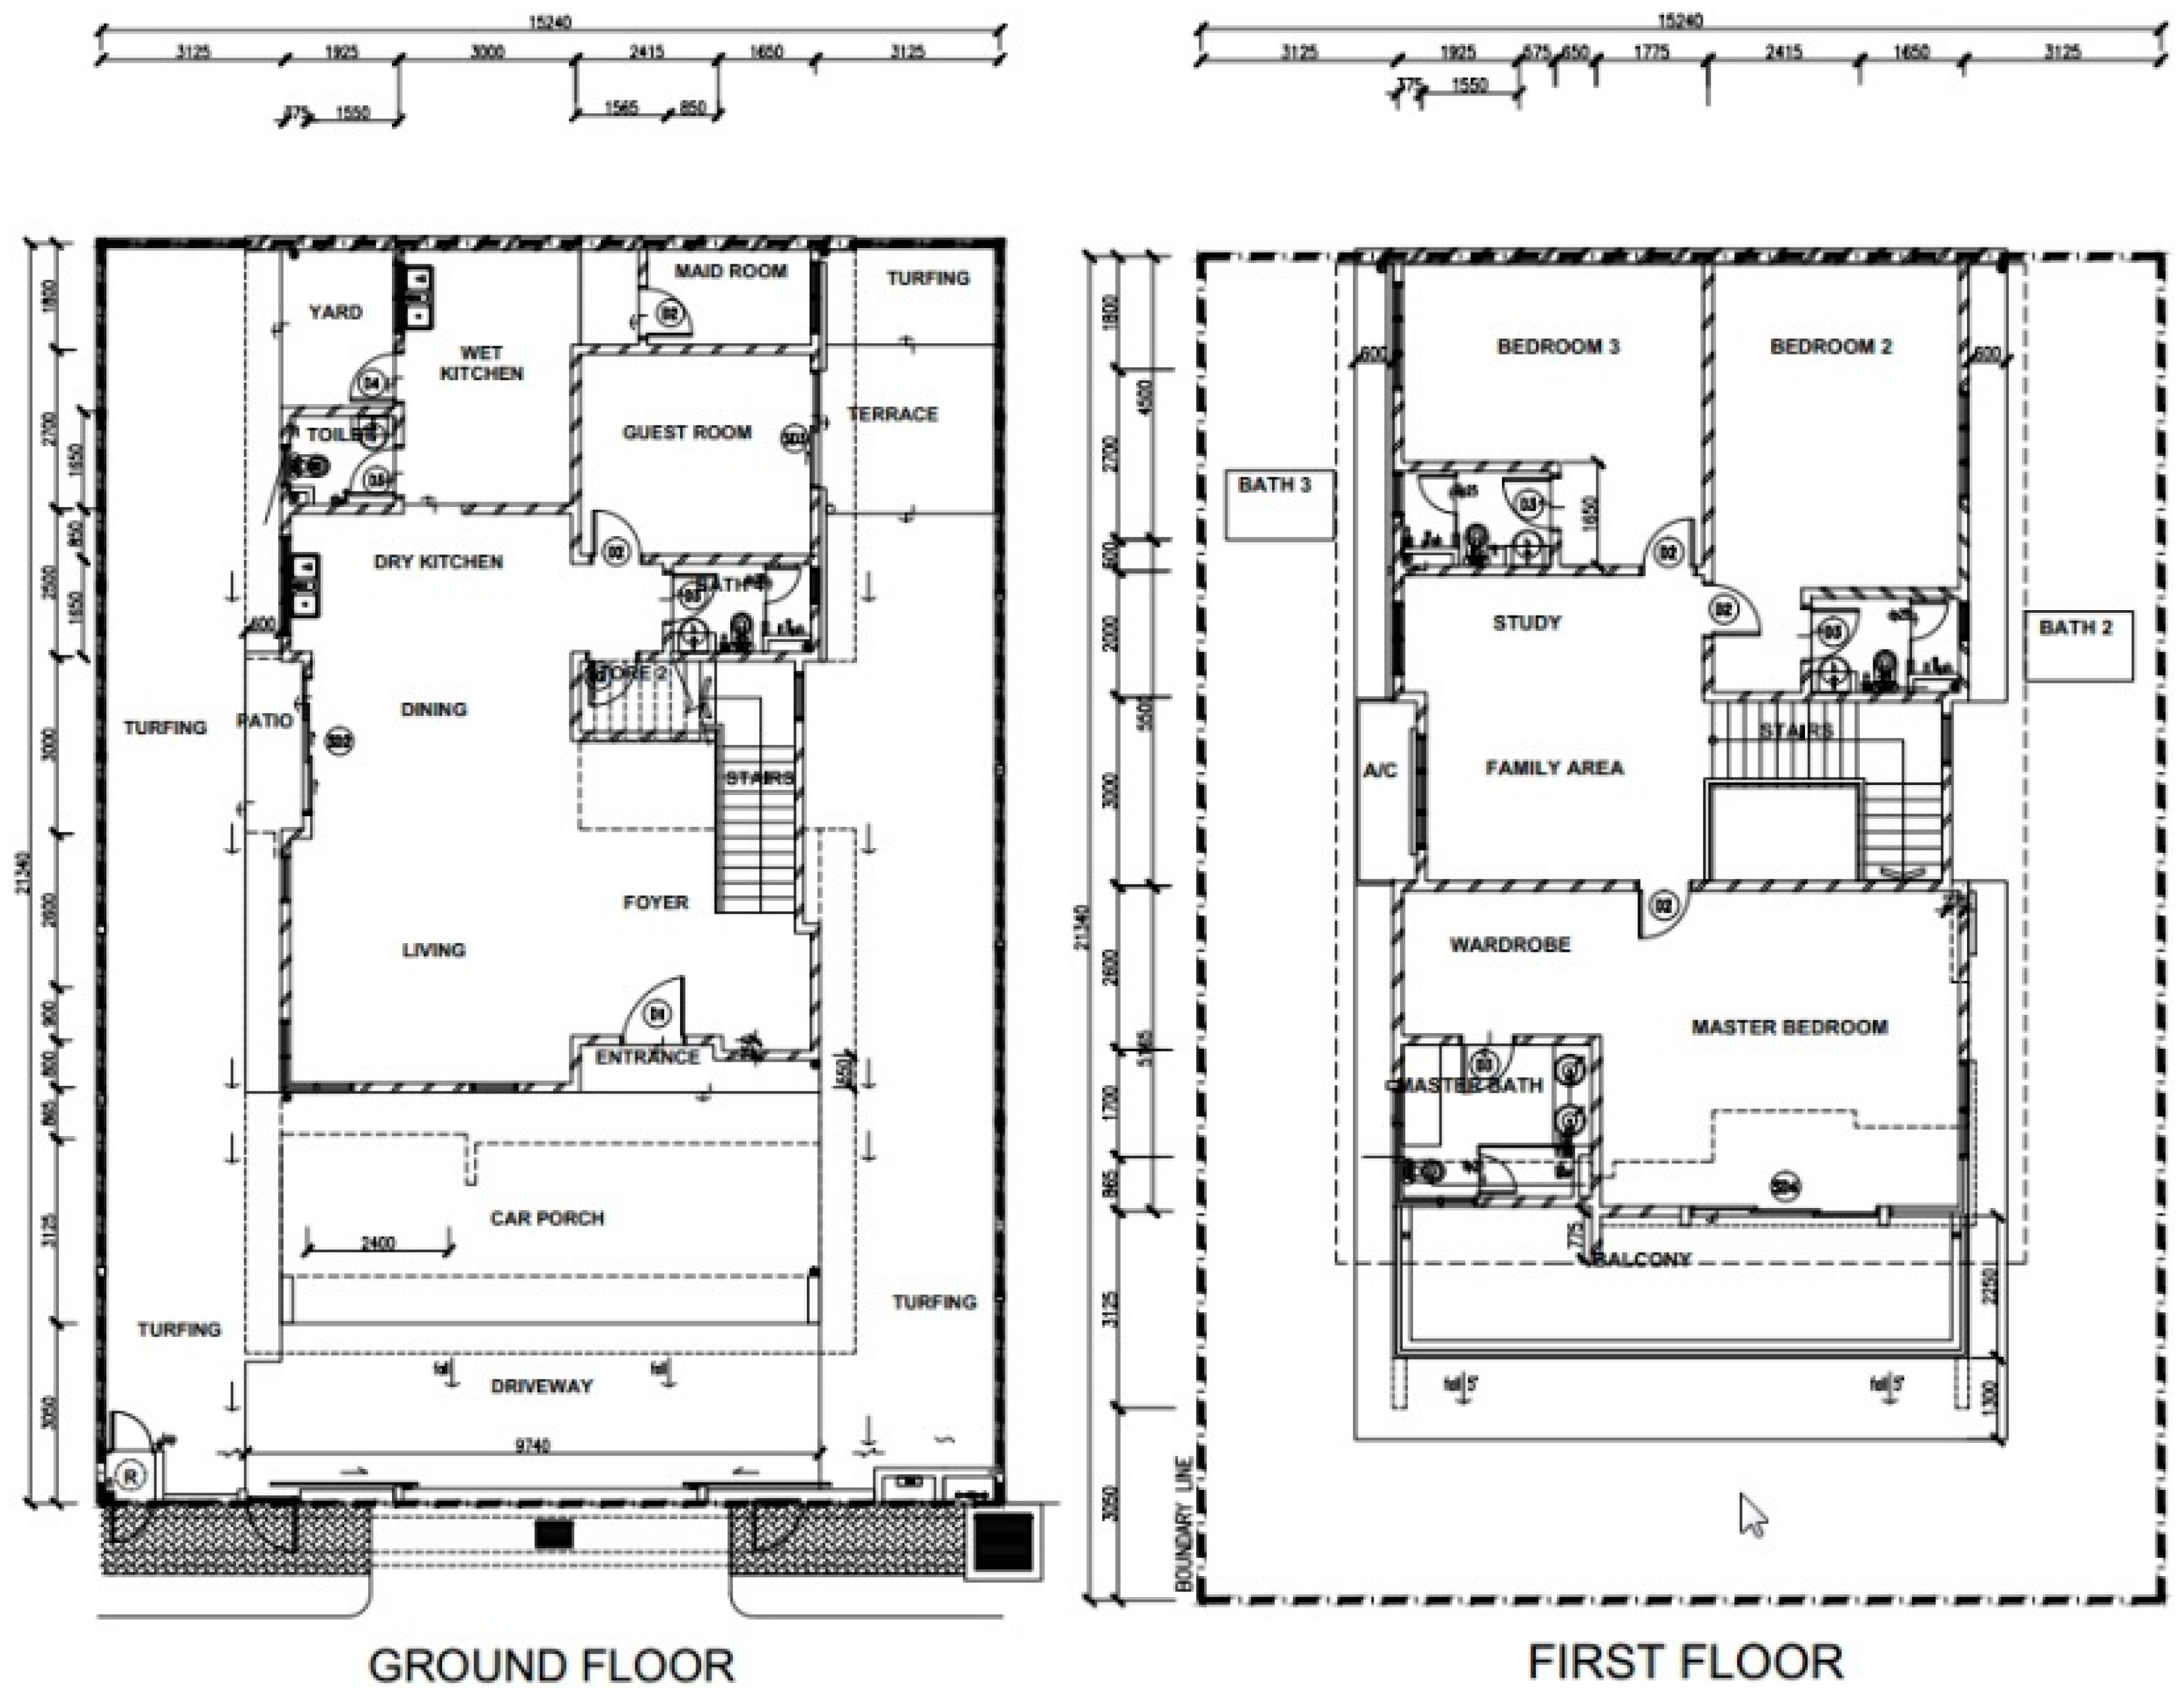
2.1. Goal and Scope Definition
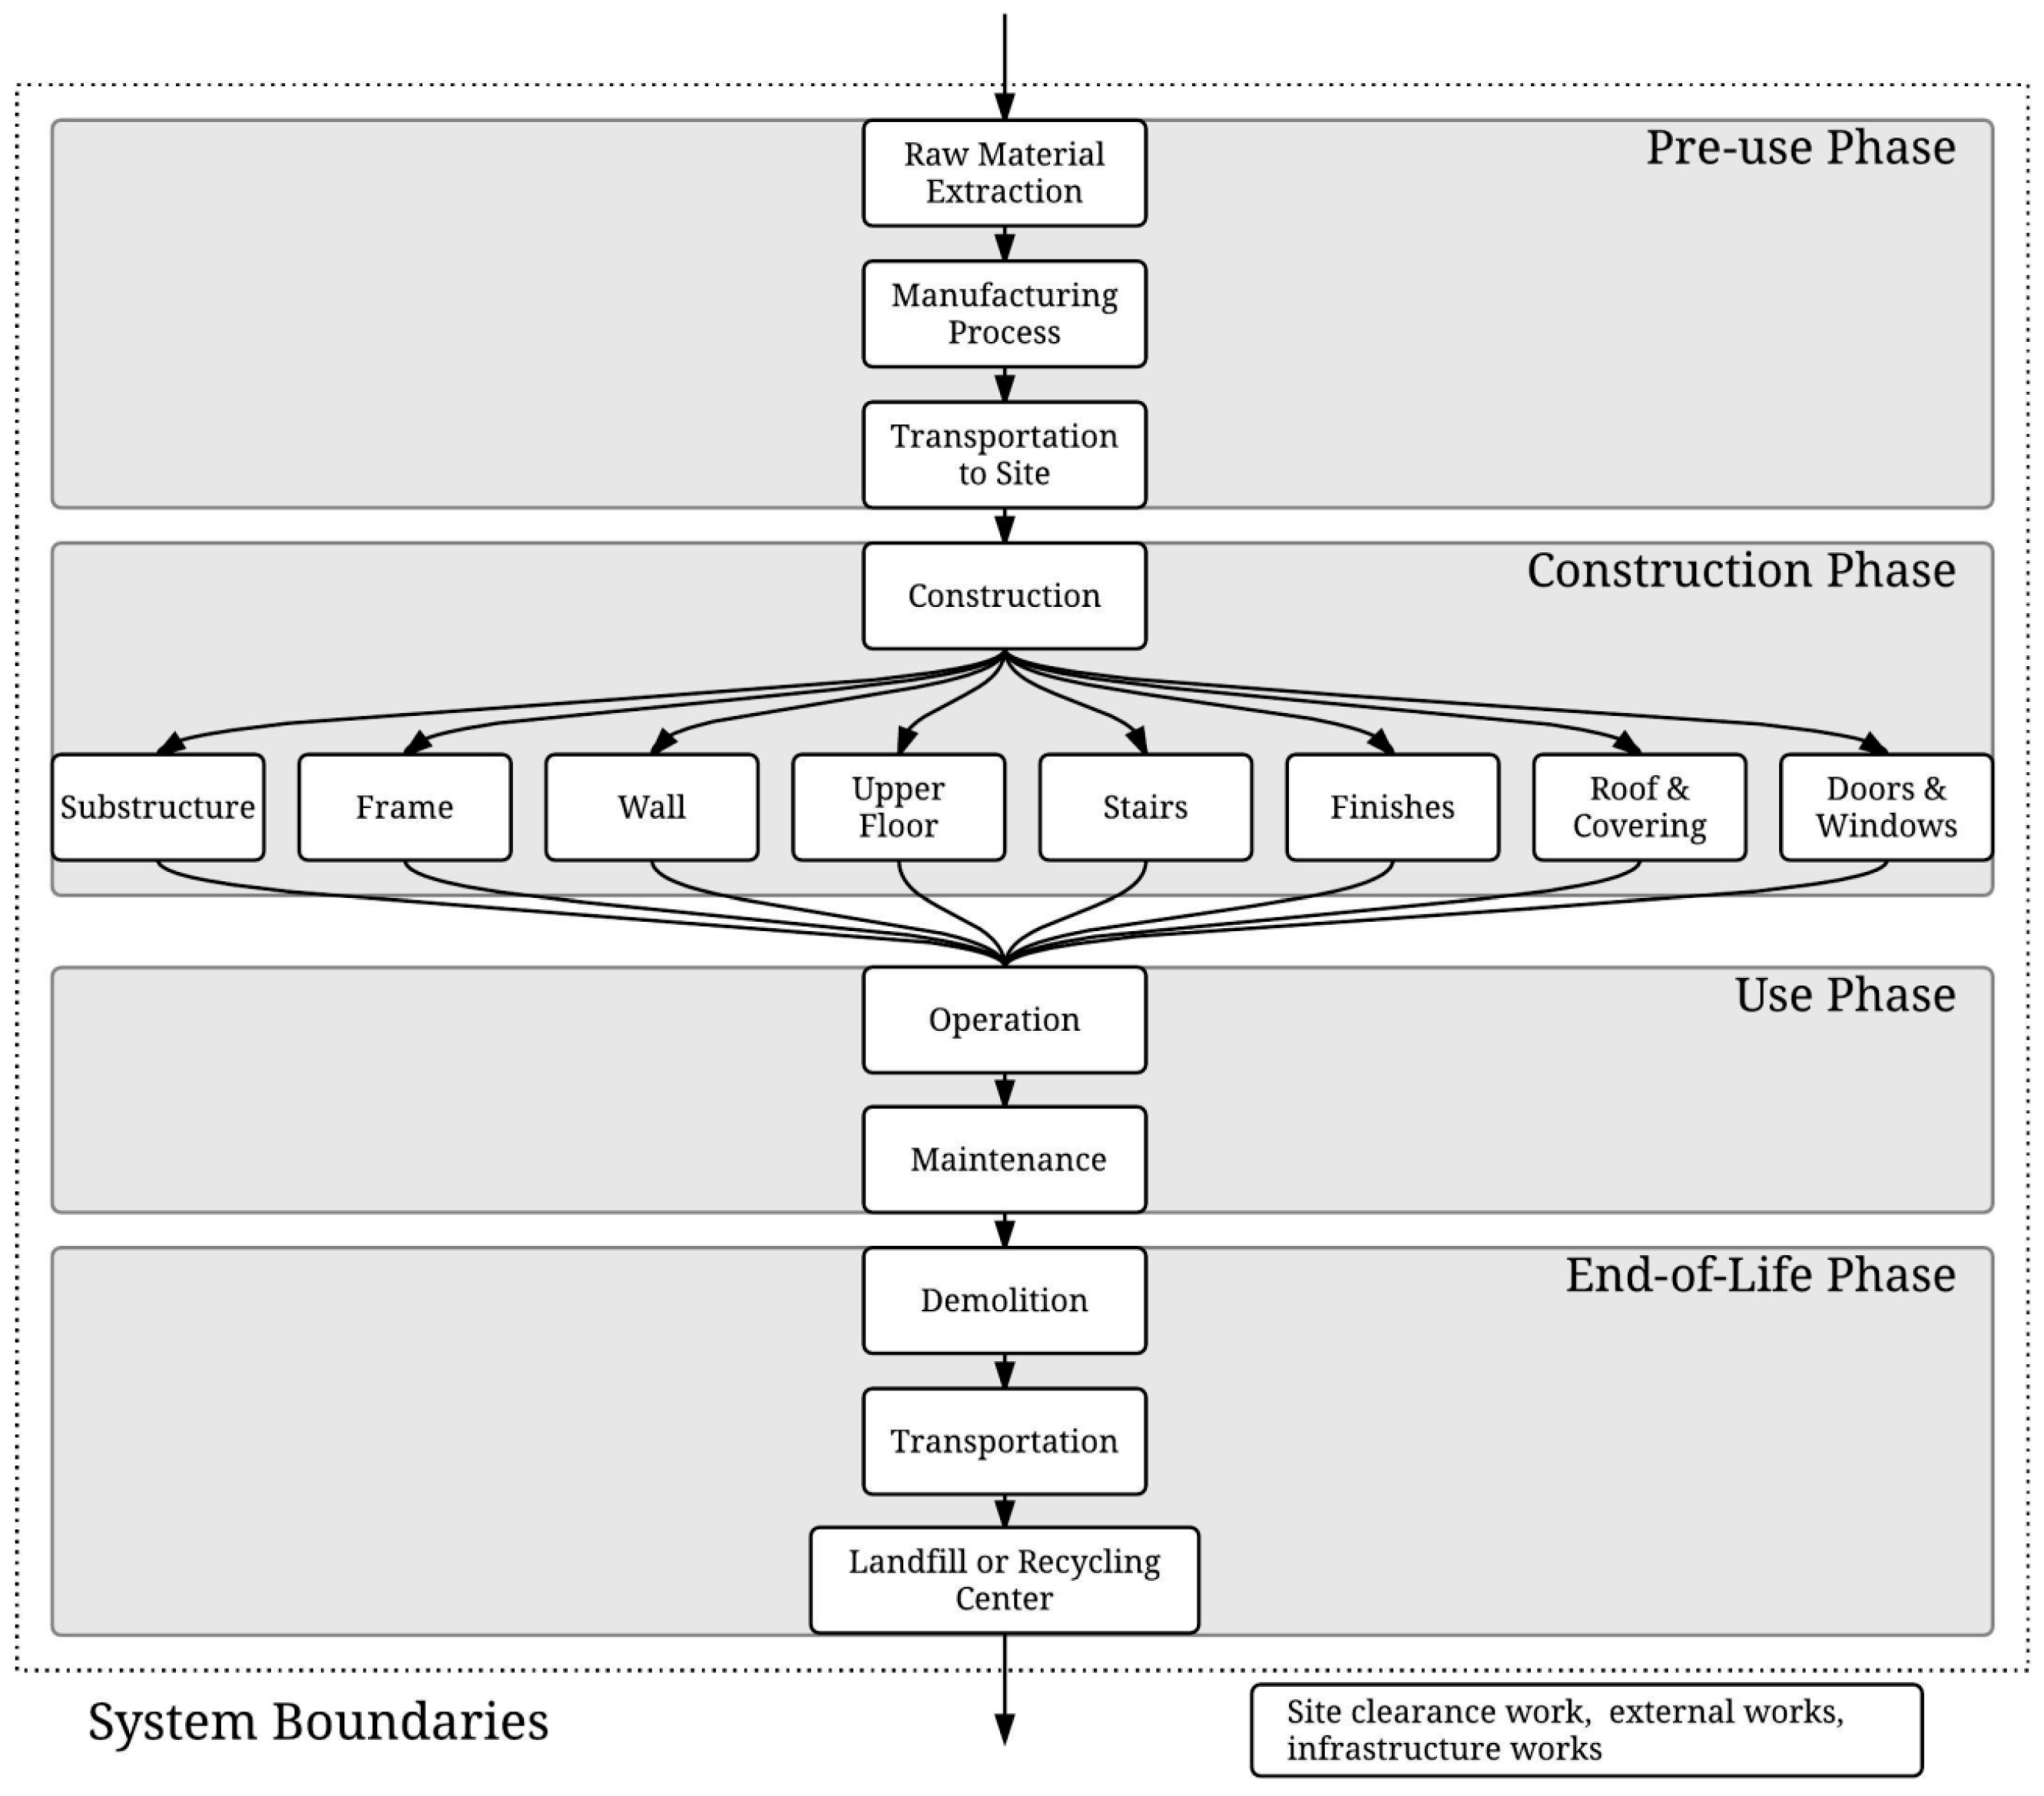
The functional unit selected in this study was 1 m2 of gross floor area (GFA), and the building lifespan was assumed to be 50 years as suggested by previous research [24]. The building was a semi-detached house within a residential development area located in the district of Seri Kembangan, Selangor about 25 km from Kuala Lumpur. The construction methods and materials used for the house were similar to other conventional residential buildings in Malaysia, thus without considering any green building characteristics or Green Building Index (GBI) certification [25]. The building frame structures were reinforced concrete with clay bricks as the building envelope. The building size is 246 m2 GFA with four bedrooms, a living room, a dining room, a maid room, a dry kitchen, a wet kitchen, a family area, a study area and five bathrooms as shown in Figure 1.

System Boundaries

The whole building life cycle was evaluated from cradle-to-grave within specific system boundaries outlined in Figure 2. The construction works involved overall residential development and were not specific to the building such as site clearance works, external works, and infrastructure works were excluded.
The LCA modelling has been carried out in SimaPro V7.3.3 (PRé Consultants bv, Amersfoort, The Netherlands) [27]. SimaPro is one of the leading LCA software programs produced by PRé Consultants bv and used by LCA practitioners all over the world as a decision support tool [28]. The Malaysia Life Cycle Inventory Database (MYLCID) was used in the LCI, especially on raw materials such as cement and diesel, in order to produce significant results for the Malaysian scenario [29]. Due to data limitation, the Ecoinvent database was used and adapted to Malaysian conditions by replacing the local electricity mix data set as suggested by Horváth and Szalay [30]. The databases used in this study have considered the detail processes of each material in manufacturing, transportation, and disposal involved during its life cycle [29,31].

2.2. Life Cycle Inventory

2.2.1. Pre-Use Phase

The LCI data for the pre-use phase were obtained from the bill of quantities. The quantities were then divided into GFA of the building as shown in Table 1. Few assumptions have been considered due to the limitation of the databases as follows:
  • An additional 5% of material waste during construction was added from the total amounts from the bill of quantities as suggested by previous studies [32,33].
  • In Malaysia, only steel and aluminium were recycled, whereas other materials are transported to the landfill as suggested by Arham [34]. The building materials related to steel and aluminium i.e., the reinforcement bars, aluminium window and door frames in the case studies were adjusted accordingly by replacing the use of pig iron and primary aluminium to scrap iron and old aluminium scrap, respectively, as suggested in the SimaPro.
  • The types and materials were limited to process data equipped in the databases.
  • Acrylic emulsion paint was substituted with alkyd paint due to the limitation in the databases.
  • The transportation distances from the manufacturer to the construction site were assumed to be 300 km for all materials; meanwhile, the distance is 50 km for a ready-mix concrete, as suggested by Wittstock et al. [35].
  • A 16-ton lorry was used to transport materials from manufacturers to the site, whereas a 24-ton ready-mix lorry was used to transport concretes.
  • The transportation data were calculated based on impact per ton kilometre (tkm) fleet average from the Ecoinvent database with adaptation of Malaysian data from MYCLID for electricity and diesel. The CO2 emissions for the 16-ton and 24-ton lorry were estimated at 0.84822 kg and 0.93854 kg per tkm, respectively [29,31].

2.2.2. Construction Phase

Only three construction processes were taken into consideration—namely, excavation, transportation of the excavator to the construction site, and temporary timber formwork. An excavator was used during excavation works. Meanwhile, other installation work was assumed to be completed by manual labours. The transportation of the excavator was considered to be a 50 km distance from the construction site using a 40-ton low-loader. The formwork was expected to be used multiple times before disposal as suggested by Abdullah [36].

2.2.3. Use Phase

Operation Data

Total electricity consumption was estimated at about 2949.78 kWh·per·m2 as shown in Table 2. Energy simulation software OpenStudio V1.2.0 (Alliance for Sustainable Energy, LLC, Lakewood, CO, USA) [37] with EnergyPlus was used to estimate the annual electricity consumption of air conditioning, illumination, and electrical equipment. The Kuala Lumpur weather data for the year 2013 was used as the basis. The air-conditioning system was set at 20.8 degrees Celsius from 10:00 p.m. to 6:00 a.m. every day in the master bedroom and two other bedrooms on the first floor based on findings by Kubota et al. [38]. The electricity consumption was assumed to be constant throughout the operation of the house.

Maintenance Data

Maintenance data was estimated based on the selected elements such as painting, replacement of roof coverings, and also changing of windows as suggested by other studies [39,40]. The replacement intervals were based on the report by National Association of Home Builders (NAHB) due to data limitations in Malaysia as suggested by Iyer-Raniga and Wong [26]. The replacement interval is shown in Table 3, which includes the production and transportation of the selected building materials.

2.2.4. EOL Phase

EOL phase was incorporated into the LCA studies because of the ability of recycling potential of building materials, which reduced the embodied energy [41]. As mentioned earlier in the pre-use phase, only steel and aluminium were recycled in Malaysia, thus these two materials were used as raw materials instead of aluminium and iron ores to reduce environmental impact as suggested in the SimaPro [27]. The transportation distances from the construction site to landfill and recycling centre were assumed to be 300 km from the construction site. The disposal of inert materials to the landfill with renaturation after closure and 50% of the sites feature a base seal and leachate collection system.

2.3. Life Cycle Impact Assessment (LCIA)

The midpoint assessment used the approach developed by Centre of Environmental Science (CML), Leiden University [42]. Only four common impact categories from CML 2001 were applied—namely, global warming potential (GWP), acidification, ozone depletion (ODP), and eutrophication as suggested by Khasreen et al. [43].

2.4. Interpretation

LCIA was interpreted according to the goal and scope of the study that shall include an assessment and a sensitivity check of the significant inputs and outputs [23]. The findings later will be validated by comparing it to other published studies [40].

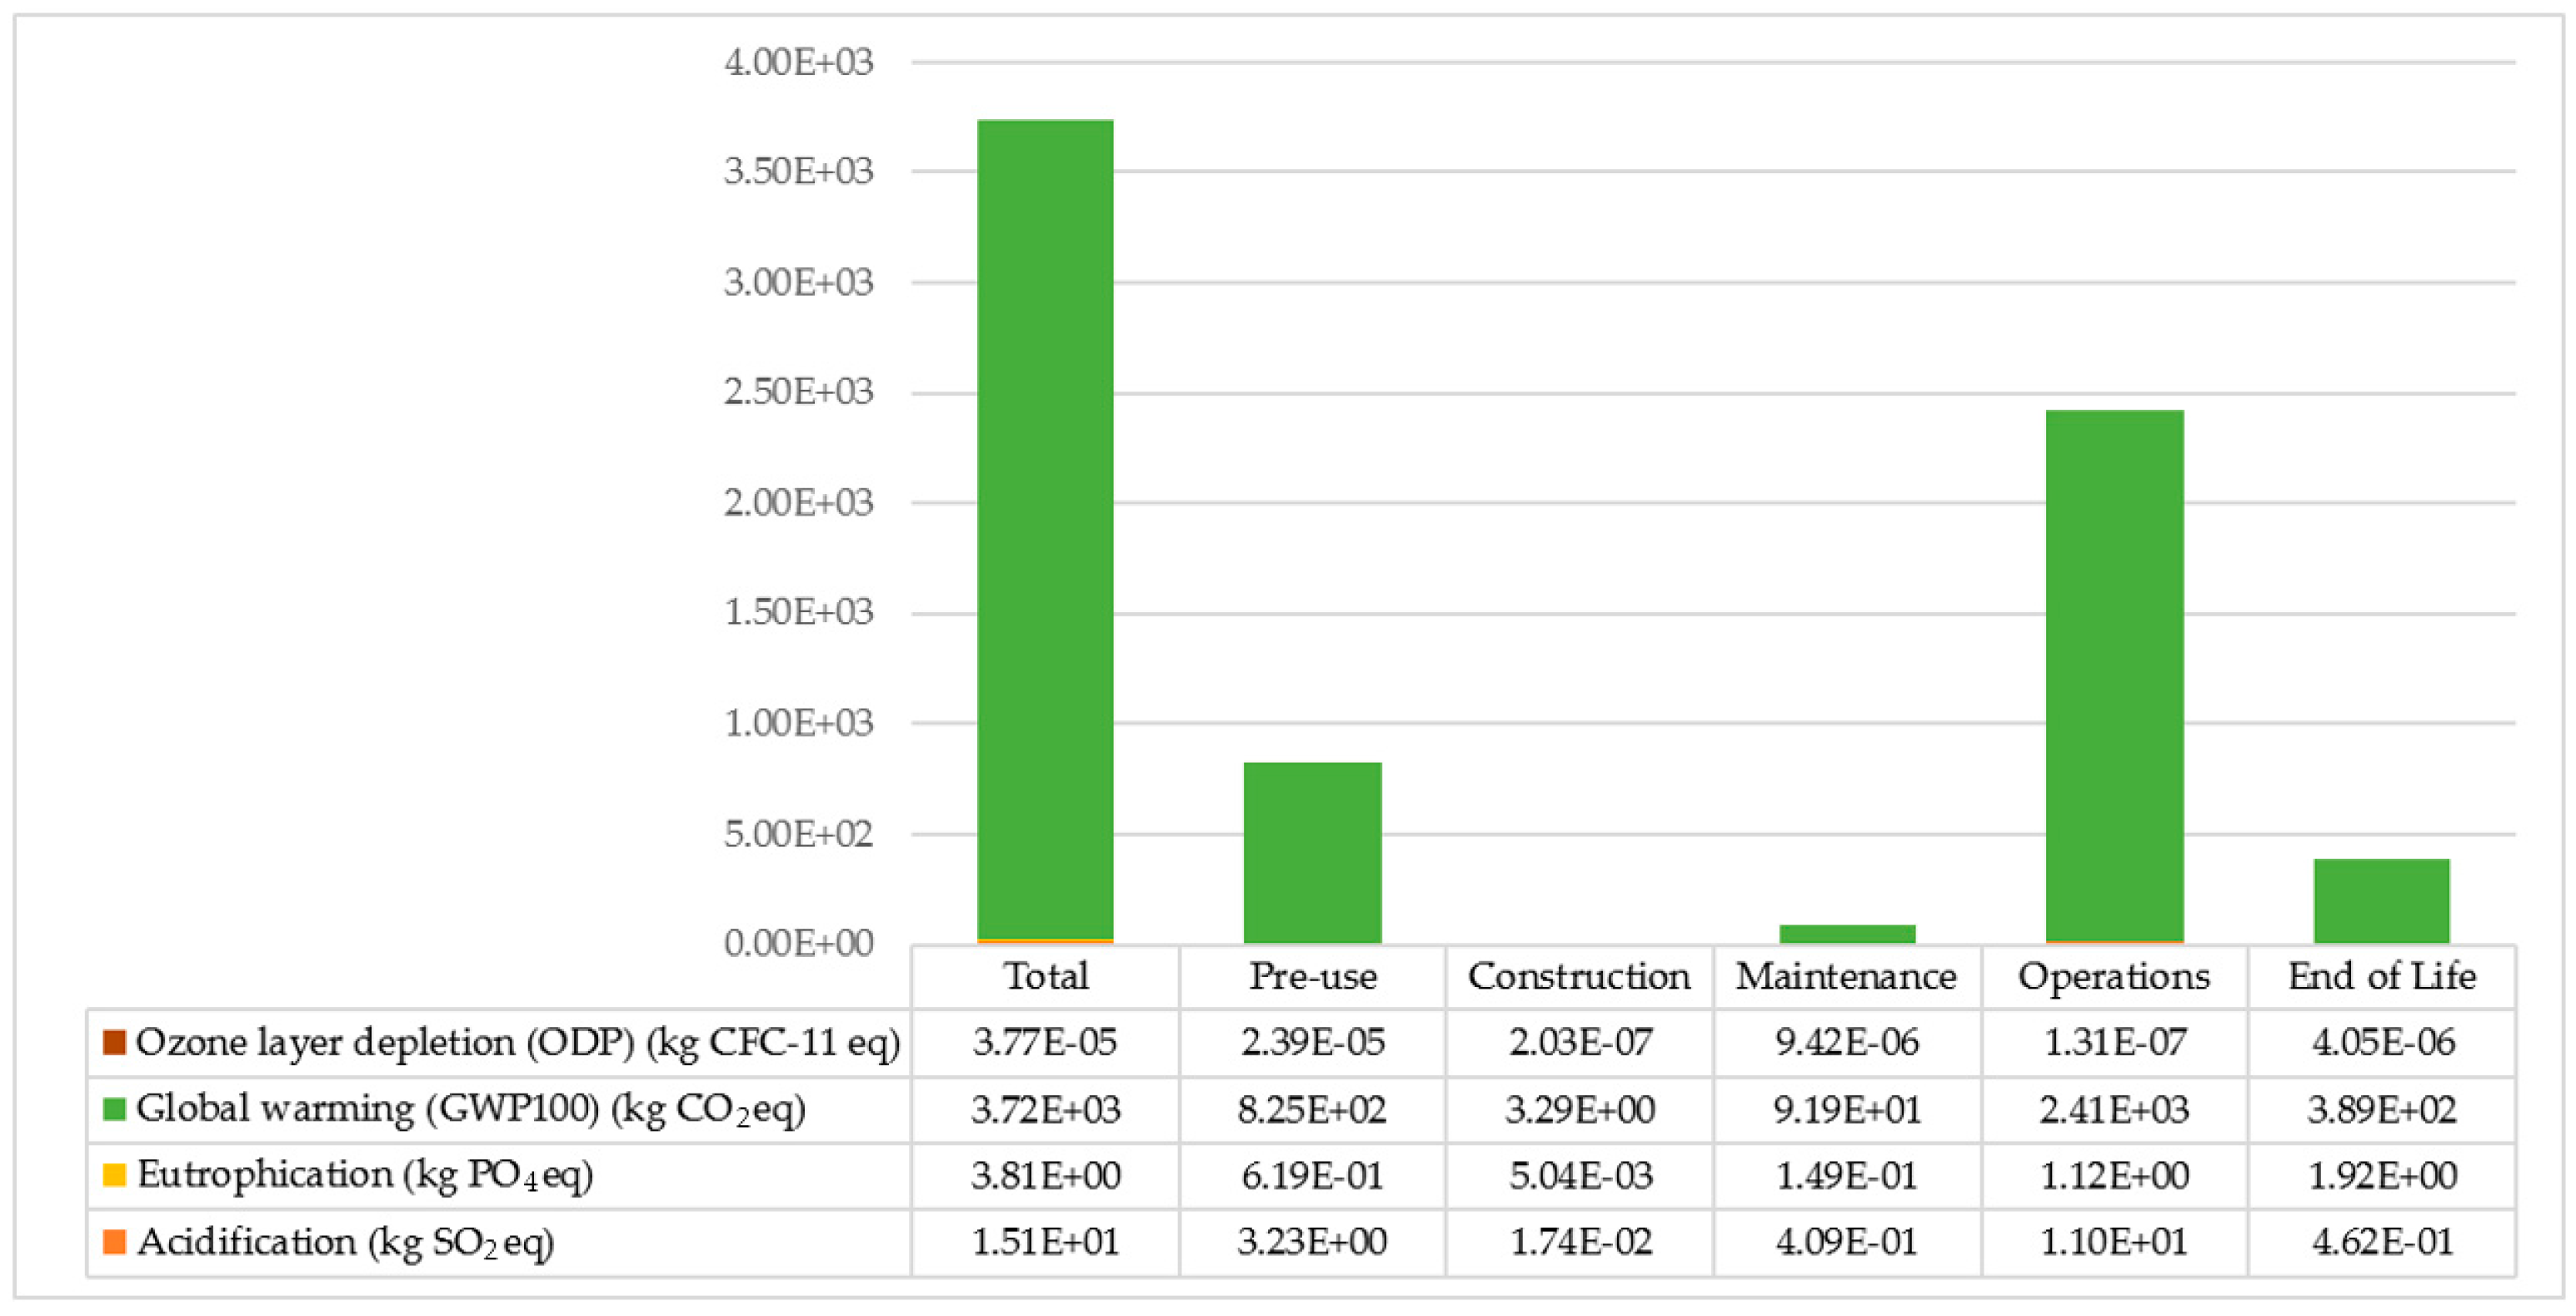
3. Results and Discussion

3.1. Overview of the Results

Figure 3 shows the results of total LCIA. Operation phase of the building life cycle has the highest impact on GWP and acidification compared to other phases. This is due to the use of fossil fuel in the electricity generation mix in Malaysia. The pre-use phase has the highest impact on ODP compared to other phases mainly contributed by materials and processes in the production of the wall (6.28 × 10⁻⁶ kg CFC-11 eq). The construction phase has the lowest overall environmental impact, which is similar to previous studies [32,40,41]. EOL has the highest impact in eutrophication compared to other phases with 1.92 kg PO4-eq, which were contributed by the disposal of clay bricks to landfill. The maintenance phase has a lower impact in comparison to the pre-use phase due to the low quantity of materials used.
Table 4 shows the environmental impact of every element in the pre-use phase. The substructure has the highest impact of acidification and eutrophication, and GWP largely contributed due to the substantial quantity of cement in concrete-based building elements, which account for 77%, 53%, 81%, respectively. Stairs have the lowest overall impact due to small quantities of material used per GFA.
During the maintenance phase, the painting and aluminium frame window have been identified as the two highest environmental impact contributors. Painting has the largest impact on acidification, eutrophication, and ODP due to higher replacement frequencies. Meanwhile, the aluminium frame window has the highest impact on GWP as shown in Table 5.
The environmental impact during the EOL phase has the highest level of eutrophication with a relatively high GWP. Figure 4 shows the LCIA of transportation to the landfill and disposal of building materials. The impact of clay brick disposal was the highest in all impact categories followed by cement based products.

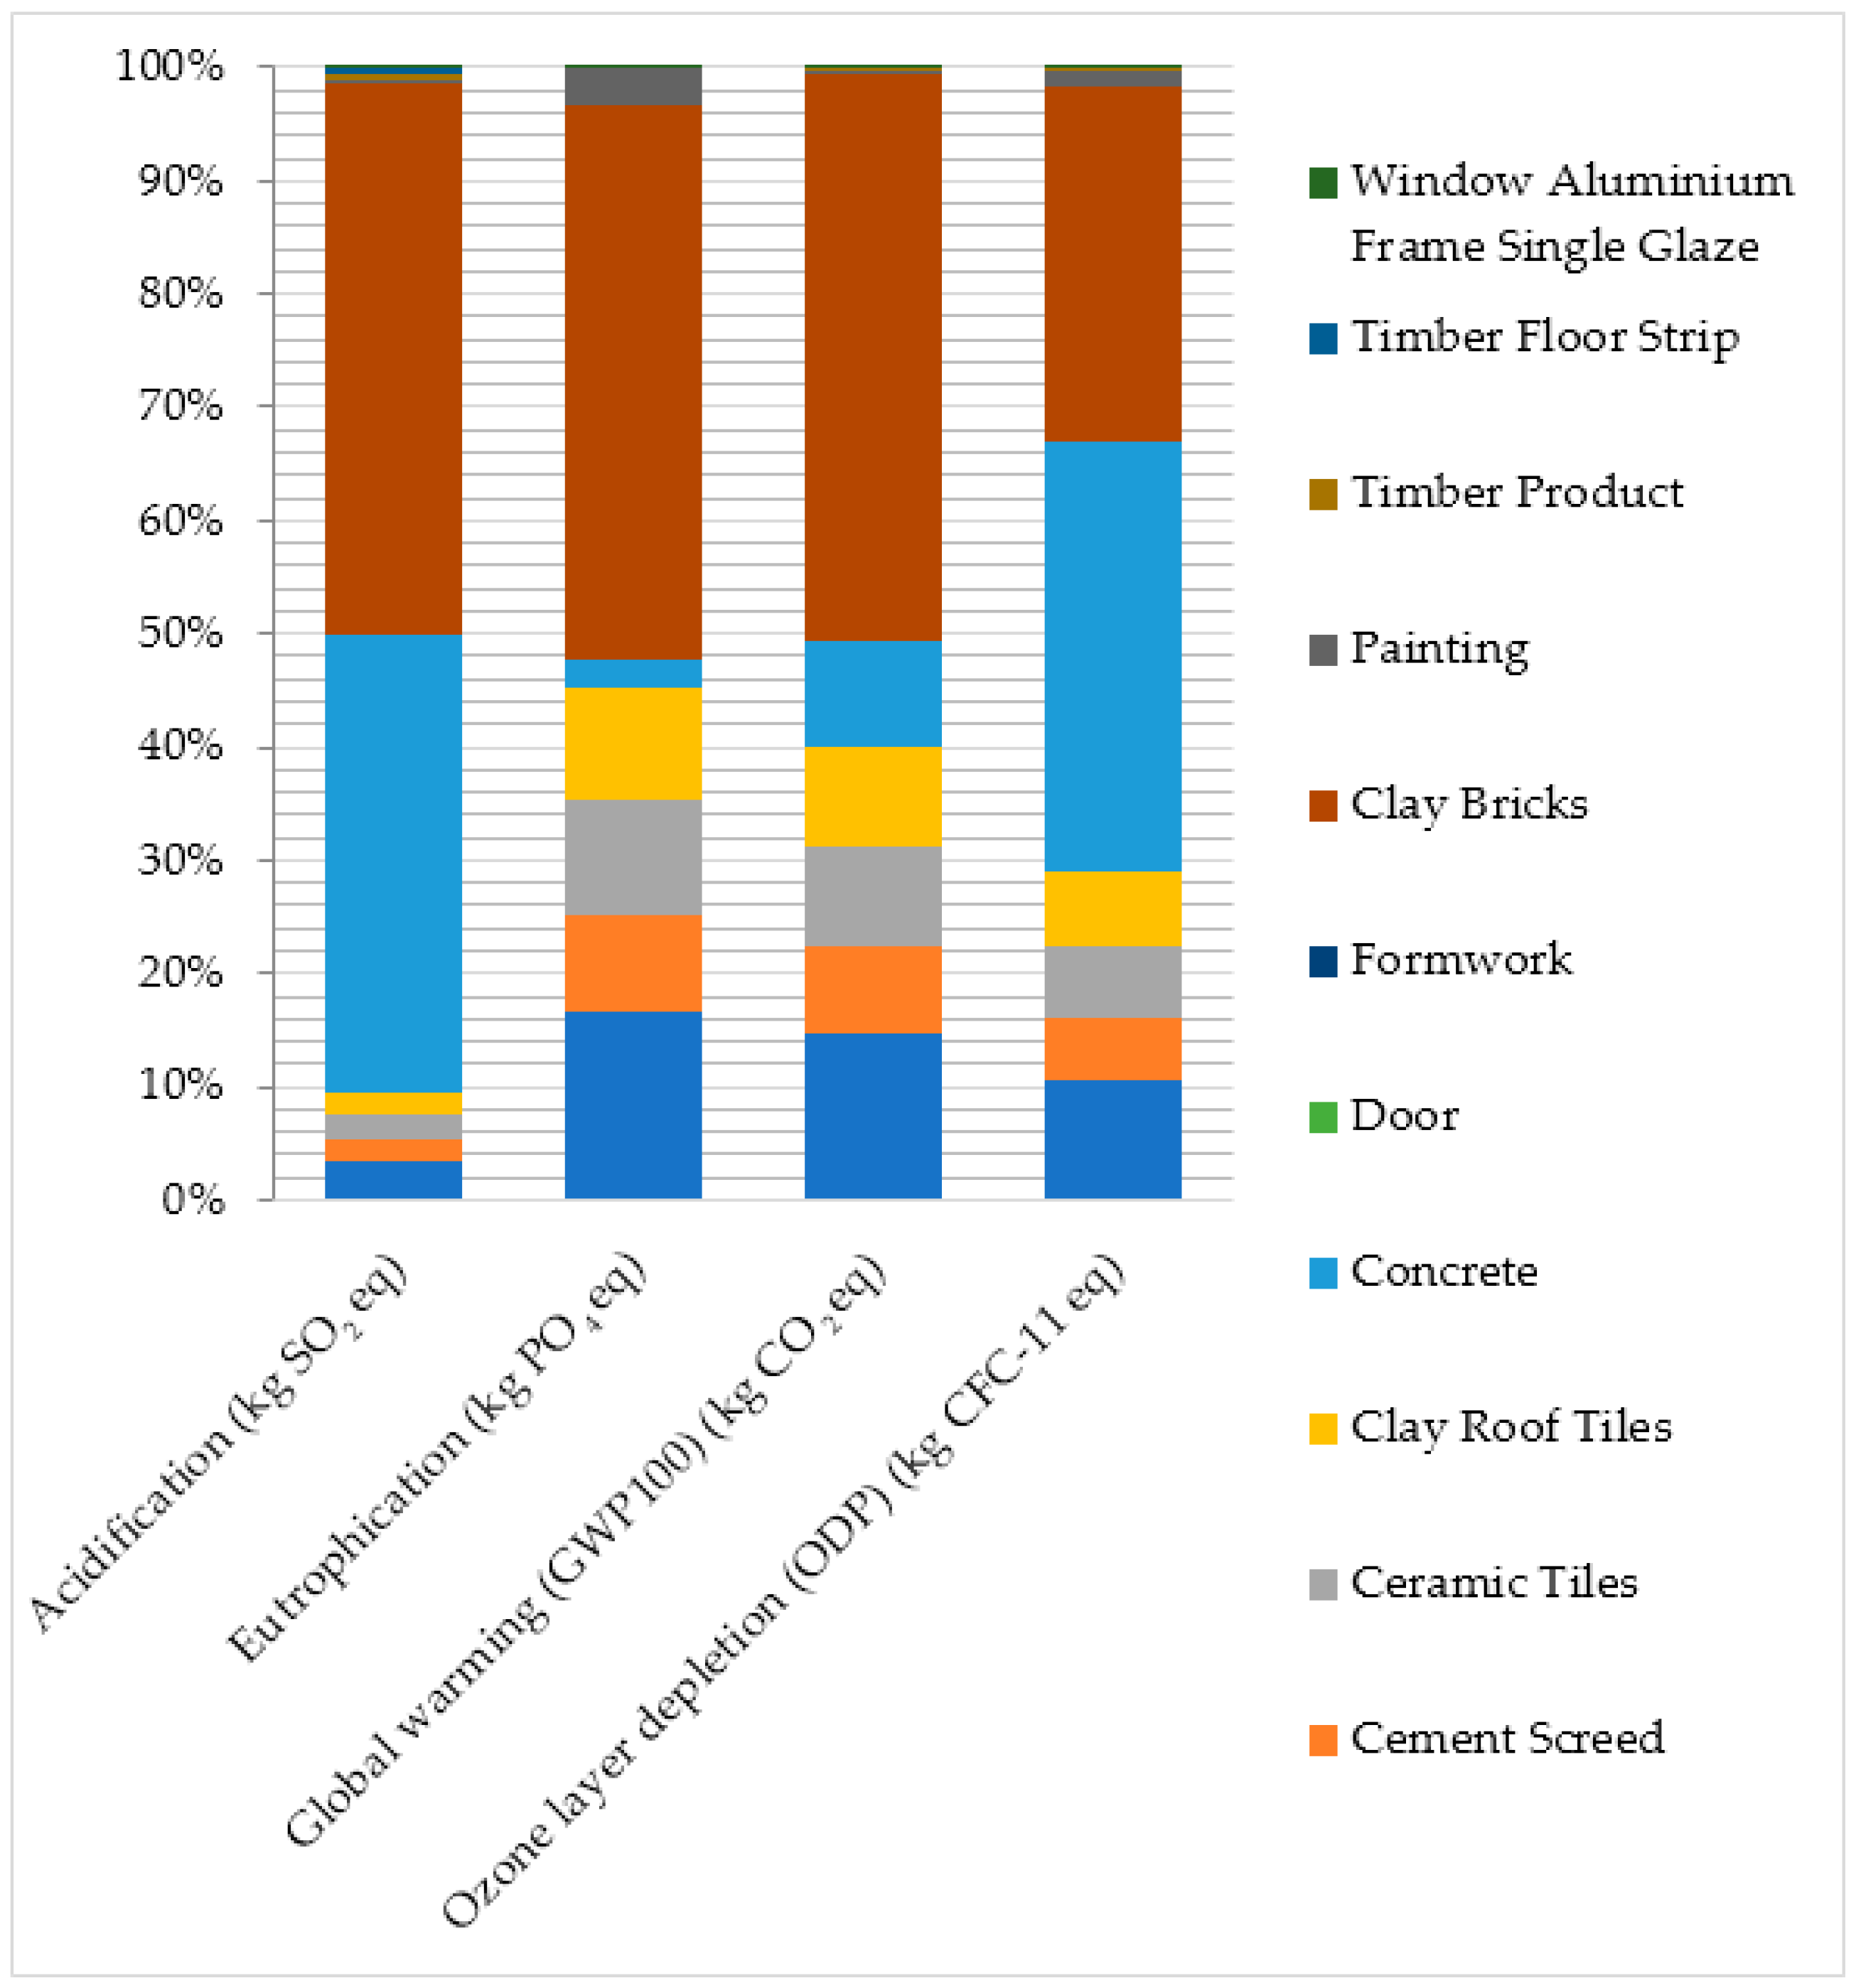
3.2. Process Contribution Analysis

Impact of Materials

Contribution analysis process has been carried out to identify materials or processes that produce the highest impact. In the pre-use phase, the substructure has been identified as the largest impact for acidification, eutrophication, and GWP. Concrete was found to be dominant in every impact category compared to steel reinforcement and hardcore as shown in Table 6. In the production of concrete, cement was identified as the highest contributor, followed by transportation of concrete to the site as shown in Table 7. This study however, did not consider the potential of CO2 uptake during accelerated concrete carbonation curing for carbon capture and storage, as the technology has not been adopted yet in Malaysia [44]. The environmental impact and emission of cement production in Malaysia were calculated based on the MYLCID, where the main processes in cement production consist of raw material extraction, production of clinker, and cement grinding [29]. The clinker cement is comprised of a mixture of primary products of mainly calcium oxide, silica, aluminium oxide, and iron oxide. Limestone, chalk, and clay provide these chemical constituents. The raw material mixture is heated to approximately 1450 °C in a rotary furnace until sintering, which leads on average to the production of 570 kg CO2/t of cement (plus combustion emissions). Other materials used in concrete production such as aggregate have a very minimal impact. The CO2 emissions of aggregate production for 1 m3 of concrete mixture used in the building were 2.34 kg compared to 359 kg for cement.
In comparison to other building elements, the wall contributed the highest ODP mainly from transportation of natural gas with 3.24 × 10⁻⁶ kg CFC-11 eq (54%) and crude oil production with 2.47 × 10⁻⁶ kg CFC-11 eq (41%).

3.3. Sensitivity Analysis

Other researchers suggested that uncertainties in the method of measurement and geographical representative would influence the results [39,45]. This step was conducted to determine the influence of the uncertainties in the assumptions in this study specifically on the transportation distances and the impact of electricity production in different locations. For transportation, the predetermined distances were 50 km for concrete and 300 km for other materials. The standard deviation of ±20% is allocated for transportation distance as suggested by Wen et al. [21]. A substructure element was used as the base case scenario, as it has the largest impact. Results show that the transportation distances have minimal impact overall with the highest changes of 8.78% in ODP, while other impact categories had below 6% variance, as shown in Table 8.
Similar to previous findings, energy consumptions were identified as the largest impact on the environment. The Malaysian electricity generation mix is different to other countries because the major source of production is fossil fuel. The power stations in Malaysia consist of gas-fired, coal-fired, gas and coal-fired, oil-fired and hydro, but natural gas is the highest main fuel source [29]. Electricity generated by fossil fuels contribute to high greenhouse gas (GHG), which then leads to global warming. Figure 5 shows the midpoint environmental impact of 1 kWh electricity generation in Malaysia, Great Britain, Spain, Germany, and France by using CML 2001. Malaysia has the highest impact on GWP, the third highest in acidification and the lowest in ODP. Malaysia acidification impact is the third overall, but it has the largest emission of nitrogen oxides compared to other countries. The GWP impact in Malaysia is marginally higher (8.19 × 101 kg CO2 eq) due to the release of carbon dioxide from fossil fuels. The different electricity generation mix in the various countries will produce different environmental impact. Thus, the findings for this study are limited to Malaysia.

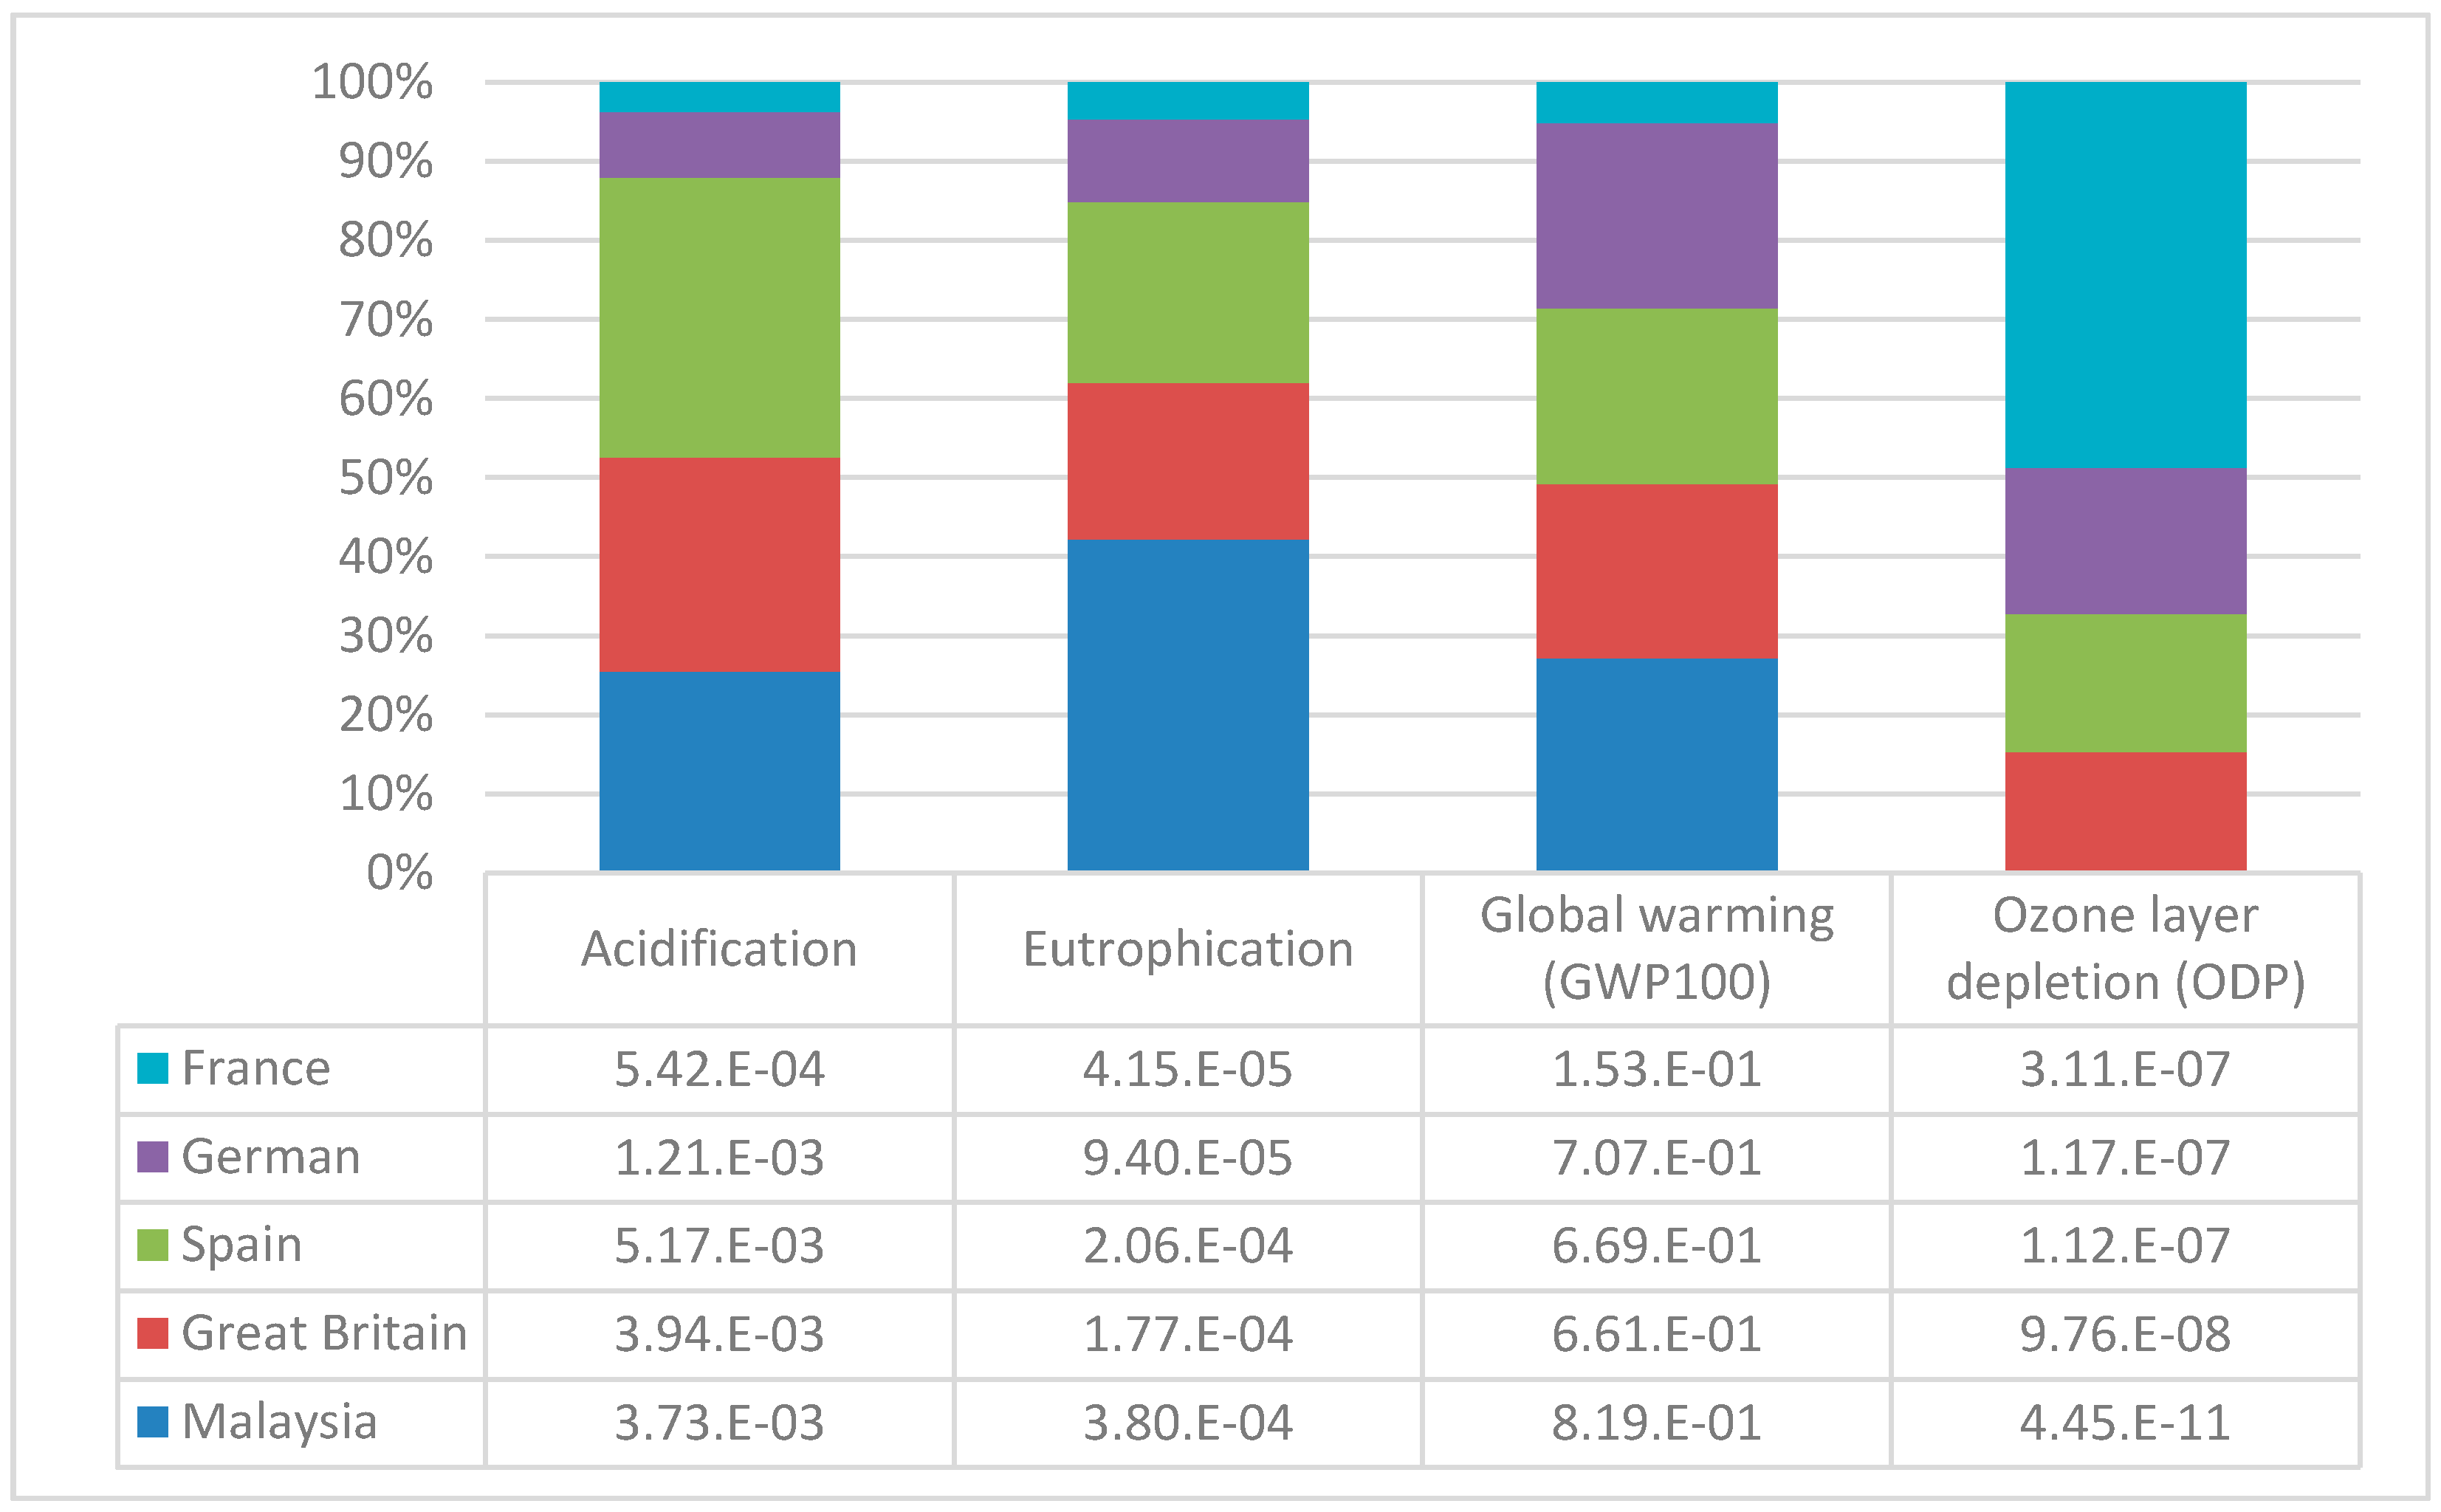
3.4. Comparison with Other Studies

Data validation is part of the LCA process as suggested in ISO 14044 and can be done by comparing the results to other published research [23,40,46]. Since no cradle-to-grave LCA studies for Malaysian residential buildings are available, the results were compared to a conventional four-storey flat and an IBS four-storey flat located in Johor, Malaysia from cradle-to-gate, i.e., from pre-use to construction only. Subsequently, cradle-to-grave comparison was made to the building in Spain and UK on the impact of GWP, acidification, and ODP since the type of building and the LCA method used in the studies were fairly similar. However, for the building in the UK, only GWP was considered as other impacts were not available. The comparison of selected impact categories with other studies is shown in Figure 6 and Table 9.
The GWP of this study was 8.28 × 10² kg CO2 eq, while the flats were much lower at 3.44 × 10² kg CO2 eq and 2.98 × 10² kg CO2 eq. In flats, the ratio of certain elements such as roofs, walls, floors and ceilings were shared between multiple units, which reduced the impact per m2 GFA. The specification and the quantity per m2 also contributed to the difference. For example, detailed specifications of the brick used in the 4-storey flats were not clearly mentioned. In general, low to medium cost houses use cheaper cement-based brick, which has lower energy used in production in comparison to clay bricks, and thus will influence the overall GWP [47].
The comparison of GWP impact category for cradle-to-grave between three semi-detached houses is relatively comparable. Since the larger share of GWP is from the use phase, the method used in determining the energy consumptions, climates, and impact from electricity generation mix in different countries contributed to variations in results. The energy consumption for the house in Spain was estimated using DesignBuilder software (DesignBuilder Software Ltd., London, UK) while data from statistics and estimation were used for the house in the UK. The air-conditioning system uses a large share of energy in the case study (47%) and 26% in the semi-detached house in Spain. However, the majority of the energy usage in the semi-detached house in the UK was contributed by space heating (59%), which was not applicable to the case study in Malaysia because of the hot and humid weather. Acidification results for the case study and the house in Spain were also primarily contributed by the use phase. However, the ODP for this study was lower in comparison to other buildings. The ODP in the case study was largely contributed by the pre-use phase rather than the use phase in Spain, which contributed to higher ODP levels per kWh of electricity used.

4. Conclusions

LCA is a crucial tool in measuring detailed environmental impact, especially towards the building industry. This study has assessed the environmental impacts of a conventional residential building in Malaysia from cradle-to-grave, i.e., during pre-use, construction, use, and EOL using four impact categories from CML 2001—namely, GWP, acidification, ODP, and eutrophication. The limitation of this study was based on the LCA method and assumptions in the goal and scope definition, LCI, LCIA, and interpretation. It was found that the building operation during the use phase produced the highest GWP (2.14 × 10³ kg CO2 eq) and acidification (1.10 × 101 kg SO2 eq) compared to other phases during the building life cycle. In the pre-use phase, concrete in the substructure has been identified as the largest contributor to GWP (3.65 × 10² kg CO2 eq), acidification (1.54 kg SO2 eq), and eutrophication (2.22 × 10⁻¹ kg PO4 eq) with cement as the primary raw material. In the maintenance phase, painting has the highest impact on acidification (2.13 × 10⁻¹ kg SO2 eq), eutrophication (7.52 × 10⁻² kg PO4 eq) and ODP (4.81 × 10⁻⁶ kg CFC-11 eq), while the aluminium window frame has the highest impact on GWP (4.21 × 101 kg CO2 eq). In EOL, clay bricks and concrete contributed to major environmental impacts. The results of this study showed that residential building in Malaysia is comparable to the building in Spain and UK. The study also showed that uncertainties in the method of measurement, data quality, and different geographic location would influence the results. The findings in this study are useful to government agencies and building professionals on the environmental impacts of building construction, especially in Malaysia as well as other countries with similar conditions.

Author Contributions

Ahmad Faiz Abd Rashid prepared the initial draft of the manuscript under the guidance of Sumiani Yusoff. Juferi Idris contributed to revising and preparing the final draft of the manuscript.

Conflicts of Interest

The authors declare no conflict of interest.

References

  1. Arena, A.P.; De Rosa, C. Life Cycle Assessment of Energy and Environmental Implications of the Implementation of Conservation Technologies in School Buildings in Mendoza—Argentina. Build. Environ. 2003, 38, 359–368. [Google Scholar] [CrossRef]
  2. Roodman, D.; Lenssen, N.; Peterson, J. A Building Revolution: How Ecology and Health Concerns Are Transforming Construction; Worldwatch Institute: Washington, DC, USA, 1995. [Google Scholar]
  3. Singh, A.; Berghorn, G.; Joshi, S.; Syal, M. Review of Life-Cycle Assessment Applications in Building Construction. J. Archit. Eng. 2011, 17, 15–23. [Google Scholar] [CrossRef]
  4. Fava, J.; Baer, S.; Cooper, J. Increasing Demands for Life Cycle Assessments in North America. J. Ind. Ecol. 2009, 13, 491–494. [Google Scholar] [CrossRef]
  5. Oyarzo, J.; Peuportier, B. Life Cycle Assessment Model Applied to Housing in Chile. J. Clean. Prod. 2014, 69, 109–116. [Google Scholar] [CrossRef]
  6. International Organization for Standardization (ISO). ISO 14040:2006 Environmental Management—Life Cycle Assessment—Principles and Framework; International Organization for Standardization: Geneva, Switzerland, 2006. [Google Scholar]
  7. Adalberth, K. Energy Use during the Life Cycle of Buildings: A Method. Build. Environ. 1997, 32, 317–320. [Google Scholar] [CrossRef]
  8. Abd Rashid, A.F.; Yusoff, S. A Review of Life Cycle Assessment Method for Building Industry. Renew. Sustain. Energy Rev. 2015, 45, 244–248. [Google Scholar] [CrossRef]
  9. Ismail, I.; Chen, S. Current Status of Carbon Footprints and LCA in Malaysia; SIRIM: Shah Alam, Selangor, Malaysia, 2010; pp. 1–8. [Google Scholar]
  10. Syafa Bakri, S.N.; Surif, S.; Ramasamy, R.K. A Case Study of Life Cycle Assessment (LCA) on Ballast for Fluorescent Lamp in Malaysia. In Proceedings of the IEEE International Symposium on Electronics and the Environment (ISEE), San Francisco, CA, USA, 19–22 May 2008; pp. 1–4.
  11. Thannimalay, L.; Yusoff, S.; Chen, S.S.; Zin Zawawi, N. Eutrophication Potential of Laundry Detergent Used in Malaysia. In Proceedings of the International Conference on Environment, Penang, Malaysia, 11–13 December 2012; pp. 515–522.
  12. Thannimalay, L.; Yusoff, S.; Zawawi, N.Z. Life Cycle Assessment of Sodium Hydroxide. Aust. J. Basic Appl. Sci. 2013, 7, 421–431. [Google Scholar]
  13. Sharaai, A.H.; Mahmood, N.Z.; Sulaiman, A.H. Potential of the Application of Life Cycle Assessment (LCA) in the Water Treatment Process in Malaysia; LCA: Malaysia, 2009; Available online: http://www.lcamalaysia.com/i_news/Potential_of_the_application_of_LCA_in_WTP_in_msia.pdf (accessed on 17 June 2014).
  14. Sharaai, A.H.; Mahmood, N.Z.; Sulaiman, A.H. Life Cycle Assessment (LCA) in Potable Water Production: An Analysis of Green House Gases Emission from Chemicals and Electricity Usage in Water Treatment in Malaysia. Asian J. Water Environ. Pollut. 2009, 6, 27–34. [Google Scholar]
  15. Shafie, S.M.; Mahlia, T.M.I.; Masjuki, H.H.; Rismanchi, B. Life Cycle Assessment (LCA) of Electricity Generation from Rice Husk in Malaysia. Energy Procedia 2012, 14, 499–504. [Google Scholar] [CrossRef]
  16. SIRIM. Cradle-to-Gate Life Cycle Inventory Analysis for Bio-Mate Composting System; Environmental Technology Research Centre: Shah Alam, Malaysia, 2011. [Google Scholar]
  17. Sumiani, Y.; Onn, C.C.; Din, M.A.M.; Jaafar, W. Environmental Planning Strategies for Optimum Solid Waste Landfill Siting. Sains Malays. 2009, 38, 457–462. [Google Scholar]
  18. Hassan, M.; Awang, M.; Lee Chong, T.; Zakaria, Z.; Bee Lay, L.; Yusoff, N.; Sino, H. The Application of an Life Cycle Inventory (LCI) Model for Solid Waste Disposal Systems in Malaysia. Int. J. Life Cycle Assess. 1999, 4, 188–190. [Google Scholar] [CrossRef]
  19. Fujita, Y.; Matsumoto, H.; Ho, C.S. Life Cycle Assessment Using Input-Output Analysis of CO2 Emissions from Housing in Malaysia. In Proceedings of the International Conference on Sustainable Energy Technologies, Seoul, Korea, 24–27 August 2008.
  20. Omar, W.M.S.W.; Doh, J.-H.; Panuwatwanich, K.; Miller, D. Assessment of the Embodied Carbon in Precast Concrete Wall Panels Using a Hybrid Life Cycle Assessment Approach in Malaysia. Sustain. Cities Soc. 2014, 10, 101–111. [Google Scholar] [CrossRef]
  21. Wen, T.J.; Siong, H.C.; Noor, Z.Z. Assessment of Embodied Energy and Global Warming Potential of Building Construction Using Life Cycle Analysis Approach: Case Studies of Residential Buildings in Iskandar Malaysia. Energy Build. 2014, 93, 295–302. [Google Scholar] [CrossRef]
  22. Bin Marsono, A.K.; Balasbaneh, A.T. Combinations of Building Construction Material for Residential Building for the Global Warming Mitigation for Malaysia. Constr. Build. Mater. 2015, 85, 100–108. [Google Scholar] [CrossRef]
  23. International Organization for Standardization (ISO). ISO 14044 Environmental Management—Life Cycle Assessment—Requirements and Guidelines; International Organization for Standardization: Geneva, Switzerland, 2006. [Google Scholar]
  24. Abd Rashid, A.F.; Yusoff, S. Sustainability in the Building Industry: A Review on the Implementation of Life Cycle Assessment. In Proccedings of the 2nd International Conference on Climate Change & Social Issues, Kuala Lumpur, Malaysia, 28–29 November 2012; Wijesuriya, K., Ed.; International Center for Research and Development (ICRD): Kuala Lumpur, Malaysia, 2012. [Google Scholar]
  25. Kadir, M.R.A.; Lee, W.P.; Jaafar, M.S.; Sapuan, S.M.; Ali, A.A.A. Construction Performance Comparison between Conventional and Industrialised Building Systems in Malaysia. Struct. Surv. 2006, 24, 412–424. [Google Scholar] [CrossRef]
  26. Iyer-Raniga, U.; Wong, J.P.C. Evaluation of Whole Life Cycle Assessment for Heritage Buildings in Australia. Build. Environ. 2012, 47, 138–149. [Google Scholar] [CrossRef]
  27. PRé. SimaPro. Available online: http://www.pre-sustainability.com/simapro (accessed on 1 February 2015).
  28. Herrmann, I.T.; Moltesen, A. Does It Matter Which Life Cycle Assessment (LCA) Tool You Choose?—A Comparative Assessment of SimaPro and GaBi. J. Clean. Prod. 2015, 86, 163–169. [Google Scholar] [CrossRef]
  29. MY-LCID. Malaysia Life Cycle Inventory Database. Available online: http://mylcid.sirim.my/sirimlca/ (accessed on 22 March 2013).
  30. Horváth, S.E.; Szalay, Z. Decision-Making Case Study for Retrofit of High-Rise Concrete Buildings Based on Life Cycle Assessment Scenarios. In International Symposium on Life Cycle Assessment and Construction—Civil Engineering and Buildings; Ventura, A., De la Roche, C., Eds.; RILEM Publications SARL: Nantes, France, 2012; pp. 116–124. [Google Scholar]
  31. Frischknecht, R.; Jungbluth, N.; Althaus, H.J.; Doka, G.; Heck, T.; Hellweg, S.; Hischier, R.; Nemecek, T.; Rebitzer, G.; Spielmann, M. Overview and Methodology. Ecoinvent Rep. 2007, Report No. 1. Available online: http://www.ecoinvent.org/files/200712_frischknecht_jungbluth_overview_methodology_ecoinvent2.pdf (accessed on 12 February 2015).
  32. Rossi, B.; Marique, A.-F.; Glaumann, M.; Reiter, S. Life-Cycle Assessment of Residential Buildings in Three Different European Locations, Basic Tool. Build. Environ. 2012, 51, 395–401. [Google Scholar] [CrossRef]
  33. Buchan, R.D.; Fleming, F.E.; Grant, F.E. Estimating for Builders & Surveyors, 2nd ed.; Elsevier: Oxford, UK, 2003. [Google Scholar]
  34. Arham, A. A Methodological Analysis of Demolition Works in Malaysia; Faculty of Civil Engineering, Universiti Teknologi Malaysia: Skudai, Malaysia, 2008. [Google Scholar]
  35. Wittstock, B.; Gantner, J.; Saunders, T.; Anderson, J.; Lenz, K.; Carter, C.; Gyetvai, Z.; Kreißig, J.; Braune, A.; Lasvaux, S.; et al. EeBGuide Guidance Document Part B: BUILDINGS; Fraunhofer Verlag: Stuttgart, Germany, 2012. [Google Scholar]
  36. Abdullah, A. Anggaran Kos Kerja Bangunan; Pearson/Prentice Hall: Petaling Jaya, Malaysia, 2005. [Google Scholar]
  37. OpenStudio. Available online: https://www.openstudio.net/ (accessed on 13 May 2014).
  38. Kubota, T.; Jeong, S.; Toe, D.H.C.; Ossen, D.R. Energy Consumption and Air-Conditioning Usage in Residential Buildings of Malaysia. J. Int. Dev. Coorper. 2011, 17, 61–69. [Google Scholar]
  39. Ortiz-Rodríguez, O.; Castells, F.; Sonnemann, G. Life Cycle Assessment of Two Dwellings: One in Spain, a Developed Country, and One in Colombia, a Country under Development. Sci. Total Environ. 2010, 408, 2435–2443. [Google Scholar] [CrossRef] [PubMed]
  40. Ochsendorf, J.; Norford, L.K.; Brown, D.; Durchlag, H.; Hsu, S.L.; Love, A.; Santero, N.; Swei, O.; Webb, A.; Wildnauer, M. Methods, Impacts, and Opportunities in the Concrete Building Life Cycle. 2011. Available online: http://www.greenconcrete.info/downloads/MITBuildingsLCAreport.pdf (accessed on 8 June 2015).
  41. Blengini, G.A.; Di Carlo, T. The Changing Role of Life Cycle Phases, Subsystems and Materials in the LCA of Low Energy Buildings. Energy Build. 2010, 42, 869–880. [Google Scholar] [CrossRef]
  42. Monteiro, H.; Freire, F. Life-Cycle Assessment of a House with Alternative Exterior Walls: Comparison of Three Impact Assessment Methods. Energy Build. 2012, 47, 572–583. [Google Scholar] [CrossRef]
  43. Khasreen, M.; Banfill, P.F.; Menzies, G. Life-Cycle Assessment and the Environmental Impact of Buildings: A Review. Sustainability 2009, 1, 674–701. [Google Scholar] [CrossRef] [Green Version]
  44. Kashef-Haghighi, S.; Shao, Y.; Ghoshal, S. Mathematical Modeling of CO2 Uptake by Concrete during Accelerated Carbonation Curing. Cem. Concr. Res. 2015, 67, 1–10. [Google Scholar] [CrossRef]
  45. Hong, J.; Shen, G.Q.; Peng, Y.; Feng, Y.; Mao, C. Uncertainty Analysis for Measuring Greenhouse Gas Emissions in the Building Construction Phase: A Case Study in China. J. Clean. Prod. 2016, 129, 183–195. [Google Scholar] [CrossRef]
  46. Cuéllar-Franca, R.M.; Azapagic, A. Environmental Impacts of the UK Residential Sector: Life Cycle Assessment of Houses. Build. Environ. 2012, 54, 86–99. [Google Scholar] [CrossRef]
  47. Utama, A.; Gheewala, S.H. Life Cycle Energy of Single Landed Houses in Indonesia. Energy Build. 2008, 40, 1911–1916. [Google Scholar] [CrossRef]
  48. Ortiz, O.; Bonnet, C.; Bruno, J.C.; Castells, F. Sustainability Based on LCM of Residential Dwellings: A Case Study in Catalonia, Spain. Build. Environ. 2009, 44, 584–594. [Google Scholar] [CrossRef]
Figure 1. Floor plans of the house.
Sustainability 09 00329 g001
Figure 2. System boundaries of the life cycle model (adapted from [8,26]).
Sustainability 09 00329 g002
Figure 3. Life Cycle Impact Assessment (LCIA) results based on building phases.
Sustainability 09 00329 g003
Figure 4. LCIA in the end-of-life (EOL) phase based on building materials.
Sustainability 09 00329 g004
Figure 5. Comparison of LCIA of electricity generation mix for 1 kWh in Malaysia, Great Britain, Spain, Germany, and France by using CML 2001.
Sustainability 09 00329 g005
Figure 6. Comparison of Global Warming Potential (GWP) from cradle-to-gate of residential building with other studies in Malaysia.
Sustainability 09 00329 g006
Table 1. Life Cycle Inventory (LCI) of materials in pre-use phase.
ItemMaterialsQuantityQuantity/m2 GFAUnit
ASubstructure
Excavation86.020.35m3
Hardcore15.440.06m3
Concrete grade 7 blinding21.740.09m3
Concrete grade 25184.030.75m3
Steel reinforcement2561.6210.41kg
Timber formwork4.130.02m3
BFrame
Concrete grade 2523.200.09m3
Steel reinforcement 3883.0015.78kg
Timber formwork7.690.03m3
CUpper Floor
Concrete grade 2528.730.12m3
Steel reinforcement 1709.626.95kg
Timber formwork3.350.01m3
DStairs
Concrete grade 252.780.01m3
Steel reinforcement 243.000.99kg
Timber formwork1.070.00m3
EBrickwall
Clay brick
Half brick thick381.001.55m2
One brick thick37.140.15m2
FRoof and covering
Fascia board0.310.00m3
Painting for roof trusses21.610.09m2
Timber roof trusses10.650.04m3
Clay roof coverings213.840.87m2
GFinishes
Cement screed9.470.04m3
Ceramic tiles357.591.45m2
Timber strip116.090.47m2
Plasterwork18.570.08m3
Painting to wall1229.505.00m2
GFA = Gross Floor Area.
Table 2. Estimated electricity consumption during building operation for a 50-year lifespan.
ElementsAmount (kWh)
Air conditioning341,236.50
Illumination119,142.50
Electrical Equipment265,266.00
Total725,645.00
Total/GFA (kWh/m2)2949.78
Table 3. Replacement interval of selected building elements in the maintenance phase.
ElementsExpected LifespanNumber of Replacements in 50 years
Painting10 years4 times
Roof covering25 years1 times
Window30 years1 times
Table 4. LCIA in pre-use phase based on building elements.
Impact CategoryUnitDoorFinishesFrameRoof & CoveringStairUpper FloorWallSubstructureWindow
Acidificationkg SO2 eq8.86 × 10−24.38 × 10−12.20 × 10−17.34 × 10−22.35 × 10−22.22 × 10−13.48 × 10−11.541.61 × 10−1
Eutrophicationkg PO4-eq3.48 × 10−29.59 × 10−25.25 × 10−21.78 × 10−24.57 × 10−32.94 × 10−27.76 × 10−22.22 × 10−16.88 × 10−2
Global warming (GWP100)kg CO2 eq2.11 × 1011.22 × 1025.39 × 1012.15 × 1015.685.27 × 1011.14 × 1023.65 × 1024.21 × 101
Ozone layer depletion (ODP)kg CFC-11 eq1.76 × 10−65.20 × 10−61.12 × 10−61.28 × 10−68.92 × 10−84.37 × 10−76.28 × 10−63.66 × 10−63.79 × 10−6
Table 5. LCIA in maintenance phase.
Impact CategoryUnitAluminium WindowClay Roof TilesPainting
Acidificationkg SO2 eq1.61 × 10−13.54 × 10−22.13 × 10−1
Eutrophicationkg PO4-eq6.88 × 10−25.20 × 10−37.52 × 10−2
Global warming (GWP100)kg CO2 eq4.21 × 1011.46 × 1013.53 × 101
Ozone layer depletion (ODP)kg CFC-11 eq3.79 × 10−68.13 × 10−74.81 × 10−6
Table 6. Process contribution of LCIA of substructure.
Impact CategoryUnitHardcore (Crushed Stone)ConcreteSteel Reinforcement
Acidificationkg SO2 eq2.44 × 10−31.442.62 × 10−2
Eutrophicationkg PO4 eq8.61 × 10−41.93 × 10−11.81 × 10−2
Global warming (GWP100)kg CO2 eq4.32 × 10−13.40 × 1027.28
Ozone layer depletion (ODP)kg CFC-11 eq4.09 × 10−82.96 × 10−64.84 × 10−7
Table 7. Process contribution analysis of LCIA of concrete in selected impact categories.
Impact CategoryUnitTotalCementTransportation of ConcreteRemaining Process
Acidificationkg SO2 eq1.441.13(78%)1.74 × 10⁻¹(12%)1.66 × 10⁻¹(12%)
Eutrophicationkg PO4 eq1.93 × 10−11.11 × 10⁻¹(58%)4.48 × 10⁻²(23%)5.62 × 10⁻²(29%)
Global warming potential (GWP100)kg CO2 eq3.40 × 1022.82 × 102(83%)3.40 × 101(10%)3.20 × 101(9%)
Table 8. LCIA with ±20% standard deviation for transportation distance for substructure.
Impact CategoryUnitPercentage
Acidificationkg SO2 eq3.06%
Eutrophicationkg PO4 eq5.51%
Global warming (GWP100)kg CO2 eq2.54%
Ozone layer depletion (ODP)kg CFC-11 eq8.78%
Table 9. Comparison of the selected impact categories from cradle-to-grave of the case study with other semi-detached residential building.
Impact CategoryUnitSemi-Detached (This Study)Semi-Detached in Spain [48]Semi-Detached in UK [46]
Global Warming Potential (GWP)kg CO2 eq3.72 × 1032.43 × 1034.16 × 103
Acidificationkg SO2 eq1.51 × 1011.85 × 101-
Ozone layer depletion (ODP)kg CFC-11 eq3.77 × 10−51.17 × 10⁻⁴-

