Article

Regional Features and National Differences in Population Distribution in China’s Border Regions (2000–2015)

1
School of Humanities and Economic Management, China University of Geosciences, Beijing 100083, China
2
Institute of Geographic Sciences and Natural Resources Research, Beijing 100101, China
3
University of Chinese Academy of Sciences, Beijing 100049, China
*
Author to whom correspondence should be addressed.
Sustainability 2017, 9(3), 336; https://doi.org/10.3390/su9030336
Submission received: 22 December 2016 / Revised: 20 February 2017 / Accepted: 20 February 2017 / Published: 25 February 2017
(This article belongs to the Section Sustainable Urban and Rural Development)

Abstract

:
China is of great geostrategic significance not only in the Asia-Pacific region, but also in the wider world. The population distribution in China’s border regions is of significance for the development of China and neighboring countries. Based on the LandScan Population Distribution Database, this study used GIS spatial analysis and statistics to investigate national trends in the population distribution of China’s border regions. The study areas were the buffer zones within specified Euclidean distances from the land borders of China. The results showed that: (1) Although the population agglomeration index and population size inside China’s border areas have increased, the population density inside China’s border areas is still far below China’s average population density; (2) Over the last 15 years, the population of China’s northwestern border has been sparse, with small increases in the population agglomeration index and population size. China’s northeastern and southwestern border regions have several average population density areas, but the northeastern regions have seen a substantial reduction in population size since 2000. Based on our analysis, we propose that the Chinese government introduce supporting policies for the development of border regions to maintain the population size. At the same time, considering the varied living suitability of the natural environment along the northeastern, northwestern, and southwestern borders, “moderate agglomeration” and “moderate evacuation” population development strategies should be implemented in specified areas. Tilt policy should also be implemented in areas of rapid population decline.

1. Introduction

Border regions, known as frontier areas, are territories close to national boundaries. Thus, the prerequisite for a frontier is that the area must be in contact with neighboring countries. China is located in the center of Asia with a land border stretching 21,000 km, and it is in contact with 14 neighboring countries. With China’s ongoing reforms and opening-up processes, cultural and economic exchanges and cooperation with neighboring countries in border areas (In this paper, “border region” refers to areas inside and outside border regions close to China’s land border lines.) are becoming more common. Given their special geographic locations and settlements of ethnic minorities, the border regions are becoming very sensitive areas for China in terms of maintaining foreign and ethnic relations. Domestic and international research on China’s borders has mainly focused on social and economic development [1,2,3,4], resources and environmental problems [5,6,7,8,9,10], border management [11,12], trade and cooperation with neighboring countries [13,14,15,16,17,18,19], and security issues [20,21,22,23,24,25,26].
Geographic populations in the border areas are uniquely important for national security strategies. Since 2010, the relevant state departments have carried out dynamic monitoring of the population distribution in the border areas. However, analytical research on the flow and influence of border populations has developed slowly. Few recent studies have focused on the population distribution in the border areas, and their scale and scope have been based only on county-level statistical data within China’s borders. Our current understanding is therefore incomplete due to the focus on Chinese-side population distribution and the lack of quantitatively systematic analysis of the population distributions of countries adjacent to China, especially in the area of the outer border with China. Moreover, demographic analyses based on administrative units overlook the large “no man’s lands” within China’s inland borders, with populations concentrated in plain oases and along the transportation routes. To some extent, these factors limit the application of research results.
China is of great geostrategic significance not only in the Asia-Pacific region, but also in the world, and the population distribution in China’s border regions reflects the development of China and neighboring countries. Therefore, scientific analysis and quantification of the basic patterns and changes in the population distribution in China’s border region can provide effective guidance for China and neighboring countries in maintaining a reasonable distribution and development of the population in this area.
In this study, we comparatively analyzed the population distribution, population density, and changes in population regions both inside and outside China’s borders using population spatial raster data, GIS spatial analysis, and mathematical statistics methods. The research areas were the buffer areas generated for different Euclidean distances to China’s land borders on both sides. The basic indicators were population density, population agglomeration index, and relative population change. We hope our findings will help guide the proper distribution of populations in the border areas and provide a scientific basis as well as policy support to safeguard national security for border populations.

2. Materials and Methods

2.1. Data Selection and Processing

At present, the most popular sources for spatial population data include the Gridded Population of the World (GPW), the Global Resource Information Database (GRID), and the LandScan Population Distribution Database. Established by the Center for International Earth Science Information Network at Columbia University, the GPW consists of grid demographic data created by transferring raw census data from administrative units to grid cells via a proportional allocation procedure. The GRID model, established in 1985 under the United Nations Environment Program, is based on the basic assumption of a strong correlation between population density and transportation accessibility, with a spatial resolution of 5 km. LandScan is a world-population spatialization project established by Oak Ridge National Laboratory; it combines the technologies of geographic information systems, remote sensing images, and multiple partition density models to generate a worldwide population distribution database with a spatial resolution of 30 arc-seconds. LandScan employs census data, administrative division data, and land cover from Landsat TM, along with QuickBird and IKONOS high-resolution satellite images and nighttime light images, to update the database and model algorithms annually. After comparing the accuracy and effectiveness of the three databases, we ultimately selected LandScan data for 2000 and 2015 as the basic spatial raster data for this study.
First, the ALBERS equal area conic projection transformation (Krasovsky_1940_Albers; standard parallel: 25°, 47°; central meridian: 105°; projection origin latitude: 0°; unit: m) was applied to the LandScan data for the two selected years, and the result was converted into 1 × 1 km raster data; Second, the raster data underwent an accuracy test. Outliers (e.g., unusually large numbers or a large population density in the middle of water) and some empty grid values were compared with land-use data and superimposed on Google Earth through the Google Earth open interface to find the geographical environments of the grids corresponding to the outliers. This type of grid was assigned to the grid value with similar geographical environments nearby, and the total population of the region was calculated using the ArcGIS (University of Redlands, RedLands, CA, USA) regional statistical method. Through comparison with relevant statistical data, the grid value was verified as feasible. After this process, a 1 × 1 km population density map of China and neighboring countries was obtained for the years 2000 and 2015 (Figure 1). It is worth mentioning that the LandScan data for the two years may have been constructed by different sets of ancillary inputs, and it is not recommended to compare the LandScan database of different time cell by cell, however, since the data were produced under the same general framework of ORNL, we trusted that, for the study of large scale population distribution pattern in geography—especially for a larger study area—the data for the two years were comparable.

2.2. Research Methods

2.2.1. Geographical Range Definition of China’s Border Regions

To ensure the study’s feasibility and avoid controversy, in this paper, China’s border areas refer specifically to its land border areas. Based on the land border, the buffer was set by assigning certain values for the neighborhood radius on both sides of the border. In this way, the range of the border areas examined in this study was clearly defined.
A buffer is essentially polygonal topology data—it is a polygon with a certain distance from a geographic target [27]. The definition of the buffer for point Oi is as follows:
Bi = {x:d(x,Oi) ≤ R}
where R is the minimum Euclidean distance from point Oi and x represents the set of all points. The buffer of point Oi is the collection of all points with a distance to Oi smaller than R. The collection of points is O = {Oi, i = 1, 2, …, n}, and the buffer radius R is the union of buffers for each individual B = B1B2∪…∪Bn [28].
As the two most fundamental means of interaction and communication in border areas, traveling on foot and traveling by vehicle, are major considerations in population distribution research. Therefore, we set six buffer radiuses according to two scenarios: travel on foot and travel by vehicle. For the former, we chose 5 km and 10 km, which are the distances traveled on foot for one hour and two hours, respectively (assuming a walking speed of 5 km/h); for the latter, we chose 25 km, 50 km, 100 km, and 200 km, which are the distances traveled by a vehicle for 30 min, 1 h, 2 h, and 4 h, respectively (assuming a vehicle velocity of 50 km/h).

2.2.2. Population Agglomeration Index

The population agglomeration index is the comparison of population agglomeration between a region and its respective country. It is defined as the ratio of regional population density to national population density, and is calculated with the following formulas:
JJDi-in = (Pi-in/Ai-in)/(Pin/Ain) = Di-in/Din,
JJDi-out = (Pi-out/Ai-out)/(Pout/Aout) = Di-out/Dout
where JJDi-in is the population agglomeration index inside the China-country i (China-i) border, Pi-in is the number of people inside the China-i border(unit: people), Ai-in is the land area inside the China-i border (unit: km2), Pin is the total population of China, Ain is China’s land area (unit: km2), Di-in is the population density inside the China-i border (unit: people/km2), and Din is China’s average population density (unit: people/km2). JJDi-out is the population agglomeration index outside the China-i border, Pi-out is the number of people outside the China-i border(unit: people), Ai-out is the land area outside the China-i border (unit: km2), Pout is the total population of country i (unit: people), Aout is country i’s land area (unit: km2), Di-out is the population density outside the China-i border (unit: people/km2), and Dout is country i’s average population density (unit: people/km2).
According to the population agglomeration index, the border area was divided into five categories: extremely sparse population area (JJD < 0.05), very sparse population area (0.05 ≤ JJD < 0.2), relatively sparse population area (0.2 ≤ JJD < 0.5), below-average population density area (0.5 ≤ JJD < 1), and above-average population density area (1 ≤ JJD < 2) [29,30].
We used a buffer zone with a 200-km radius as the study area and the population agglomeration index as the basic indicator. The population agglomeration index was calculated for the years 2000 and 2015 according to China’s border areas with 14 neighboring countries. The population density patterns were analyzed accordingly. The changes in population agglomeration on both sides of the borders for the 15-year period of 2000 to 2015 were comparatively studied as well.

2.2.3. Relative Population Change

Relative population change reflects the quantitative characteristics and trends in population changes in different areas. It can be measured by comparing the change in population from 2000 to 2015 using the following formulas:
A1 = Pi + 1 − Pi
A2 = PiPi + 1
F1 = A1/Pi × 100%
F2 = A2/Pi × 100%
where A1 is the increase in population, A2 is the decrease in population, F1 is the percentage increase in population, F2 is the percentage decrease in the population, Pi is the population in 2000, and Pi+1 is the population in 2015.
Based on population changes between 2000 and 2015, China’s border regions can be divided into population growth areas and population decline areas. Population growth areas include substantial growth areas (F1 ≥ 15% and A1 ≥ 5) and relative growth areas (0% ≤ F1< 15% or F1 ≥ 15% and A1 < 5). Population decline areas include substantial decline areas (F2 ≤ −15% and A2 ≥ 5) and relative decline areas (−15% < F1 < 0 or F2 ≤ −15% and A2 < 5).
We used buffers with a 200-km radius as the study areas to calculate population growth from 2000 to 2015. We comparatively analyzed the characteristics of population geographic change for the 15-year period from 2000 to 2015 in the border areas of China and its neighboring countries. However, the following exceptions should be noted: (1) Due to the smaller differences between the north and south latitudes for Nepal and Bhutan, their border areas with China were studied using buffers with a 50-km radius; (2) There are approximately 235.30 km2 of no man’s land inside China’s borders and 300.08 km2 of no man’s land outside the borders. We did not consider population changes in those areas.

3. Results

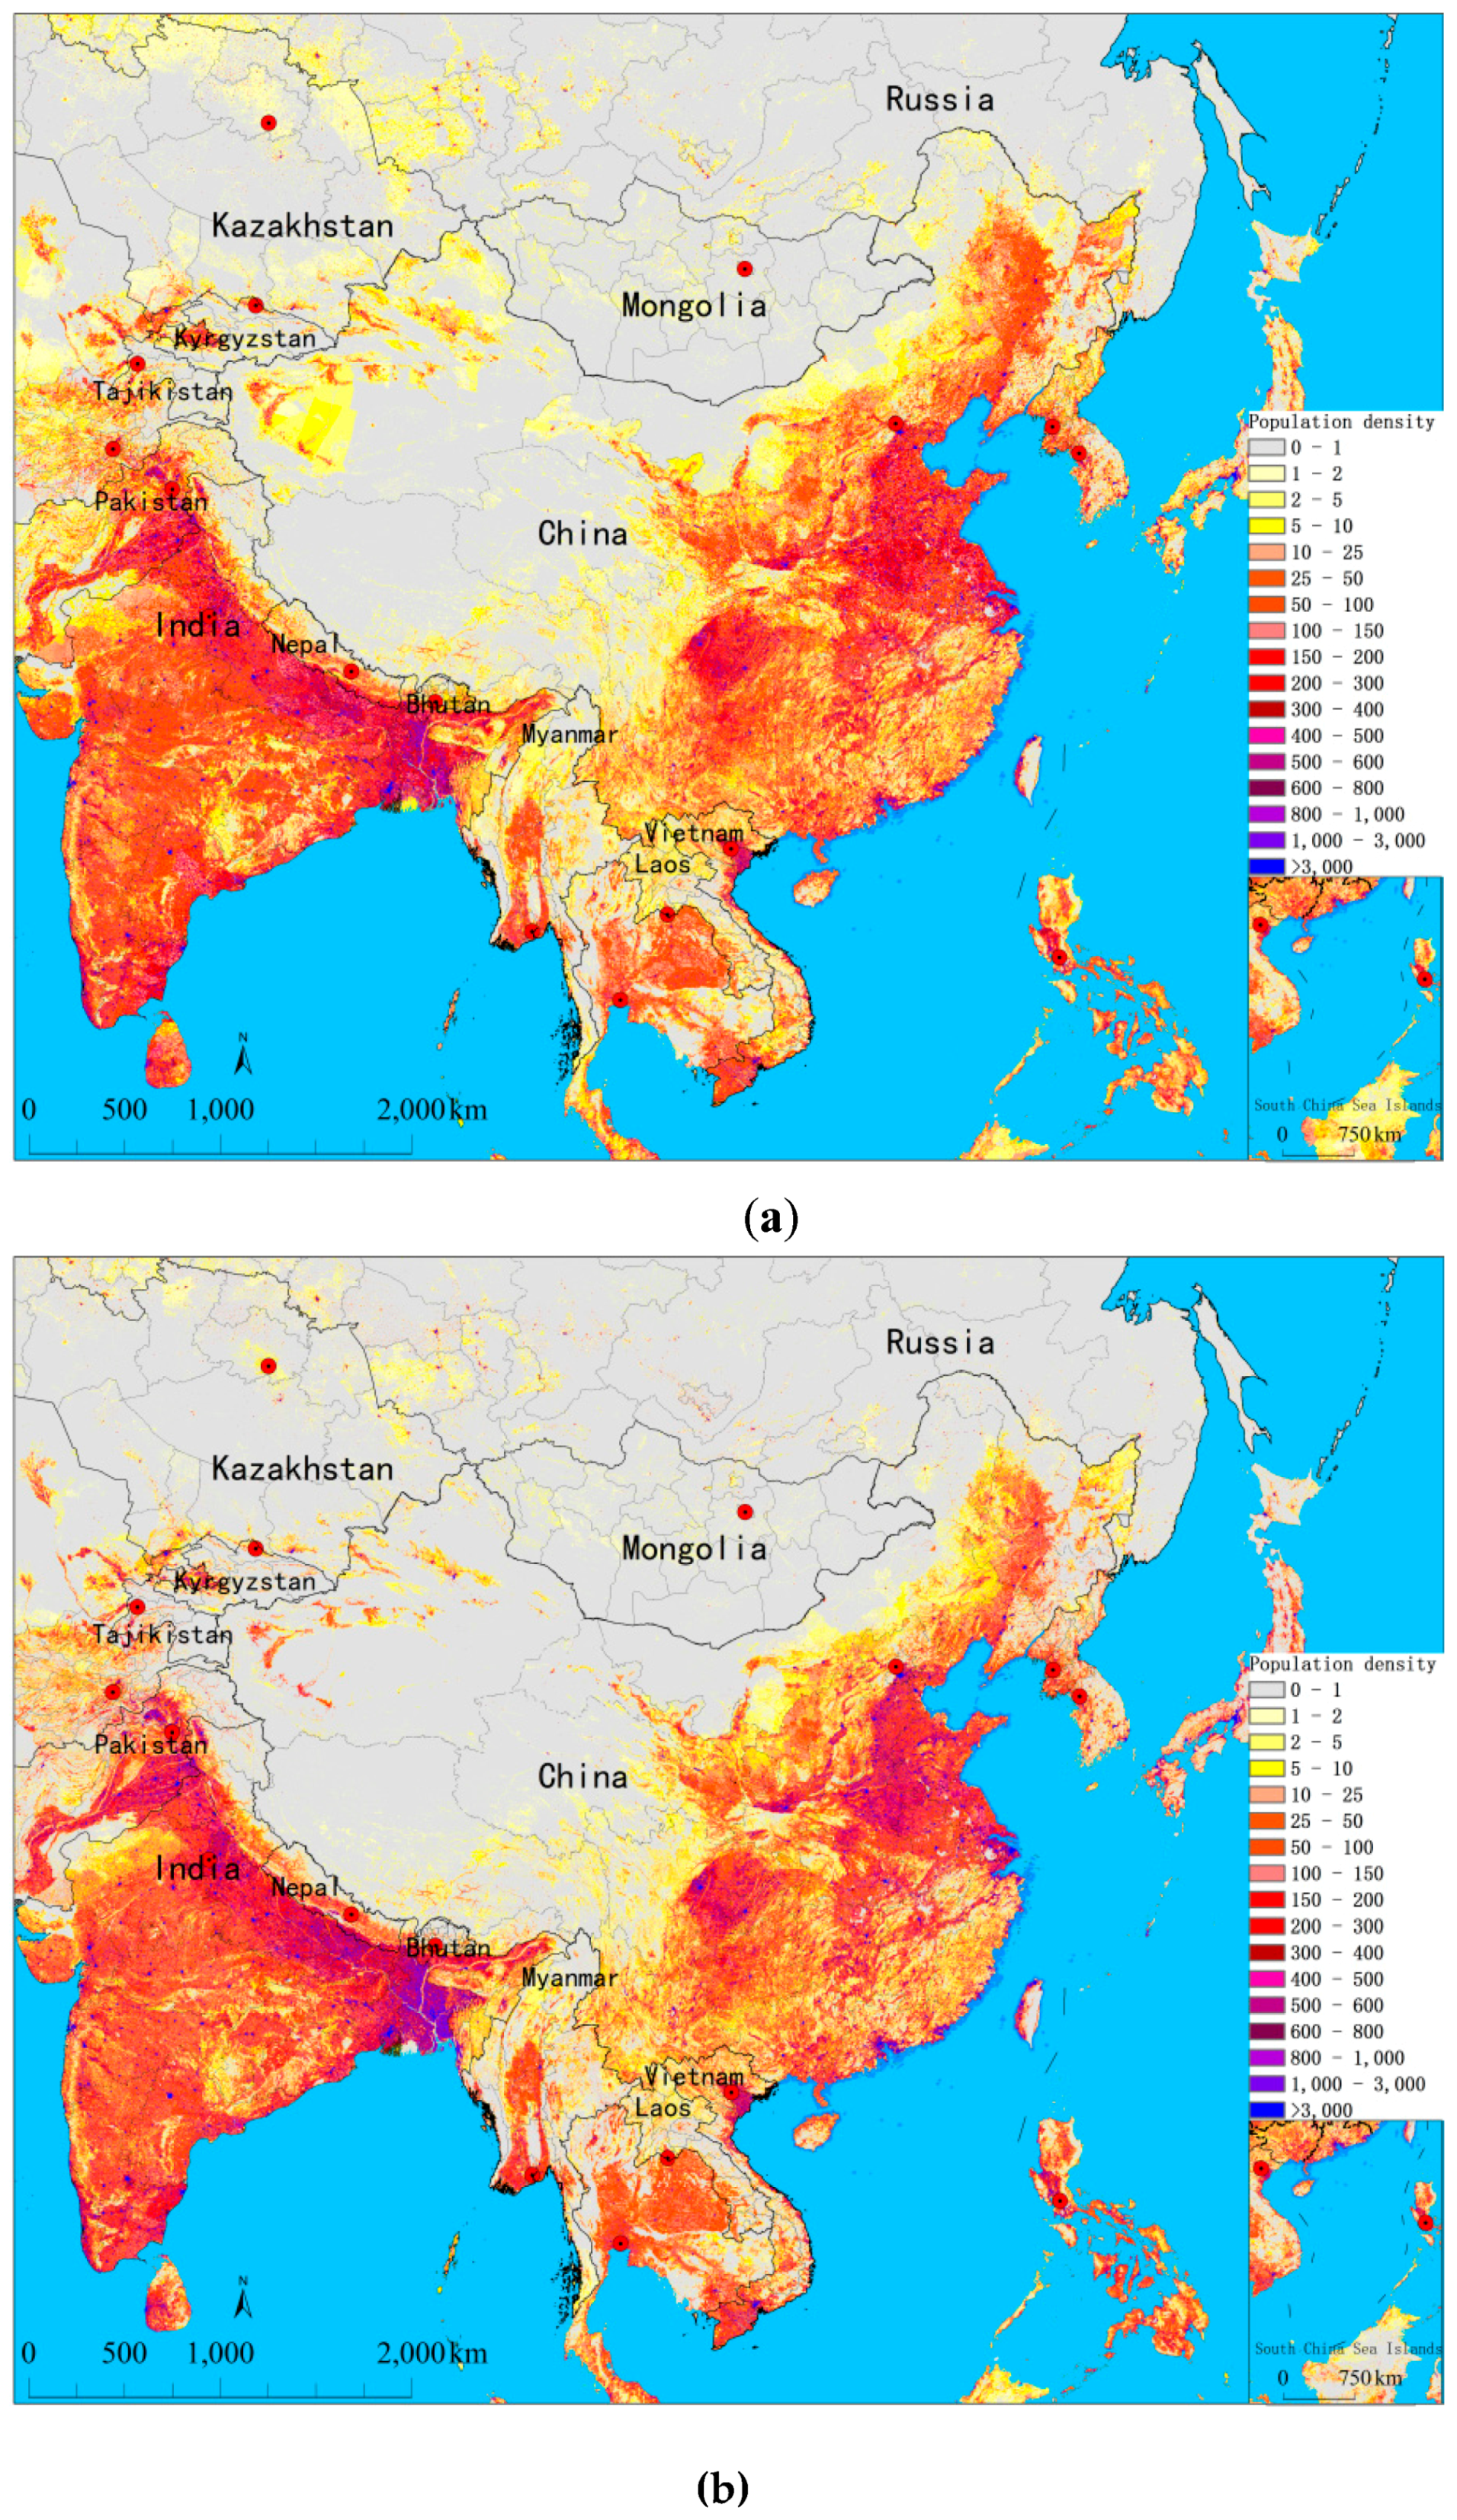
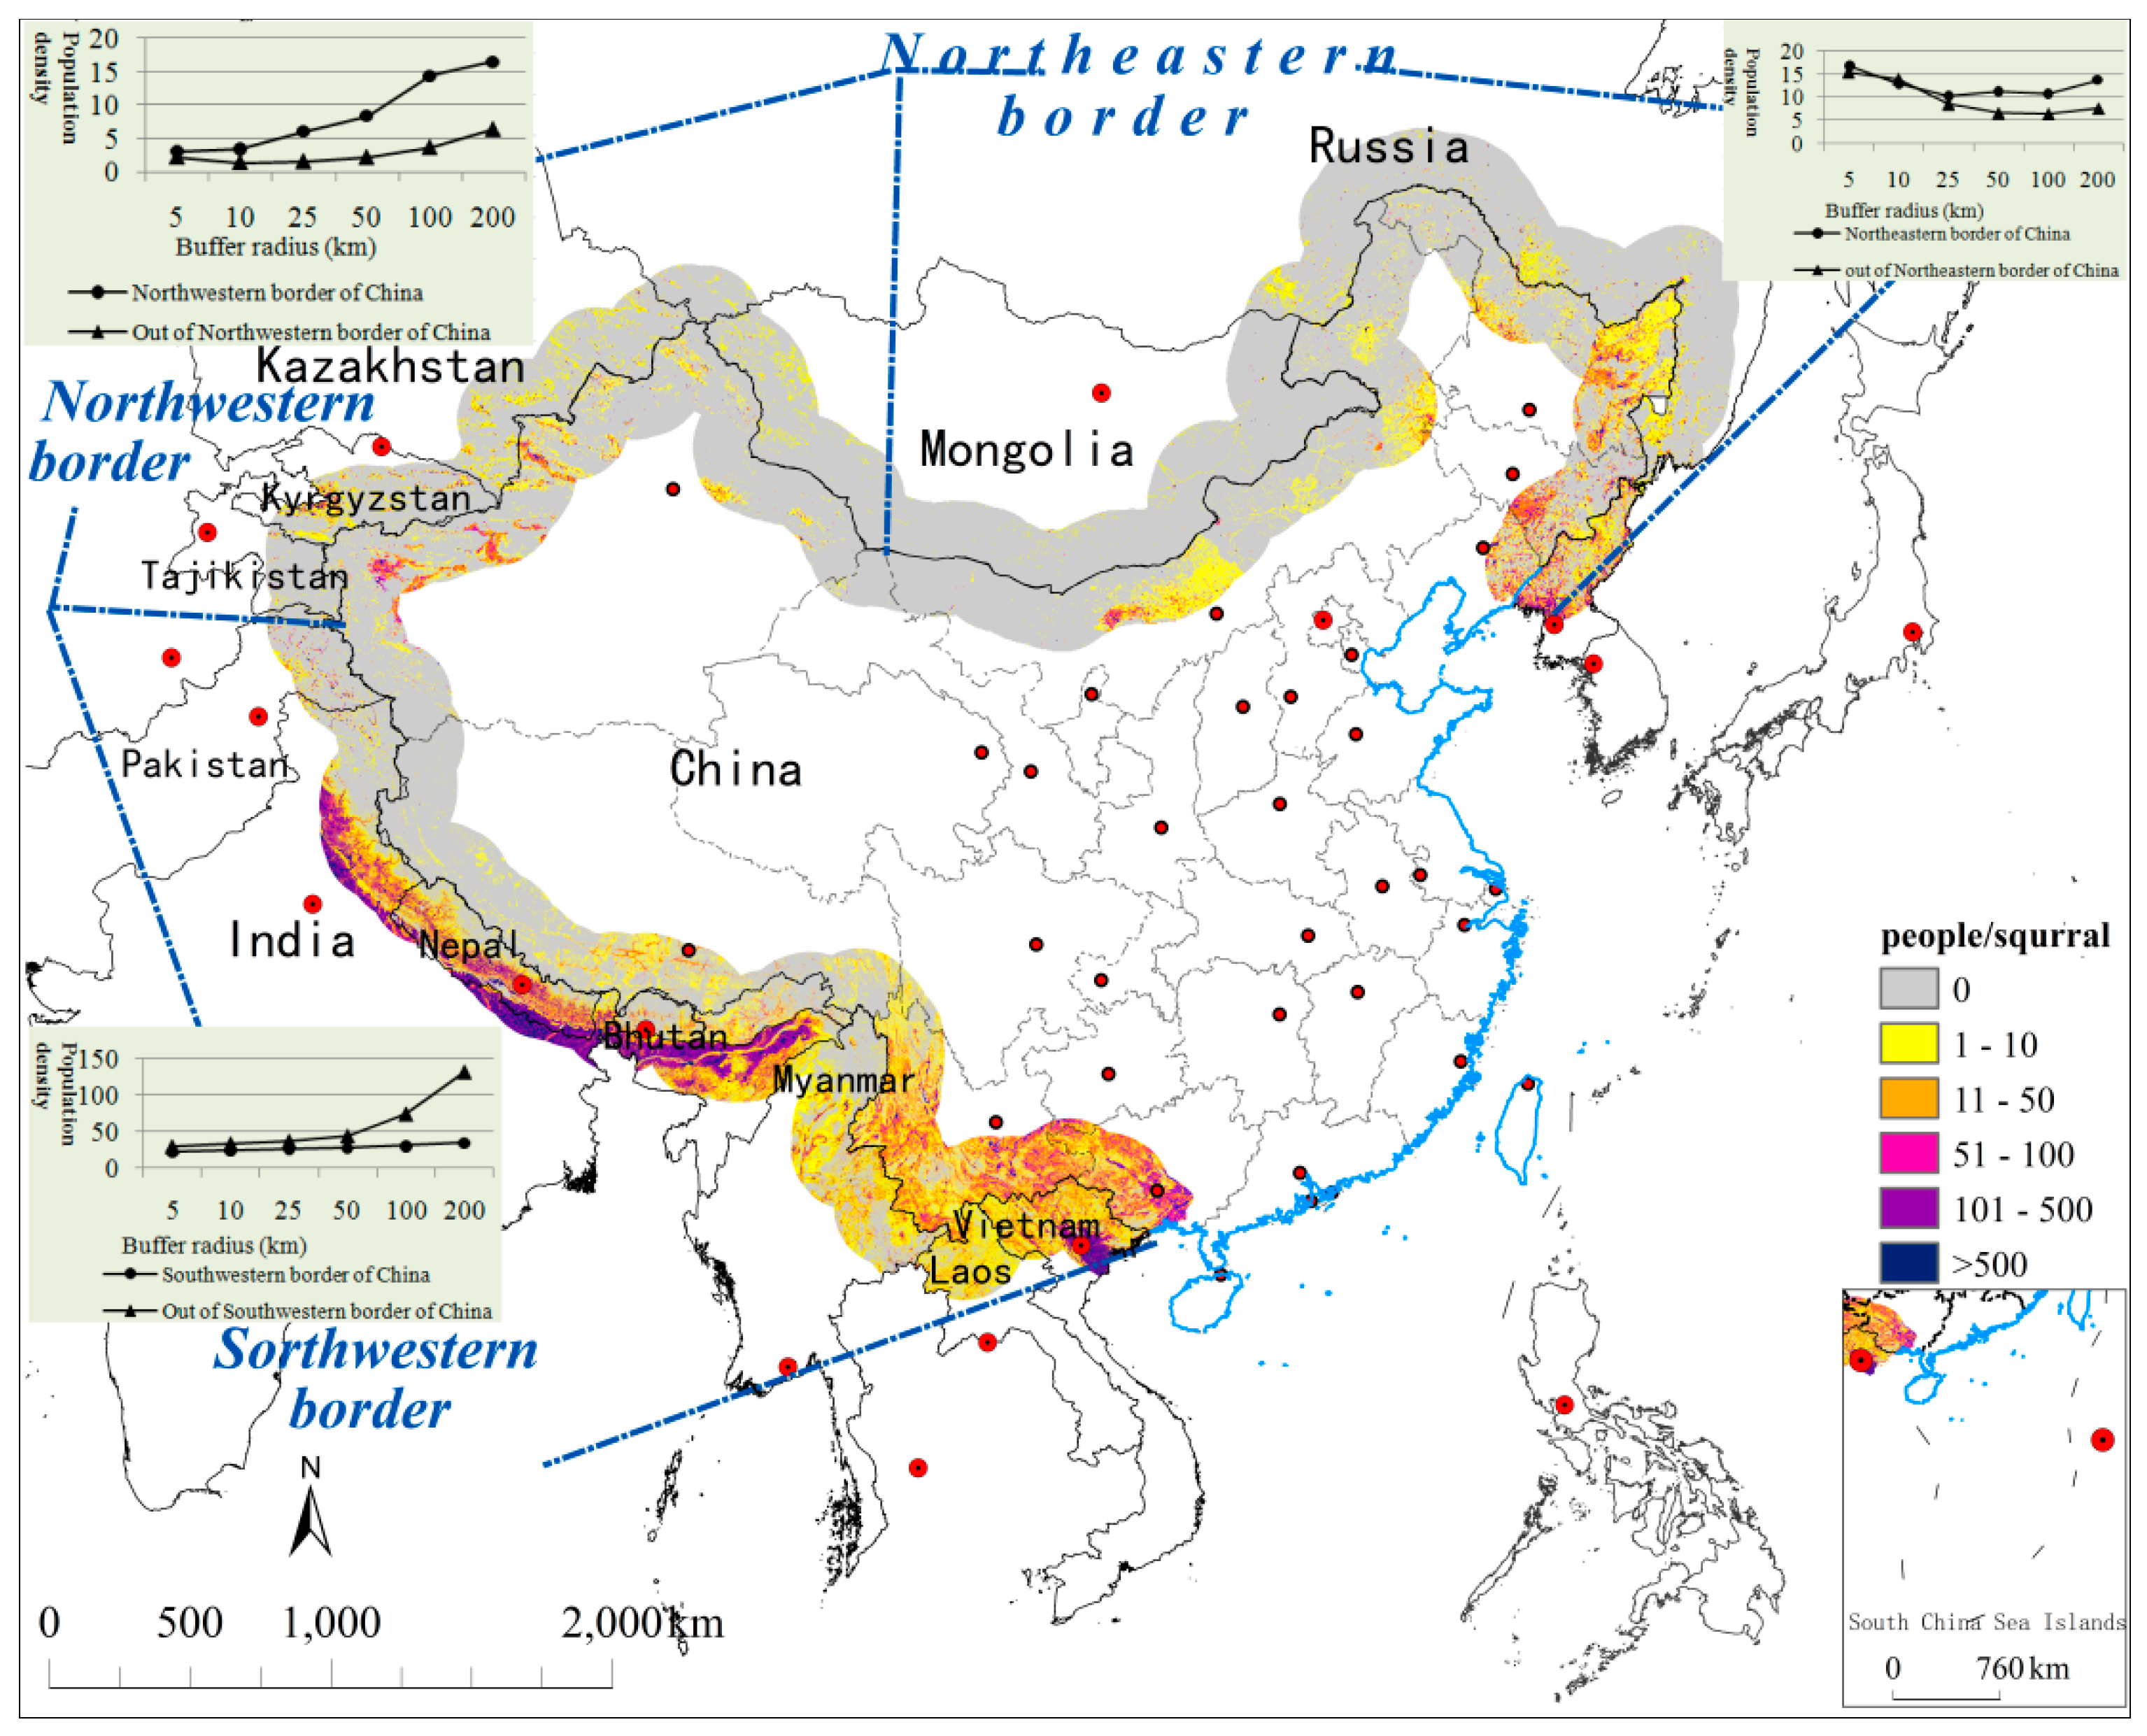
3.1. The Basic Population Distribution in China’s Border Areas

In 2015, the total population in the border areas was 286 million. The total population within China’s borders was 85 million, with a population density of 21 people/km2. The total population outside the borders was 201 million, and the population density was 44 people/km2. Hence, the population density outside the borders was more than double that inside the borders. Figure 2 shows the basic population distribution in different border regions in 2015.
The total population of China’s northeastern border area was 48,382,300, accounting for 16.91% of China’s total border-area population, with a population density of 11 people/km2. The population inside the northeastern border was 30,012,800, accounting for 35.16% of total population inside the Chinese border, with a population density of 14 people/km2. The population outside the northeastern border was 18,369,400, accounting for 9.15% of the total population outside China’s borders, with an average population density of 8 people/km2. On both sides of the northeastern border, the population density decreased with increased distance from the land border line. The population density inside the border was greater than that outside the border. The densely-populated areas inside the northeast border were mainly concentrated in eastern Heilongjiang and southern Jilin. The five densely-populated cities in the Heilongjiang area were Heihe, Jiamusi, Jixi, Shuangyashan, and Mudanjiang. The three densely populated cities in the Jilin area were Tonghua, Baishan, and Liaoyuan. The most densely populated area outside the border was located outside the China–North Korea border. The main cities and counties in this area were Onsong County, Sinhung County, and the city of Hoeryong to the north of Xianyang North Road; Orang-gun County and Myonggan County to the south of Xianyang North Road; and Taehongdan-gun County and Unhuang-gun County to the east of Yanggang-do.
The total population of China’s northwestern border regions was 14,167,500, accounting for 4.95% of the total border-area population, with a population density of 11 people/km2. The population inside the northwestern border was 9,610,000, accounting for 11.26% of the population inside the Chinese border, with a population density of 17 people/km2. The population outside the northwestern border was 4,553,600, accounting for 2.27% of the population outside the Chinese border, with an average population density of 6 people/km2. The population density increased with increased distance from the land border line, and the population density inside the border was greater than that outside the border. Densely populated areas inside the northwestern border were scattered in the Urumqi, Ili, and Aksu regions, with a distance of 100 km from the border line and relatively rich soil and water resources. The population distribution outside the border was extremely sparse.
The total population of China’s southwestern borders areas was 224 million, accounting for 78.14% of China’s total border-area population, with a population density is 84 people/km2. The total population inside the southwestern borders was 45,742,500, accounting for 53.58% of the total population inside China’s border, with a population density of 35 people/km2. The total population outside the southwestern borders was 178 million, accounting for 88.58% of the total population outside China’s borders, with an average population density of 132 people/km2. On both sides of the southwestern borders, the population density increased with increased distance from the land border line, and the population density inside the border was less than that outside the border. In particular, the population density increased rapidly in regions outside the border at more than 50 km from the border line. The densely-populated regions inside the southwestern borders were mainly located in the southern region of Guangxi and the western region of Yunnan. The main cities were Nanning, Fangchenggang, Qinzhou, Yuxi, Dali, Baoshan, and Lijiang, as well as Shigatse and Lhasa in Tibet. Outside the border, the most densely populated areas were the India and Vietnam areas. In the India area, the densely-populated cities and counties included seven counties north of Himachal Pradesh, including Kangra and Shimla, Haridwar and Haldwani in Uttarakhand, and Ambara and Yamunanajiaer in Haryana; four counties in Uttar Pradesh, including Saharanpur and Bijinuoer, and Jalpaiguri and Koch Bihar in Bengal in the east; and 17 counties in Assam, including BaBeita and Banggai Gang. In the Vietnam area, the most densely populated region was the Red River Delta region, including nine provinces and two cities, with population densities of up to 1148 people/km2.

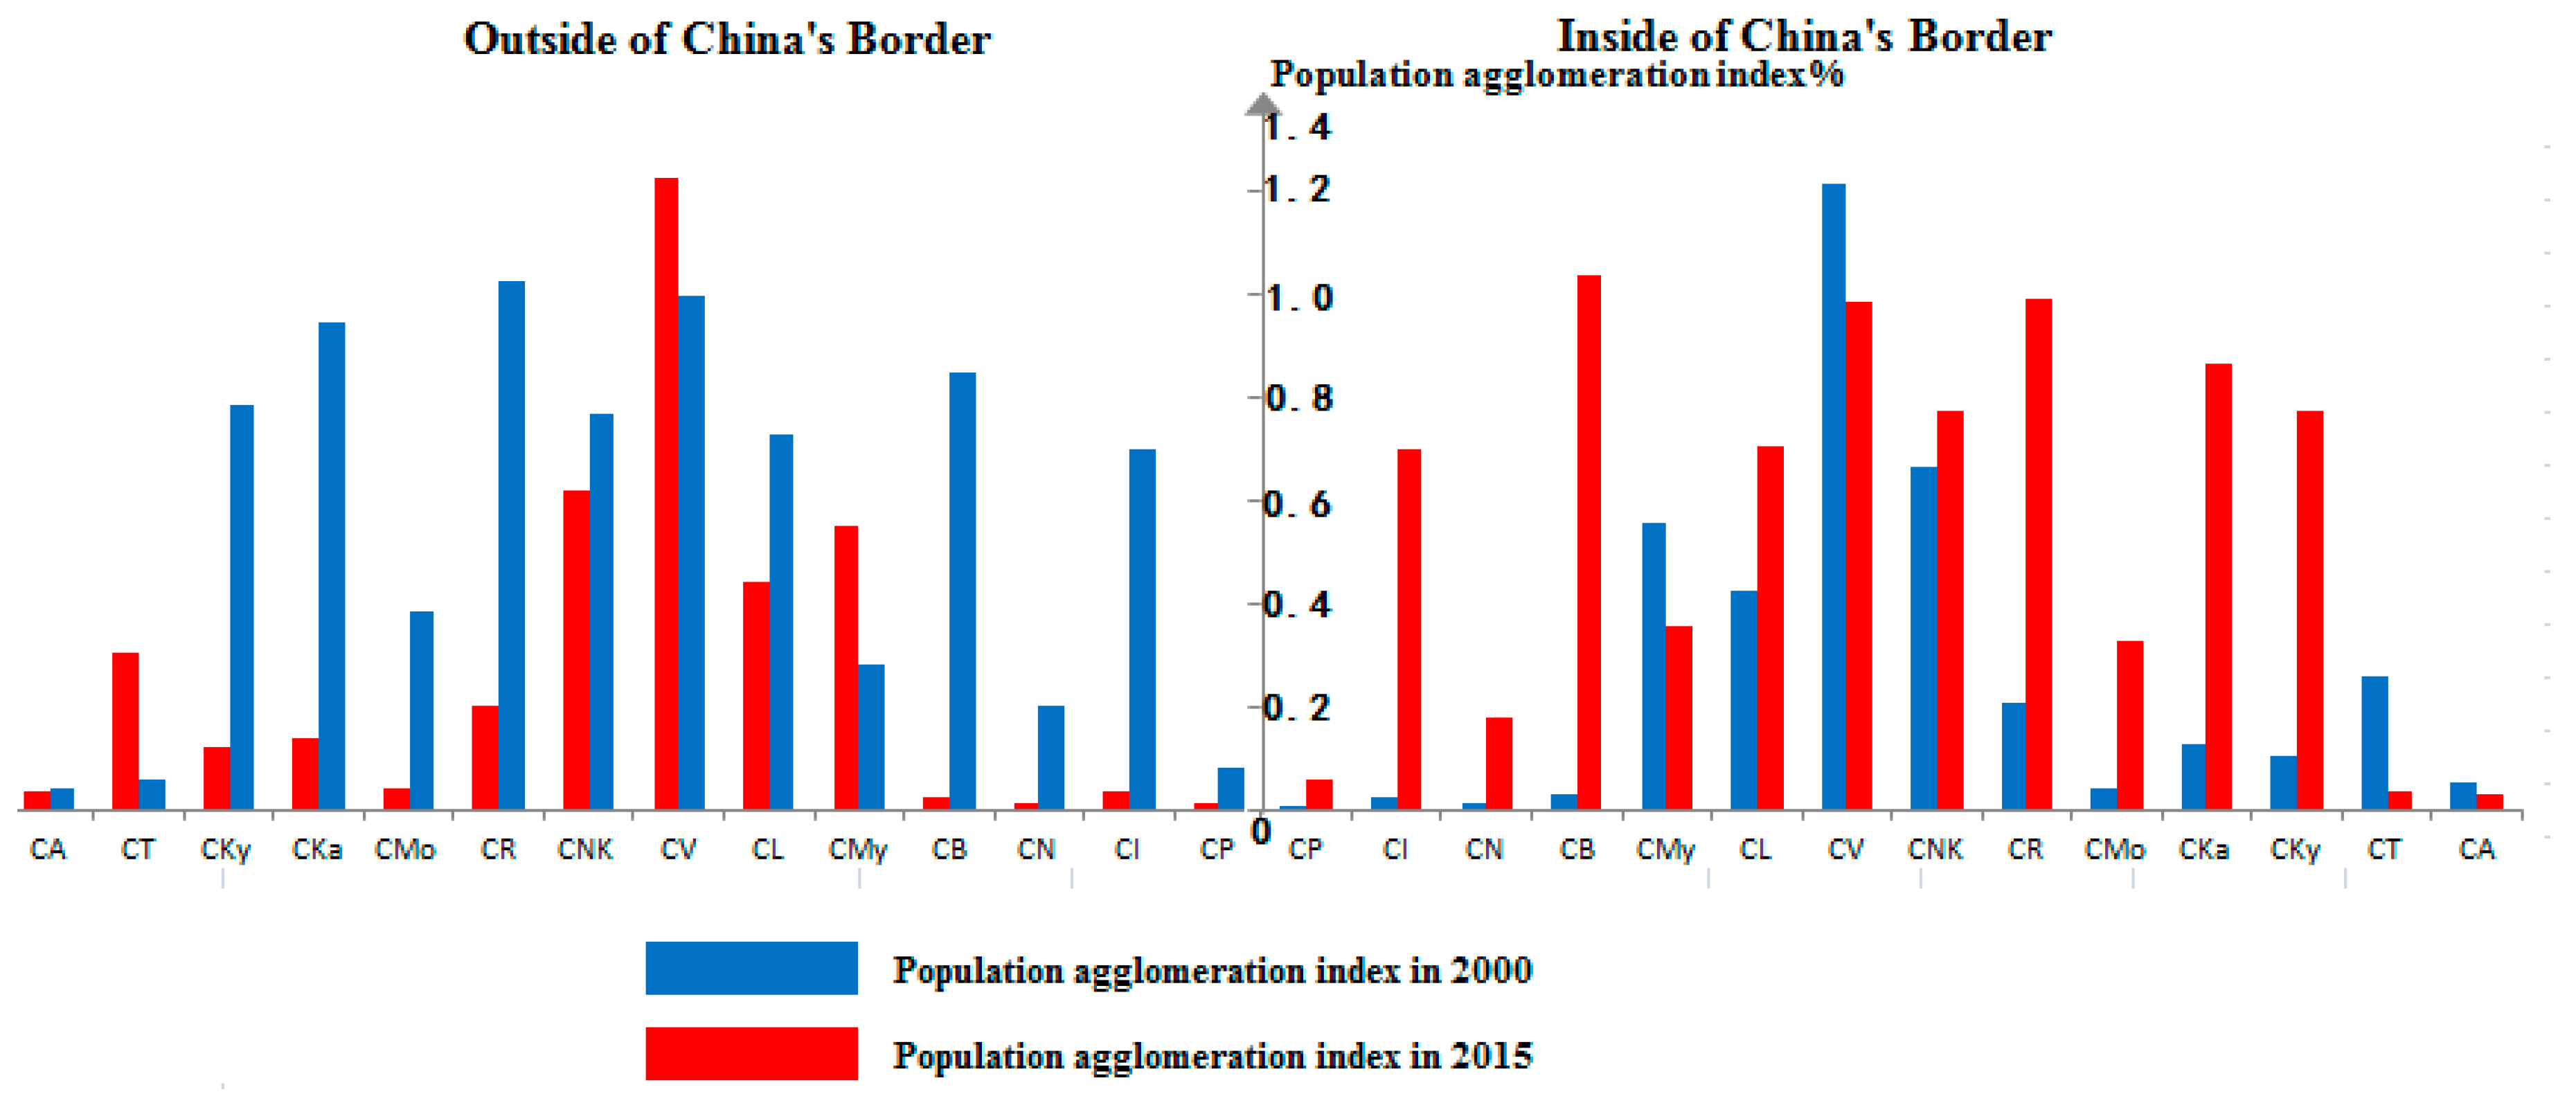
3.2. Comparative Analysis of Population Distribution in China’s Border Areas

Overall, the population agglomeration index inside the Chinese border was lower than that outside the border. Inside the border, the main types were very sparse population areas and extremely sparse areas; outside the border, there were mainly average population density areas. From 2000 to 2015, the overall population agglomeration level declined in the border areas. Figure 3 shows the specific regions.
The population agglomeration types inside the northeastern border were sparse population areas and average population density areas. Inside the border, the China–North Korea border was a below-average population density area, and the China–Russia and China–Mongolia borders were very sparse and extremely sparse areas, respectively. From 2000 to 2015, the population agglomeration levels decreased inside the northeastern borders with three countries. Outside the borders, the China–North Korea and China–Russia border areas were below-average population density areas, and the China–Mongolia border area was a relatively sparse population area. From 2000 to 2015, the population agglomeration levels dropped in the China–Russia and China–Mongolia border areas, but rose slightly in the China–North Korea border area. The changes in population distribution outside the China–North Korea border are noteworthy. Both sides of the China–North Korea border were below-average population density areas, with the populations accounting for 45.54% of the total population of the northeastern border. The population agglomeration index outside the China–North Korea border was higher than that inside the border, and North Korea’s population density was higher than China’s. From 2000 to 2015, the population agglomeration index fell inside the border, but rose outside of it, and the difference in population agglomeration between the inside and outside of the border increased.
The areas inside the northwestern borders with four countries were all sparse population areas. Outside the borders, the China–Kazakhstan and China–Kyrgyzstan border areas were below-average population density areas, and the China–Tajikistan and China–Afghanistan border areas were extremely sparse population areas. From 2000 to 2015, the population agglomeration index increased inside all of the northwestern border areas, and the population agglomeration index outside the northwestern borders decreased.
The population agglomeration types in the southwestern borders areas were sparse population areas and average population density areas. Inside the border, the ratio of the number of countries for the two types was 5:2; outside the border, the ratio was 3:4. From 2000 to 2015, the ratio of the number of countries with rising population agglomeration index to those with falling population agglomeration index was 3:4 on both sides of the southwestern borders. Both sides of the China–Vietnam border were average population density areas. This area is an important channel connecting China to the ASEAN countries. The port economy framework along the China–Vietnam border has developed significantly, effectively driving economic prosperity in China’s border areas. Suitable living environments and prosperous border trade cause the population density in the China–Vietnam border area to be slightly above the national average.

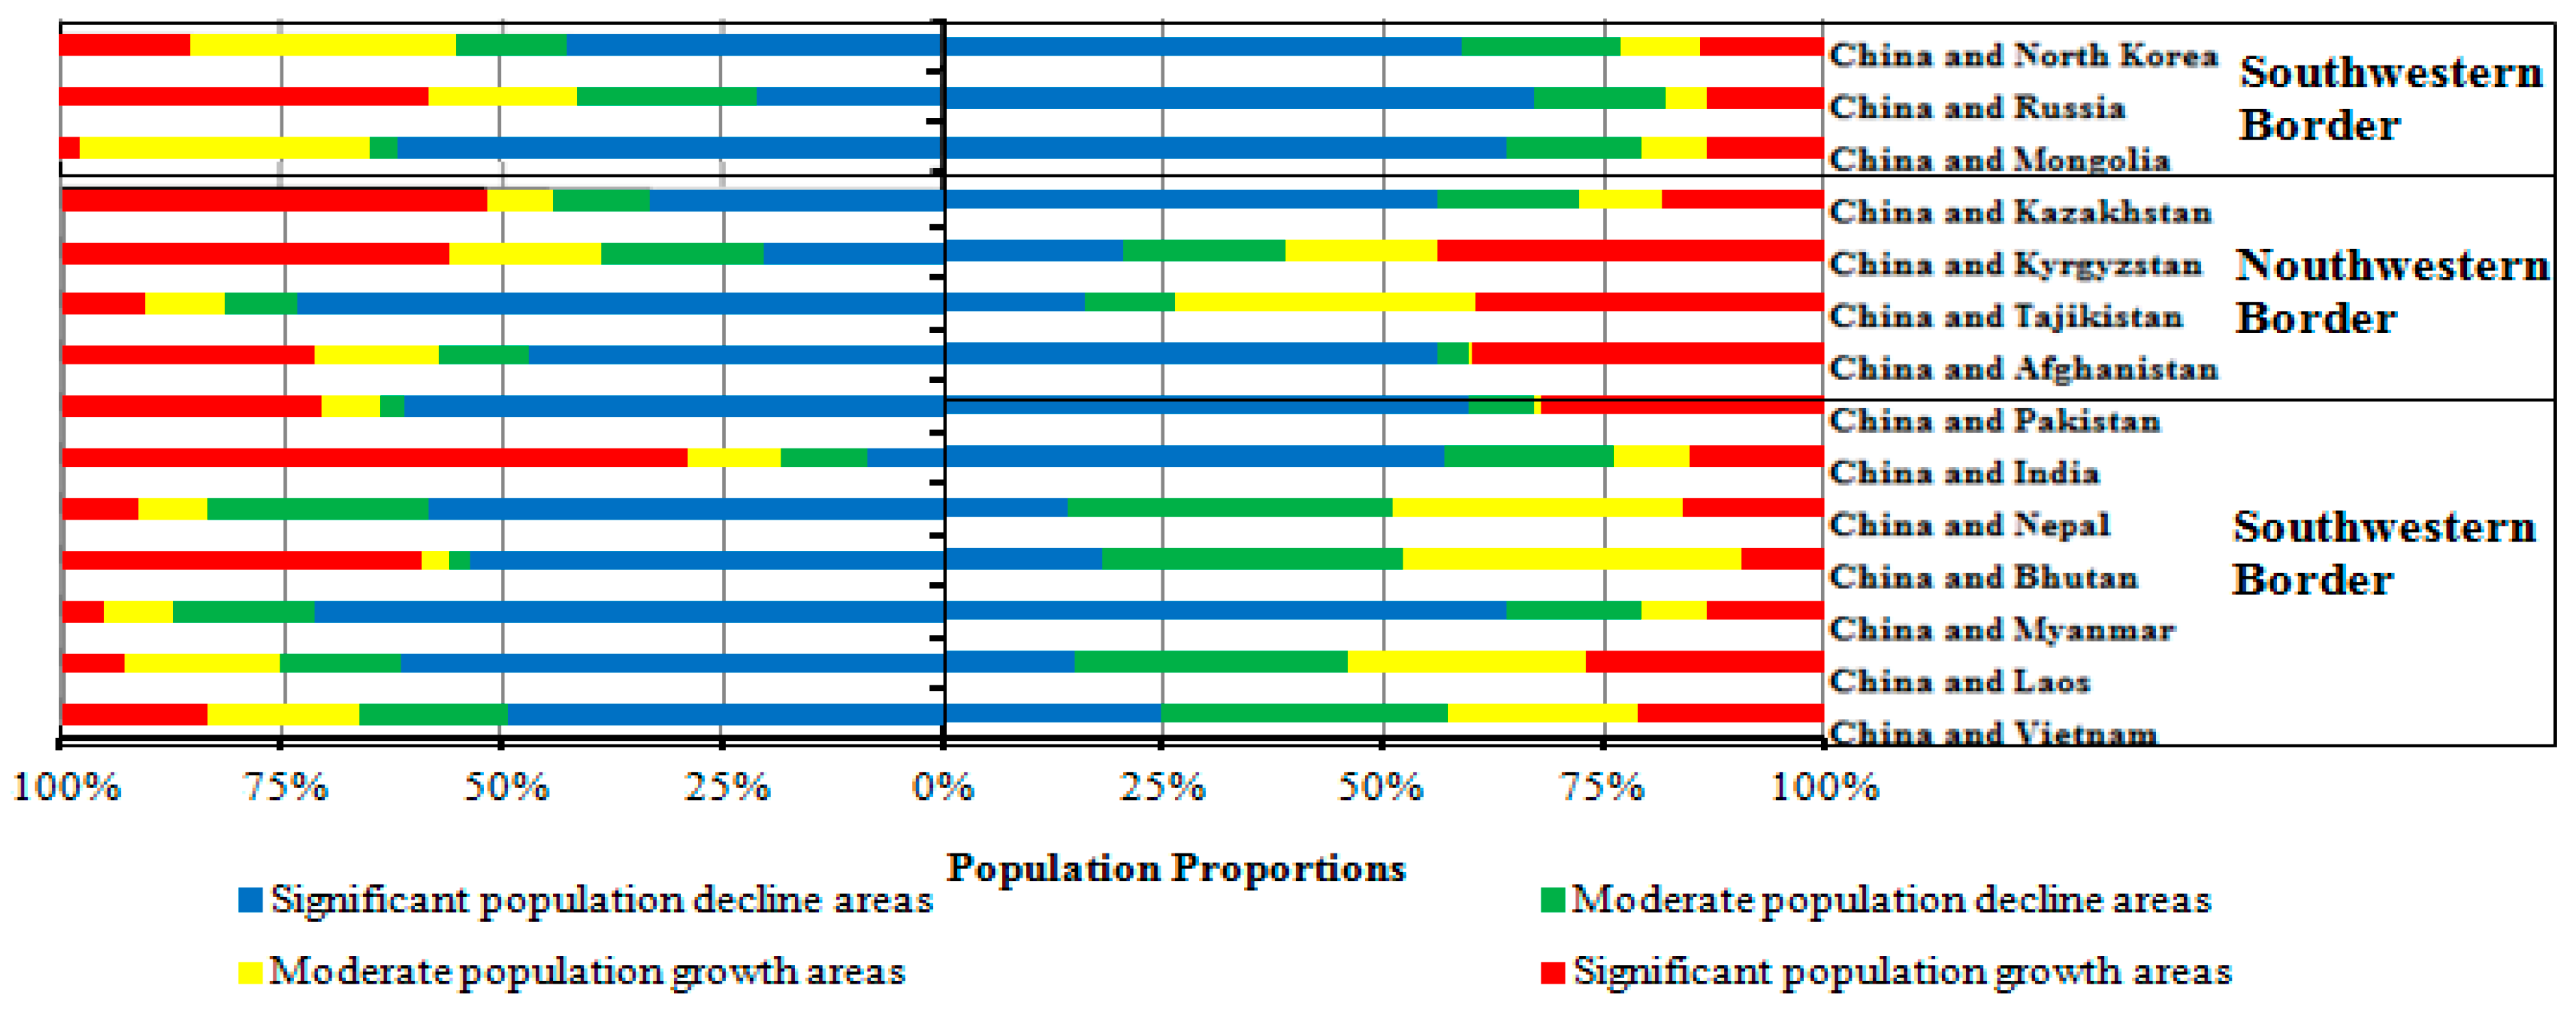
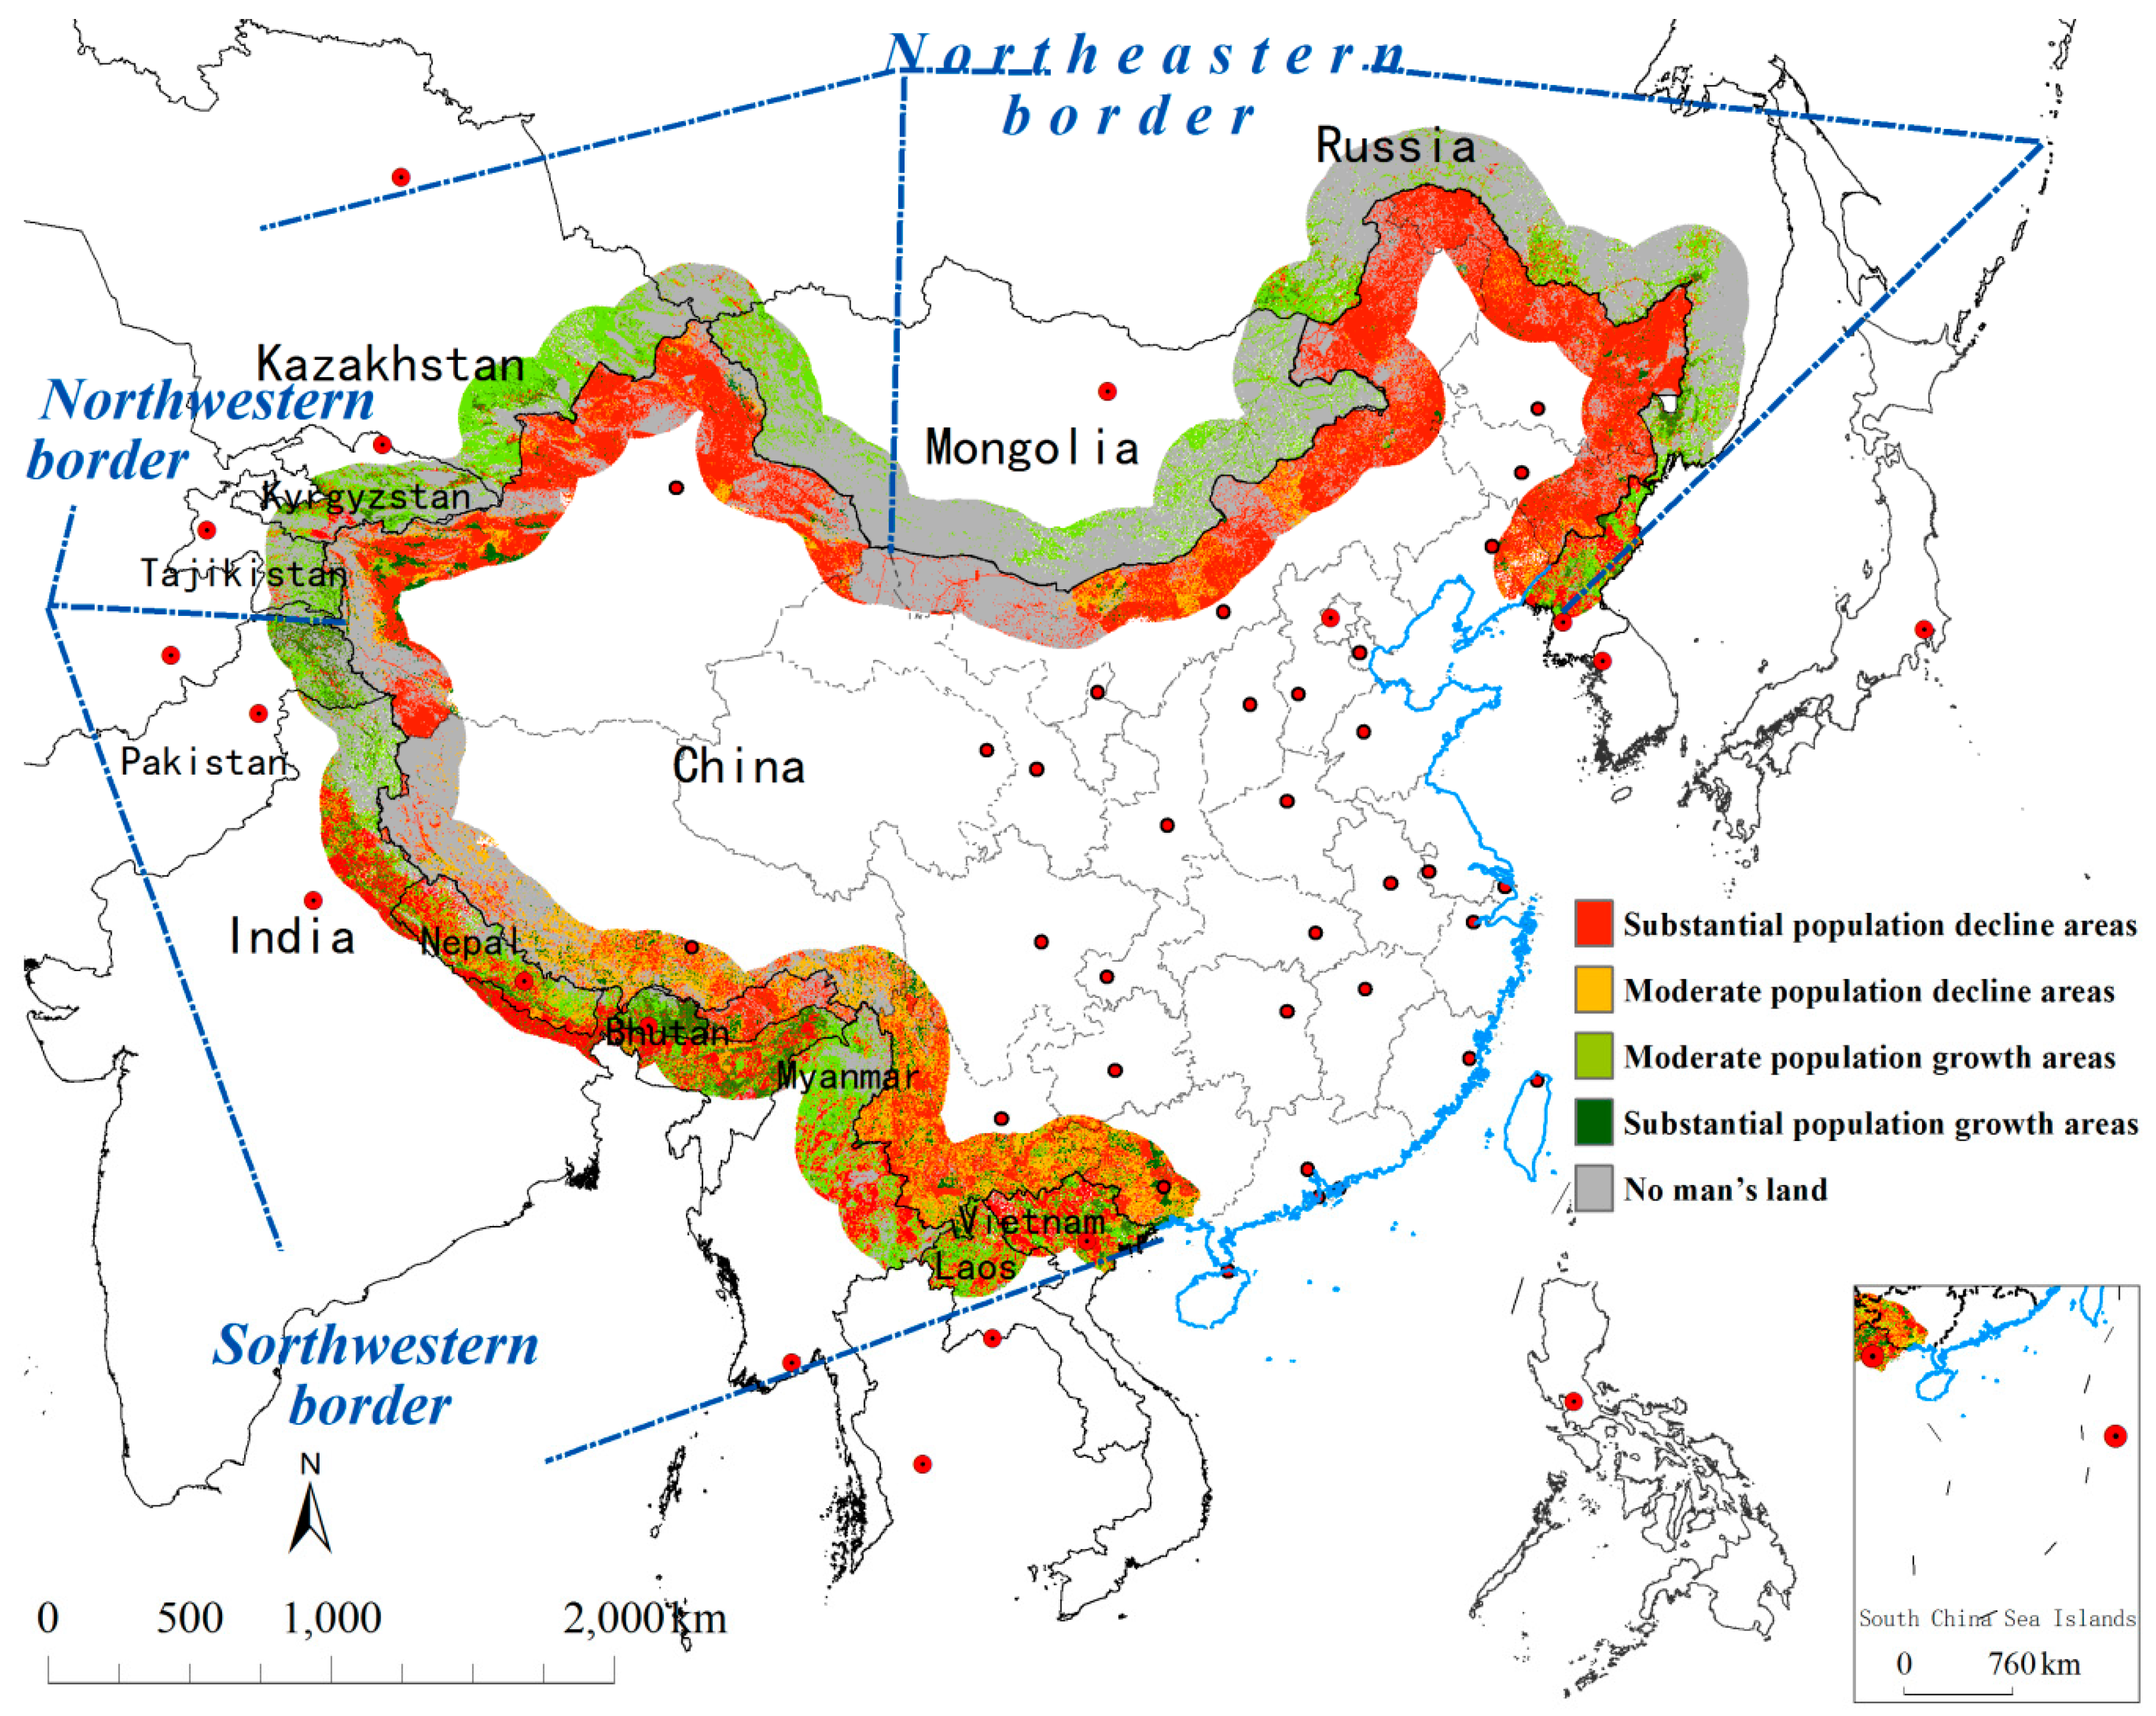
3.3. Geographic Changes in Population Distribution in China’s Border Areas

Driven by globalization, population movement in the border areas has become more frequent, and the population has been changing more rapidly. Between 2000 and 2015, there was a net increase of 42,293,500 people in the border regions; this includes 6,864,600 people inside the borders and 35,429,000 people outside the borders. Inside the borders, the population has increased in 13.90% of the areas, accounting for 64.17% of the population. Outside the borders, 18.13% of the areas have seen increases in population, accounting for 76.63% of the population. Figure 4 and Figure 5, and Table 1 show the demographic changes in different regions in the border areas.
In the northeastern border, the ratio of the population in the population growth areas to the population in the population decline areas was 3:2. Specifically, inside the borders, the population in the population growth areas accounted for 57.43% of the total population inside the border areas. The population in the areas with substantial population growth inside the northeastern borders with three countries accounted for about one-third. Inside the borders, the population in the population decline areas was 42.57% of the total population inside the borders. In particular, the population in the substantial population decline areas inside the northeastern borders with three countries was about 39.66% of the total population inside the northeastern borders. Outside the borders, the population in the population growth areas accounted for 58.51% of the total population outside the borders. The population in the substantial growth areas outside the China–North Korea and China–Mongolia borders had a larger proportion, with 56% of the total population outside the border areas. Outside the borders, the population in the decline areas was 41.49% of the total population outside the borders. The population in the substantial decline areas outside the China–North Korea border had a larger proportion of 42.05%. In terms of distribution, the population decline areas were largely located inside the northeastern border. The areas with substantial population growth were scattered among trade cities like Qitaihe, Ulanhot, and Tumen. Most areas outside the China–Mongolia and China–Russia borders were no man’s lands. The China–North Korea border areas were mainly population growth areas. Counties with substantial population growth included Samjiyon County, Pukchong County, and Kwaksan County.
In China’s northwestern border areas, the ratio of the population in the population growth areas to the population in the population decline areas was 6:5. Specifically, inside the borders, the population in the population growth areas accounted for nearly 80% of the total population inside the borders and increased slightly from 2000 to 2015. Most of the population was distributed in relative growth areas. The population in the population decline areas accounted for nearly 20% of the total population inside the borders, and most of the population was distributed in the substantial growth areas. Outside the borders, the population in the population growth areas accounted for nearly 60% of the total population outside the borders, and most of the population was distributed in the areas with substantial population growth. The substantial growth areas on the China–Tajikistan border comprised 80.92% of the total area on that border. The population in the population decline areas accounted for nearly 40% of the total population outside the borders, and the substantial decline areas accounted for 35.03%. In terms of distribution, no man’s land covered half of the northwestern borders. Substantial population growth areas inside the northwestern borders were scattered around the trade cities of Aksu and Kashi to the west of Xinjiang; substantial population growth areas outside the northwestern borders were scattered around the trade cities of Osh in Kyrgyzstan and Karasu in Tajikistan.
In China’s southwestern border regions, the ratio of the population in the population growth areas to the population in the population decline areas was approximately 4:1. Specifically, inside the borders, the population in the population growth areas accounted for two-thirds of the total population inside the borders, and most of the population was distributed in relative growth areas. The China–Pakistan and China–India borders were the only areas where the populations of the substantial population growth areas accounted for more than half of the total population. The population in the population decline areas accounted for one-third of the total population inside the borders. With the exception of the population of the China–Pakistan border, where less than 2% of the population was distributed in population decline areas, most of the population was distributed in the substantial decline areas. Outside the borders, the population in the population growth areas accounted for 80.72% of the total population outside the borders, and the population in substantial growth area accounted for 79.58%. Especially on the China–Vietnam border, the population of the substantial growth areas accounted for as much as 93.76%. The population in the population decline areas accounted for 19.28% of the total population outside the borders, and most of the population was distributed in the areas with substantial population decline. In terms of distribution, inside the southwestern borders, the northern Tibet section was mainly no man’s land, and the southern section mainly comprised stable population areas. Population growth areas were scattered in southern Yunnan. Prosperous border trade in Ruili, Mohan, Hekou, Jinghong, and Tengchong propelled rapid population growth in the 15-year period from 2000 to 2015 in trade cities along the Yunnan border. Outside the southwestern borders, the areas west of the China–India border were mainly characterized by population growth. In particular, substantial population growth occurred in the foreign regions on The China–Nepal border, the western section of China–India border, and large areas of China–Vietnam border.

4. Discussion

In this study, we investigated the population distribution in China’s border regions between 2000 and 2015. We used China’s land border areas as the study area, with population density, population agglomeration index, and relative population change as the indicators. We comparatively analyzed the basic population distribution in different areas inside and outside China’s borders, the population distributions among different countries, and the geographic changes in population distribution. The main findings are summarized as follows:
(1) China’s border regions have a very low population agglomeration level. Inside the borders, the main types of areas are very sparse and extremely sparse population areas; outside the borders, there are mainly average population density areas. Compared with 2000, the index of population agglomeration in 2015 was characterized mainly by population enhancement inside the borders and weakening outside of the main features, such as cities. Population increase is the main characteristic of the demographic changes in the border regions.
(2) The basic patterns of population distribution in the border regions are sparsity in the north and density in the south. The southwestern borders are the main agglomeration areas, accounting for 78.14% of China’s total border-area population, with a population density of 84 people/km2. The northeastern and northwestern borders account for 16.91% and 4.95% of China’s total border-area population, with population densities of 11 people/km2. The northeastern borders consist mainly of sparse population areas. Due to the difficult natural conditions—such as climate, land cover, and hydrology—the northeastern borders’ economic and social development is limited. The southwestern and northeastern borders both have several average population density areas, including some key towns with good socioeconomic development inside and outside the borders, which can attract a healthy-sized population. Influenced by China’s supportive policy of the development of the border areas, the population of key trade cities enjoyed a substantial rise from 2000 to 2015. However, it is noteworthy that there were also many population reduction areas along the northeastern borders, especially in the China–North Korea border areas.
Overall, our findings showed that the population distribution in those areas is extremely uneven. The stability and development of China’s border areas is undoubtedly based on the stability and development of the population. Therefore, effective measures should be taken to guide proper population distribution and maintain the sustainable development of border-area populations [31].
(1) Although the index of population agglomeration and the population size inside China’s border areas have increased over the last 15 years, the population density inside China’s border areas is far below China’s average population density. We propose that the Chinese government introduce supporting policies for the development of border regions to maintain the population size. The “dot-axis” strategy should be promoted in the border areas, and infrastructure (especially transportation infrastructure) should be vigorously developed on both sides of the borders. Social welfare and social security in those areas should also be improved to ensure that local residents can live comfortably. Where necessary, policies should be established to limit population outflow and encourage population inflow. Preferential policies for people and enterprises interested in living and developing in the border areas should be provided to attract population and industries to the border areas.
(2) By fully accounting for the living suitability of the natural environment and limitations in water and land resources in the northeastern, northwestern, and southwestern borders, “moderate agglomeration” and “moderate evacuation” of the population development strategy needs to be implemented in specified areas. Our analysis showed that the population around the southwestern borders is relatively dense; we suggest guiding the population to decrease its density in areas where the population carrying capacity is low and living environment is poor (“moderate evacuation”). Meanwhile, the populations around the northwestern and northeastern borders are relatively sparse; we suggest guiding the population to move to the key towns where the natural environment is suitable and the water and soil resources are good (“moderate agglomeration”). Additionally, the reasons for the population decline in the northeastern borders should be analyzed, and tilt policies such as investment increase, eco-compensation, and environment improvement should be implemented to spur the social and economic development of these areas and to improve the local ecological environment, so that a certain population size can be maintained to prevent excessive population reduction caused by social problems.

5. Conclusions

The study of regional features and national differences in population distribution in China’s border regions over the last 15 years showed that the population density inside China’s border areas is far below China’s average population density, the population of China’s northwestern border has been sparse, while the northeast and southwest borders are able to gather a certain number of people, but the northeastern regions have seen a substantial reduction in population size since 2000. So we propose that the Chinese government introduce supporting policies for the development of border regions to maintain the population size, “moderate agglomeration” and “moderate evacuation” population development strategies should be implemented in specified areas, in addition the areas of rapid population decline should be of special concern.

Acknowledgments

This study was funded by the National Natural Science Foundation “Study of developmental path for border cities in China based on SWOT quantitative model” (41401662) and “Quantitative analysis and digital simulation of the balanced relationship between utilization of water and land resources and food production in China” (41430861), Science and technology foundation project, No. 2011FY110400.

Author Contributions

Zhiming Feng and Yalin Lei conceived and designed the experiments; Zhen You performed the experiments; Zhen You and Yanzhao Yang analyzed the data; Zhen You and Fangzhou Li contributed reagents/materials/analysis tools; Zhen You and Fangzhou Li wrote the paper.

Conflicts of Interest

The authors declare there is no conflict of interest regarding the publication of this paper.

References

  1. Wong, W.C.; Wang, Y.L. A qualitative study on HIV risk behaviors and medical needs of sex workers in a China/Myanmar border town. AIDS Patient Care STDs 2003, 17, 417–422. [Google Scholar] [CrossRef] [PubMed] [Green Version]
  2. Shneiderman, S.B. Himalayan border citizens: Sovereignty and mobility in the Nepal–Tibetan Autonomous Region (TAR) of China border zone. Political Geogr. 2013, 35, 25–36. [Google Scholar] [CrossRef]
  3. Des Jarlais, D.C.; Kling, R.; Hammett, T.M.; Ngu, D.; Liu, W.; Chen, Y.; Binh, K.T.; Friedmann, P. Reducing HIV infection among new injecting drug users in the China-Vietnam Cross Border Project. AIDS 2007, 21, 109–114. [Google Scholar] [CrossRef] [PubMed]
  4. Liu, X.; Jiang, L.; Feng, Z.; Li, P. Rubber Plantation Expansion Related Land Use Change along the Laos-China Border Region. Sustainability 2016, 8, 1011. [Google Scholar] [CrossRef]
  5. Chanhda, H.; Wu, C.F.; Ye, Y.M.; Ayumi, Y. GIS based land suitability assessment along Laos-China border. J. For. Res. 2010, 21, 343–349. [Google Scholar] [CrossRef]
  6. Socquet, A.; Pubellier, M. Cenozoic deformation in western Yunnan (China-Myanmar border). J. Asian Earth Sci. 2005, 24, 495–515. [Google Scholar] [CrossRef]
  7. Meng, Q.R.; Hu, J.M.; Jin, J.Q.; Zhang, Y.; Xu, D.F. Tectonics of the late Mesozoic wide extensional basin system in the China-Mongolia border region. Basin Res. 2003, 15, 397–415. [Google Scholar] [CrossRef]
  8. Wang, T.; Zheng, Y.; Li, T.; Gao, Y. Mesozoic granitic magmatism in extensional tectonics near the Mongolian border in China and its implications for crustal growth. J. Asian Earth Sci. 2004, 23, 715–729. [Google Scholar] [CrossRef]
  9. Feng, Z.; Liu, X.; Jiang, L.; Li, P. Spatial-temporal analysis of rubber plantation and its relationship with topographical factors in the border region of China, Laos and Myanmar. Acta Geogr. Sin. 2013, 68, 1432–1446. [Google Scholar]
  10. You, Z.; Yang, Y.; Jiang, L.; Feng, Z.; Zhang, J. The study on the relief degree of land surface in the Lancang-Mekong River Basin. J. Yunan Univ. 2012, 34, 393–400. (In Chinese) [Google Scholar]
  11. Iwashita, A. The influence of local Russian intiatives on relations with China: Border demarcation and regional partnership. Acta Slavica Iaponica 2002, 19, 1–18. [Google Scholar]
  12. Luân, V.Đ. Contested Sovereignty: Local Politics and State Power in Territorial Conflicts on the Vietnam-China Border, 1650s–1880s. Cross Curr. East Asian Hist. Cult. Rev. 2016, 5, 497–533. [Google Scholar] [CrossRef]
  13. Xiaosong, G.; Womack, B. Border cooperation between China and Vietnam in the 1990s. Asian Surv. 2000, 40, 1042–1058. [Google Scholar] [CrossRef]
  14. Womack, B. China’s border trade and its relationship to the national political economy. Am. Asian Rev. 2001, 19, 31–48. [Google Scholar]
  15. Nijman, V.; Shepherd, C.R.; Nekaris, A.I. Trade in Bengal Slow Lorises in Mong La, Myanmar, on the China Border. Prim. Conserv. 2014, 28, 139–142. [Google Scholar] [CrossRef]
  16. Schoenberger, L.; Turner, S. Negotiating remote borderland access: Small-scale trade on the Vietnam-China border. Dev. Chang. 2008, 39, 667–696. [Google Scholar] [CrossRef]
  17. Nijman, V.; Shepherd, C.R. Emergence of Mong La on the Myanmar-China border as a global hub for the international trade in ivory and elephant parts. Biol. Conserv. 2014, 179, 17–22. [Google Scholar] [CrossRef]
  18. Alff, H. Getting stuck within flows: Limited interaction and peripheralization at the Kazakhstan–China border. Cent. Asian Surv. 2016, 35, 369–386. [Google Scholar] [CrossRef]
  19. Newman, D.; Paasi, A. Fences and Neighbours in the Postmodern World: Boundary Narratives in Political Geography. Prog. Hum. Geogr. 1998, 22, 186–207. [Google Scholar] [CrossRef]
  20. Zhou, X.; Li, S.; Wang, J.; Huang, J.; Zhou, H.; Chen, J.; Zhou, X. Emergence of human babesiosis along the border of China with Myanmar: Detection by PCR and confirmation by sequencing. Emerg. Microbes Infect. 2014, 3, e55. [Google Scholar] [CrossRef] [PubMed]
  21. Kato, K.; Kusagawa, S.; Motomura, K.; Yang, R.; Shiino, T.; Nohtomi, K.; Sato, H.; Shibamura, K.; Hien, N.T.; Chi, P.K.; et al. Closely related HIV-1 CRF01_AE variant among injecting drug users in northern Vietnam: Evidence of HIV spread across the Vietnam-China border. AIDS Res. Hum. Retrovir. 2001, 17, 113–123. [Google Scholar] [CrossRef] [PubMed]
  22. Hill, A.M. Border Landscapes: The politics of Akha land use in China and Thailand. China Rev. Int. 2007, 14, 554–557. [Google Scholar] [CrossRef]
  23. Endres, K.W. Making Law: Small-scale trade and corrupt exceptions at the Vietnam-China border. Am. Anthropol. 2014, 116, 611–625. [Google Scholar] [CrossRef]
  24. Hammett, T.M.; Johnston, P.; Kling, R.; Liu, W.; Ngu, D.; Tung, N.D.; Binh, K.T.; Dong, H.V.; Hoang, T.V.; Van, L.K.; et al. Correlates of HIV status among injection drug users in a border region of southern China and northern Vietnam. J. Acquir. Immune Defic. Syndr. 2005, 38, 228–235. [Google Scholar] [CrossRef] [PubMed]
  25. Wang, R.; Dong, J.; Xia, Z.; Tao, C.; Zhang, Q.; Zhang, Y.; Tian, Y.; Sun, X.; Zhang, G.; Li, Q.; et al. Lessons on malaria control in the ethnic minority regions in Northern Myanmar along the China border, 2007–2014. Infect. Dis. Poverty 2016, 5, 95. [Google Scholar] [CrossRef] [PubMed]
  26. Lo, E.; Nguyen, J.; Oo, W.; Hemming-Schroeder, E.; Zhou, G.; Yang, Z.; Cui, L.; Yan, G. Examining Plasmodium falciparum and P. vivax clearance subsequent to antimalarial drug treatment in the Myanmar-China border area based on quantitative real-time polymerase chain reaction. BMC Infect. Dis. 2016, 16, 1–12. [Google Scholar] [CrossRef] [PubMed]
  27. Scheerer, H.; Hoche, H.; Broszeit, E.; Berger, C. Tribological properties of sputtered CrN coatings under dry sliding oscillation motion at elevated temperatures. Surf. Coat. Technol. 2001, 142, 1017–1022. [Google Scholar] [CrossRef]
  28. Lay, T.; Kanamori, H.; Ammon, C.J.; Nettles, M.; Ward, S.N.; Aster, R.C.; Beck, S.L.; Bilek, S.L.; Brudzinski, M.R.; Butler, R.; et al. The great Sumatra-Andaman earthquake of 26 December 2004. Science 2005, 308, 1127–1133. [Google Scholar] [CrossRef] [PubMed]
  29. The Research Group of Suitability of Population Distribution in China. Report on the Suitability of Population Distribution in China; Science Press: Beijing, China, 2014; pp. 214–215. [Google Scholar]
  30. Liu, R.; Feng, Z.; Yang, Y.; You, Z. Research on the Spatial Pattern of Population Agglomeration and Dispersion in China. Prog. Geogr. 2010, 29, 1171–1177. [Google Scholar]
  31. Li, F.; Feng, Z.; Li, P.; You, Z. Measuring directional urban spatial interaction in China: A migration perspective. PLoS ONE 2017, 12, e0171107. [Google Scholar] [CrossRef] [PubMed]
Figure 1. 1 × 1 km population density of China and its neighboring countries in (a) 2000 and (b) 2015.
Sustainability 09 00336 g001
Figure 2. Population densities in China’s border regions in 2015.
Sustainability 09 00336 g002
Figure 3. Changes in population agglomeration index in China’s border regions with other countries, 2000–2015. (CP, China and Pakistan; CI, China and India; CN, China and Nepal; CB, China and Bhutan; CMy, China and Myanmar; CL, China and Laos; CV, China and Vietnam; CNK, China and North Korea; CR, China and Russia; CMo, China and Mongolia; CKa, China and Kazakhstan; CKy, China and Kyrgyzstan; CT, China and Tajikistan; CA, China and Afghanistan.)
Sustainability 09 00336 g003
Figure 4. Population changes in China’s border regions, 2000–2015.
Sustainability 09 00336 g004
Figure 5. Population proportions of different types of population changes in the border areas, 2000–2015.
Sustainability 09 00336 g005
Table 1. Population changes in China’s border areas, 2000–2015.
BorderType of Population ChangePopulationLandChanges in Population from 2000 to 2015
Total (10,000)Proportion (%)Areas (104 km2)Proportion (%)Changes in Total (10,000)Proportion (%)
Inside China’s borderPopulation decline areasSubstantial population decline areas3039.6833.637.959.291897.841757.8992.63
Moderate population decline areas201.032.2278.4919.21139.957.37
Population growth areasModerate population growth areas3524.7738.9749.4212.12584.31718.8527.82
Substantial population growth areas2279.9525.217.341.81865.4672.18
No man’s land/ 235.3 57.6
Outside China’s borderPopulation decline areasSubstantial population decline areas4457.5422.2627.126.013418.143342.5997.79
Moderate population decline areas222.261.1142.569.4275.552.21
Population growth areasModerate population growth areas269.41.3543.749.696961.0432.890.47
Substantial population growth areas15,076.4975.2938.158.456928.1599.53
No man’s land/ 300.08 66.44

