1. Introduction
There has been a marked growth in the study of environmental psychology in recent years [
1,
2]. This has stemmed from sustainability concerns and the need for further insight into how individuals make decisions and behave in the resource scarce world in which we live [
1,
2,
3,
4]. Recycling is considered as one of the easiest environmentally conscious behaviors to undertake, yet people differ greatly in their level of environmental involvement and concern, as well as the amount of time and energy they are willing to invest in sustainable behaviors [
5,
6,
7]. Therefore, it is proposed that a person’s level of environmental concern is not the issue when it comes to deciding whether or not to recycle [
5,
6,
7]. Decision making regarding recycling occurs in the “context of an internal debate where contradictory ideas are weighed up and the possibility of ambivalence arises” [
1] (p. 24). Castro et al. (2009) highlight the fact that although someone may think on a societal level initially, recognizing the importance of sustainable resource use, this thought may conflict with “functional beliefs regarding the self”, as recycling can require extra thought and/or time [
1] (p. 24). Fundamental to ambivalence, is the fact that recycling is predominantly a voluntary behavior, particularly when undertaken by the public at mass gatherings and in public spaces [
8]. Many studies explore the discrepancy between an individual’s attitude to recycling and their behavior, or the “attitude behavior gap” [
9,
10,
11]. For example, Chung and Leung (2007) noted a discrepancy between individuals’ attitude to recycling and their behavior in a study which found that although nearly all students were “favorable towards environmental responsibility” only approximately 42% self-reported recycling habits [
10] (p. 604).
According to the Australia Bureau of Statistics “waste is a by-product of modern living” and can be defined as what people throw away because they no longer want or need it [
12] (p. 1). Waste is a problem worldwide [
13] with Australia being one of the highest producers, [
14] disposing of an estimated 21,000,000 tonnes of waste annually—approximately 1 tonne per capita [
15]. Furthermore, successful source segregation is vital [
13] as it is claimed that over half of this waste includes recyclable materials such as paper, cardboard, kitchen and garden waste [
15,
16]. Although the amount of recycled materials is increasing, vast amounts of waste resources end up in landfill each year [
4,
5]. Hence, there is a clear environmental imperative to improve the rates of recycled materials and promote understandings of “waste as a resource” [
4,
5,
17]. In public settings with many visitors and/or a high turnover of people, it can be difficult to convince and teach people how to recycle [
18]. It is argued that knowledge alone is insufficient to promote recycling without information on the necessary logistics [
8,
18,
19]. Hence, at mass gatherings or events, effectively placed and developed signs are fundamental in increasing participation in recycling [
20]. It is important to note that there will always be occasions where people exhibit “indifference to environmental concerns”, even when faced with signs or prompts to the contrary [
21] (p. 709). Although Castro et al. (2009) suggest that this behavior can be attributed to an individual’s level of ambivalence; Werner, Rhodes and Partain (1998) claim it could be due to failures of the instructional signs, their wording, location or visual impact [
1,
21].
The ecological impact and sustainability of festivals has gained increasing academic interest in recent years, with some academics concluding that the carbon emissions resulting from travel to and from events needs to be included [
22,
23]. Although the studies conducted at the Boiling Pot and Peats Ridge festivals discuss sustainability, they were not focused on the role of signage in influencing the sorting of the waste [
24,
25]. WOMADelaide is a world music festival which is held annually at Botanic Park in Adelaide, South Australia. Adelaide is known as a “Festival City” [
26], as well as a city which strives to achieve positive environmental outcomes, recently announcing the ambitious target of becoming the world’s first carbon-neutral city [
27]. South Australia has implemented numerous policies to encourage recycling and was the first state in Australia to implement the container deposit scheme, offering a monetary reward for recycling cans, bottles and cartons [
28]. As WOMADelaide is promoted as an environmentally friendly festival, many of the attendees could be considered environmentally conscious, yet anecdotal evidence suggests there is still confusion about where to place their unwanted materials [
29]. This study aimed to reduce the confusion regarding the disposal of unwanted materials while attending the event.
WOMADelaide is well regarded as being an environmentally friendly festival [
30] and all “cups, plates, crockery, serviettes and any items sold in packaging at the festival are fully biodegradable, meaning that they will break down over time and be returned to the earth” [
30]. In 2015, a three-bin system was used comprising a Compostable and Organics Bin (COB), a Bottles, Cans and Cartons Bin (BCCB) as well as a General Waste Bin (GWB). Due to the aforementioned packaging restrictions, the only items to enter the GWB are those that attendees have brought from outside the festival. The results of this study aim to assist WOMADelaide in identifying ways to improve waste education for attendees, and may also be useful for other festivals considering their packaging, waste disposal and signage options. WOMADelaide 2015 attracted approximately 95,000 attendees over a four day period [
31]; all of which generated various amounts of waste. Adelaide Green Clean (the waste management contractor for the event), in collaboration with Jeffries (a local company specializing in organics recycling), aim to facilitate methods and practices that result in a minimal environmental footprint [
29]. The outcomes of this research may be of assistance to waste management organizations by helping minimize the need for extensive manual sorting post bin collection. Specifically, the effectiveness of signage in encouraging the separation of waste products within the confined area of a mass gathering was investigated.
Recent studies have indicated that signage for bins, using a combination of words and images, can make a substantial difference to the success of a waste management system [
32]. While research suggests that information alone is not enough [
33], signs can provide those who view them with practical and persuasive information, as well as behavioral cues for decision making [
34,
35]. Effective signs or visual prompts have been identified as having five main characteristics [
36] and have been found to increase the occurrence of desirable behaviors when: (1) the target behavior is reasonably convenient to engage in; (2) the behavior is stated in precise terms; (3) convenient alternative desirable behaviors are suggested when an undesired behavior is targeted (e.g., disposing of bottles in a recycling bin rather than the general waste bin); (4) the message is delivered in close proximity to opportunities for engaging in the target behavior; and (5) the message is stated in polite language and does not threaten an individual’s perceived freedom [
34,
35,
36,
37]. The purpose of this study was to explore how signage, incorporating psychological principles and based on literature outlining effective sign design, can encourage people to make the right decision about which bin to deposit their unwanted materials into in a festival setting.
2. Materials and Methods
2.1. Design Methodology
Advertising and marketing research provides insight into the most effective design of signage to influence or persuade viewers [
35], although there are no steadfast rules to follow. While the theory informing sign design has a long history, the literature suggests that studies relating to the practice of effective sign design have increased in recent years [
38]. The design methodology for the sign design was informed by the following research findings.
It is argued that visual prompts which are pleasant or funny are successful as they create a positive emotional state in the readers mind [
13,
35,
39,
40]. In addition, adding a picture may make signage more effective [
41]. However, if the message becomes clouded by the images, it may be rendered less so [
35,
42]. This is supported by Zero Waste SA, who suggest words should be coupled with pictures for maximum impact [
32]. Furthermore, through the use of pictures, symbols and/or colors; signs that are thought-provoking and noticeable can be used to encourage recycling [
43,
44]. At the very least, signage plays an important role in communicating what is and what is not acceptable to be recycled for those who were already planning on doing so [
44,
45].
It has been suggested that the colors chosen when designing a sign must either contrast or harmonize with the sign’s environment to augment the meaning of the sign’s messages, to distinguish messages from one another, and to be decorative [
46,
47]. Research demonstrates either contrasting colors or colors of contrasting brightness are best; optimally, white against dark colors or black on bright colors [
47]. A study by Kelly et al. (2006) explored the use of color coding according to the material category to be deposited [
48]. Green symbolized food and food contaminated paper, blue for all other paper and cardboard, yellow for plastics and black for rubbish. These were all labeled with the words “food”, “paper”, “plastics” and “rubbish” respectively, and listed a few of the common items to be deposited into each bin [
48] . Such studies suggest that the use of color is an important consideration in effective sign design.
When creating signs, it is of fundamental importance that they are large enough in size to be clearly visible from a distance, and are located as close as possible to where the target behavior is to occur [
32,
49,
50]. If the sign contains text, then a Sans Serif type font should be used, as they are stylish and easy to read; two key factors in the creation of an effective sign [
46,
47,
50]. Black and/or white text should also be chosen as they are more effective in attracting attention than bright colors [
50]. It is also paramount that the font size is large enough to allow viewing from a distance [
50,
51]. The signs developed for this study were 0.85 m × 1.8 m to ensure the pictures and text could be seen from afar and also complement the three 240 Liter wheelie bins, or wheeled garbage cans, located underneath.
The 2011 Boiling Pot Festival in Kalamazoo, Michigan, USA, utilized colored signs with a comprehensive list of items to be deposited into the landfill receptacles. This included many of the same items which would be placed into the compostable and organic waste stream at WOMADelaide including: napkins, paper towels, paper plates, paper cups, food boats and pizza boxes [
24]. However, management of the 2011 Boiling Pot Festival did mandate the use of compostable cups to address wastage generated from the most commonly used item at the festival [
24]. The correct waste stream for attendees to deposit unwanted cups into was clearly defined with the blue “COMPOST” bin sign listing only “Plastic event cups” and “Food waste—NO BONES”. It is interesting to note that, although the signs were color coordinated with the lids of the three bin system, they did not include pictures [
24]. Although the use of pictures is not deemed a compulsory element of effective sign design, Kelly et al. (2006) suggest the inclusion of pictures of the most common materials to be deposited into each waste stream [
48]. A number of respondents in the study explained the reason they did not recycle was their ignorance about where to dispose of their unwanted material(s), as well as fear of contaminating one of the waste streams by making an incorrect choice [
48]. It is of fundamental importance that the signs are not cluttered; therefore, a balance must be struck between the blank spaces and the spaces occupied by words and graphics. In addition, all items on a sign need to be placed purposefully and nothing can be positioned arbitrarily [
51].
2.2. Sign Design
Taking into account the principles outlined above, fifteen versions of each sign were developed using an interactive process, before the final decisions regarding text and graphics were made. Changes included the phrasing of the messages, the background graphics, text case, and the items pictured for each waste stream. In addition, the wording to complement the general waste option was workshopped with the following possibilities discussed: “everything else”, “nothing purchased from in here”, “anything you brought from home”, and “all the bad stuff”, with “everything else” being the final choice of these options. While refining this wording, it was important to use lay language and to ensure the pictures were of commonly discarded objects to ensure maximum understanding for the audience [
34].
There were many variations of the pictures used to highlight the most common acceptable materials to be deposited into each bin [
13] and it was important not to include any branded products. The cups sold at the festival were chosen as the largest Compostable and Organic (C & O) item pictured, as it was anticipated there would be a high volume deposited and they had a plastic appearance, despite being made from corn starch. It was challenging to decide on the picture to accompany the general waste text, as it was difficult to predict the items that people might bring into the festival. The addition of “Cartons” was made to the middle waste stream (BCCB) and therefore called “Bottles, Cans and Cartons” with no sub text listed as it was deemed self-explanatory. All signs developed for the purpose of this project were designed to complement Adelaide Green Clean’s colored bin covers, which are red for GWB, yellow for BCCB and green for COB. These bin covers are bright, noticeable and have a pleasant design, in line with recommendations by Lin et al (2016) [
13]. The bins were located side by side, which has been shown in a number of studies to achieve greater positive results than those separated by distance [
52].
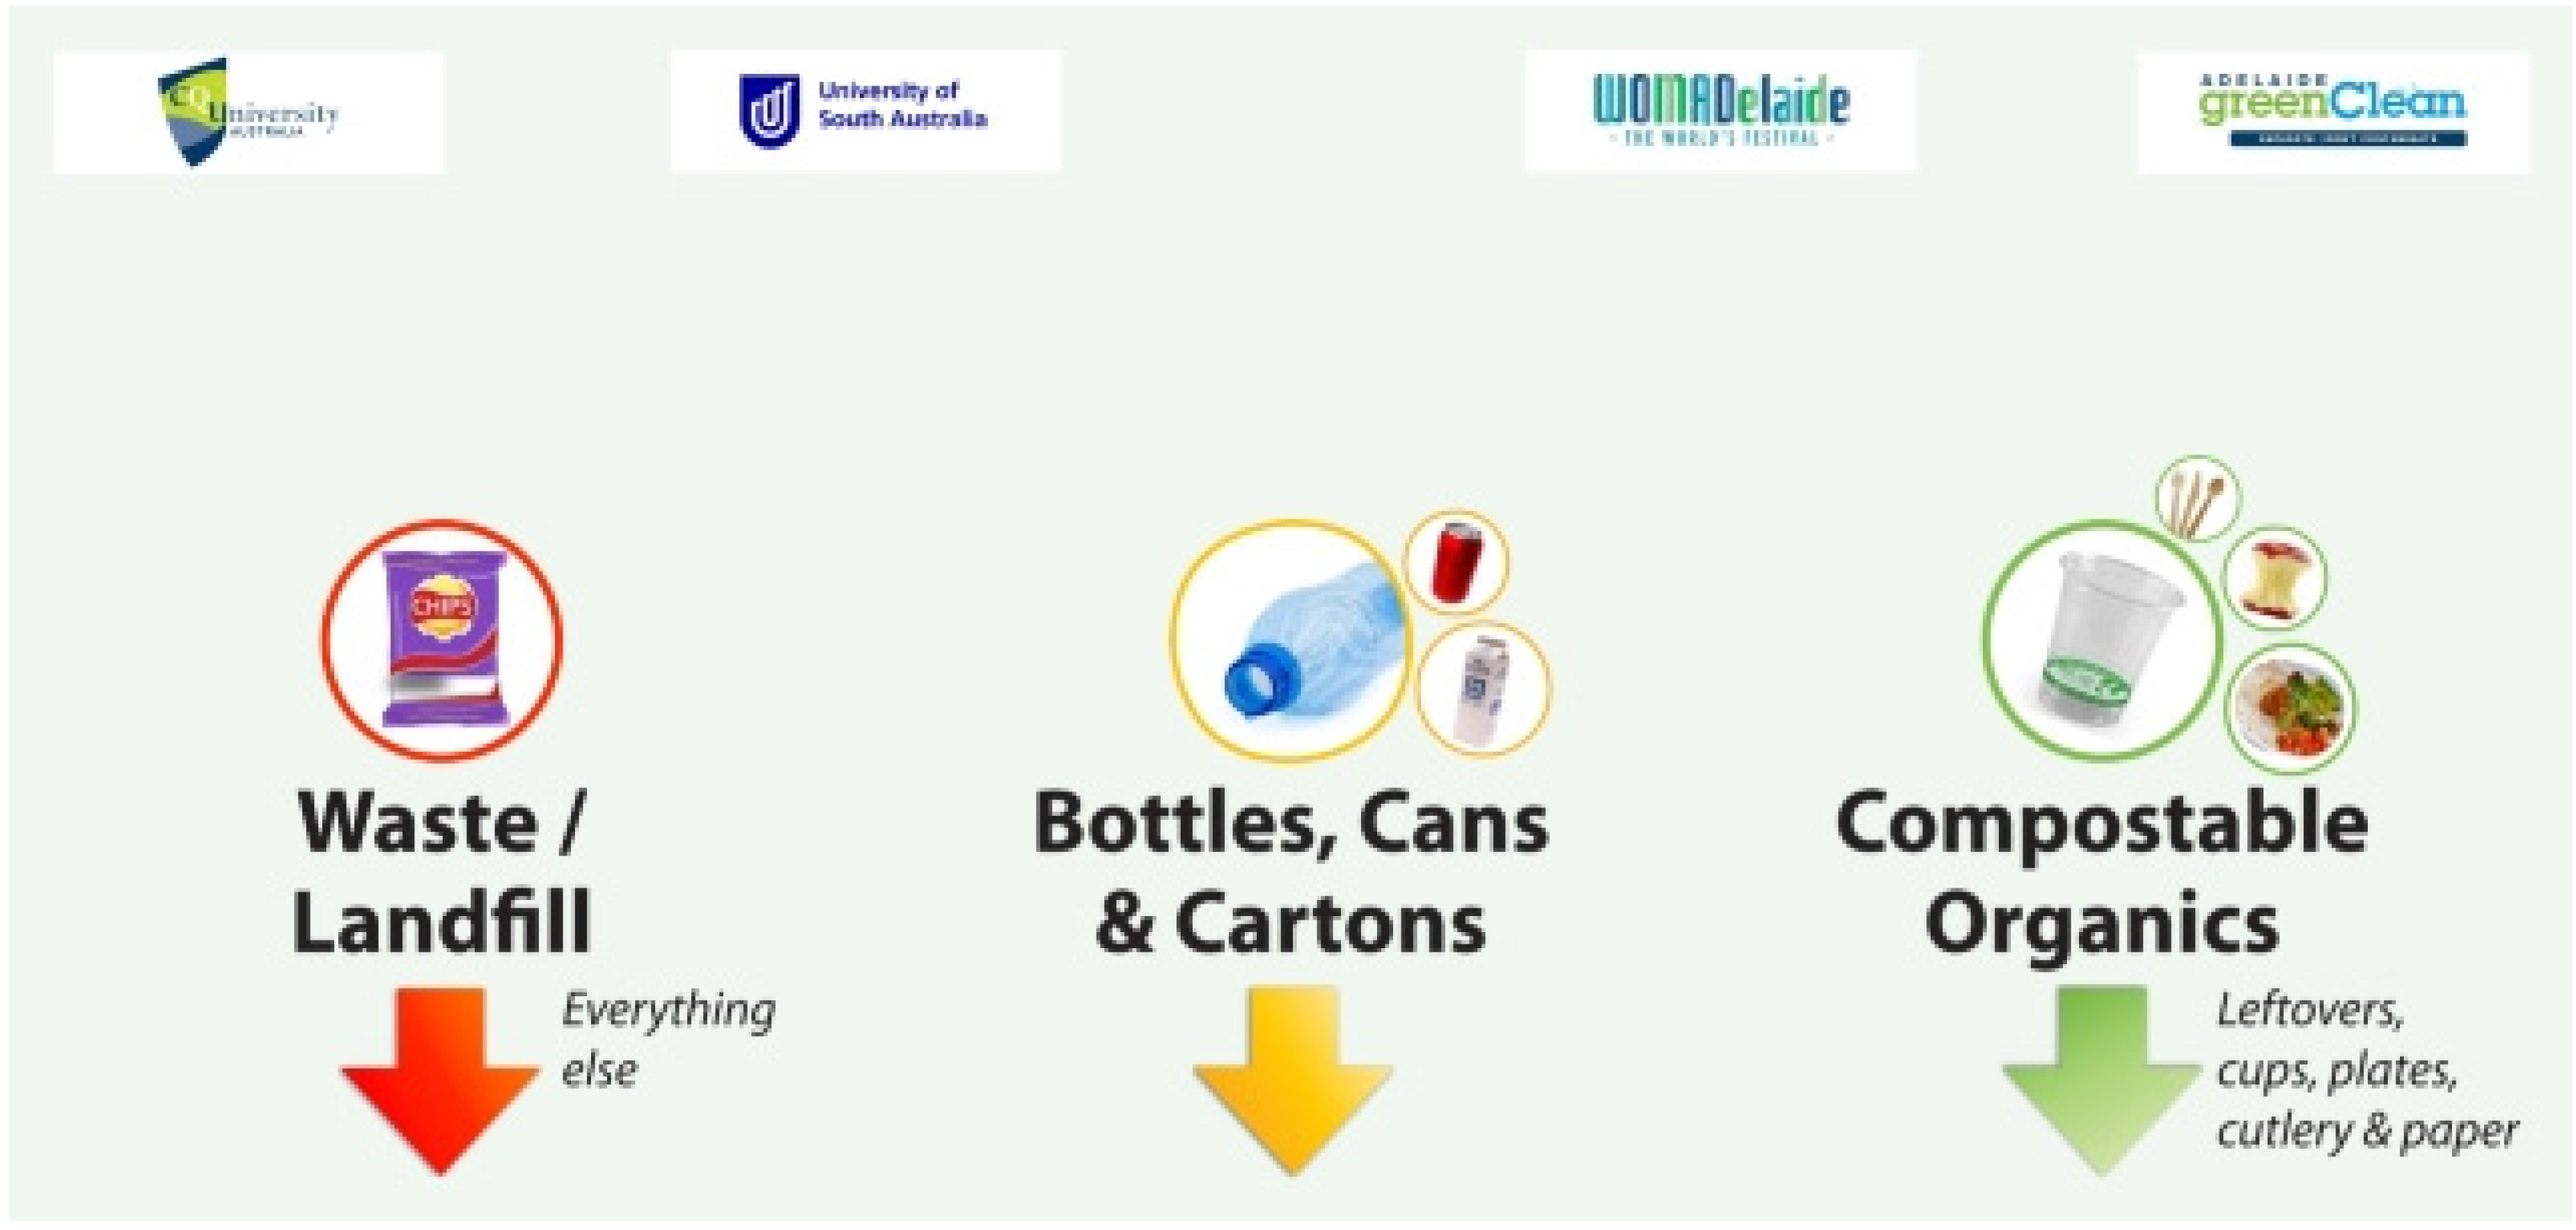
Three signs were created to compare against the baseline sign, in line with the study by De Kort et al. (2008) [
45]. It was important that the words, pictures and layout were consistent across all signs, other than the messages and the background graphic, in order to test against the baseline sign (
Figure 1). All graphics used in the creation of the signs were licensed freely and were chosen to reinforce the message on the sign.
The C & O materials disposed of at the festival were composted and returned to Botanic Park, the bottles and cans recycled by Scouts Australia, and the general waste was processed into an alternative fuel and diverted from landfill [
29]. Regardless of this diversion, Adelaide Green Clean printed the word “LANDFILL” on the general waste bin covers, as they believed that the word conjured up a mental image of the negative connotations associated with landfills, in the hope that attendees would look for another waste stream to deposit their item(s) into [
53]. The Adelaide Green Clean bin covers were in line with Zero Waste SA’s recommendation to provide easy access for the deposits with no lids requiring pulling up or down [
32].
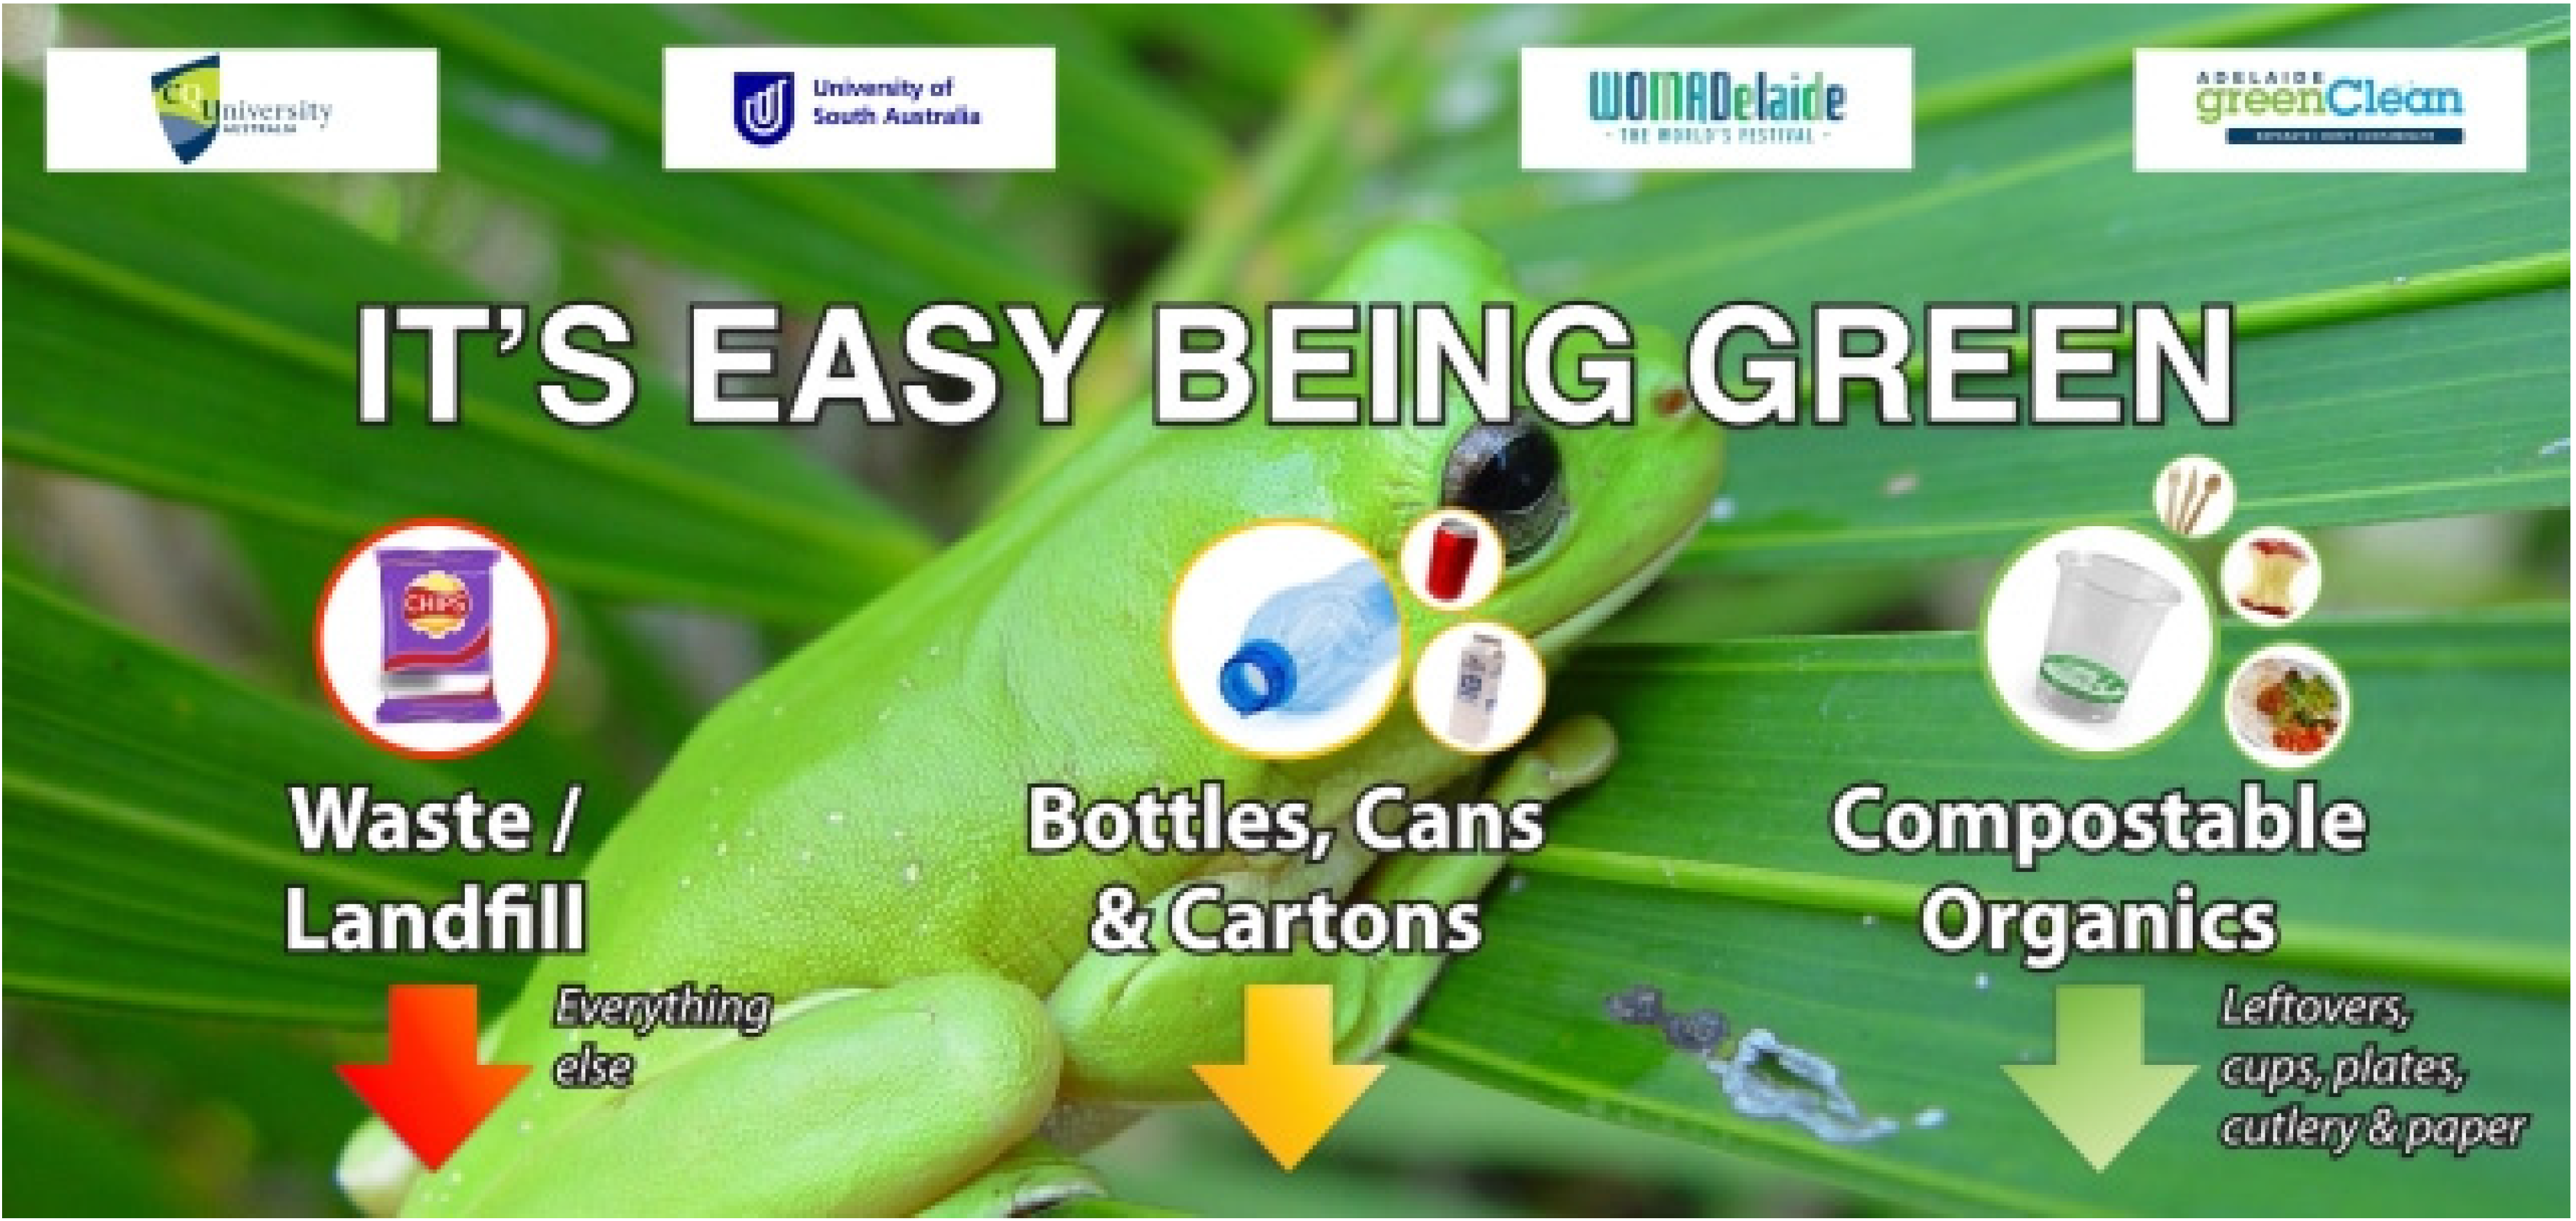
The second sign was developed to highlight the convenience [
4] of recycling (
Figure 2). Recycling is deemed one of the most convenient activities to undertake when compared with other environmentally sustainable behaviors [
54,
55]. The need for recycling to be, or perceived to be, convenient, was highlighted in a study by Ludwig, Gray and Rowell (1998). This study demonstrated that if recycling is more convenient, or the recycling bin is in closer proximity to the individual, then the volume of recycling will increase [
55]. The study was based on a previous experiment by Brothers, Krantz, and McClannahan (1994), which found a large increase in the volume of cans recycled when moving the recycling bins into classrooms [
54]. Therefore, the study concluded that the behavior was directly affected by convenience [
54,
55]. This notion is supported by the study conducted by Lee and Ralston (2003), which installed recycling bins in each room of a hotel, claiming that both the bin and sign were effective in increasing the volume of recycled items [
56].
The background graphic for the second sign—”It’s Easy Being Green” was initially a rainforest with sunlight shining through leaves; imagery associated with nature, the natural environment and a sense of calm [
57]. This was changed to a picture of a green tree frog and is a play on the famous song by Kermit the Frog—”It’s Not Easy Being Green”. A similar play on words has been used previously in a commercial for a Hybrid SUV produced by the Ford Motor Company where Kermit is singing and stops to explain “I Guess it is Easy Being Green!” [
58] (p. 343).
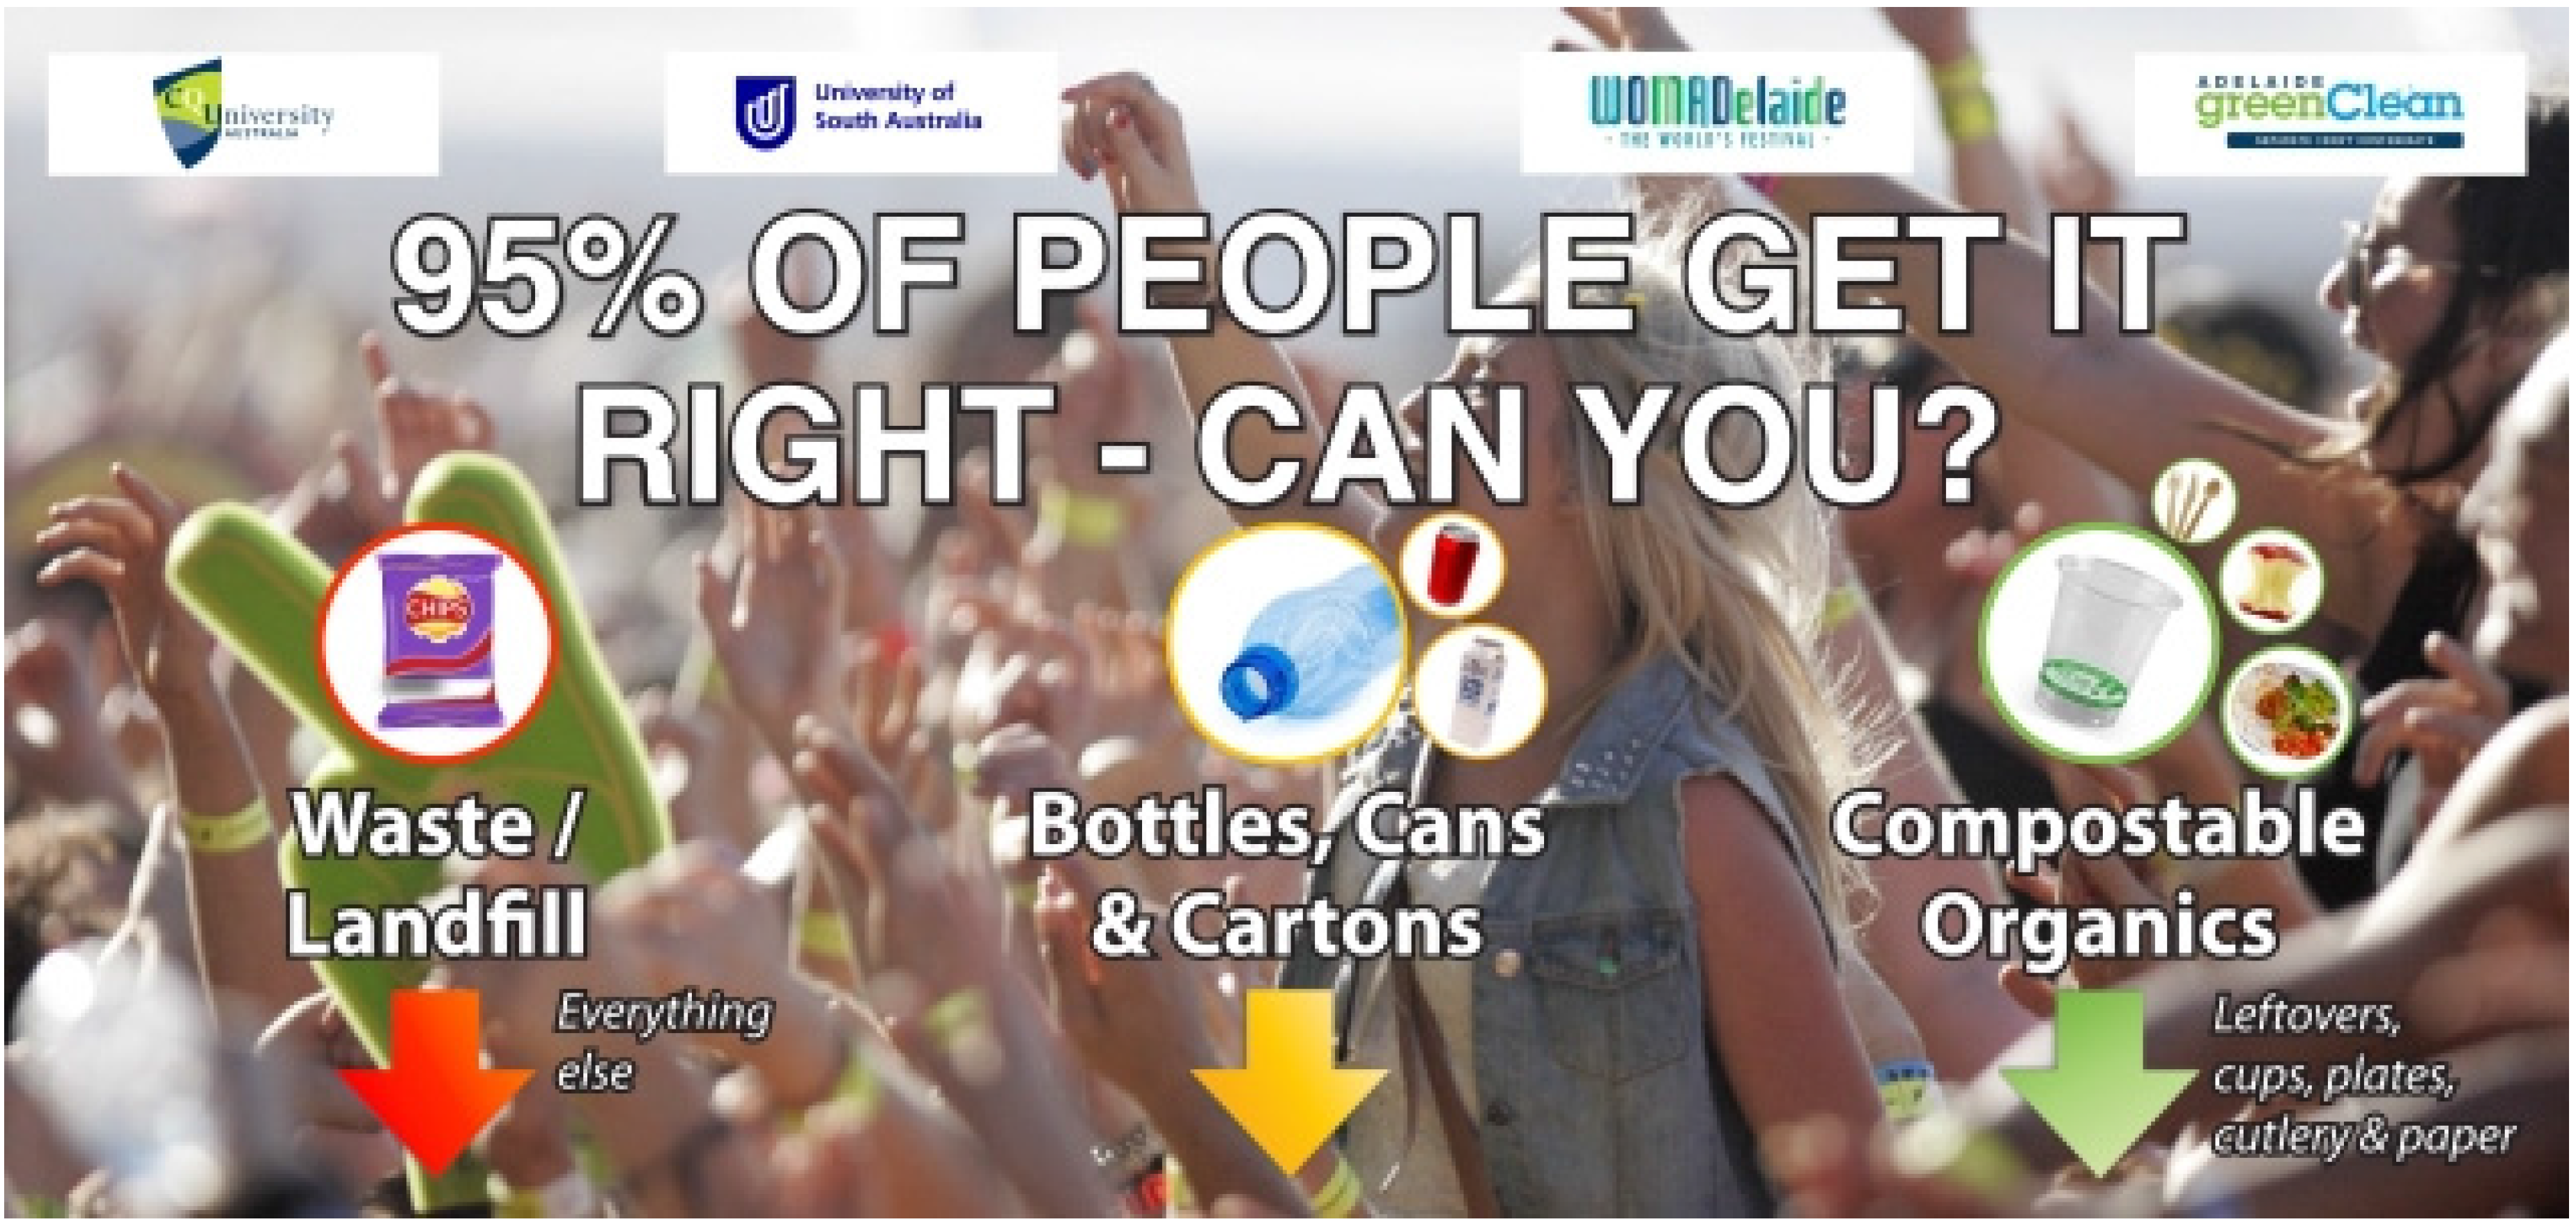
The “95% of People Get it Right—Can You?” sign was developed with the inclusion of a social norm which plays on people’s desire to socially conform (
Figure 3). The decision to use the wording “95% of People Get it Right” was based on the work conducted by Goldstein, Cialdini and Griskevicius (2008) [
59]. This study found that appeals employing descriptive norms, which refer to how most people behave in a chosen situation, are superior to traditional appeals that focus solely on environmental protection [
59]. A study by Hornik et al (1995), synthesizing the results of 67 empirical studies, found that social influence and knowledge were the two strongest predictors of recycling behavior [
19,
60].
Goldstein et al. (2008) stated that even though the company that supplies information cards to hoteliers claims that 75% of people reuse their towels, the results of this study showed this statistic to be 44.1% [
59]. It is claimed that the percentage indicated on a sign is not important [
59]. As long as the sign indicates that the majority of individuals partake in the desired behavior, then the number of participants demonstrating the desired behavior should increase [
59]. A number of statements were workshopped in the development of this sign including; “Most People Get it Right—Can You?”; “Everyone Else Gets it Right—Can You”; and “80% of People Get it Right—Can You?”. All statements were of descriptive norms, indicating that the majority of others “Get it Right”. The background graphic chosen for this sign was a group of people in a festival setting in order for viewers to connect their setting with the immediate social norm.
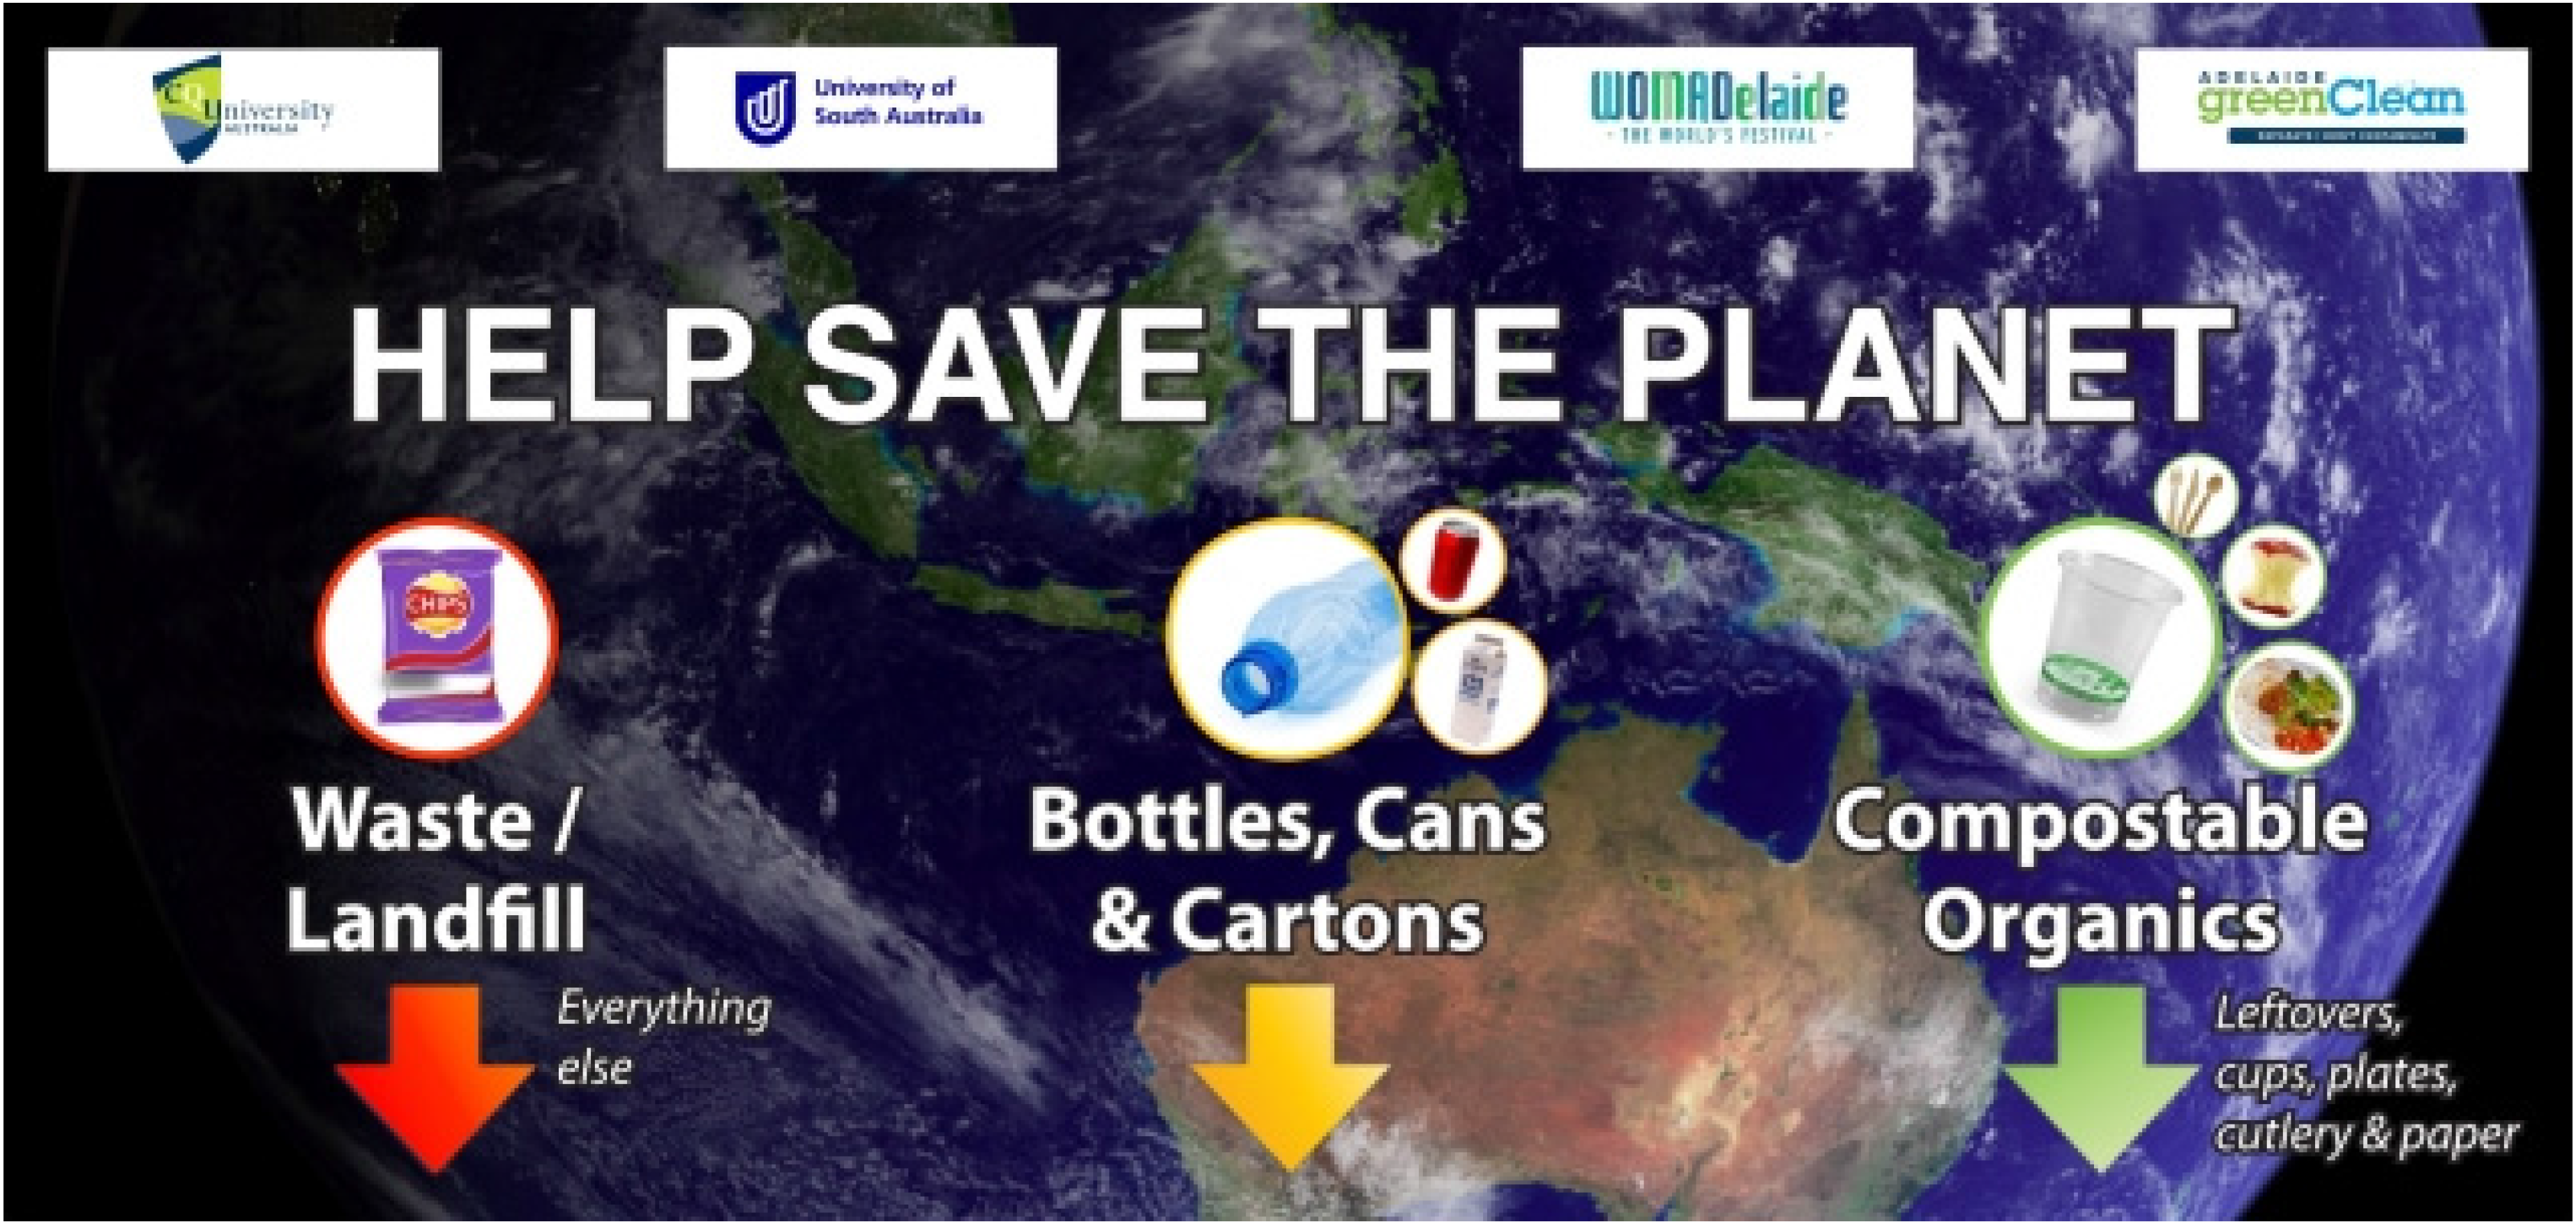
The last of the four signs was developed containing a standard environmental message (
Figure 4) [
61]. The message was similar to the one trialed in the Goldstein, Cialdini and Griskevicius (2008) study where “the standard environmental message focused guests on the importance of environmental protection but did not provide any descriptive normative information” [
59] (p. 473). This particular image of the globe was chosen because it focused on Australia, where WOMADelaide is held, within the bigger picture of the planet. It was suggested that a graphic of the cartoon character
Captain Planet be used. However, the planet was the final choice, as WOMADelaide is a world music festival and the picture of the globe was thought to connect with a broader audience. The clear concept of calling for people to “save the environment” has been used in many previous studies and often yields greater levels of pro-environmental behavior than those that demonize non-compliant behavior [
34,
40,
62].
2.3. Hypotheses
Based on the study conducted by Goldstein, Cialdini and Griskevicius (2008), where a descriptive, social norm was found to be more effective than a standard environmental message [
59], the following hypotheses were developed:
“95% of People Get It Right—Can You?” would be the most effective in getting the greatest number of items deposited into the correct bin.
The baseline sign would be the least effective in getting the greatest number of items deposited into the correct bin.
2.4. Method
Once the signs were designed, the frames for the signs were constructed using offcuts of steel and were constructed and trialed two weeks prior to the festival. The frames were covered with hessian to give a more environmentally aesthetic appearance [
63] and umbrella bases secured with tent pegs were used to keep the structure upright. GoPro™ cameras were positioned in small cardboard boxes at the top of each frame and the view tested to ensure compliance with ethical guidelines from the University of South Australia. The guidelines may differ overseas; however, for the purpose of this study it was of fundamental importance that participants were not identified and that the unique identifier for each deposit was the time of entry. Project information pamphlets were designed and printed for observers or participants who wanted further information about the study and/or had any questions in relation to privacy. It was paramount that the investigation be conducted using this methodology as previous studies have indicated that attendees may alter their behavior if they realize they are being filmed [
59].
The WOMADelaide “Green Team” volunteers were informed about the project at the festival volunteer briefing session. Furthermore, all Adelaide Green Clean employees were notified of the logistics involved with the project. This was of significance because both groups were instructed not to assist attendees with their decision making during the time of the data collection. Due to unforeseen circumstances, one of the GoPros™ was not holding charge and therefore the time of the data collection was delayed, with it running from 2:00 p.m. onwards on the third day of the festival. Consequently, some of the staff and volunteers helped attendees decide where to place their unwanted items. These deposits were omitted when coding the data. Any deposits made by Adelaide Green Clean workers were also excluded, as well as those made from behind the sign. This change to the original plan arguably yielded a higher number of overall deposits because participants had time to attend the festival and purchase food prior to data collection.
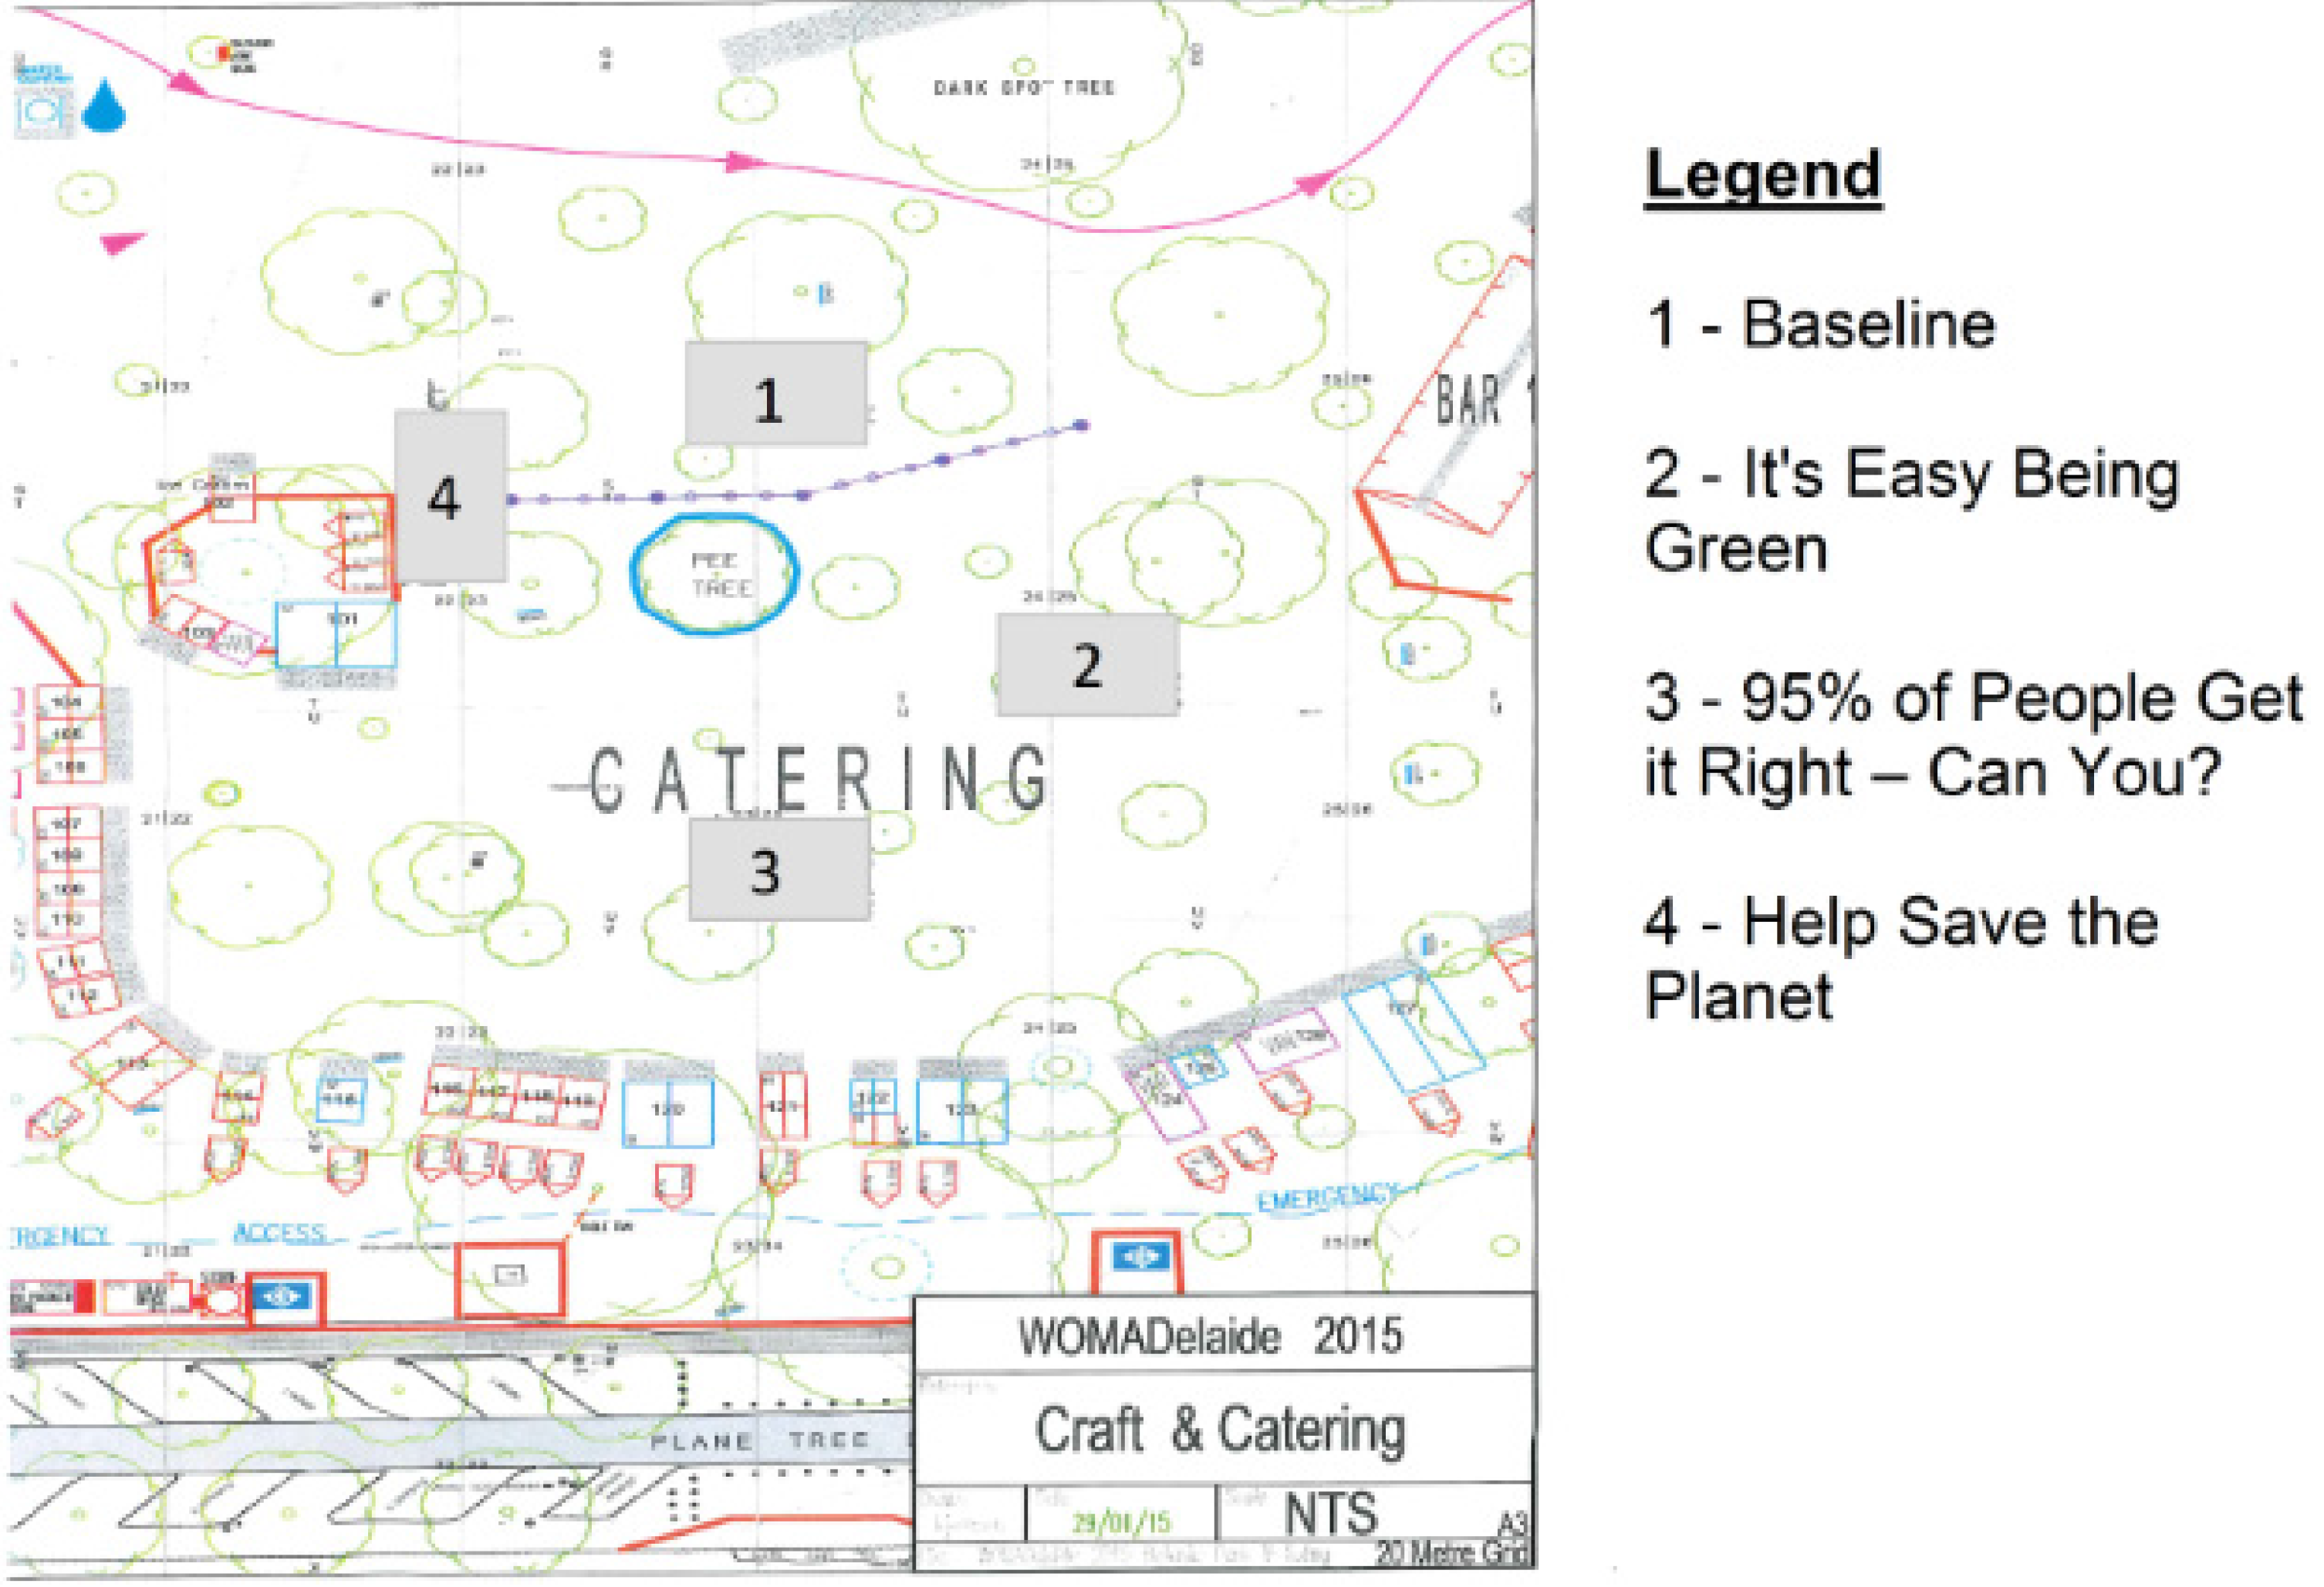
The testing of the signs occurred in the catering area of Botanic Park, Adelaide, where there were a number of bins evenly distributed around the space, in line with recommendations from Zero Waste SA [
32]. This was to ensure that a sufficient number of waste deposits were observed in a zone in which people purchased and consumed food and beverages (
Figure 5) [
32]. A large amount of foot traffic also flowed through this area when attendees transitioned between stages. Furthermore, it was important for the vendors that the signs did not obstruct access to, or visibility of, the stalls within the catering area.
The bias of the WOMADelaide attendees needs to be acknowledged, as participants could be considered more environmentally conscious than the general population, and therefore it is possible to infer that attendees would be likely to take more care when disposing of waste. Therefore, it is likely that the results would vary at a mass gathering of a different nature.
A major limitation of the study was the order in which the bins were arranged. Adelaide Green Clean explained prior to the festival that the bins must be in the following order: GWB (left), BCCB (middle) and COB (right). Unfortunately, as it is convention to read English text from left to right, the general waste or the least preferred waste stream, was viewed first. The all-encompassing wording “everything else” being located on the left meant attendees read this before reading what the other options were.
Previous studies conducted in the field have manually counted the number of items deposited into bins at the end of each day and measured the results against a baseline [
52,
55]. This quantitative methodology was adapted to capture timing data using GoPro™ footage which could then be coded using Studiocode V5.8.2, Mac OS 10.8; a software program produced by Studiocode Business Group. The software allowed for each deposit to be coded with the following features:
Which bin station the person was depositing into (the sign above);
Which bin it was entered into COB, BCCB or GWB;
Whether they made the correct decision;
Whether they were a “chucker” or a “thinker”;
Whether they could be identified as “male” or “female”.
The data captured a random sample of people, and a “thinker” was defined as someone who was seen to be hesitating and standing in front of the bins for a period of approximately two seconds or longer. The gender identification of participants was an approximation based on their jewelry and clothing. All compostable items were coded as one of the following categories: brown paper bag, cardboard, cup, cutlery, food scraps, coffee cup lid, paper coffee cup, pizza box, plate/bowl, receipt/paper/food wrapper, straw, or napkin. Originally, each general waste item was coded. However, as there were so few of each item, they were all categorized as “miscellaneous general waste”. Examples of these items include metal wire, cling wrap, a rotisserie chicken bag, plastic take away containers and chewing gum. There were 22 unclassified items which could not be identified by slowing down the footage.
If any of the bins were removed by the Adelaide Green Clean workers to empty the contents, the time they were absent was subtracted from the data. The video footage captured from above each of the signs was analyzed for a period of 1 hour and 26 minutes.
3. Results
Approximately eighty-seven percent (
n = 776) of all deposited items were C & O items which should have been placed into the Compostable and Organic waste stream. However, out of the 776 compostable and organic items deposited, only 459 were deposited into the correct bin (
Table 1).
The bins located under the baseline sign yielded a far smaller sample size as there were only 88 entries, as compared to over 200 deposits in the bins located under motivational signage. A Chi-Square test for association shows that the proportion of correct deposits was not significantly different between the bins with different signage, at a 0.05 level of significance. In addition, the proportion of correct C & O materials deposited at the 5% level of significance was also insignificant. Therefore, the lack of significant difference evident from these tests means none of the signs stood out as being far more effective than the others in terms of increasing the number of correct overall deposits or deposits of C & O materials.
The study also investigated the effect of gender on the proportion of correct deposits overall and of C & O materials. The results indicate those classified as “males” had a statistically higher rate of depositing their materials into the correct bin (
Table 2). The gender of 51 depositors could not be identified, and therefore the corresponding data were omitted from this statistical analysis.
However, there was no statistically significant relationship between the sign design and correct deposits made by participants classified as “female” (
Table 3). “Males” responded differently to the signs when compared to those coded as “females”. When compared to the baseline, those classified as “male” did better as a result of the motivational signage.
The data indicate that there was a statistically significant difference between the number of correct deposits made by “chuckers” and “thinkers” (
Table 4). The
p-Value for all depositors was 0.000, for “males” 0.000 (
Table 5), however, for “females” 0.016 (
Table 6), indicating greater significance if the person was “male”. Once again, the 51 depositors who could not be identified as “male” or “female” were removed.
The deposits were separated according to the gender coding and then the correct deposits by sign were analyzed. The ability of “males” to make correct deposits was significantly affected by the sign. However, for “females” it was not. Therefore, the results suggest that gender may influence the way individuals respond to signage, which could be explored more in future research [
64].
It was also found that the three signs, which included the graphics and messages, resulted in a statistically significant difference in the number of deposits in the correct bin, as can be seen in
Table 4. While the ad hoc categorization of “chuckers” and “thinkers” was used for this study, the results suggest that a third category called “followers” should have been included. This was not included in the hypotheses and is expanded further in the discussion. It is important to note that the person being viewed undertaking the behavior did not necessarily need to be known to the person “following”.
The results of this study show that more people were attracted to the motivational signs with the graphics and messages, as they had a significantly higher aggregate number of deposits. This is in line with previous research by McKenzie-Mohr (2011) and Geller, Brasted and Mann (1980) [
49,
65]. However, these signs did not increase the number of correct deposits when compared with the baseline (
Table 7).
The results show that although the baseline sign elicited a higher number of correct deposits, the three motivational signs containing the messages and associated graphics, yielded a much higher aggregate number of entries. This poses an issue for waste management contractors because it is important to have as many deposits as possible deposited in the correct bin. Therefore, the findings suggest that while attendees were drawn to the signs, the messages and graphics did not aid their decision making process. As expected, those who visibly thought about their deposits were more likely to dispose of their item(s) correctly. Based on the results of this study, further research would be beneficial to assess how the signage could be improved. The baseline sign eliciting a greater proportion of correct deposits, suggests the fact it was less cluttered made it clearer to attendees how to deposit their unwanted materials correctly. Furthermore, the possibility that the motivational signs were too cluttered could mean that the attendees where overloaded with information. The message may need to be clearly stated at the top of the sign in plain text with the pictures of items to be deposited into each waste stream below.
4. Discussion
The fact that all packaging sold within the grounds is C & O, is a point of differentiation for WOMADelaide which could be promoted more extensively in future years. In addition, given that approximately 87% of the items deposited in this study were C & O materials; a focus on increased attendee education would arguably assist the waste contractors for the event. It may be beneficial to physically attach one of each of the most common C & O items as well as a bottle, can and carton onto the sign; allowing attendees to associate what is in their hand with the correct waste stream. Some of the C & O items which were deposited into GWB may have been placed there due to a fear of contamination. An “environmentally conscious” attendee may not have wanted to contaminate the bottles, cans and cartons or dispose of something which is not C & O into a COB [
48]. Therefore, it is suggested that targeted information campaigns should be implemented at the point of sale within the catering area [
4]. Further to this, a list of photos or information/instructions could be placed on the event website to inform those purchasing their tickets online. This would not completely address the “attitude behavior gap”. However, it may encourage correct disposal by those who lack information and would otherwise dispose of their waste correctly. If replicating the study, it may be beneficial to collect data on the first day of the festival. This is particularly important for a festival like WOMADelaide where the majority of attendees purchase three or four day passes and may have preconceived ideas of where to place their rubbish by the third day.
Gathering data via concealed video footage will aid future research into recycling habits by preventing the need to manually sort through the contents of bins as was done in studies by Brothers, Krantz, and McClannahan (1994) and Ludwig, Gray and Rowell (1998) [
54,
55]. It has been proposed that participant observation could be used in future studies, to complement the data obtained from footage directly above the bins, and to gain a greater understanding of the decision making process [
66]. Additionally, if ethics approval were granted, it may be beneficial to change the angle of the camera to be able to view people’s deliberation process more closely and from a further distance. This would aid the categorization of “chuckers” and “thinkers” and identification of those who were considering their deposit as they approached the bins. Although it could be assumed that modeling the behavior is extremely beneficial for children, it may be just as important for adults [
36,
49,
67]. Although the age of the person depositing their item(s) was not coded in this study, the deposits by children suggest that there may be a generational change in recycling education occurring. On many occasions young children asked their parent or guardian “is this right?” and were instructed either correctly or incorrectly from there. Many of the children were considered “thinkers” as they were shown to look at the sign and ask for confirmation of their choice before making their deposit. Many of the children removed the straw from their fruit box or cup and disposed of the two items separately. It is possible that the combination of visual cues and recycling education at an early age may have translated into them automatically thinking about the components of their deposits as separate items.
Some of those who deposited their unwanted materials simply “followed the leader” by copying the person in front of them. This is consistent with studies which have shown children and adults are influenced by watching the behavior of others [
36]. Research conducted by Robert Cialdini (1984) explored how best to influence others and concluded that actions of those around you are important in influencing your decision making process [
62]. Essentially, if others around you recycle then you may be more inclined to do so [
62]. However, contextual cues may also impact behavior, as people may behave differently in a festival setting, than they would in the privacy of a hotel room as in the study conducted by Goldstein, Cialdini and Griskevicius (2008) [
59]. Similarly, people may behave differently at WOMADelaide than they would at other less environmentally conscious public events or festivals. This suggests that the messaging may need to be different depending on the location and those watching, or possibly watching, the individual make the decision. After depositing into the “95% of People Get it Right” bin, on more than one occasion discussions were had and comments made about participants decisions, for example: “oh no we were both wrong” or “oh look we got it right”. Others looked into the bins to see if they could identify the item they were holding already deposited into a particular bin, and based their decision both on the sign and the actions of others before them. Interestingly some people also “hedged their bets” for example putting one bowl in GWB and one in COB. Others looked at the sign while they were waiting to access a bin and consequently decided to dispose of their unwanted materials differently to how they were originally going to act. This extra time viewing the sign meant they considered their choice(s). During the study, one person banged on one of the motivational signs and stated “they needed this on every single one” pointing at the pictures of what goes into the COB.
There are a number of studies which show modeling the correct behavior is advantageous in encouraging a higher number of correct deposits [
13,
34,
49,
67]. This is supported by a study conducted by Sussman and Gifford (2013), where signs were erected above COB in a shopping center food court and an independent fast food restaurant. Models were also employed to dispose of compostable materials ahead of the participants [
35]. The study concluded that the effect of the signage was less significant in influencing behavior than following the pro-environmental actions being demonstrated by the models [
35,
62]. Sussman and Gifford (2013) aimed to align two norms by using signs to deliver an injunctive norm message, and models to help create a descriptive norm impression, that composting is already being practiced by others [
35,
68]. Other studies have tested the effect of signage compared with the use of volunteer advisors and found the results to be statistically similar [
13]. WOMADelaide employ the use of volunteers called the “Green Team” to politely demonstrate (model) and explain (verbally) how the waste should be sorted [
13]. These volunteers were informed about the study prior to the festival and asked not to aid attendees with their decision making process during this time. In future studies, it may be useful to allow this face-to-face interaction to occur, while trialing the signage [
13]. It may also be worthwhile investigating the influence of an official “Green Team” volunteer modeling correct behavior compared with another festival attendee.
A systematic approach is required to ensure that all bins are arranged in the same order with COB on the left, BCCB in the middle and GWB on the right, if overhead signs are employed. This would allow the most attractive option to be read first, with the least attractive being the last resort. To gain a greater understanding of the role the order of the bins played in affecting people’s decision making ability, the placement of COB on the left and GWB on the right should be tested against the order trailed in this study. If this study was undertaken in a country where the population read from right to left, this order could also be trialed. It is possible that the size of the bins could also impact attendee’s decisions making process, so a smaller GWB could be trialed on the right. If this study were to be replicated, it would be beneficial to gain data from a set of bins with no sign erected above the bin station, in order to gain a greater insight into the role of the bin covers alone. Without this information, it is hard to be sure how beneficial the overhead signage was in aiding the process, when compared with the other bins located around the park. The waste contractors at this festival ensured that all three bins were located side by side at each bin station. This is of significance, as previous research has found co-location and the convenience associated with it, leads to better sorted waste [
4]. Other festivals can learn from WOMADelaide and the Getting Wasted at WOMADelaide findings, by ensuring all bins are co-located and that all cups, plates, napkins etc. are made from compostable and organic materials. The results of this study highlight the complexity of the “attitude behavior gap” along with the need for further research into how signage can improve waste management outcomes in a festival setting.


