Article

Optimal Consumer Electronics Product Take-Back Time with Consideration of Consumer Value

Department of Industrial and Systems Engineering, Chung Yuan Christian University, Taoyuan City 32023, Taiwan
*
Author to whom correspondence should be addressed.
Sustainability 2017, 9(3), 385; https://doi.org/10.3390/su9030385
Submission received: 21 September 2016 / Revised: 5 February 2017 / Accepted: 2 March 2017 / Published: 7 March 2017
(This article belongs to the Section Sustainable Engineering and Science)

Abstract

:
Rapid economic growth in recent years has transformed our lifestyle to massively produce, consume, and dispose of products, especially for consumer electronics. This change has put great threat to our environment and caused natural resource depletion. Moreover, short product life cycles and quick replacements of consumer electronics create enormous electronic wastes (e-wastes). Without proper waste management, immense environmental damage is expected. In this empirical study, we notice that lots of valuable materials that can still be recycled from these used consumer electronics are left unused at home instead of being recycled at the appropriate time, which causes a low collection rate and a decrease in residual value for the used products. Therefore, it is important for the government and the recyclers to handle them efficiently by increasing the used product take-back rate. Our study develops an assessment model for customer value based on the idea of value engineering and the perspective of product life cycle. We also explore the relationship between product value and the total cost of ownership with an evaluation of their time variation, considering different usage modes for various consumer groups and different recycling award schemes (fixed and variable recycling awards). Proper take-back management is likely to create a win-win situation both for consumers and environmental protection. This study regards the notebook computer as an example to determine the optimal time for recycling laptops based on usage patterns and provides consumers a reference for when to replace their used product. The results from our modeling firstly clearly indicate that consumers with higher frequency of usage have shorter take back times and higher maximum consumer value. Secondly, a variable recycling award scheme with higher maximum consumer value is more practical than a fixed recycling award scheme.

1. Introduction

The rapid development of technology has brought consumer electronics into our daily life in the past decades. This has changed the way we communicate, entertain, and obtain information. Innovative technology continuously pushes out the old model and brings in the new one to meet consumer’s demands. This has shortened the life cycle of consumer electronics and resulted in greater replacement and disposal compared to other products. Without proper recycling processes, these accumulated electronic wastes (e-waste) will not only pose threats to the ecological environment but also cause valuable resources to be destroyed or unused. According to the research of Balde et al. [1], the estimated amount of e-waste generated in 2014 was 41.8 million metric tonnes (Mt), and this was forecasted to increase to 50 Mt of e-waste in 2018. In Europe [2], e-waste is increasing at an annual rate of 3% to 5%, which is almost three times faster than the total waste stream. Developed countries are not the only ones that generate e-waste; developing countries are also expected to triple their e-waste production. United Nations Environment Program (UNEP) [3] estimated that 50 million tons of e-wastes are produced each year globally, but only 15%–30% of e-waste is recycled; the rest go directly to landfills and incinerators. In addition, US government researchers [4] investigated the quantity of electronic products ready for end-of-life between 1990 and 2010; the result implies that 5 million short tons of electronic products are in storage, remain stockpiled, and are waiting for disposal.
Today’s computer industry innovates at a rapid pace and brings new technologies with upgrades to market on average of every 18 months. According to data provided by the Statist a website [5], the average life of PCs and tablets is expected to drop in the next four years. While the average life for these devices was almost 3.1 years in 2013, that number is expected to drop to a little over 2.8 years by 2017. It shows that computer replacement has increased and caused a huge disposal problem. Kwak et al. [6] presented the results of an analysis of data collected from an e-waste collection center in Chicago, showing that the mean age of collected laptop computers is 11 years old, which is very different from its typical wear-out lifespan. United States Environmental Protection Agency (U.S. EPA) [7] discovered that many consumers did not recycle their consumer electronic products when they first became defunct or obsolete and more than 70% of retired products were kept in storage, typically for as many as 3–5 years.
In order to resolve these serious waste problems caused by consumer electronics, the European Union proposed an Integrated Product Policy (IPP) [8] that aims to take a life cycle perspective instead of the end-of-pipe treatment. Integrated environmental awareness is blended into the processes from design, extraction of natural resources, manufacturing, assembly, distribution, and use to the eventual disposal as waste to reduce damage and pressure on the environment. It also needs to include all relevant stakeholder viewpoints for the whole product development process from idea generation to product management and reverse logistics. End-of-life management (EOLM) has become an important global issue in electronic consumer products, home appliances, and industrial equipment products recently. Many enterprises have successfully applied this management method as a feasible solution to solve the E-waste problem. Ramani et al. [9] define EOLM as the process of converting end-of-life products into remarkable products, components, or materials. It enables manufacturers to comply with environmental legislation while gaining economic advantages.
EOLM can be divided into two parts: (1) product take-back, which is the process of acquainting the end of life products from the consumer; and (2) EOL recovery options, which take the products after the acquisition to elect product reuse, component reuse, and material recovery options [10,11,12]. Guide et al. [13] considered the uncertainty of quality and quantity, as well as the timing of end-of-life products that made EOLM difficult. In line with that dilemma, Rayet al. [14] proposed the concept of an active product recovery system. They believe that, through economic incentives, there is an opportunity to enhance consumer product recycling to achieve an economy of scale. While others addressed the issue as a problem of scheduling take-back, a problem in the demand for parts or recovered products with the objective to fulfill the demand at a minimum cost. White et al. [15] presented an overview of the EOLM problems existing in each stage of the product recovery process and showed that better information about product design, product quality, and timing can improve the product EOL opportunities. Zhao et al. [16] developed a model to help the manufacturers determine optimal take-back time and the number of lifecycles for warranty purposes. In addition, some literature explored recycling facility locations and the number of resource allocations for the optimal recycling solutions [17,18,19].
As summarized above, most of the product manufacturers (recyclers) explore an end of life product recycling strategy, with the goal either to identify product recovery process to obtain maximum profits at minimum cost or to reduce the impact on the environment. Conversely, only a few papers considered the value of the consumer, but none uses consumer value to study take-back time for consumer electronics, based on our best knowledge. This motivates our study. However, if we want to reduce the environmental impacts throughout the life cycle of a product, all the different actors and stakeholders, such as designers, manufacturers, consumers, and recyclers, should participate. In this study, in order to help consumers understand the perfect timing for the take-back of a laptop computer, we have developed an assessment model from the consumer’s position and taken the point of view of a product life cycle to construct the consumer value over time. We have also considered the usage patterns of various consumer groups to obtain their different optimal take-back times and to provide different consumers with a reference for their product replacement.
This paper is organized as follows. In addition to this introduction, Section 2 develops a proposed assessment model. Section 3 illustrates the proposed assessment model using real data on laptop computers. Finally, Section 4 gives a conclusion with suggestions for future research.

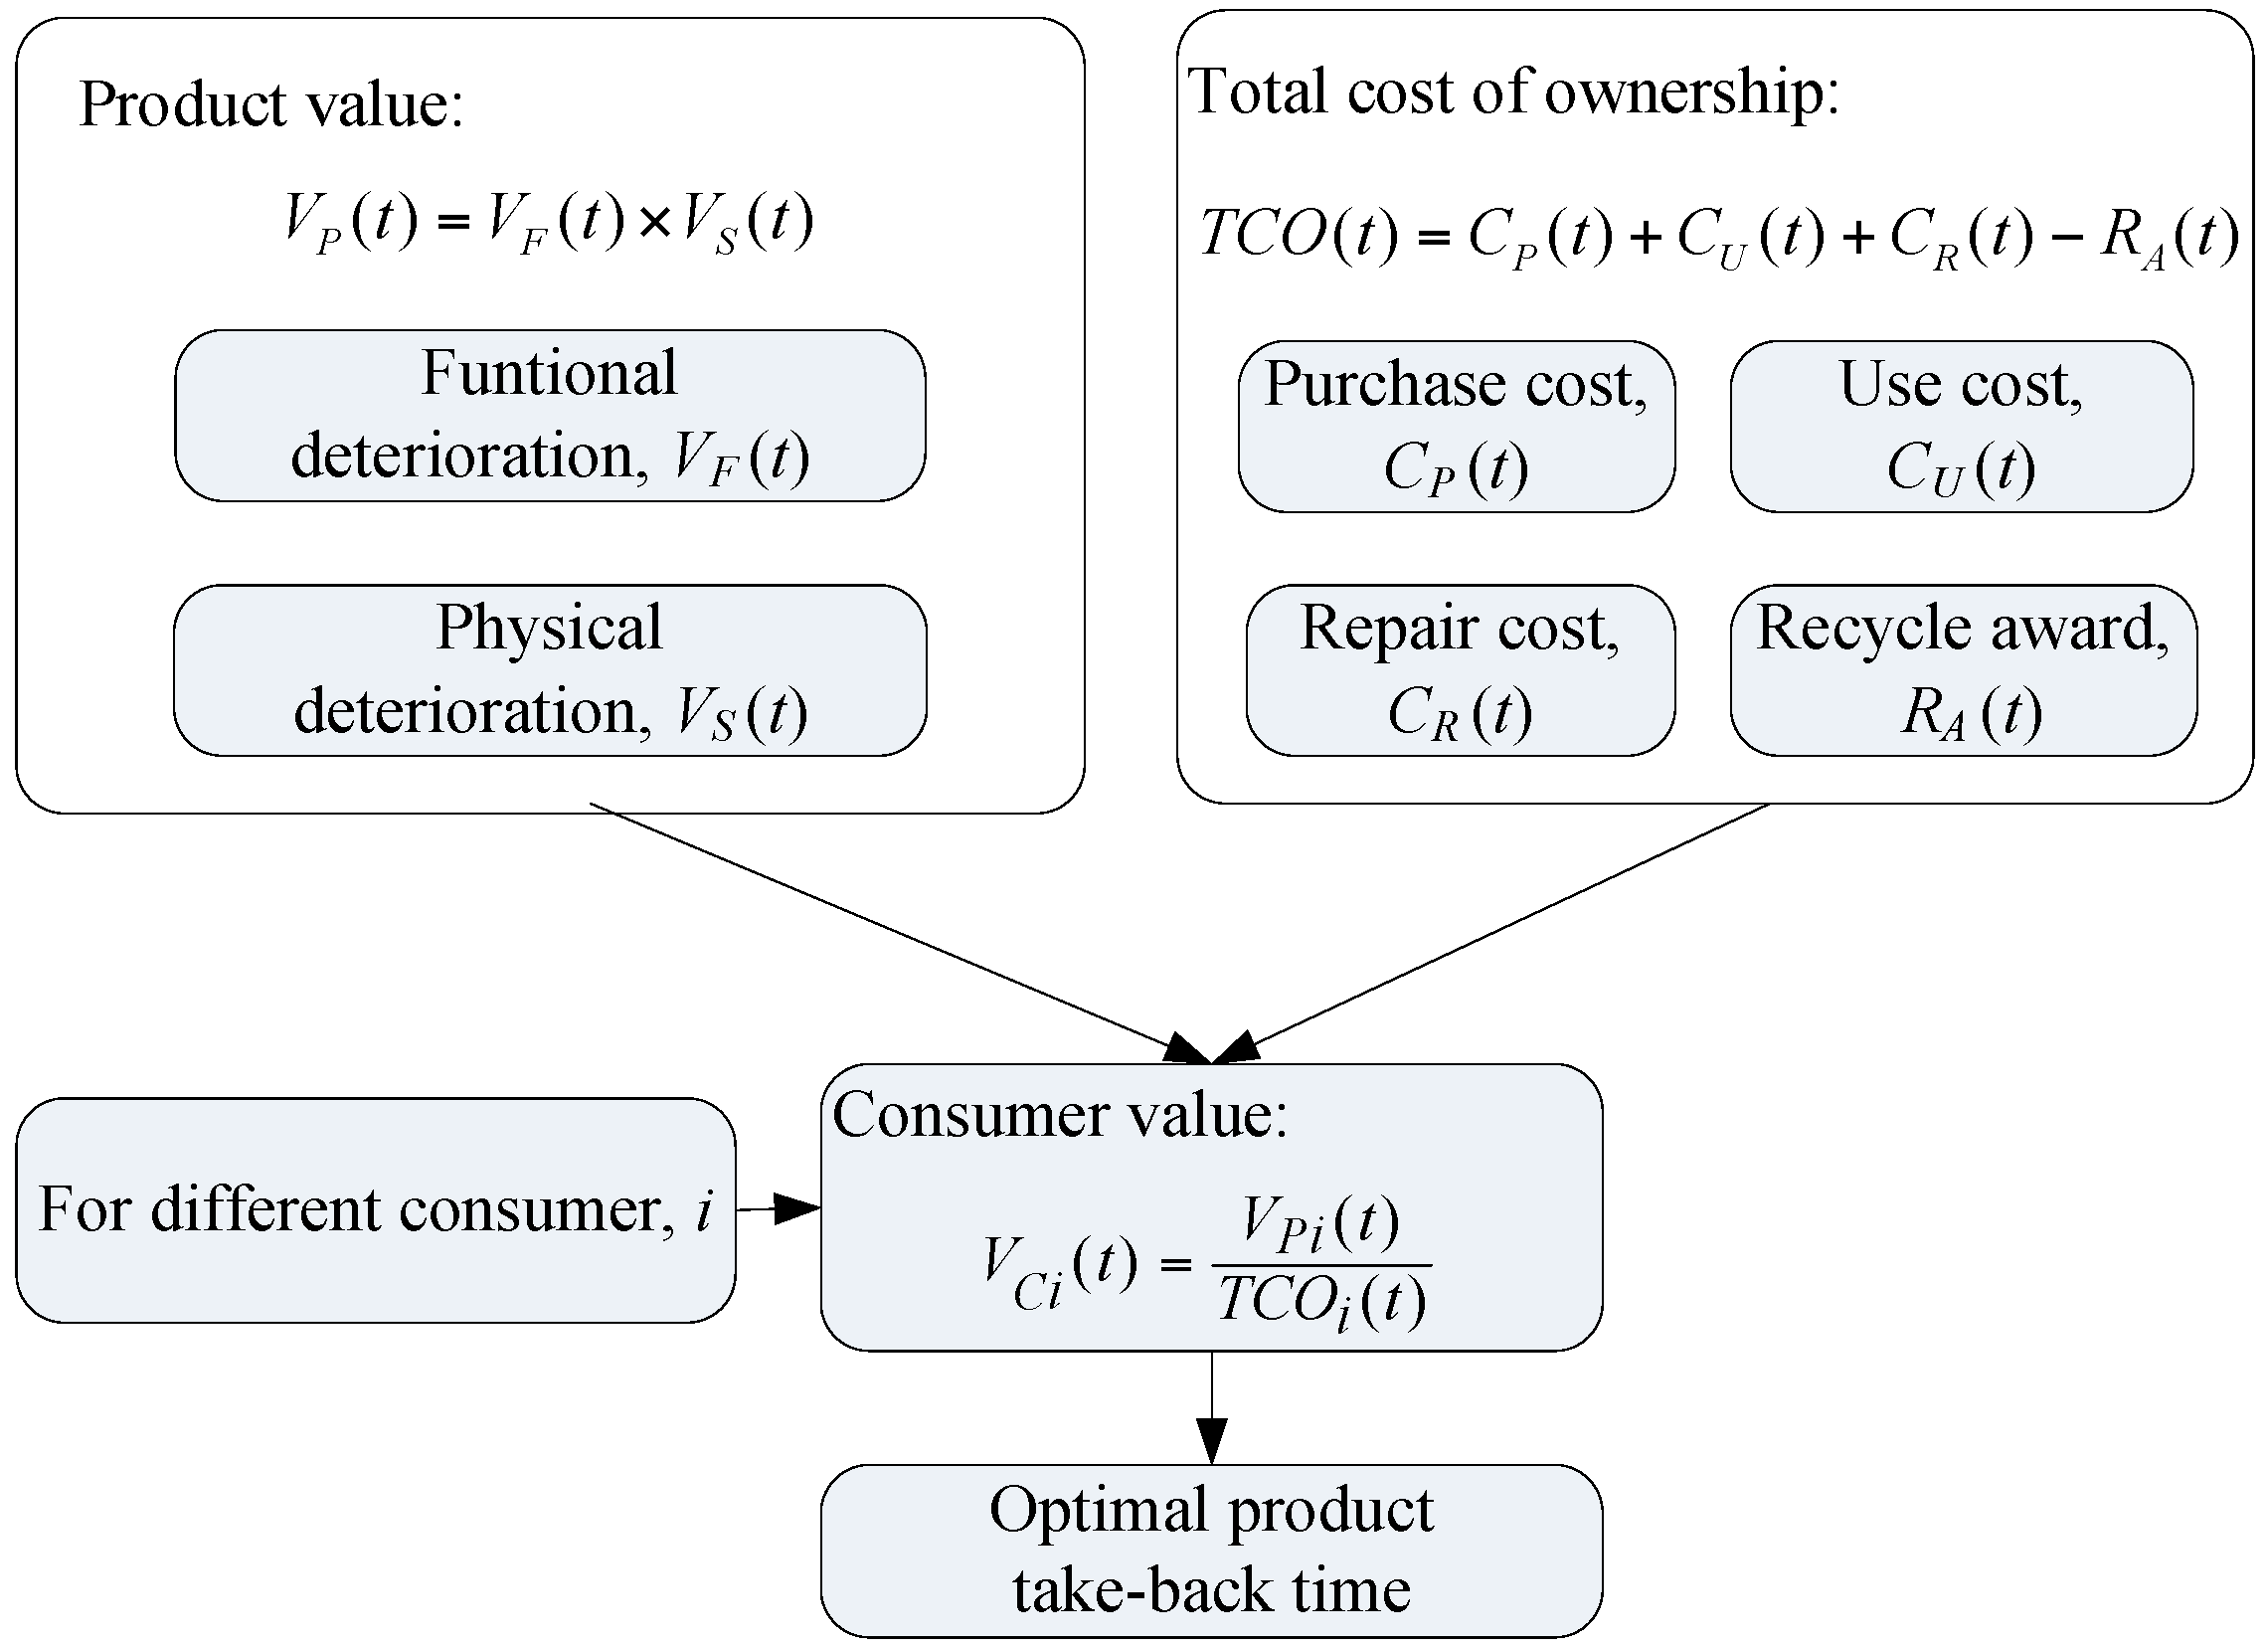
2. Model Development

Value engineering (VE) is a powerful technique to determine the best relationship between cost and value by analyzing product and process performance. It could be introduced at any point in the life-cycle of products, systems, or procedures [20]. This study proposes a consumer value model that is based on the idea of VE and the perspective of product life cycle. The consumer value is a function of time, and this study uses it to determine the optimal take-back time from the consumer aspect during the product life cycle. The consumer value (VC(t)) can be defined as the ratio of product value (VP(t)) and total cost of ownership (TCO(t)). The product value is the value that the consumer obtains in his or her holding time, and the total cost of ownership is the cost that the consumer pays in his or her holding time. They are discussed in detail below and shown in Figure 1.

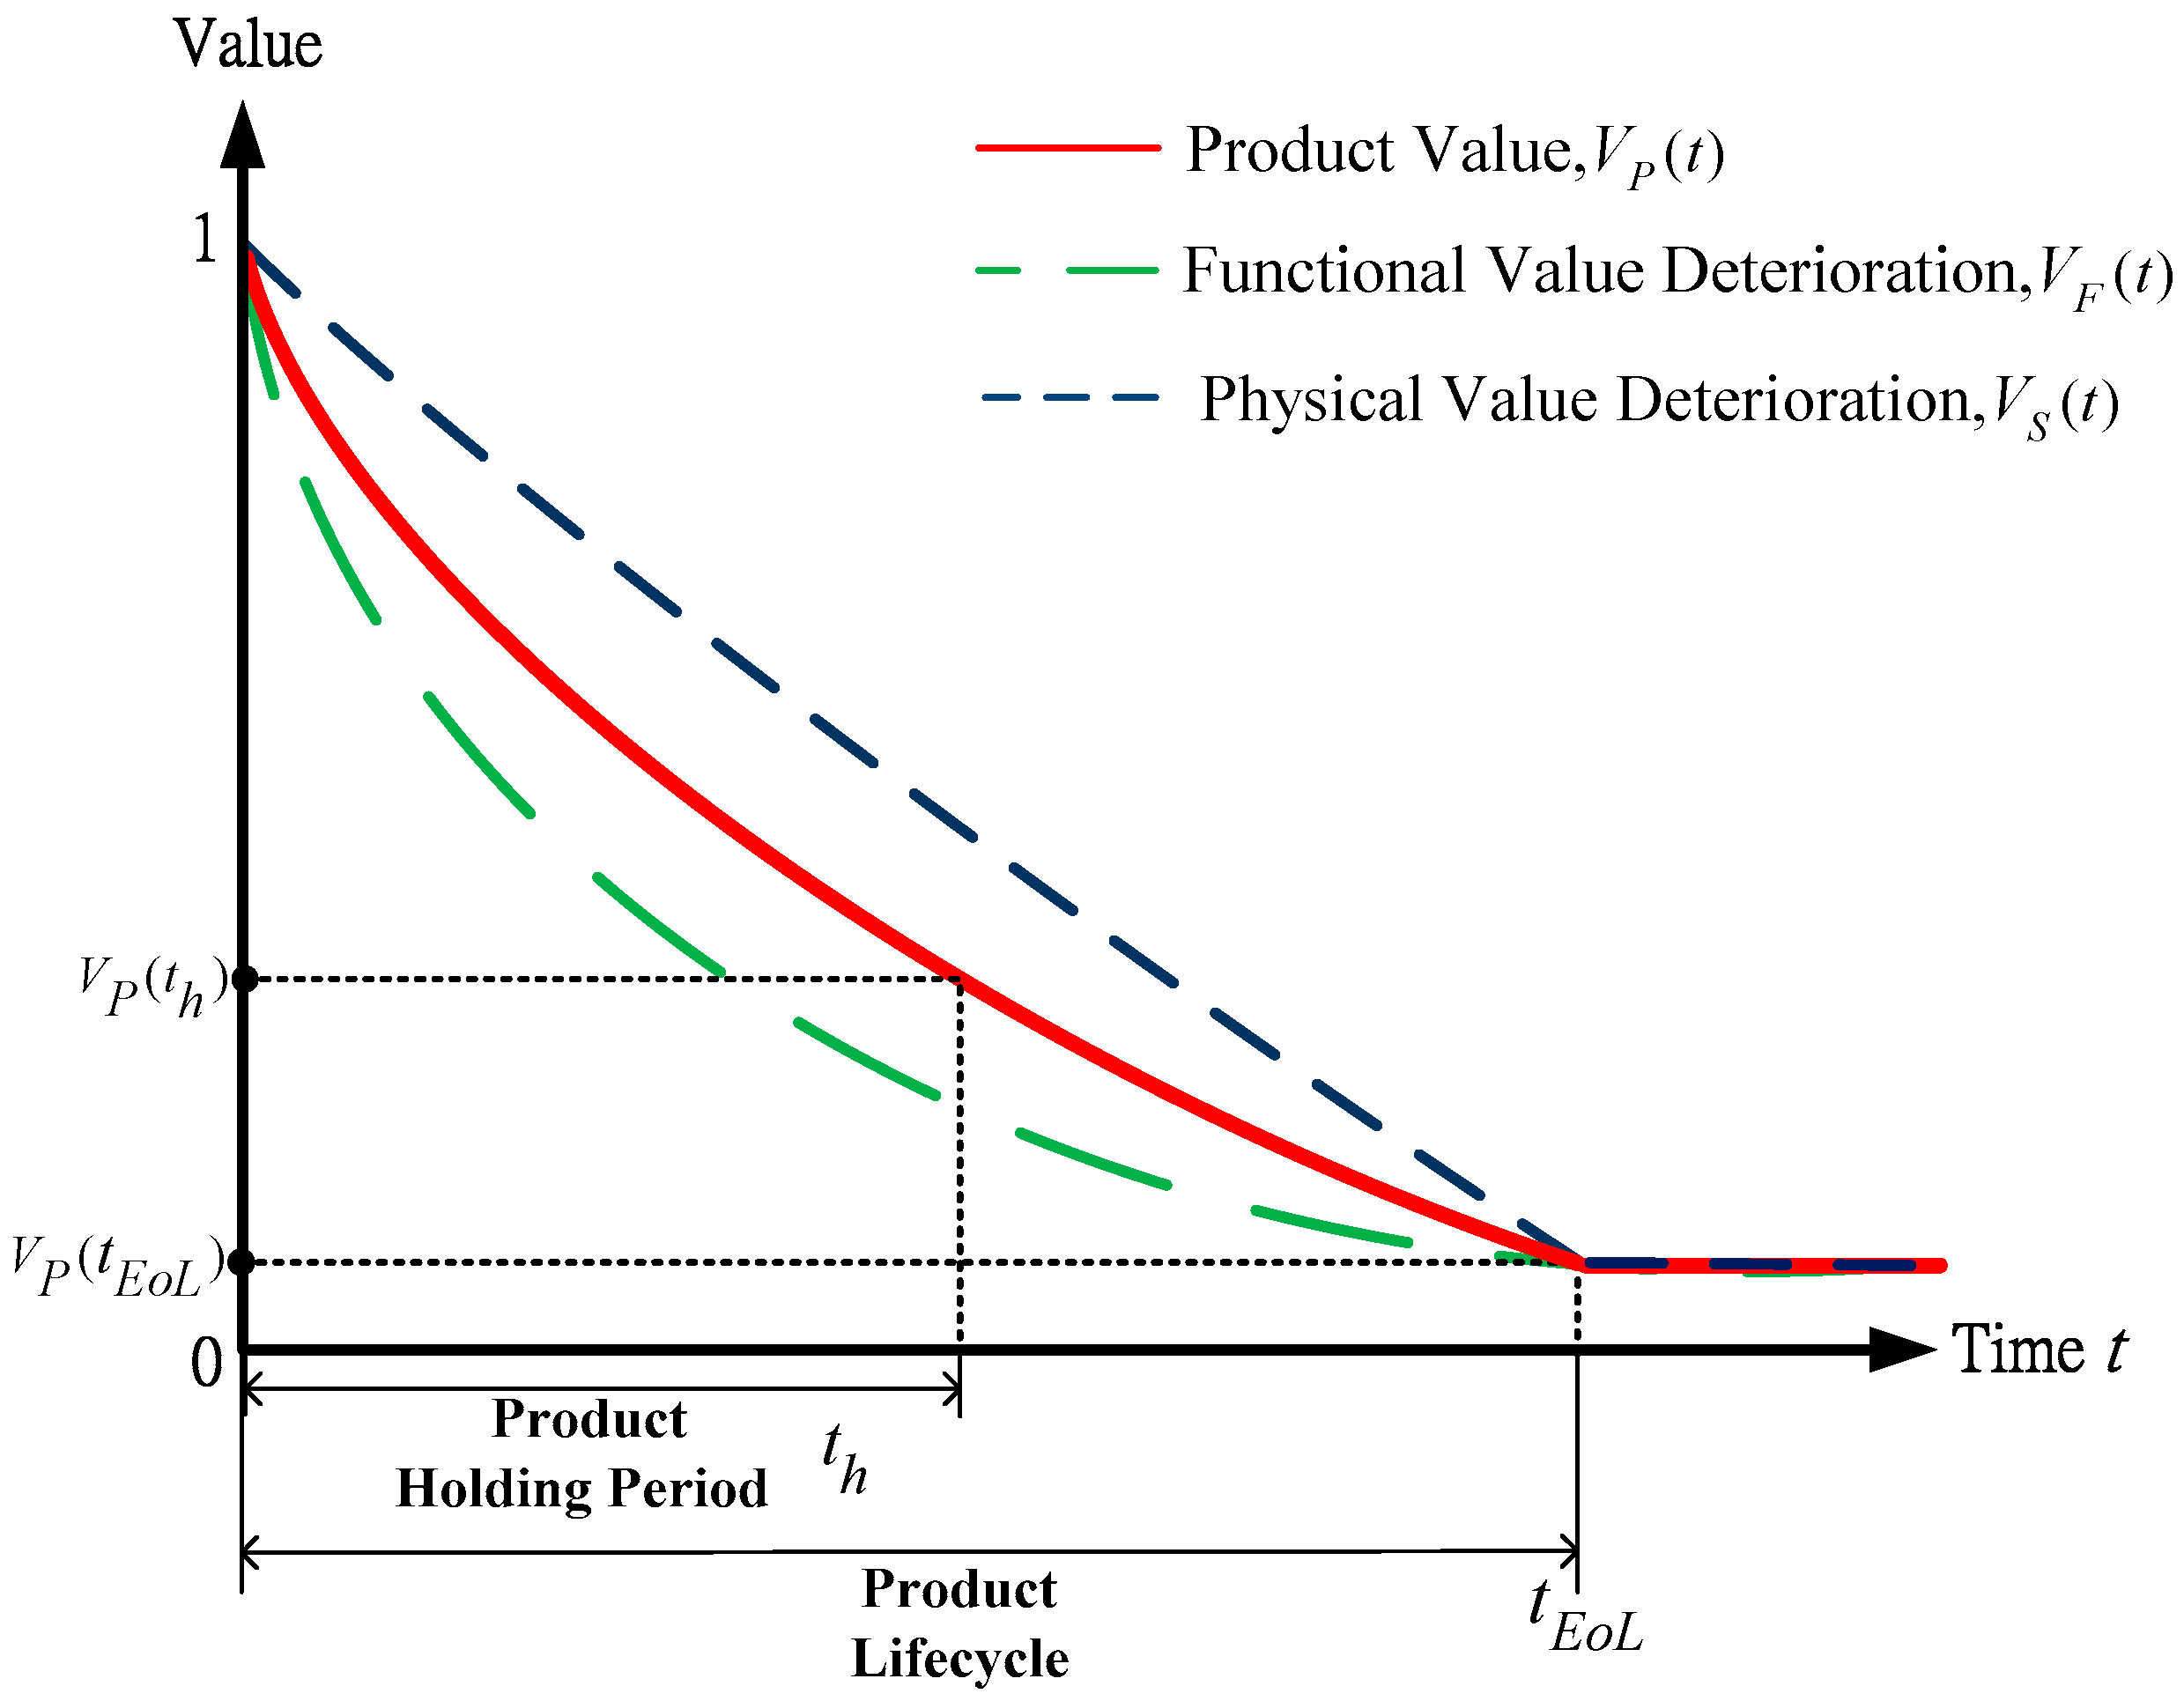
2.1. Product Value Modeling

According to the work of Kondoh et al. [21], the value of the product deteriorates over time in general. The factors that cause this recession can be classified into functional value deterioration and physical value deterioration. The functional value deteriorates with time due to obsolescence resulting from rapid technological innovation and/or changes in market trends. For example, as hard disk capacity increases, the existing product capacity no longer meets consumers’ expectations. The physical value deterioration may also decrease due to the aging and wearing off of product components. For example, LED screen brightness may fade away and even malfunction with the time. This study employs Equation (1) to model product value (Vp(t)) that incorporates functional value (VF(t)) deterioration and physical value (VS(t)) deterioration. We use different weightings, wF and wS, respectively, to denote different ratios for both the functional value and physical value for different products.
V P ( t ) = ω F × V F ( t ) + ω S × V S ( t )   w h e r e ω F + ω S = 1 , 0 ω F , ω S 1
Figure 2 below shows that at t = 0, VF(0) and VS(0) are equal to 1 ideally in the beginning. However all values decrease as time goes by. The solid line represents the product value, when consumers are holding product at time th, the product value is VP(th); when holding time t reaches the product’s end-of-life, the product value will decrease to VP(tEoL). To note, at the end-of-life point (tEoL), the product value drops. Henceforth, it represents the lower economic benefit of recovery. The conclusion can be ascertained from the diagram that those who store their unused valuable items at home instead of recycling them not only lose the best timing to retrieve residual profits but also leave products to decay. Therefore, consumers should be encouraged to recycle their products in an appropriate time to improve economic efficiency for product recovery and consumer value.

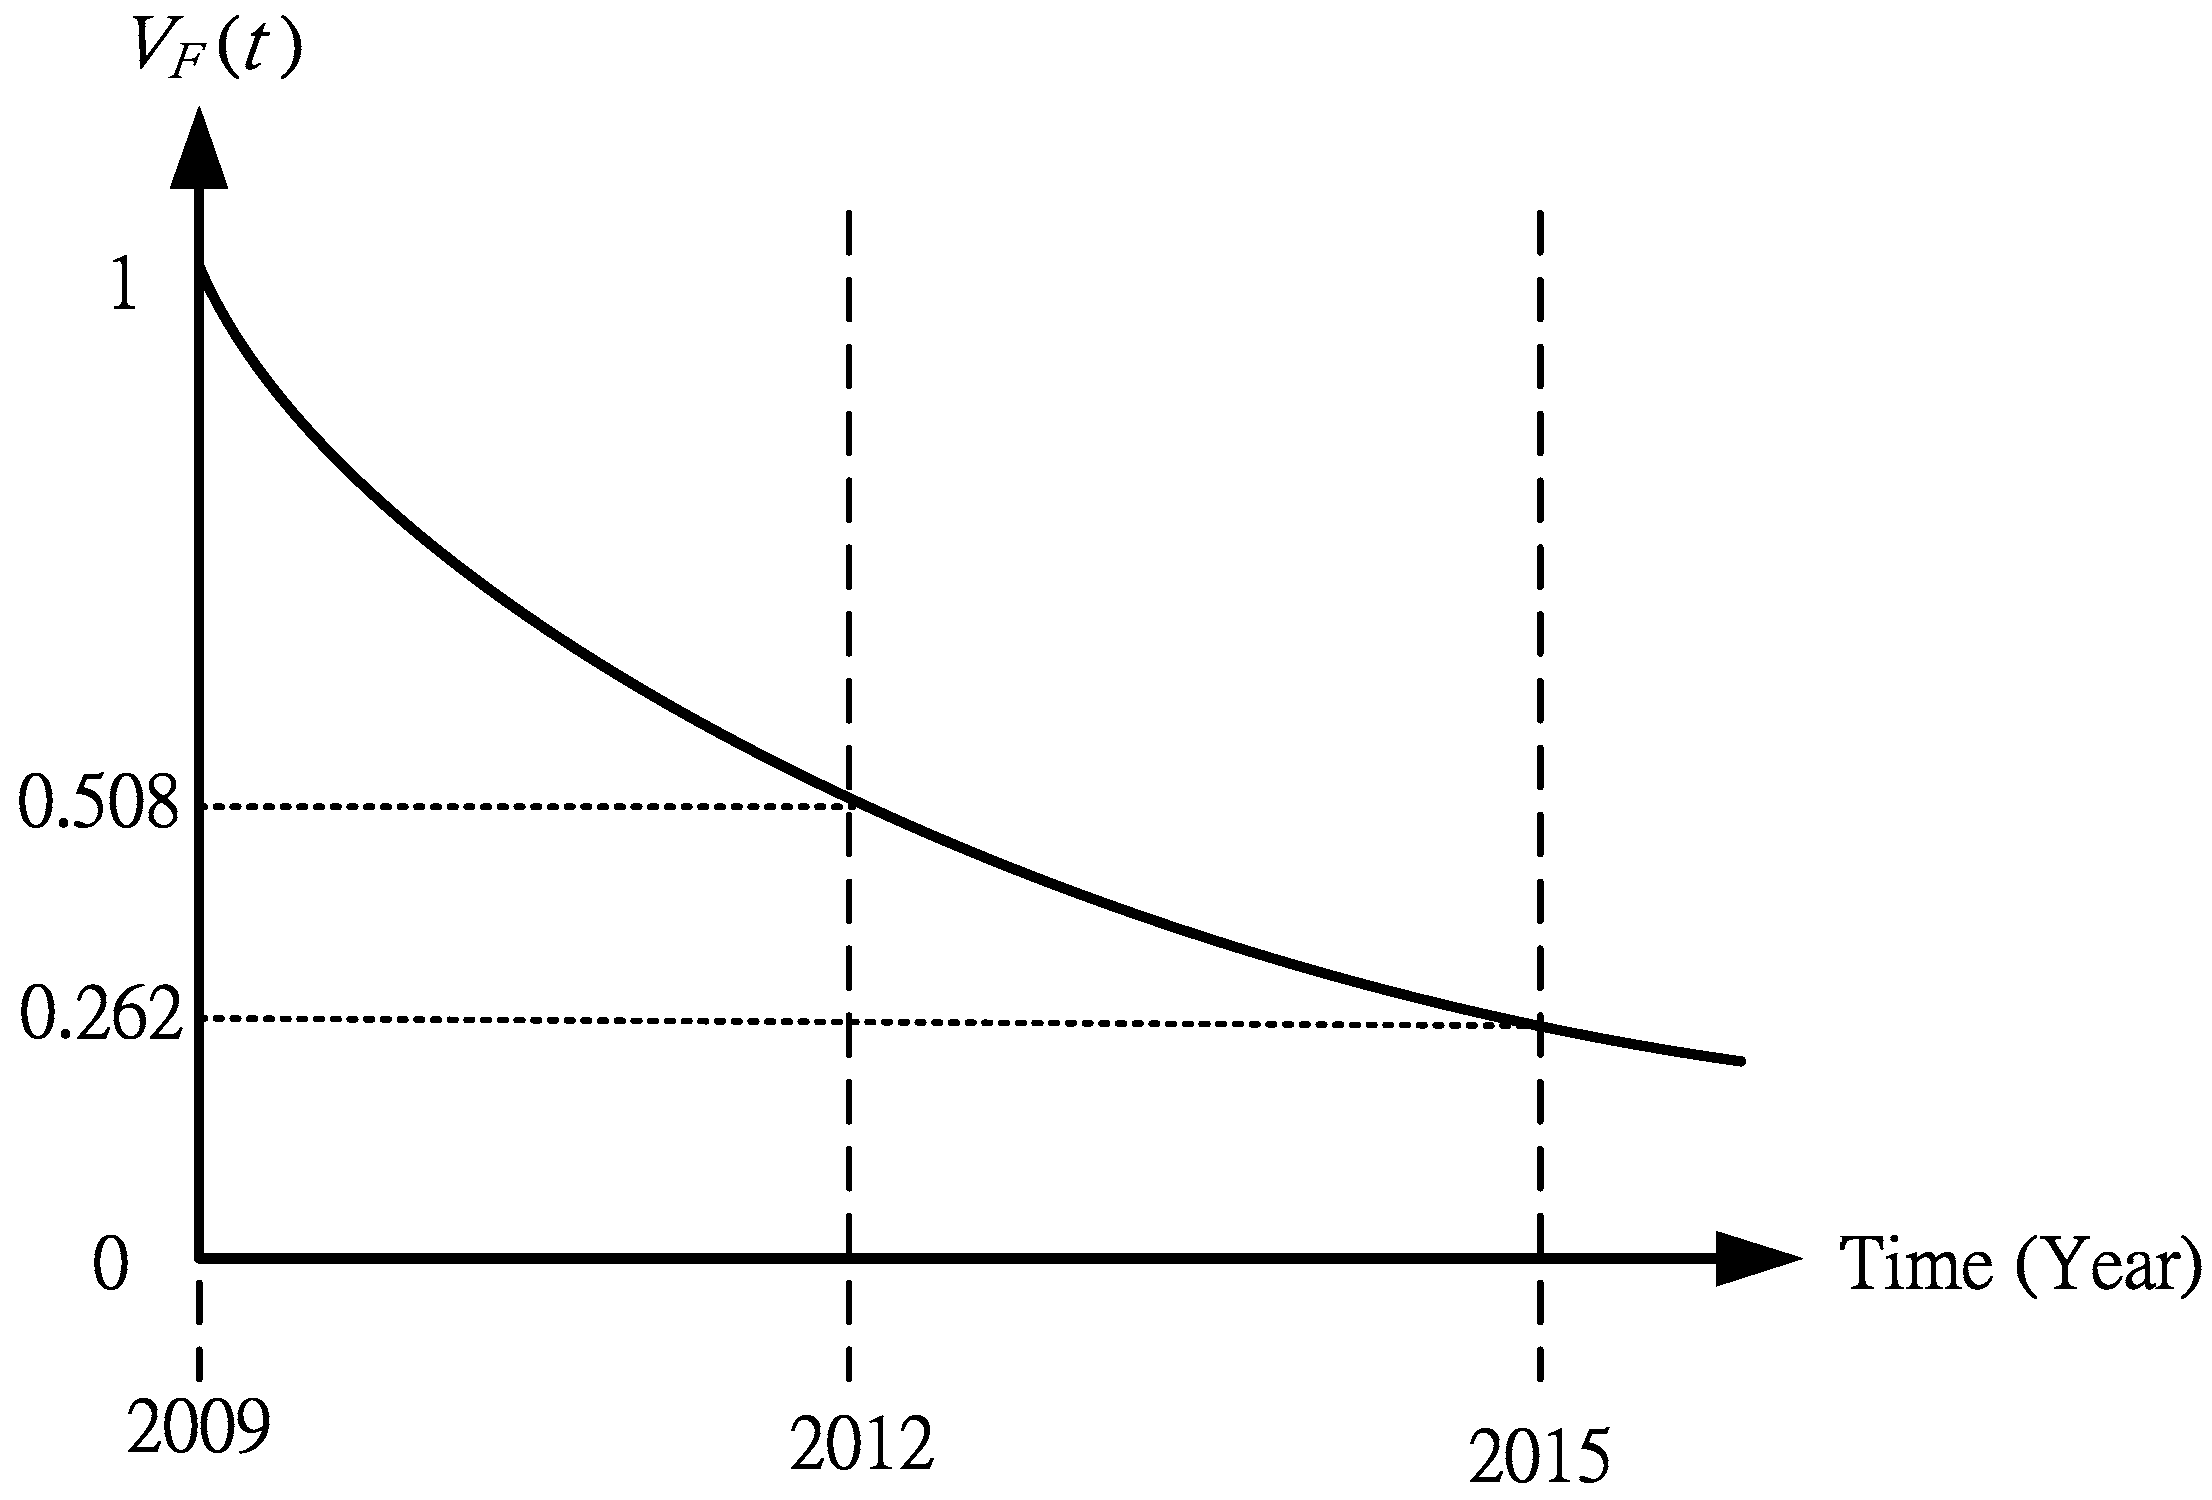
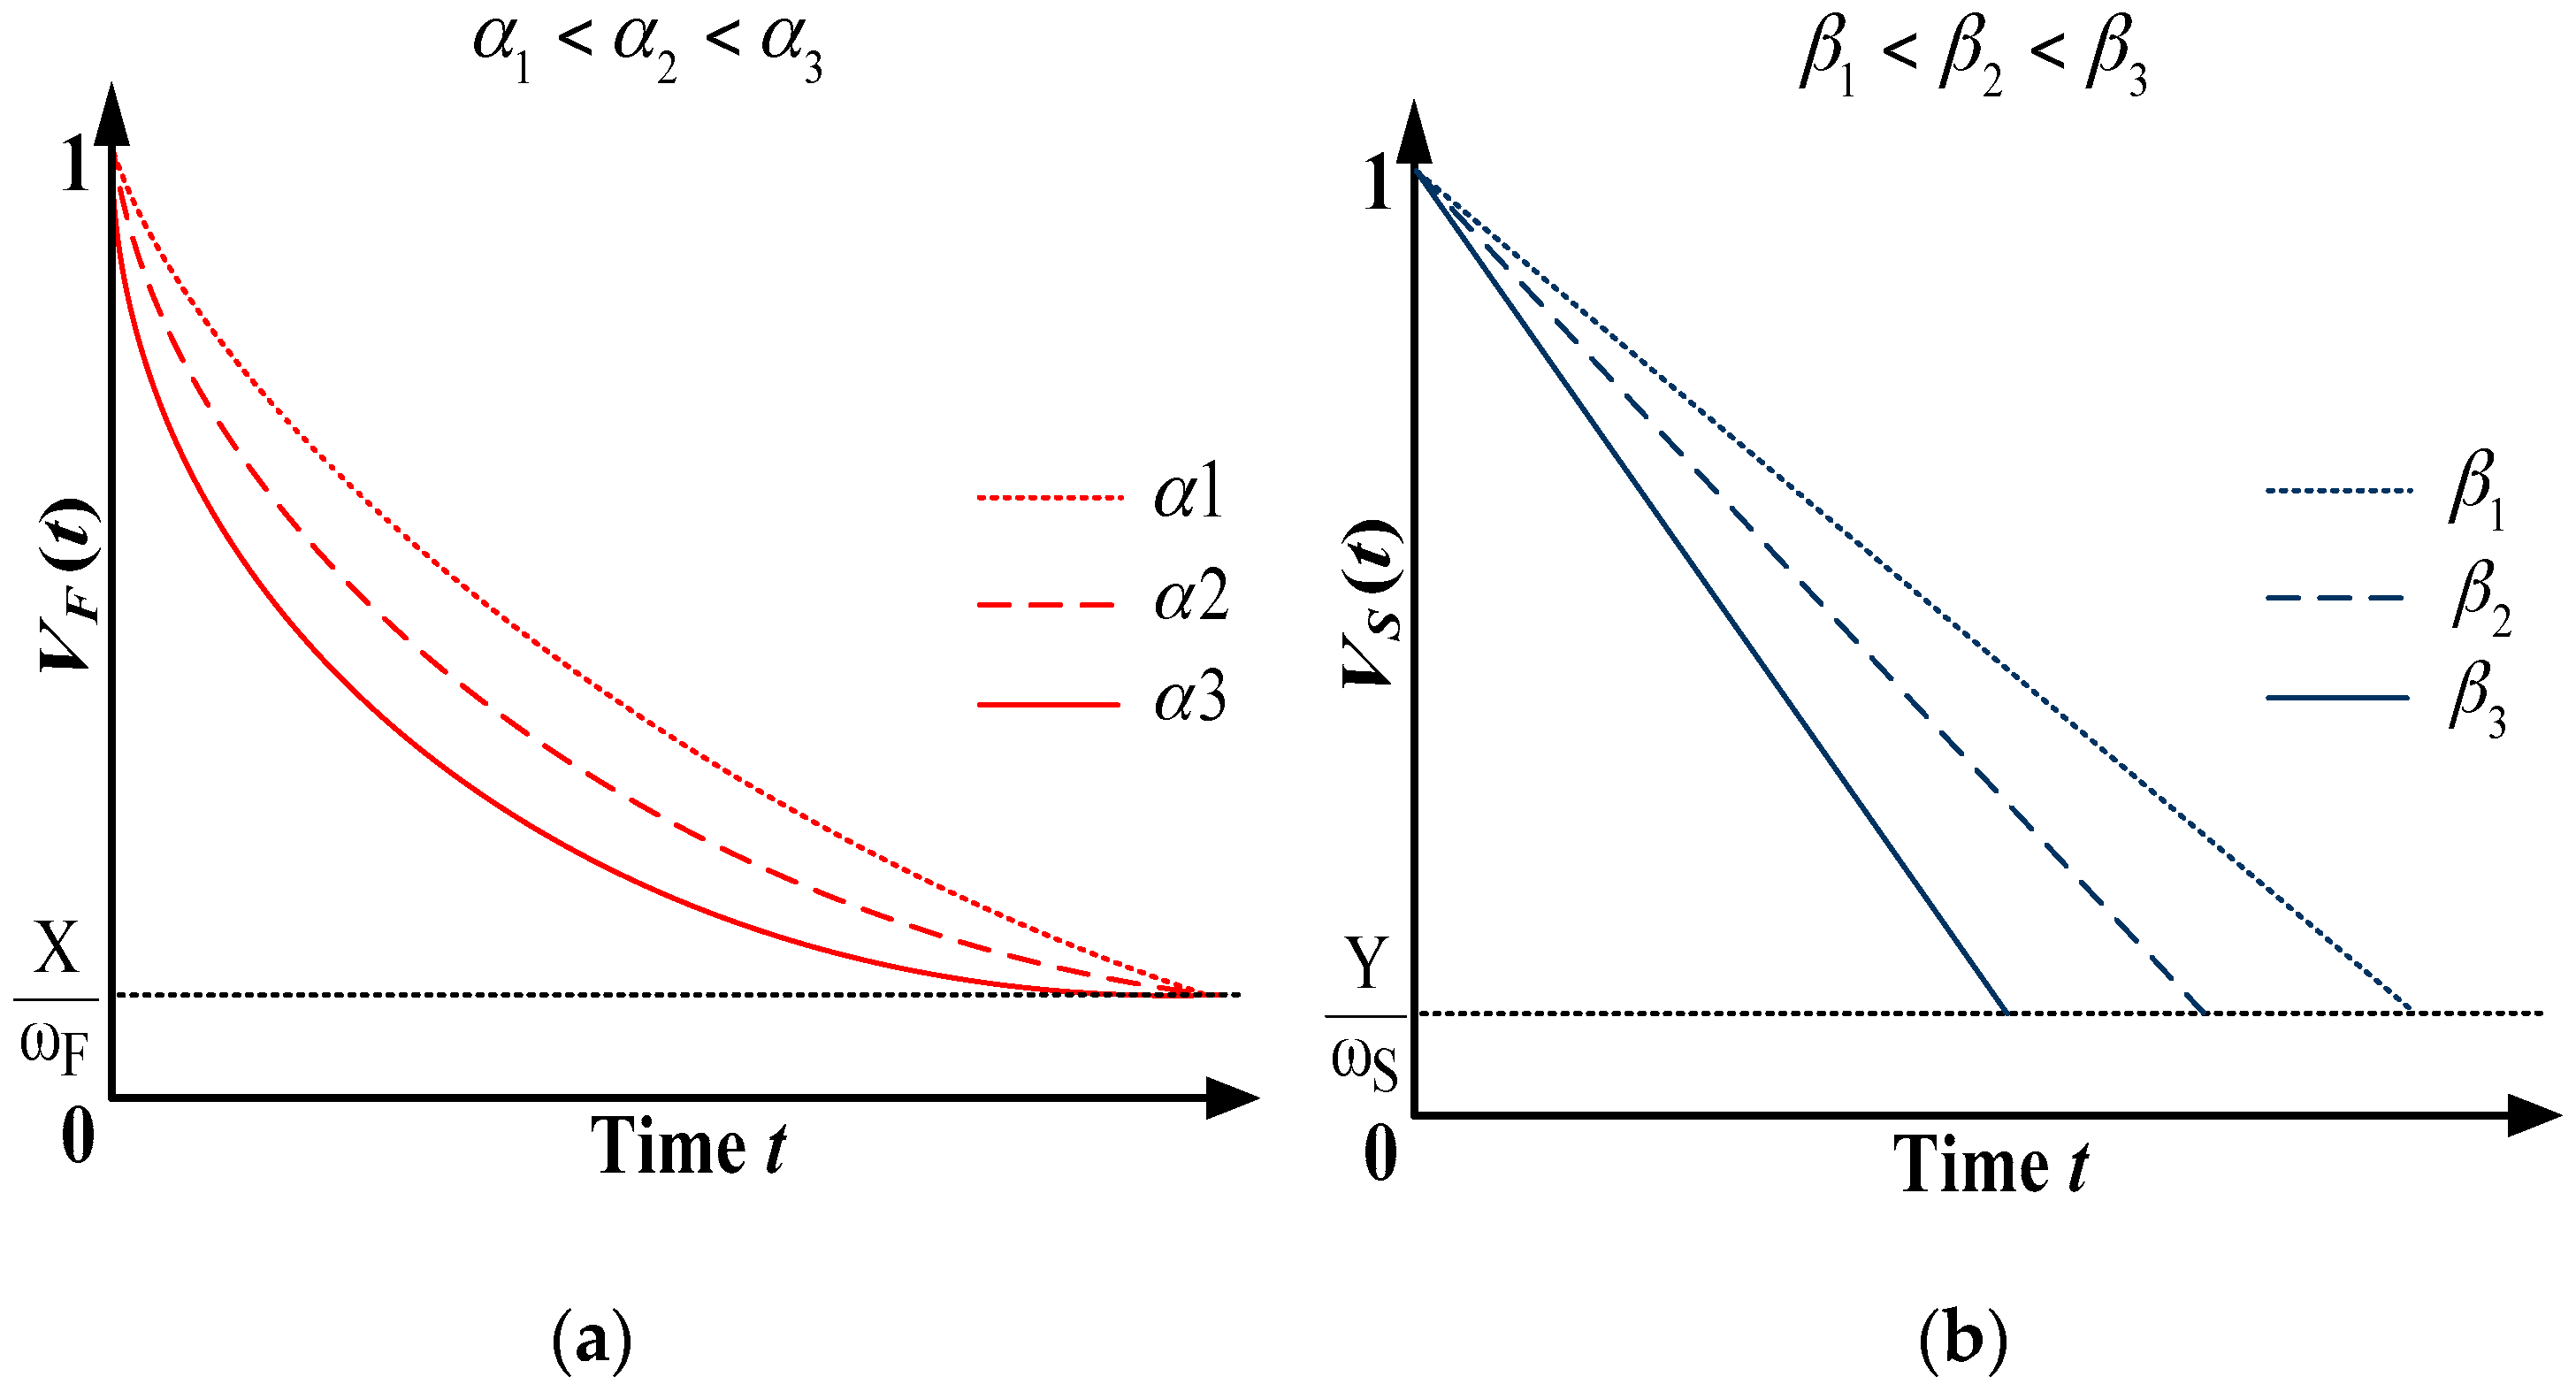
2.1.1. Functional Value and Physical Value Deterioration Model

This study modifies the work of Yeh [22] and considers a more general situation to assume that the functional value deterioration model follows an exponential distribution and the physical value deterioration model follows a linear distribution, as shown in Equations (2) and (3), respectively:
V F ( t ) = ( 1 X ω F ) × e α × t + X ω F , 0 X , 0 t , 0 < α
V S ( t ) = ( Y ω S 1 ) × β × t + 1 ,   0 Y ,   0 t , 0 < β
where t denotes holding time counting after the product is bought. VF(0) = VS(0) = 1, VF(∞) = X / ω F and VS(tEoL) = Y / ω S . X / ω F and Y / ω S denote the residual value of the functional performance and the physical performance, respectively, when t approaches ∞ or the time longer enough. Actually, when the product reaches its end-of-life (tEoL < ∞), its residual value is the material value for recycling. The rate of functional value deterioration is denoted by α, and different products have different α values. When α is greater (such as for a worse performance product, like α3), the value declination is greater, otherwise it is lesser, as shown in Figure 3. For the physical value, the rate of physical value deterioration is denoted by β, and different groups of users have different β values. For higher frequency use persons, who have greater β values (like β3), the value declination is greater and products reach their end-of-life earlier. The discussion of α and β in detail is shown later.

2.1.2. Modeling the Deterioration Rate of Functional Value

Many companies (Fujitsu, Mitsubishi, Hitachi, and Toshiba from Japan) have already adopted the Factor X method to assess the degree or rate of progress of a new product. Although the calculations of the rate are different, the concept is similar and is used in evaluating product specifications to compare the reference product specifications and to obtain the total function progress rate of the evaluated product.
Fujitsu’s Factor X method [23] used the root mean square (RMS) concept to calculate the product overall progress ratio; Mitsubishi’s Factor X [24] used the arithmetic mean (average) to calculate the product overall progress ratio; and Toshiba’s Factor T [25] used the quality function deployment (QFD) method to obtain the weight of user demand, then multiply it with the specific progress rate, and finally sum up the total value to get the product overall progress ratio. We modify the Factor T method and express the functional deterioration value in Equation (4). The goal of this equation is to obtain the product overall rate of deterioration.
Functional   deterioration   value = Evaluated   product   specifications   ( old ) Reference   product   specifications   ( new )
The calculation steps of functional deterioration value are the following:
(1)
Determine a product to be evaluated (Ep) and a product that is comparable to the reference product (Rp).
(2)
Identify key specifications of the product (m = 1, 2, …, M).
(3)
Choose the most significant attributes or functions for each key specification, then find their performance (Epm is the performance of key specification m of the evaluated product).
(4)
Apply the weighting factor ( ω m ) to express the contribution of each key specification.
(5)
Determine the key specifications progress vector, when the progress vector goes up, the better the performance is; and use Equation (5) to find each attribute’s performance. When the progress vector goes down, use Equation (6) for the calculation, where Rpm is the performance of key component m of the reference product.
Multiply the attribute’s performance by the weighting factor and sum the value of the total specifications to obtain the total deterioration value of product (Dp), as shown in Equation (7). Substituting Dp into Equation (2), we can obtain α:
D p m = E p m R p m for the case of larger the better
D p m = 1 E p m 1 R p m for the case of smaller the better
D p = m = 1 M D p m × w m

2.2. Total Cost of Ownership Model

The HP Corporation [26] defined TCO to provide the consumer with the direct and indirect cost of IT product evaluation. Ellram [27] indicated that, in general, the TCO of products should include acquisition cost, use cost, maintenance cost, and other relevant costs. This study assumes that the consumer is required to pay the total cost of product, including the product purchase cost, CP, product use cost, CU, product repair cost, CR, and the recycling award, AR. Equation (8) shows the time function of TCO, and each cost will be discussed in the following sub-sections.
T C O ( t ) = C P ( t ) + C U ( t ) + C R ( t ) A R ( t )

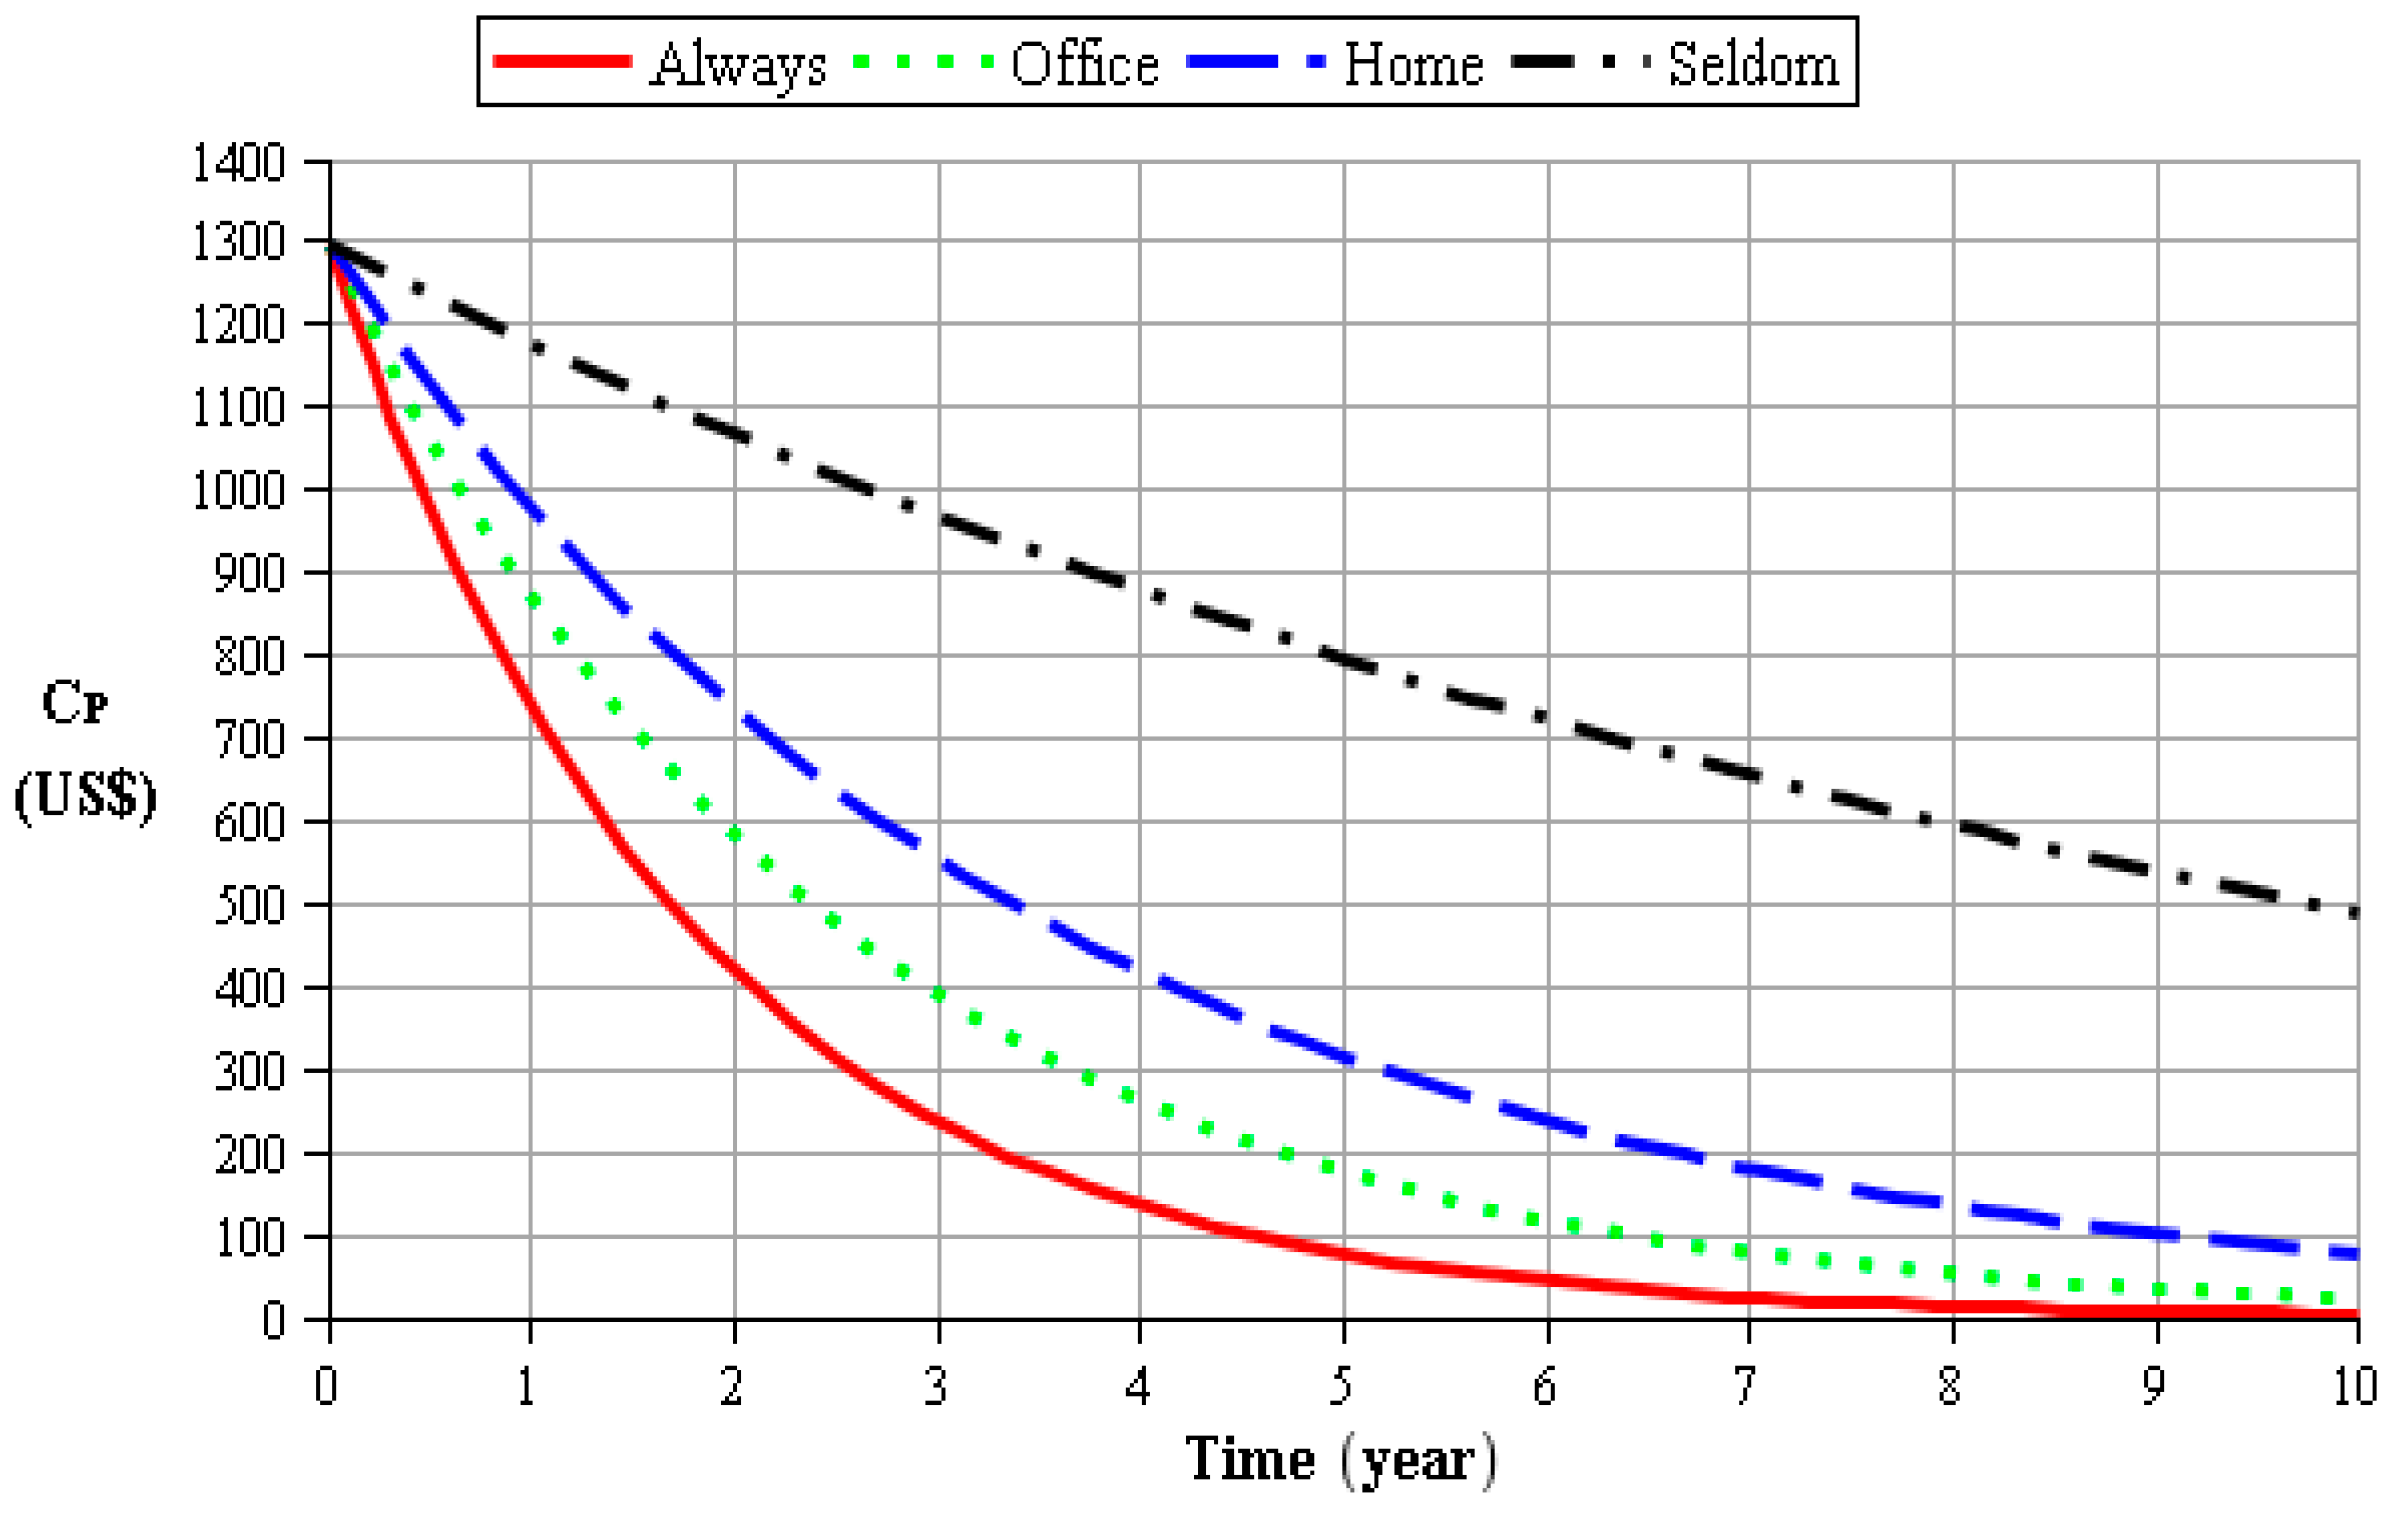
2.2.1. Purchase Cost Modeling

The time function of product purchase cost, CP(t), is the product market value with respect to time. The market value will decrease as the use time of product increases, as shown in Equation (9).
C P ( t ) = P × e γ × t
where P is the sale price of the product and γ represents the deterioration rate of product price.

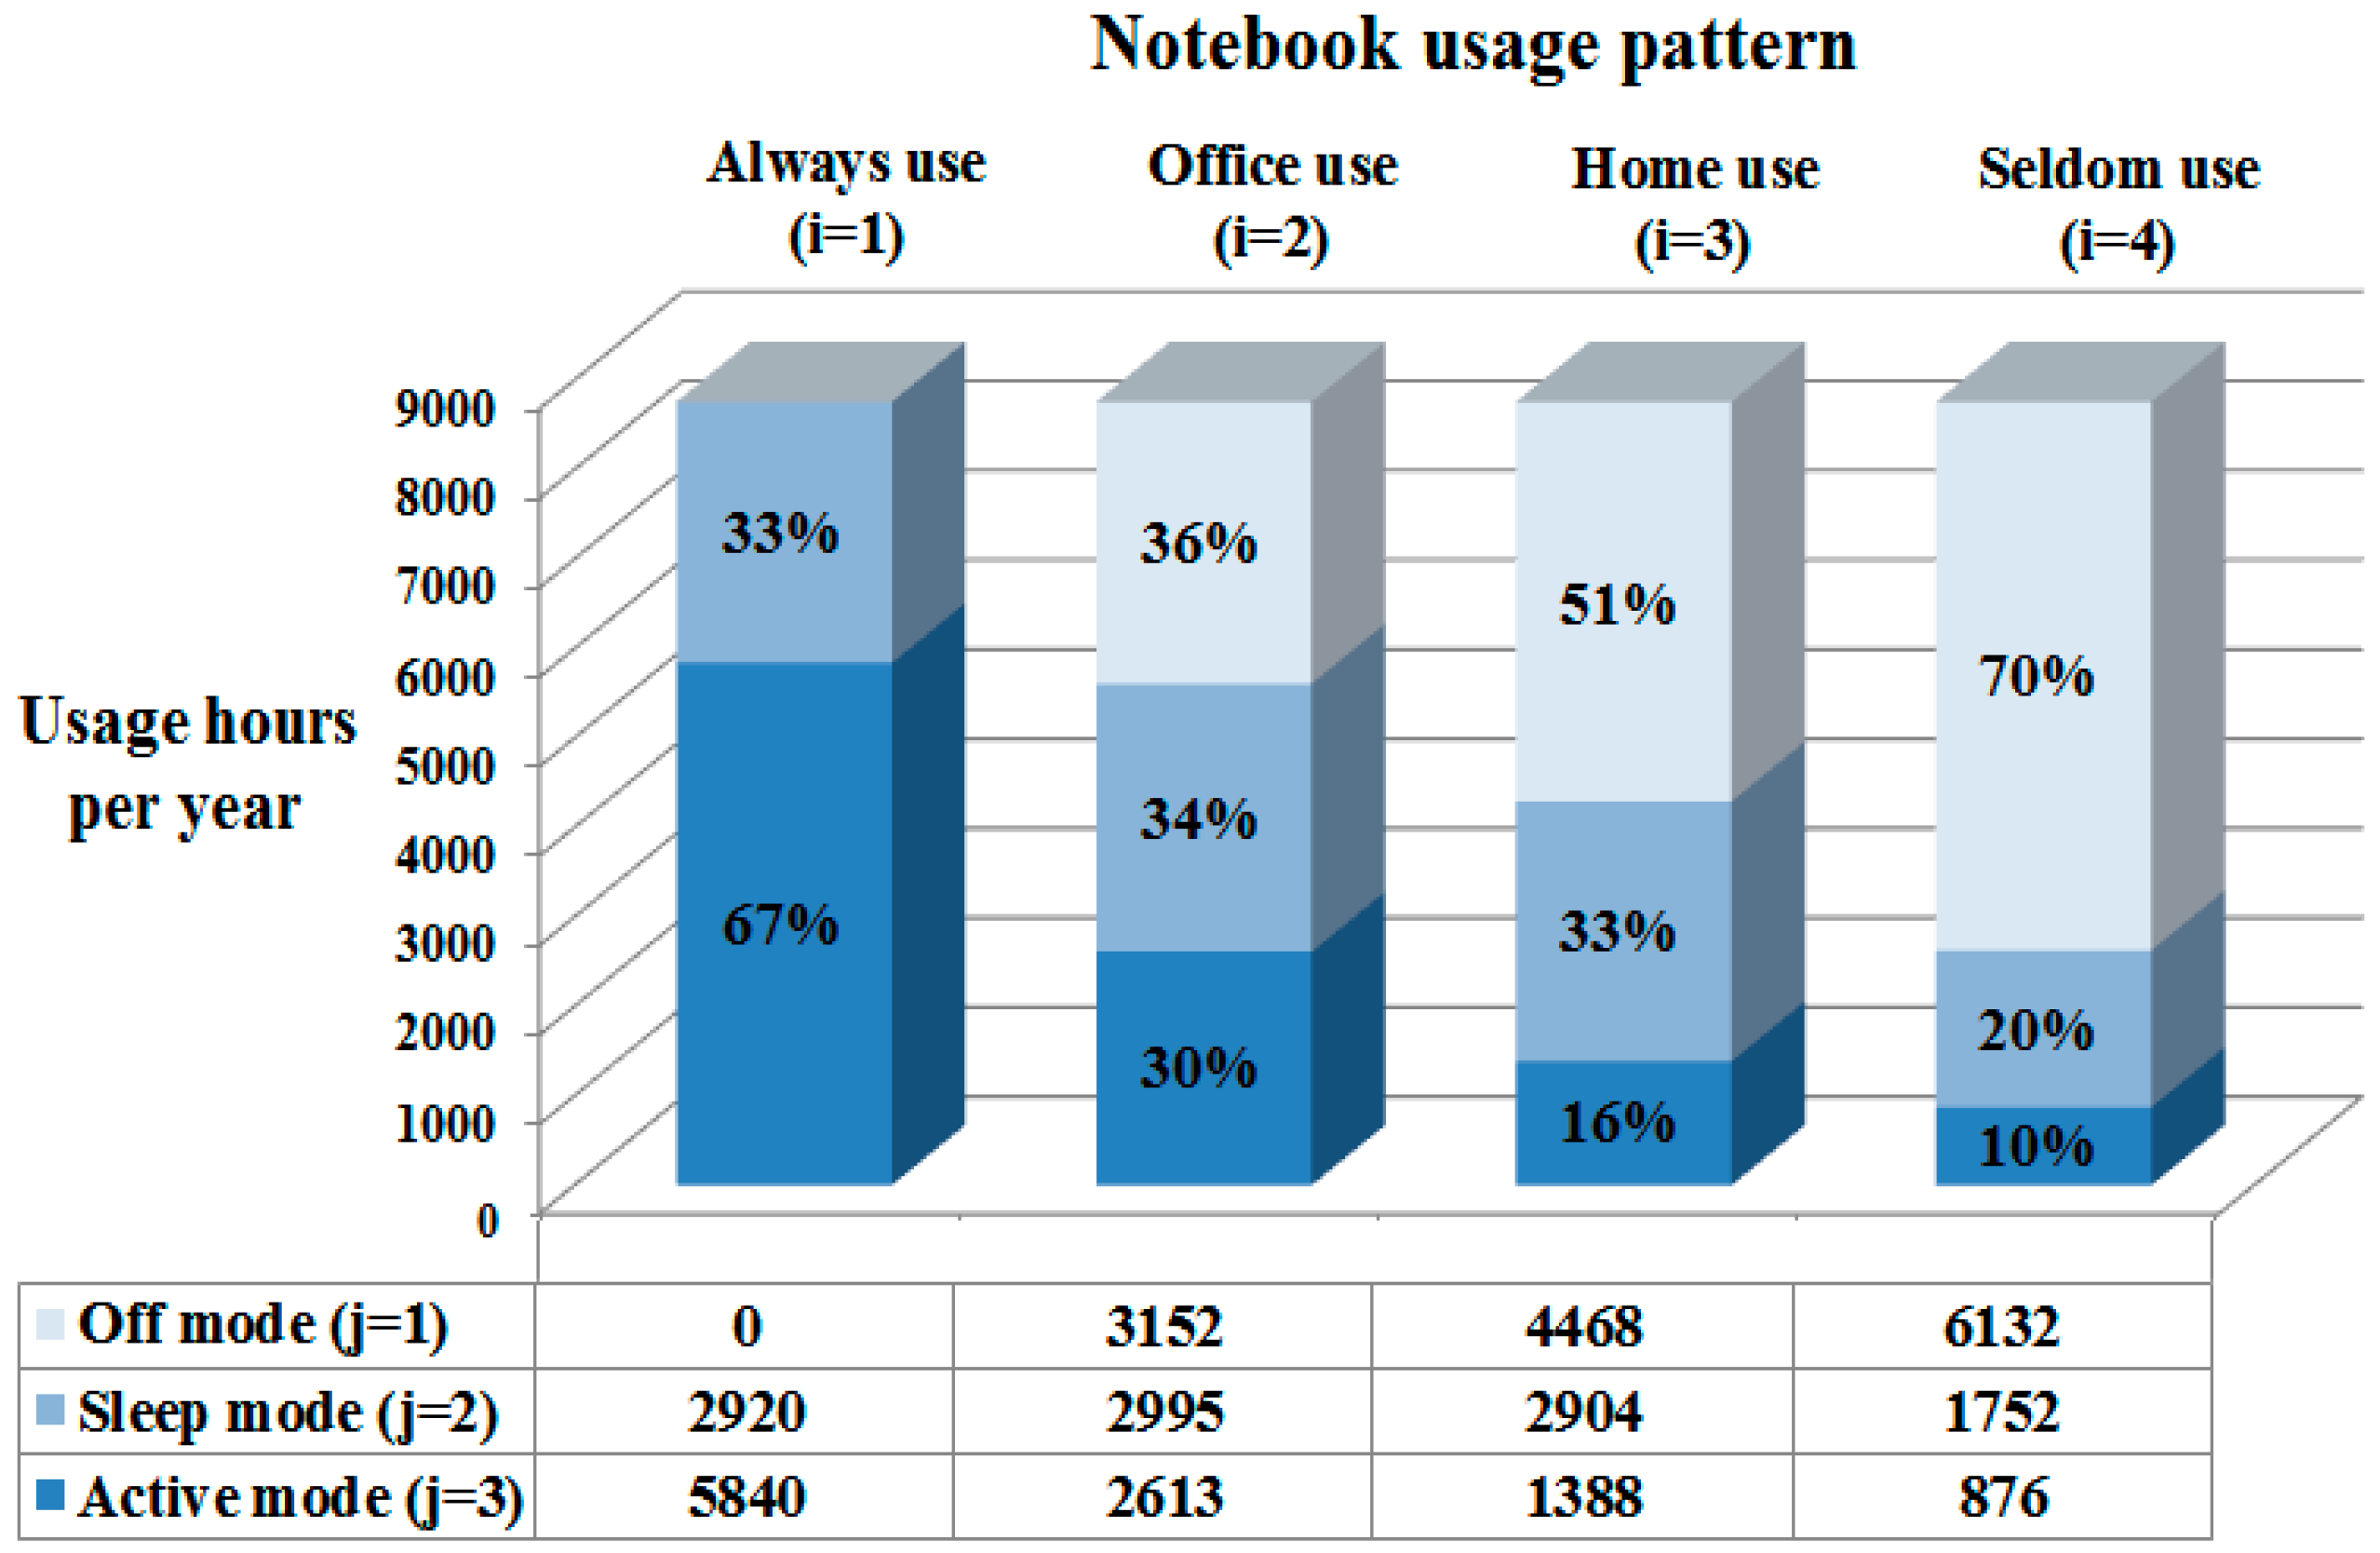
2.2.2. Use Cost Modeling

We define the time function of product use cost to be the total cost of electricity consumption under different user scenarios. According to the report of the EuP Lot3 final report [28], the consumer use model can be divided into three modes; off (j = 1), sleep (j = 2), and active (j = 3). The off mode is the wattage consumed (kw1) in soft off. The sleep mode is the wattage consumed (kw2) in several low energy consumption states, none of them permitting interactive usage. The active mode is the wattage consumed (kw3) in all power states between idle and high (maximum power usage). The cost of kilowatt hour (kWh) consumption required for mode j at time t, Uj(t), is shown in Equation (10).
U j ( t ) = h ( t ) × r j × k w j × c ,  for  j { 1 , 2 , 3 } ,   t 0
where h(t) is the number of hours in t years, rj is the percentage of each mode per year, and c is electricity cost per kWh. The use cost of the consumer is the sum of the cost spent at the three modes, as shown in Equation (11).
C U ( t ) = j = 1 3 U j ( t ) , t   0

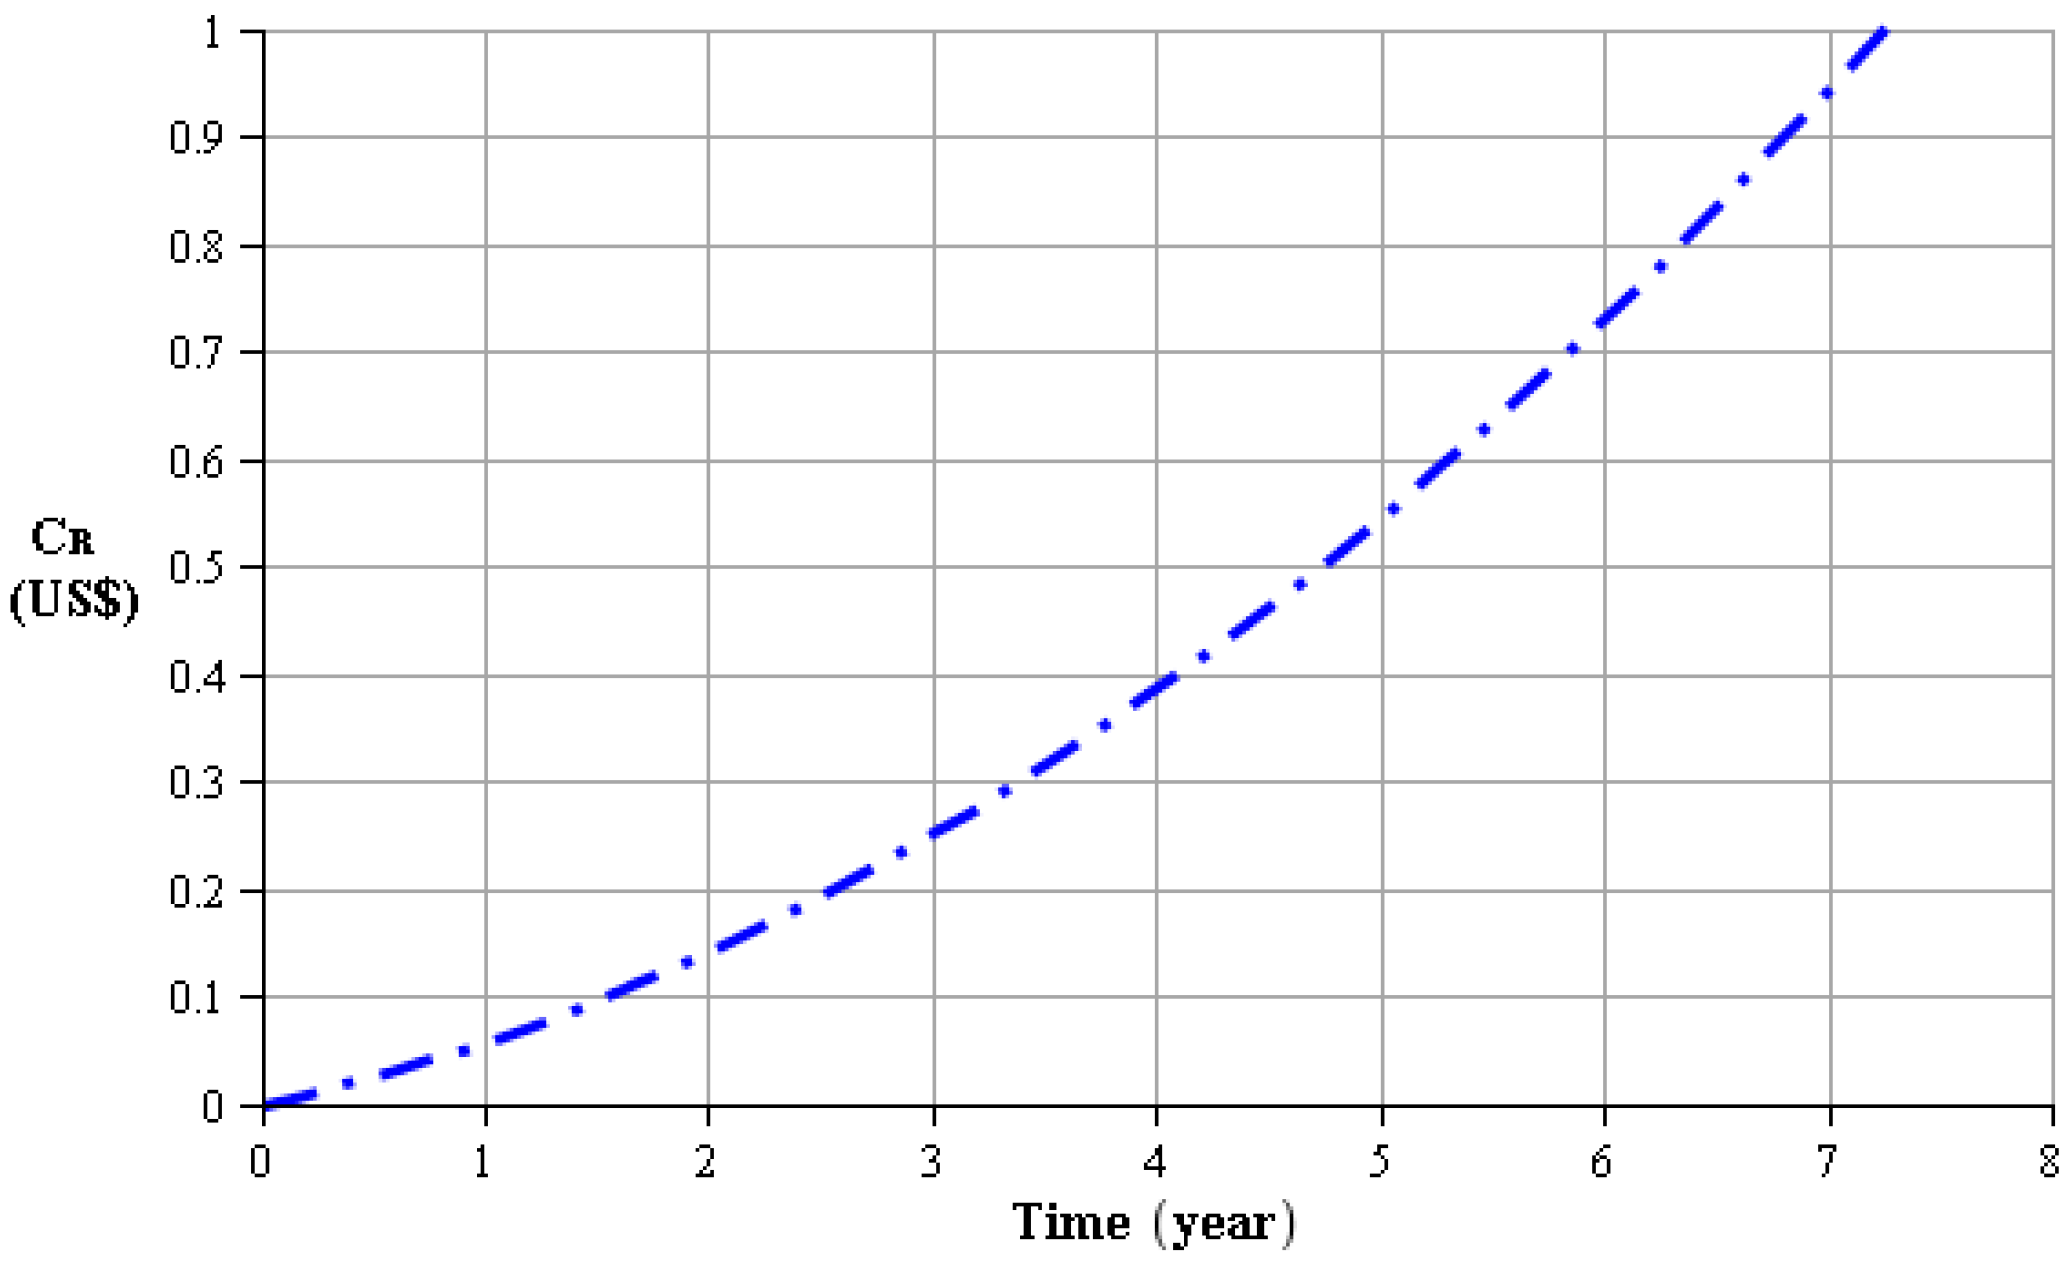
2.2.3. Repair Cost Modeling

The product repair cost is defined as the cost it takes to repair the product as time passes. We do not consider the product warranty, as shown in Equation (12).
C R ( t ) = R × f ( t )
where R is denoted as the total repair cost of the product during the holding time and f is the cumulative failure rate of the product in holding time, and we use a quadratic function of time to simulate it, as shown in Equation (13).
f ( t ) = g × t 2 + h × t + v
where g and h are coefficients and v is a constant value that we obtain from a curve fitting method.

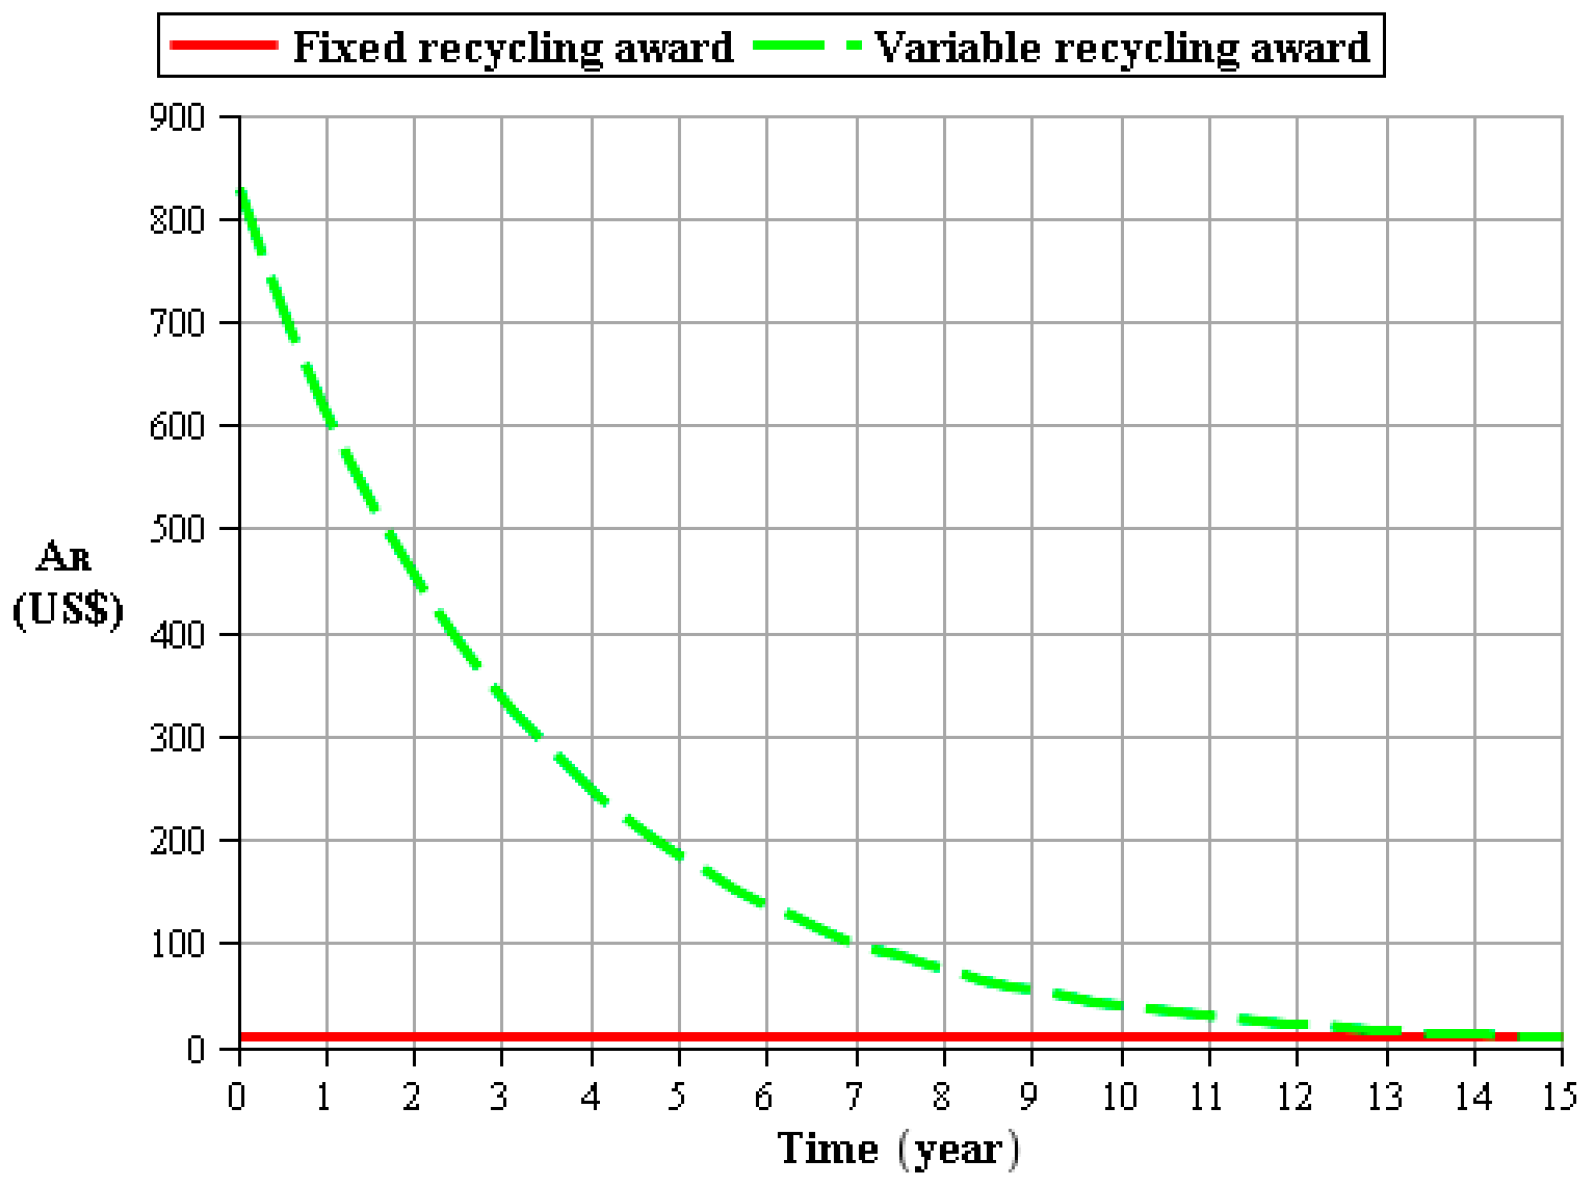
2.2.4. Recycling Awards

The product recycling award, which is a function of time, is defined as an award given by the recycler for the used product recycled from the consumer due to the residual value of the used product. Based on the recovery option of the EOL product [29,30,31], the recovery option can be divided into three recovery types; product reuse, part reuse, and material recycling. Each recovery type could be applied to the Gazelle model on the website [32], where both the length of time used and the current product conditions are considered to estimate the amount of recycling awards, and the result is used as an important reference in this study.

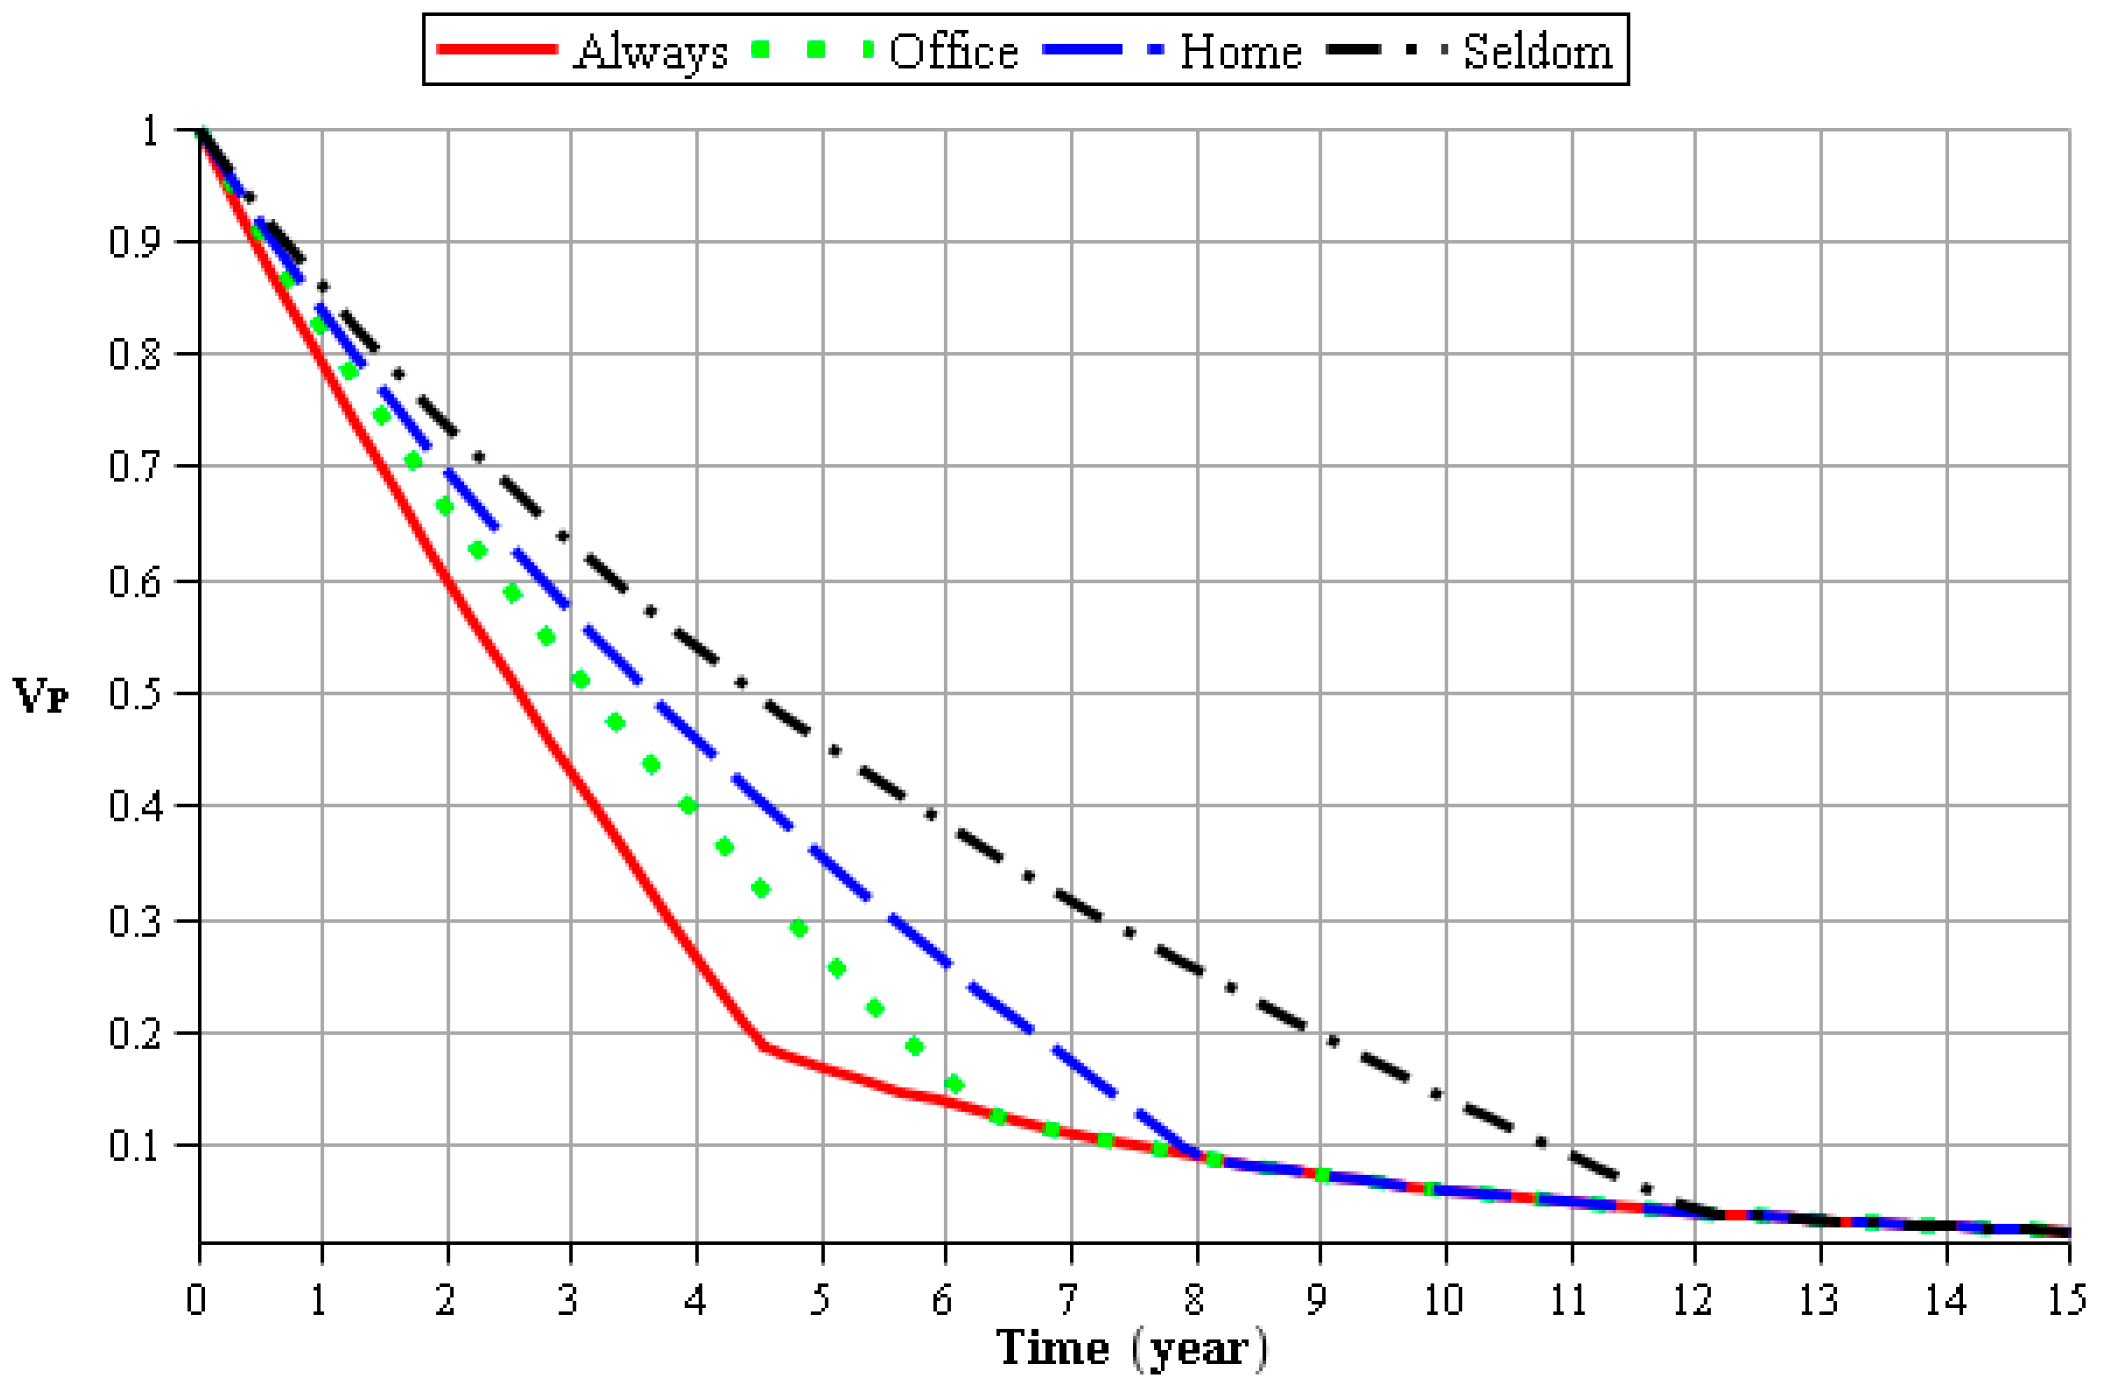
2.3. Consumer Value Assessment Model

Zheithaml [33] defined the value of consumer (Vc) as the consumer’s overall assessment of product utility based on the perceptions of what is received and what is given, as shown in Equation (14). The receipts (Rc) cover functionality, quality, or personal value obtained by the customer and positive feelings sensed by the customer; whereas the contributions (Cc) cover the money, time, or effort given by the customer and negative feelings sensed by the customer.
V C = R C C C
In this study, a consumer value assessment model is developed and we define the product value (VP) obtained by the customer, as shown in Equation (1), as the receipts of the customer, RC. TCO is used to represent customer contribution, CC, as shown in Equation (8). Then the customer value for different consumer use patterns i is a function of time t and can be defined as Equation (15).
V C i ( t ) = V P i ( t ) T C O i ( t )
where VPi(t)represents the value of the product receipt with a different consumer pattern of usage i inholding time t, while TCOi(t) is the total cost of the product contributed. This study explores the value of VCi(t) from the time of the product purchased to determine when is the best time to recycle the product for different use pattern consumers, which can benefit both the customer and the environment.

3. Numerical Illustration

To recap from Kwak et al. [6], the typical laptop wear-out lifespan is around 3–5 years, but people tend to keep their laptops for an average storing time of 11 years without using them. The main reason is because notebooks are smaller in size and easier to store. When new replacements are purchased, consumers usually keep the old ones at home instead of recycling them right away. Notebooks have a higher replacement rate, and most of the replaced products are still functional and have high residual values. If the consumer does not recycle her or his product at the right time, then its value will decline over time. It will have negative effects on the economy and the environment. To illustrate the applicability of the proposed model, a simplified numerical study has been conducted. This study aims to develop a model to help users determine the optimal take-back time. We take notebooks as our research target. The following will explicate the illustration process.

3.1. Description of Evaluated Product and Consumer Groups

In this study, the oldest 13.3-inch MacBook Air is used as the evaluated product, and two reference products with the same size are selected as reference products. Table 1 indicates the specification data of the evaluated product and reference products.
According to the EuP Lot3 investigation report, there are two types of consumer product usage patterns; an office use pattern and a home use pattern [28]. In this study, we add two more usage patterns an always use pattern as the upper bound and a ‘seldom use’ pattern as the lower bound of the usage patterns. We explore the consumer value and optimal product take-back time for four different consumer groups and show each usage pattern as a percentage of the number of hours per year in Figure 4. The ‘always use’ customers spend 5840 h (67%) in the active mode and 2920 h (33%) in the sleep mode, and these two modes totally cover the hours in a year (8760 h); namely, they leave the computer powered on all the time. The ‘seldom use’ customers spend 876 h (10%) in the active mode, 1752 h (20%) in the sleep mode, and 6132 h (70%) in the off mode; namely, they let the computer power off most of time and only use the computer 10% of the whole time.

3.2. Calculation of Product Value

Base on the data shown in Figure 4, in this example, the use frequency percentages of the product for the always use (F1), use in the office (F2), use at home (F3), and seldom use (F4) patterns are set to 100%, 64%, 49%, and 30%, respectively.
The functional deterioration value over time is obtained by the Factor T that we modified, as shown in Table 2; here the key specification items are based on a consumer survey report from the Market Intelligence and Consulting Institute [35]. Nine elements to which consumers pay more attention in terms of product specifications were identified as the key specifications of notebooks; they are Processor/RAM, Video Card, Display, Hard drive, USB ports, Battery, Dimensions, and Weight. The last two specifications are smaller for having better performance; the others are the opposite. Using Equations (5)–(7), we can obtain that the functional deterioration value of the evaluated product declines from 1 to 0.508 after 3 years and to 0.262 after 6 years. Use Equation (2) to obtain the functional deterioration value rate, α, which is 0.225. Figure 5 shows the curve of the product functional deterioration.
According to are port from Apple [38], the average physical life of a notebook computer is 7 years, and we take this data to project other consumer groups’ average physical life; always use (N1), use in the office (N2), use at home(N3), and seldom use (N4) are set to 4.5, 6.3, 8, and 12 years, respectively. The rates of physical value deterioration, β, discussed in Equation (3) can be calculated from Equation (16), which are 0.222, 0.101, 0.061, and 0.025, respectively, for the different consumer groups. The notebook computer product value of different consumer groups with holding time is shown in Figure 6. With an increase in the frequency of use, the value of the product decreases over time. When the holding time reaches the products maximum physical life (lifespan), the value of the product will become stagnant.
β = F N

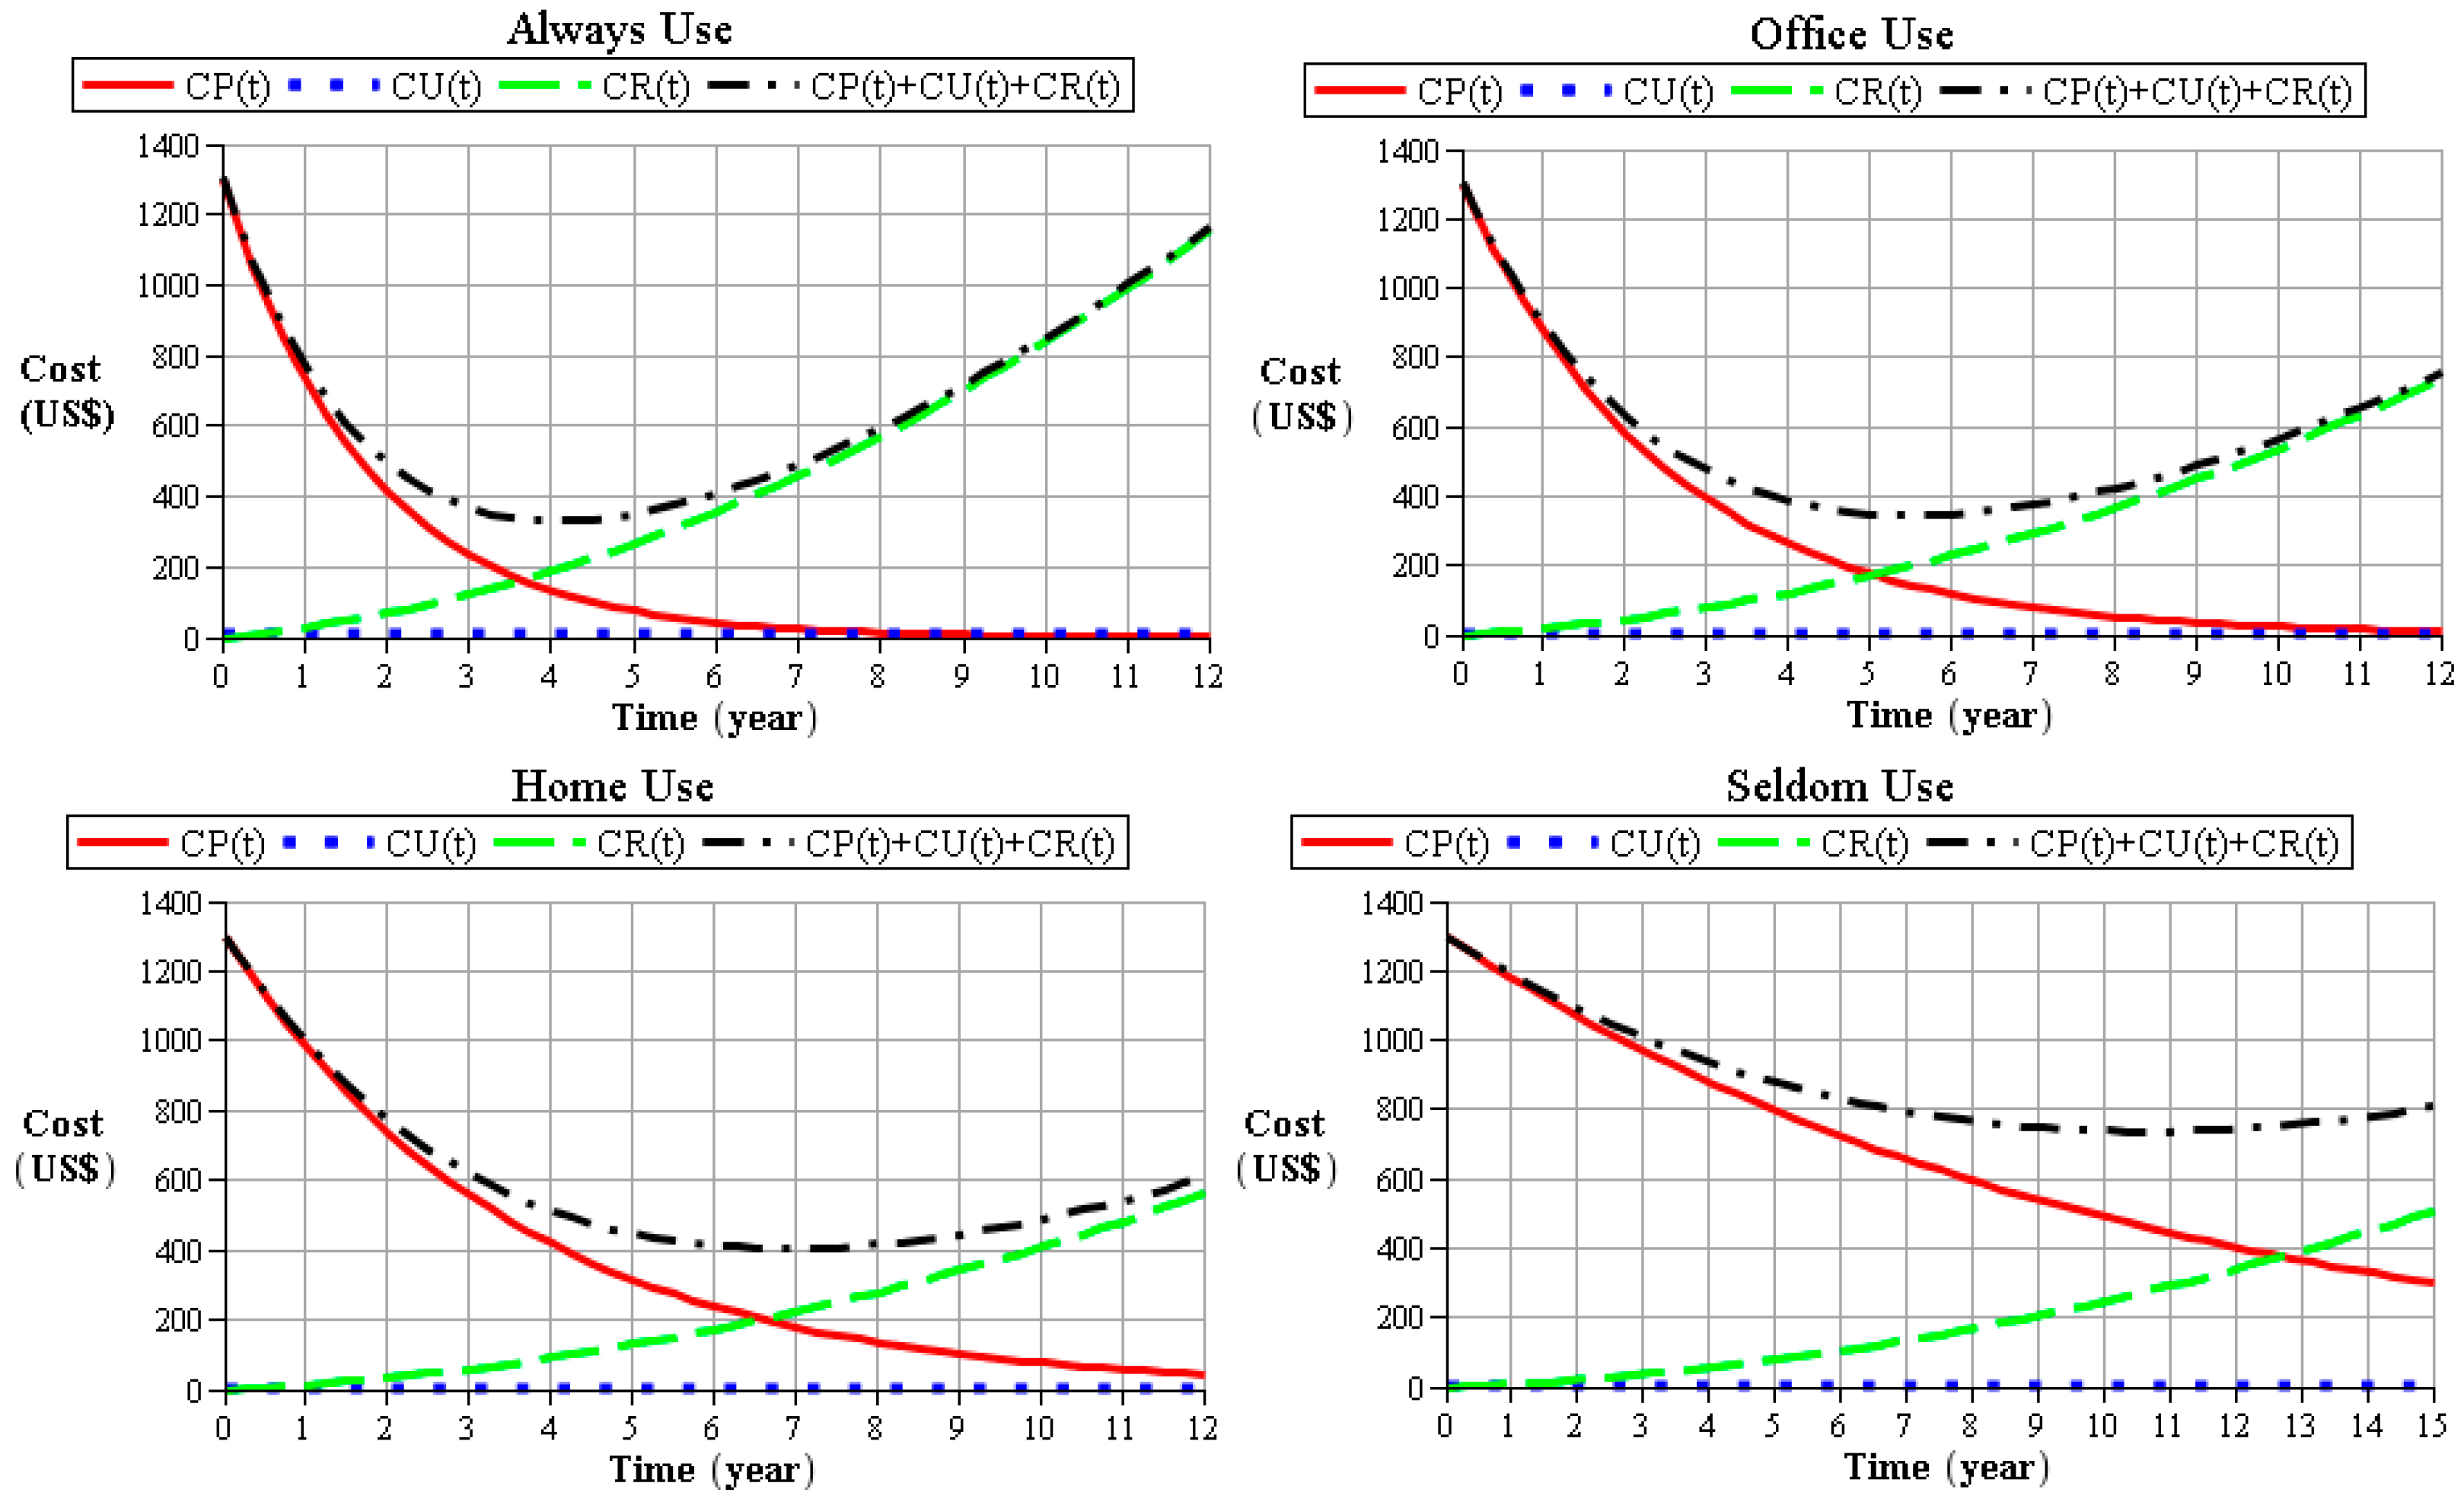
3.3. Calculation of TCO

3.3.1. Purchase, Use, and Repair Cost

The product purchase cost of a notebook, P, is the price as shown on Apple’s official website [34] and is assumed to be P = US$1299. Figure 7 shows the holding value of different consumer groups over time. When the frequency of use increases, the amortization cost increases with time and the market value decreases with time.
Based on the data from the International Energy Agency (IEA) [39], in Equation (11) we use c = US$0.125 /KWh for the price of electricity in USA. The average power consumption for each operation mode and the annual power consumption cost of different consumer groups are shown in Table 3.
Moreover, assume that the average maintenance fee, R, of a notebook computer is US$175 within the product’s cycle life. On the other hand, the survey by the notebook computer warranty provider Square Trade [40] in America indicates that the malfunction rate of the evaluated product in the first year is 5.8%, and this goes up to 25.1% after using the computer for 3 years. The components like keyboards, pointer devices, media drives, and hard drives are all mechanical components that wear out when subjected to heavy use. As a result, we determine the malfunction rate curve, f(t), by curve fitting. In the case of the home use model, the accumulative malfunction rate will be 100% when the product used for 7 years, as shown in Figure 8.
Figure 9 presents the time variation value for the purchase cost (CP(t)), use cost (CU(t)) and repair cost (CR(t)) for the different consumer groups. CP(t) is a decreasing function with respect to time, while CU(t) is a horizontal straight line and CR(t) is an increasing function. The aggregate effects of these three costs form a concave function. As the frequency of usage increases, the amortization for the CP(t) will increase relatively, and the declining rate of the CP(t) is faster than the increasing rate of the CR(t). As a result, the lowest point of the curve of CP(t) + CU(t) + CR(t) (concave function) will be reached earlier as the frequency of usage increases more.

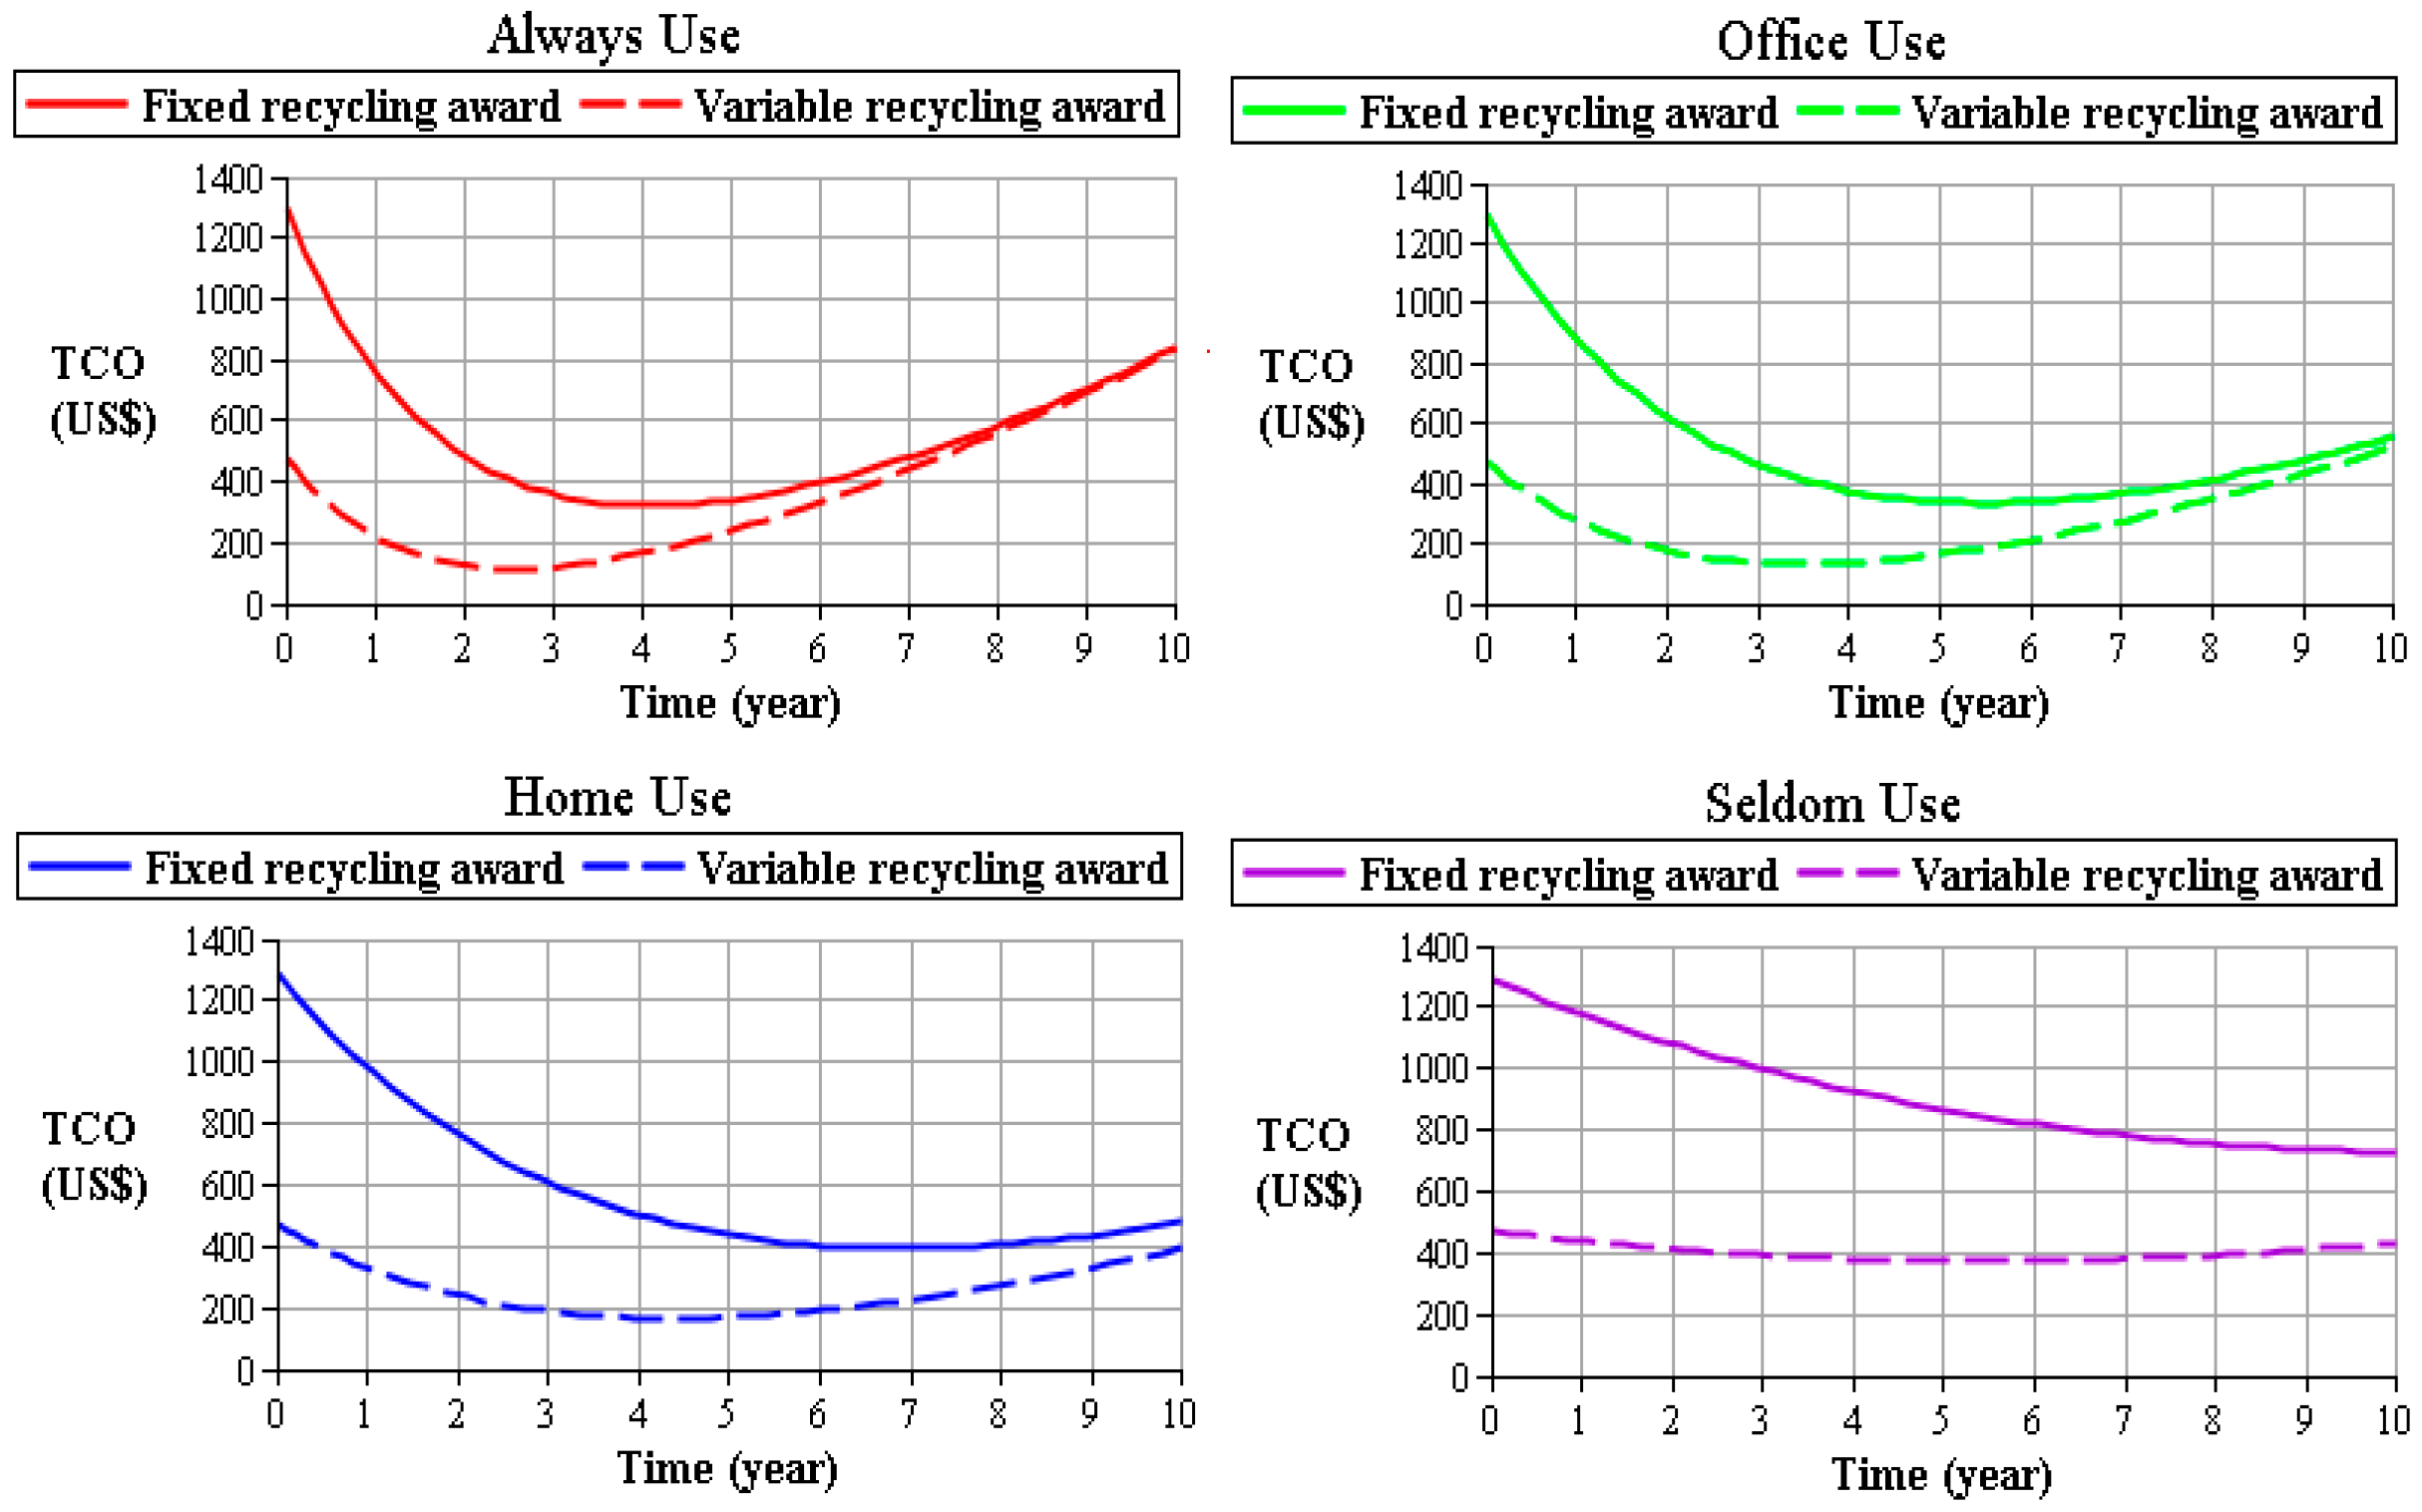
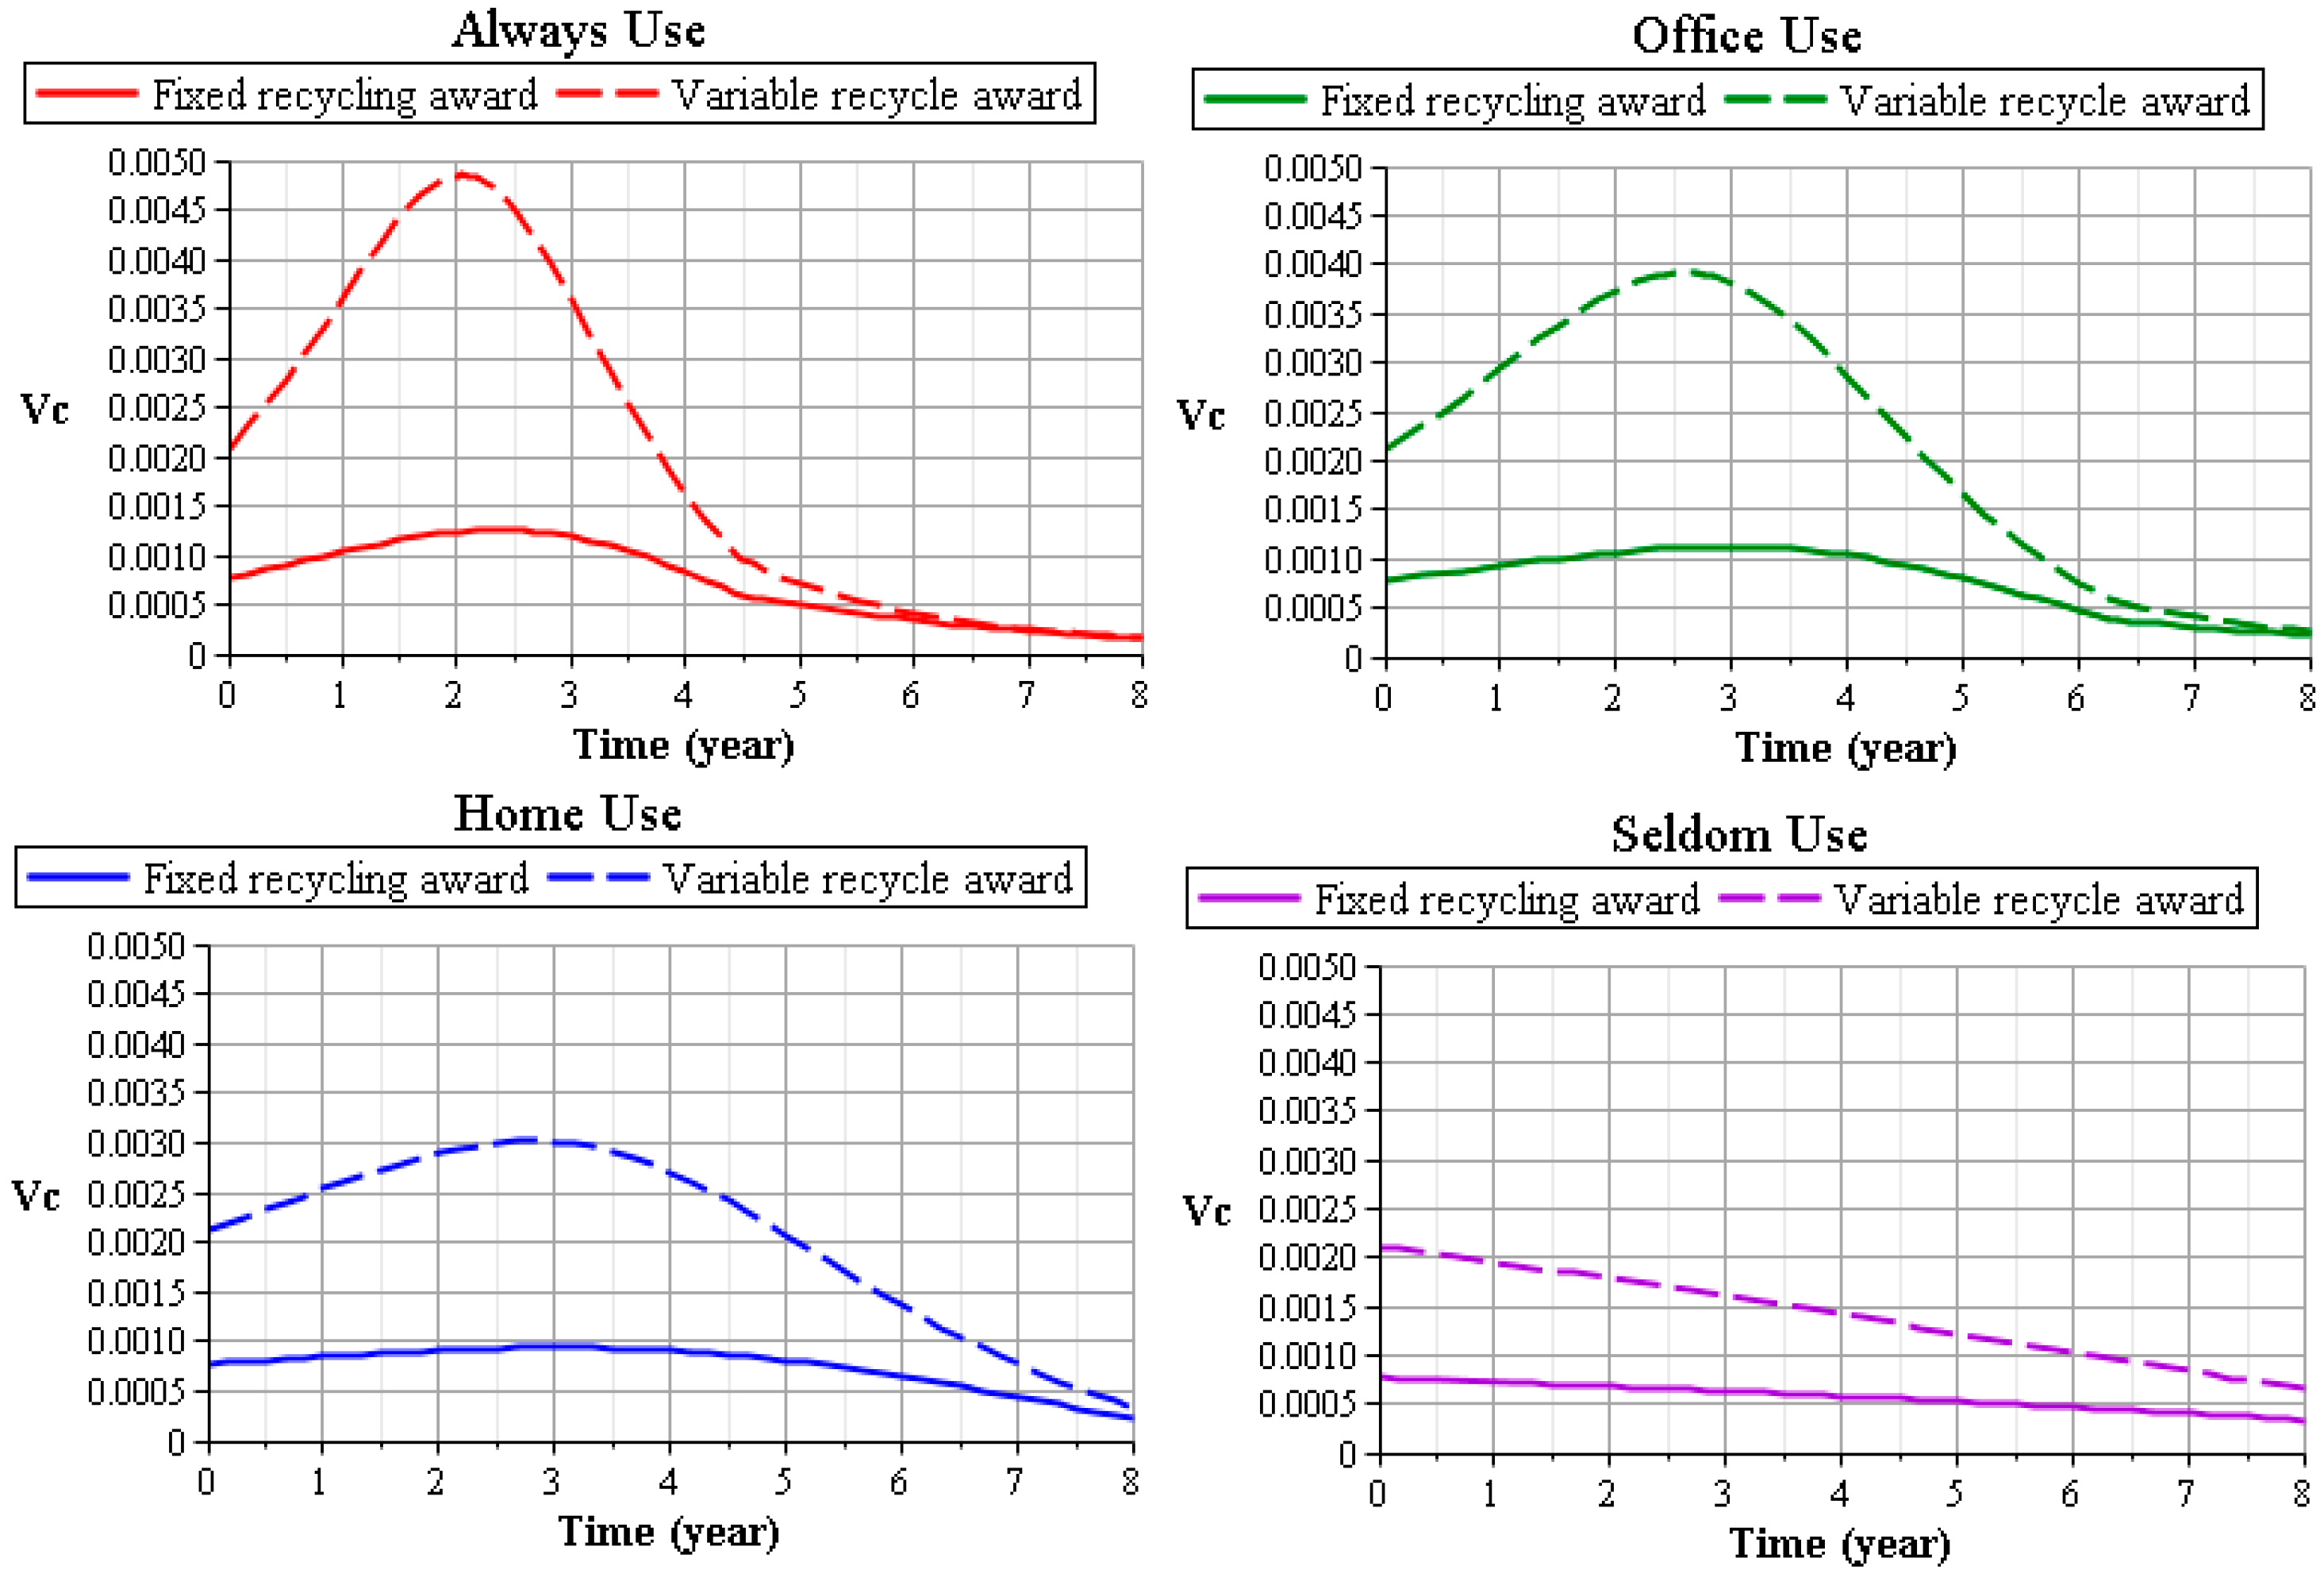
3.3.2. Recycling Award

Different countries may have different recycling award regulations for returned products (cores). Consumers could negotiate the award money with the recyclers through market mechanisms. Basically, there are two kinds of recycling award scenarios; Scenario 1 assumes that the recycling award is fixed no matter how good the product condition is or whether its age is young or old, whereas Scenario 2 assumes variable recycling awards, namely, different awards for products with different conditions and ages. For the fixed recycling award scenario, it reduces recycling incentives and leads to the result that the consumers tend to store their products, even if they no longer use them. Figure 10 shows a recycling award, AR, for two recycling award scenarios, and the data are adopted from the Gazelle website [32]. We will investigate the relationship between the recycling awards and the consumer values by comparing the results of these two scenarios in the following section.
In the fixed recycling award scenario, TCO behaves similarly to CP(t) + CU(t) + CR(t) in Figure 9, and the lowest point of the curve of TCO is reached earlier as the frequency of usage increases more, as shown in Figure 11. In the variable recycling award scenario, the product groups of always used, used in the office, used at home, and seldom used have their lowest TCO at the holding time of 2.55, 3.47, 4.36, and 5.46 years, respectively. With a higher frequency of use, the greater is the decline of TCO compared with the fixed recycling awards scenario. This is because the variable recycling award is a decreasing function over time; the earlier the consumer recycles her or his product, the higher is the award.

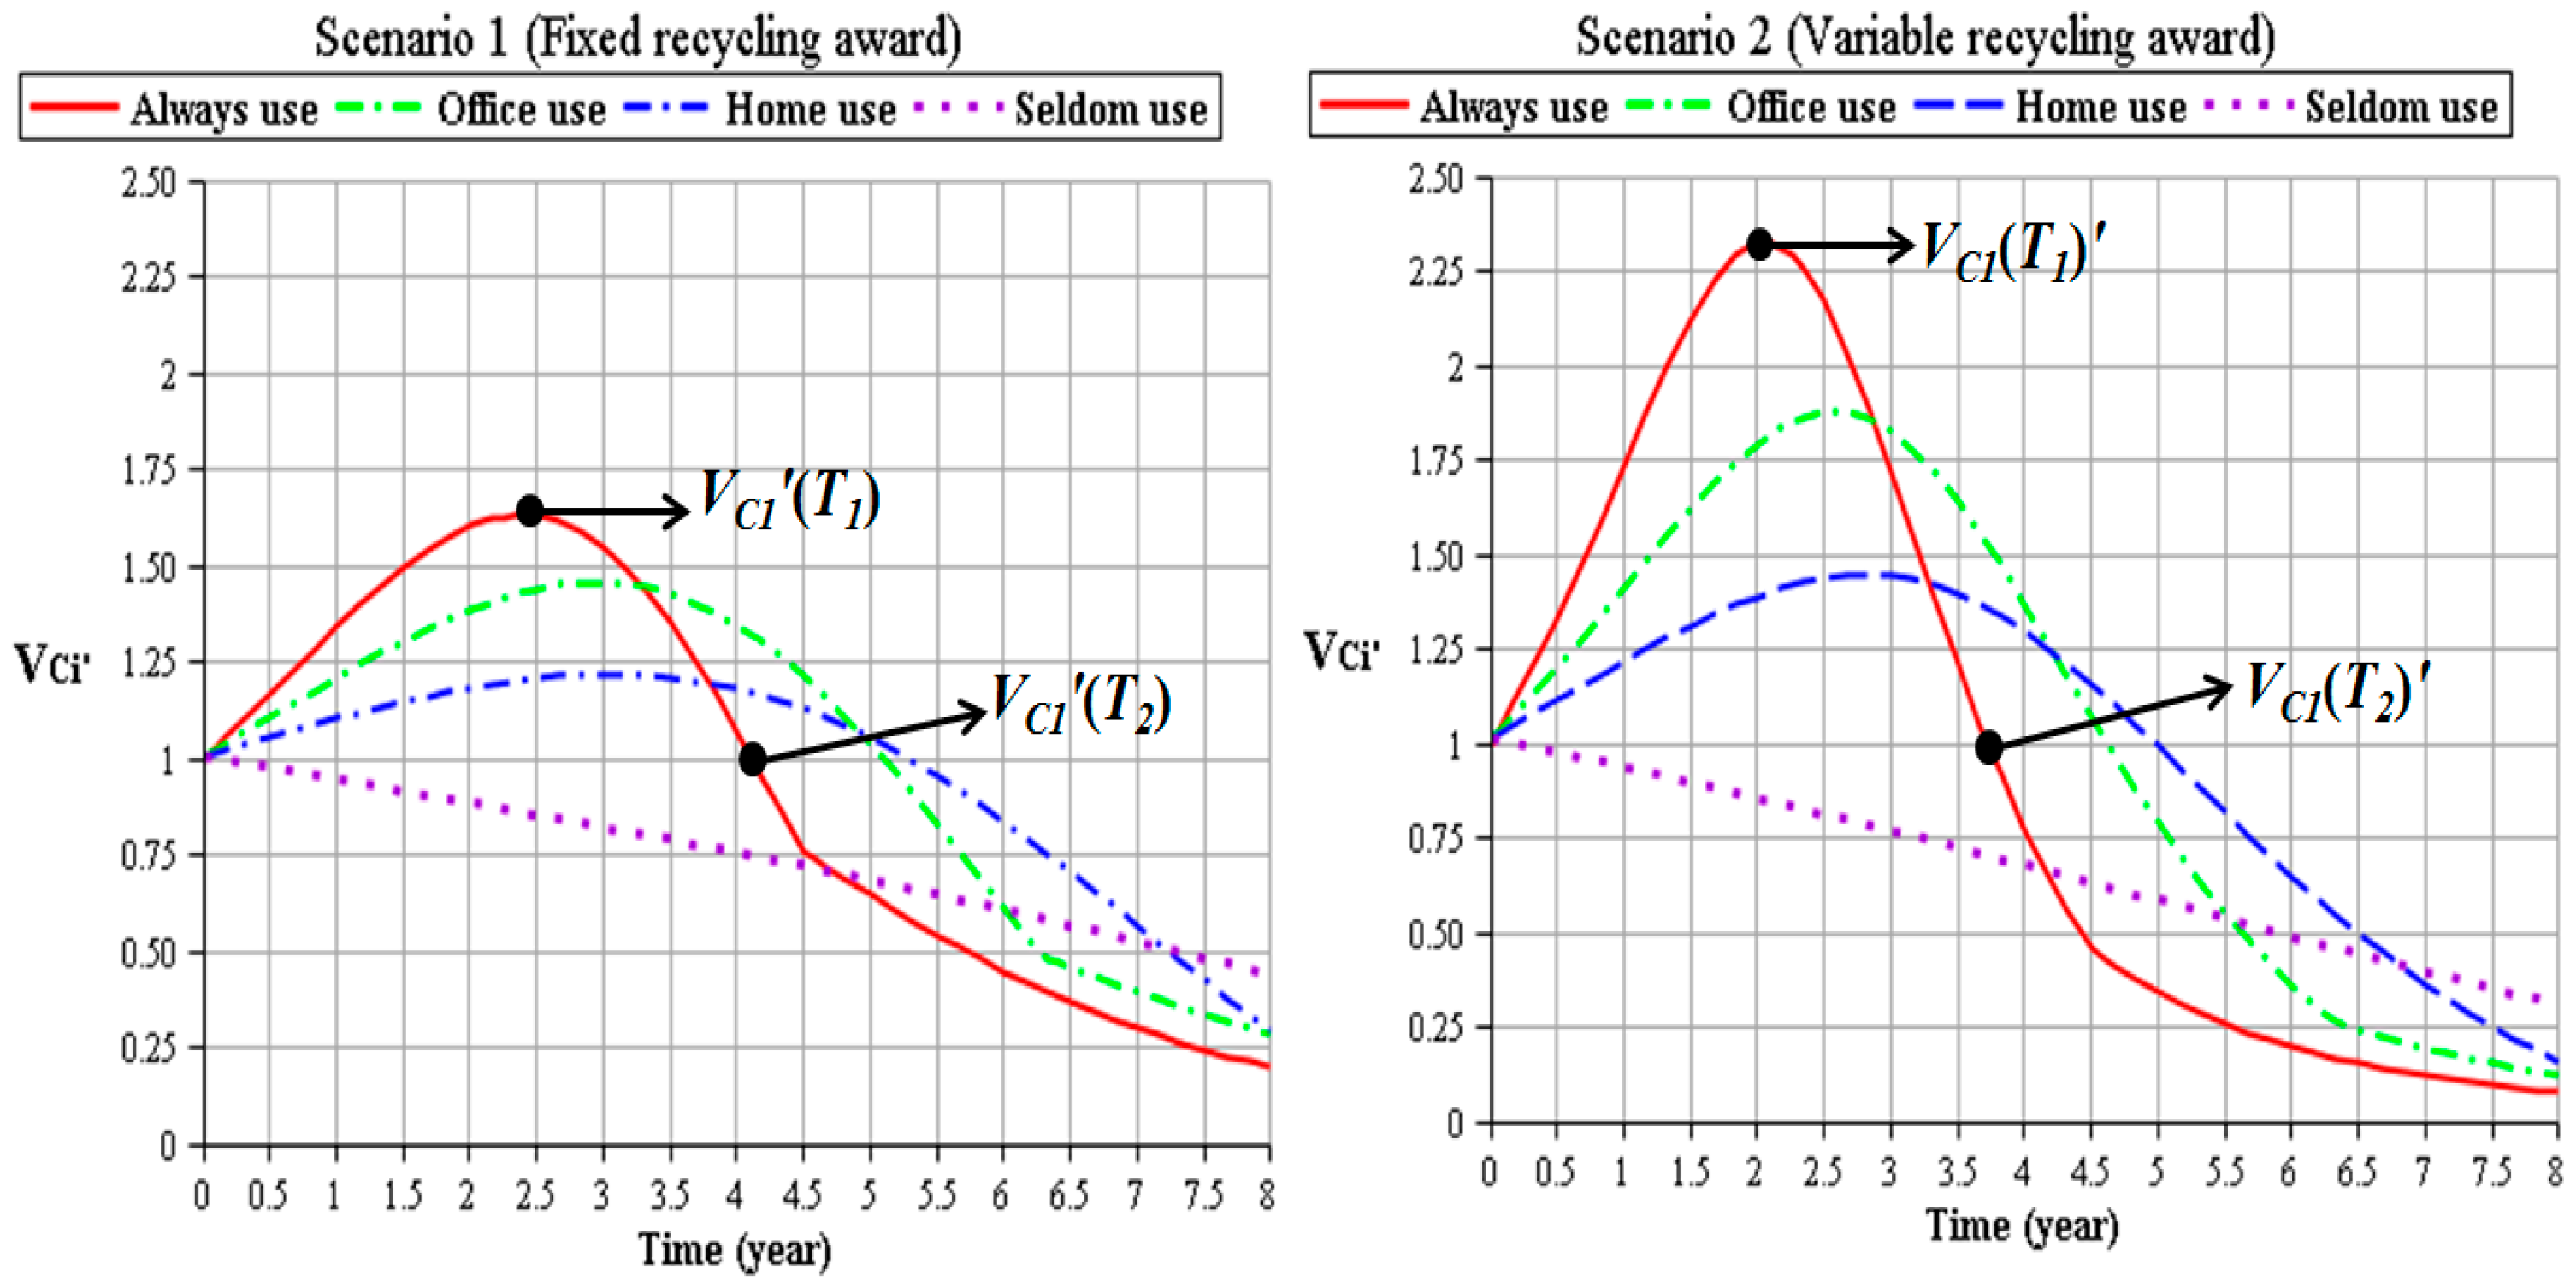
3.4. Optimal Take-Back Time of Product

In this study, the Maple 13 software is used for optimization. Figure 12 shows the consumer value of four consumer groups with fixed and variable recycling award scenarios. With a higher frequency of use, the highest point of the VC(t) occurs earlier for both scenarios. In the variable scenario, each consumer group also attains a higher consumer value in advance compared with the fixed scenario, and this scenario will motivate the customers to recycle their unused products as soon as possible.
In order to understand consumer value better, this study defines relative consumer value, VCi′(t), for use group i, as shown in Equation (17), which uses the initial consumer value (VCi(0)) as a reference to calculate the ratio of VCi(t) to VCi(0).
V C i ( t ) = V C i ( t ) V C i ( 0 )  for group  i
where VCi′(0) = 1. When VCi′(t) is greater than 1, it represents how much the consumer value increases compared with the initial consumer value.
Figure 13 shows that VCi′(t) increases from VCi′(0)then reaches its maximum value at T1. After it reaches the maximum value, it starts to go down to reach VCi′(0) again at T2, then its value will keep going down and the value becomes less than 1. Except for the seldom use group, all other groups behave similarly, as described above, for both recycling award scenarios. For the variable recycling award scenario, all use groups have higher maximum relative consumer value and shorter T1 and T2 compared with the fixed recycling award scenario, as shown in Figure 13 and Table 4. Since at T1, the customer has maximum consumer value and at T2 the customer value goes back to its initial consumer value, this study suggests that the customer can take T1 and T2 as important factors to determine the optimal take-back time. For the customer that likes to use new (or like new) products all the time, she or he can choose T1 to recycle his product; the ordinary customer can choose T2 (or an approximate time) to recycle their product. Table 4 demonstrates VCi′(T1) and VCi′(T2) for various usage patterns in two recycling award scenarios and illustrates that those use groups with a higher frequency of use have shorter value for T1 and T2 and a higher value for maximum consumer value. Under fixed recycle awards scenarios, the take-back times for always users, office users, and home users are 4.11, 5.08, and 5.25 years, respectively. On the other hand, under variable recycle awards scenarios, we offer higher awards to those who recycle their products earlier. Therefore, there is a significant change on the optimal take-back time; 3.72 years, 4.59 years, and 4.93 years, respectively. The results imply that the variable recycling award scenario is a better strategy than the fixed recycling award scenario. Moreover, it encourages the consumers to recycle their products in advance when they no longer use them. Different usage frequency groups have different best timing to recycle their products. For the customers in the seldom use group, the results suggest that it is better for them to recycle their product right after they have bought the product; namely, they do not need to buy the product or they can rent the product.

4. Conclusions

The study proposed a consumer value assessment model, which is a function of time, and could help consumers to understand how value changes during the holding period and to determine whether the product is worth keeping or should be recycled. The optimal product take-back time with consideration of consumer value can be determined when the consumer value decreases below its original value and when the cost of consumers keeping the product exceeds the value receipted and it is no longer worth keeping for economic benefit.
The study found that there are two main factors affecting the optimal take-back time; namely, the usage hours of laptop and the recycling award of used products. There are two different recycling award schemes, fixed and variable recycling awards. A fixed recycling award, executed in most countries, only gives a fixed amount of award for recycling, which does not consider the quality and life of the used products. This award offers an insufficient amount of incentive and cannot induce consumers to recycle laptops that are no longer in use, whereas, with a variable recycling award, consumers could become more willing to recycle the used product at an earlier time to receive a better award. This variable award scheme can promote higher product residual values as social resource use and can reduce the negative impact on the environment. It is highly suggested to governments for their policy making in future.
We believe that the result of this study can help consumers to calculate the optimal take-back time for their product as well as the consumer value when they input their product specifications and conditions. In addition, the result enables consumers to compare different products in the same category for a reference of future purchase. Upon data mining with the offered information, we expect that manufacturers may exploit environmentally friendly products that possess higher consumer value.
Although this study has taken care of many issues, there is still more research needed. For example, an extension of our model can be applied to different brands or types of laptop or even different products. Moreover, the effects of government subsidy on different recycling award schemes are also interesting to study.

Acknowledgments

This work is supported in part by the Ministry of Science and Technology of Republic of China under the grant MOST 105-2221-E-033-044.

Author Contributions

Both authors designed the research and wrote the paper. Yi-Tse Fang collected and analyzed the data. Hsin Rau controlled the quality assurance.

Conflicts of Interest

The authors declare no conflict of interest.

References

  1. Baldé, C.P.; Wang, F.; Kuehr, R.; Huisman, J. The Global E-Waste Monitor—2014; United Nations University: Bonn, Germany, 2015. [Google Scholar]
  2. Greenpeace, the E-Waste Problem. Available online: http://www.greenpeace.org/international/en/campaigns/toxics/electronics/the-e-waste-problem/ (accessed on 5 February 2015).
  3. United Nations Environment Program (UNEP). Policy Briefs on E-Waste What, Why and How. Available online: http://www.unep.org/ietc/Portals/136/Other%20documents/PolicyBriefs/13052013_E-Waste%20Policy%20brief.pdf (accessed on 10 June 2015).
  4. United States Environmental Protection Agency (USEPA). Electronics Waste Management in the United States through 2009. Available online: http://www.epa.gov/wastes/conserve/materials/ecycling/docs/fullbaselinereport2011.pdf (accessed on 10 June 2015).
  5. Statista Website. Average Lifespan of Desktop PCs, Notebooks, Laptops and Tablets from 2012 to 2017. Available online: https://www.statista.com/statistics/267474/average-life-of-pc-and-tablets/ (accessed on 2 September 2016).
  6. Kwak, M.; Behdad, S.; Zhao, Y.; Kim, H.; Thurston, D. E-waste stream analysis and design implications. J. Mech. Des. 2010, 133, 1–8. [Google Scholar] [CrossRef]
  7. United States Environmental Protection Agency (U.S. EPA). Electronic Reuse and Recycling Infrastructure Development in Massachusetts; U.S. EPA: Boston, MS, USA, 2000.
  8. European Commission (EU). Integrated Product Policy (IPP) Report. Available online: http://cleanproduction.org/Steps.Products.Policy.php (accessed on 21 June 2013).
  9. Ramani, K.; Ramanujan, D.; Bernstein, W.Z.; Zhao, F.; Sutherland, J.; Handwerker, C.; Choi, J.K.; Kim, H.; Thurston, D. Integrated sustainable life cycle design: A review. J. Mech. Des. 2010, 132, 091004. [Google Scholar] [CrossRef]
  10. Ferrer, G.; Whybark, D.C. Material planning for a remanufacturing facility. Prod. Oper. Manag. 2001, 10, 112–124. [Google Scholar] [CrossRef]
  11. Inderfurth, K.; Langella, I.M. Planning Disassembly for Remanufacture-to-Order Systems; Environment Conscious Manufacturing: Boca Raton, FL, USA, 2008; pp. 387–411. [Google Scholar]
  12. Zhang, Z. Supporting end-of-life product recovery processes in closed loop supply chains. In Proceedings of the Second IEEE International Symposium on Intelligent Information Technology Application, Shanghai, China, 21–22 December 2008; pp. 804–808.
  13. Guide, V.D.R.; Teunter, R.H.; Wassenhove, L.N.V. Matching demand and supply to maximize profits from remanufacturing. Manuf. Serv. Oper. Manag. 2003, 5, 303–316. [Google Scholar] [CrossRef]
  14. Ray, S.; Boyaci, T.; Aras, N. Optimal prices and trade-in rebates for durable, remanufacturable products. Manuf. Serv. Oper. Manag. 2005, 7, 208–228. [Google Scholar] [CrossRef]
  15. White, C.; Masanet, E.; Rosen, C.; Beckman, S. Product recovery with some byte: An overview of management challenges and environmental consequences in reverse manufacturing for the computer industry. J. Clean. Prod. 2003, 11, 445–458. [Google Scholar] [CrossRef]
  16. Zhao, Y.; Pandey, V.; Kim, H.; Thurston, D. Varying lifecycle lengths within a portfolio for product take-back. J. Mech. Des. 2010, 132. [Google Scholar] [CrossRef]
  17. Gottinger, H.W. A computational model for solid waste management with application. Eur. J. Oper. Res. 1988, 35, 350–364. [Google Scholar] [CrossRef]
  18. Fleischmann, M.; Krikke, H.R.; Dekker, R.; Flapper, S.D.P. A characterization of logistics networks for product recovery. Omega 2000, 28, 653–666. [Google Scholar] [CrossRef]
  19. Jayaraman, V.; Luo, Y. Creating competitive advantages through new value creation: A reverse logistics perspective. Acad. Manag. 2007, 21, 56–73. [Google Scholar] [CrossRef]
  20. IDA, DOD Value Engineering Program. Available online: http://rtoc.ida.org/ve/ve.html (accessed on 26 June 2015).
  21. Kondoh, S.; Masui, K.; Hattori, M.; Mishima, N.; Matsumoto, M. Total performance analysis of product life cycle considering the deterioration and obsolescence of product value. Int. J. Prod. Dev. 2008, 6, 334–352. [Google Scholar] [CrossRef]
  22. Yeh, C.L. A Computation Method of Factor X Indicator by Using the Life Cycle Concept. Master’s Thesis, National Cheng Kung University, Tainan, Taiwan, 22 May 2009. [Google Scholar]
  23. Oikawa, S.; Ebisuji, K.; Fuse, K. Fujitsu’s Approach for Eco-efficiency Factor. Fujitsu Sci. Technol. J. 2005, 41, 236–241. [Google Scholar]
  24. Aoe, T. Green Product Indicators in Matsushita Electric Group; EcoDesign 2003: Tokyo, Japan, 2003. [Google Scholar]
  25. Toshiba Corporation. Advancing Together with Factor T. Available online: http://www.toshiba.co.jp/env/en/report/pdf/factor_t_2009_en.pdf (accessed on 10 June 2015).
  26. HP Corporation. Total Cost of Ownership. 2011. Available online: http://www8.hp.com/tw/zh/hp-financial-services/solutions/tco.html (accessed on 11 June 2015).
  27. Ellram, L. Total cost of ownership: Elements and implementation. J. Supply Chain Manag. 1993, 29, 2–11. [Google Scholar] [CrossRef]
  28. European Commission DG TREN. Preparatory Studies for Eco-Design Requirements of EuPs: Lot 3—Personal Computers (Desktops and Laptops) and Computer Monitors; IVF Industrial Research and Development Corporation: Molndal, Sweden, 2007. [Google Scholar]
  29. Thierry, M.C.; Salomon, M.; Van Nunen, J.; Van Wassenhove, L. Strategic issues in product recovery management. Calif. Manag. Rev. 1998, 37, 114–135. [Google Scholar] [CrossRef]
  30. Prahinski, C.; Kocabasoglu, C. Empirical research opportunities in reverse supply chains. OMEGA 2006, 34, 519–532. [Google Scholar] [CrossRef]
  31. Mishima, K.; Mishima, N.; Nakano, M. A study on a system design approach to promote better circular use of Electrical and Electronic Equipment. EcoDesign 2011. Available online: http://link.springer.com/chapter/10.1007/978-94-007-3010-6_155#page-1 (accessed on 5 February 2017). [Google Scholar]
  32. Gazelle Website. Available online: https://www.gazelle.com/trade-in (accessed on 13 June 2015).
  33. Zeithaml, V.A. Consumer perceptions of price, quality, and value: A means-end model and synthesis of evidence. J. Mark. 1998, 52, 2–22. [Google Scholar] [CrossRef]
  34. Apple Website. Available online: http://www.apple.com/macbook-air/ (accessed on 13 June 2015).
  35. Market Intelligence & Consulting Institute (MIC). Investigation of Digital Living Expenses in Taiwan; MIC: Taipei, Taiwan, 2009. (In Chinese) [Google Scholar]
  36. Geekbench 3 Software—MacBook Air Benchmarks. Available online: http://www.primatelabs.com/blog/2013/06/macbook-air-benchmarks/?utm_source=feedburner&utm_medium=feed&utm_campaign=Feed%3A+primatelabsblog+%28Primate+Labs+Blog%29 (accessed on 19 June 2015).
  37. PassMark Software—PC Benchmark and Test Software. Available online: http://www.cpubenchmark.net/ (accessed on 19 June 2015).
  38. Apple Company, Product Environmental Reports. Available online: http://images.apple.com/environment/reports/docs/MacBook-White_Environmental_Report_20091020.pdf (accessed on 21 June 2015).
  39. International Energy Agency. Electricity Information 2016; IEA Energy Data Center: Paris, France, 2017. [Google Scholar]
  40. Square Trade Company. 1 in 3 Laptops Fail over 3 Years Report. Available online: http://www.squaretrade.com/pages/laptop-reliability-1109 (accessed on 29 June 2015).
Figure 1. The concept of consumer value.
Sustainability 09 00385 g001
Figure 2. The time variation of product value.
Sustainability 09 00385 g002
Figure 3. The deterioration rate of functional value and physical value. (a) Functional deterioration, VF(t); (b) Physical deterioration, VS(t).
Sustainability 09 00385 g003
Figure 4. Product usage patterns of the notebook computer.
Sustainability 09 00385 g004
Figure 5. Functional deterioration value rate, α.
Sustainability 09 00385 g005
Figure 6. The product value for various consumer groups.
Sustainability 09 00385 g006
Figure 7. The purchase cost varies over time for various consumer groups.
Sustainability 09 00385 g007
Figure 8. Accumulative malfunction rate over time.
Sustainability 09 00385 g008
Figure 9. The purchase, use, and repair costs change over time for various consumer groups.
Sustainability 09 00385 g009
Figure 10. Recycling award, AR, for two recycling award scenarios.
Sustainability 09 00385 g010
Figure 11. Total cost of ownership (TCO) for various consumer groups with two recycling award scenarios.
Sustainability 09 00385 g011
Figure 12. The consumer value for various consumer groups with two recycling award scenarios.
Sustainability 09 00385 g012
Figure 13. Optimal take-back time of the product for different consumer groups with two recycling award scenarios.
Sustainability 09 00385 g013
Table 1. Product specification of evaluated product and reference product [34].
Evaluated Product (EP)Reference Product (RP)Reference Product (RP)
Introduction date8 June 200911 June 20129 March 2015
Processor Type (Speed) Intel Core 2 Duo SL9400 (1.86 GHz)Intel Core i5-3427U (1.8 GHz)Intel Core i5-5250U (1.6 GHz)
RAM Type (Speed)DDR3 SDRAM 2 GB (1066 MHz)DDR3L SDRAM 4 GB (1600 MHz)DDR3L SDRAM 8 GB (1600 MHz)
Video CardNVIDIA GeForce 9400 M Intel HD 4000HD Graphics 6000
Display (Resolution)13.3″ (1280 × 800 )13.3″ (1440 × 900 )13.3″ (1440 × 900 )
Hard Drive120 GB (4200 RPM)256 GB SSD256 GB SSD
USB Ports1 (USB 2.0)2 (USB 3.0)2 (USB 3.0)
Battery life5 h7 h12 h
Dimensions (H × W × D)1.94 × 32.5 × 22.7 (cm)1.7 × 32.5 × 22.7 (cm)0.68 × 12.8 × 8.94 (cm)
System Weight1.36 kg1.35 kg1.35 kg
Original Price US$1299 US$1299 US$1199
Table 2. Value of overall functional deterioration.
SpecificationsPerformanceUnitEpmRpmDpmWm
CPU/RAMGeekbench Performance 1Score↑270167570.400.34
Graphic CardPassMark G3D Rating 2Score↑1244740.260.13
DisplayResolutionPixel↑1,024,0001,296,0000.790.17
Hard DrivePassMark Disk Rating 3GB↑18138870.050.09
USB PortsDate Transfer SpeedGbps↑0.96100.100.01
BatteryMax. Battery LifeHours↑570.710.15
DimensionsMax. HighCm↓1.941.70.880.03
WeightAvg. WeightKg↓1.361.350.990.09
1 Geekbench uses a number of different benchmarks to measure performance, which included Integer Performance, Loathing Point Performance, Memory Performance, and Stream Performance [36]; 2 G3D Rating conducts three different tests and then averages the results together to determine the PassMark 3D Mark for a system [37]; 3 Disk rating conducts three different tests, Disk Sequential Read, Disk Sequential Write, and Disk Random Seek RW, and finally averages the results together to determine the PassMark Disk Mark for a system.
Table 3. Power consumption for the evaluated product.
Operational ModesElectricity Used (kW) *Annual Power Consumption Cost (US$)
Always UseOffice UseHome UseSeldom Use
Off (kW1)0.0005600.1760.2500.441
Sleep (kW2)0.001020.3270.3350.3250.049
Active (kW3)0.01317.7083.4491.8320.576
Total---------8.0353.9612.4071.068
Table 4. Relative customer value and take-back time for various consumer groups with two recycling award scenarios. (Unit of T1 and T2: Year).
Fixed ScenarioVariable ScenarioDifference
Always UseT1(VCi′)2.37 (1.63)2.04 (2.32)−0.33 (+42%)
4.113.72−0.39
Office UseT1(VCi′)2.96 (1.45)2.57 (1.86)−0.39 (+28%)
T25.084.59−0.49
Home UseT1(VCi′)3.04 (1.21)2.80 (1.42)−0.24 (+17%)
T25.254.93−0.32
Seldom UseT1(VCi′)0 (1)0 (1)0 (+0%)
T2000
Maximum consumer value occurs at T1, consumer value goes back to VCi′(0) at T2.

