1. Introduction
Cyprus, one of the largest islands in the Mediterranean has no petroleum reserves and is completely dependent on imported energy from petroleum products. The energy statistics of North Cyprus over the past 20 years show high increases in annual electricity consumption, and all sectors energy is being provided from Cyprus Turkish Electricity Authority (KIB-TEK) which is being put under oppressive pressure by customers who call for maximize the suppling capacity, which is costly due to the high price of fossil fuel [
1]. This uncertain load increase and the rising cost of fossil fuels, requires serious attention and consideration specially to buildings optimizations towards sustainability and energy efficiency [
2]. Worldwide, existing buildings consumes around 40% of end use energy however 1%–3% annually of these buildings are being replaced by new-build [
3,
4,
5]. Thus, reducing domestic energy consumption and integrating renewable energy sources for energy savings has become an international trend as a strategy for reducing the level of peak demand from the electricity grid. Therefore, energy efficiency in buildings and net-zero energy buildings (NZEB) concepts have attracted intense attention from researchers, architects, and engineers.
NZEB refers to a building consuming equal (or less) energy than what it produces within a single year. The idea of starting a time-period assessment for NZEB that refers to a yearly basis is critical, so as to allow variations in different seasons of the year. Therefore, the highest amount of energy needs in the winter (due to lower sun gains) for heating can be balanced at the end of year by energy delivered from renewable energy sources during the summer [
6]. There are many definitions for NZEB; it depends on the specific goal of the project and the different points of views of the owners and the design team, the economic issues, and energy costs that are more important for the owners. However, the national energy members are interested in renewable sources of energy, and designers are more interested in requirements and energy codes [
7]. As a general definition, net-zero energy (NZE) is the annual energy balance between the operation/demanded energy and the generated energy from the renewable sources [
8], and a net-zero energy building (NZEB) is a building that produces enough energy to sustain itself. Considering NZEB concept into renovating public building maximize the energy efficiency in existing building, in addition, since exiting buildings will last for more decades, optimizing towards NZE also share in the sustainable urban development.
Nowadays, various countries are trying to approach net-zero energy concepts in their buildings and are planning to achieve this goal within a certain time. The European Union (EU) Energy Performance of Buildings Directive (EPBD) stated in their official journal that all new buildings in European countries should be NZEB by the end of 2020 [
9]. Regardless of the new construction, existing buildings are the largest energy consumers which are still operating, but require renovating in order to decrease their energy needs; hence, EPBD set the existing and public buildings as a starting target in European countries [
10,
11].
Many guidelines for early design stages have been set in order to achieve this goal for new construction [
12]; different strategies and frameworks have been provided to achieve desirable results in existing buildings [
13] and there are many examples of retrofit projects that achieve this goal. However, each project applies different strategies according to its type, local climate, and other measurements. Winter represents the peak energy demand load curve in North Cyprus, which is basically consumed by residential sector [
14] according to the working hours. Statics shows if 5% of the existing residential buildings implement stand-alone renewable energy production system, this will lead to 4% decrease in the peak demand [
1]. In terms of public buildings, main operating schedules is during the day time, where the maximum benefits can be get from photovoltaics to provide demanded energy. As such, it is important to regenerate the design of existing buildings and develop strategies towards the zero energy concepts in N. Cyprus.
The studies towards NZEB stated in the literature are only for designing new buildings or existing two-story residential buildings [
15,
16,
17]. Thus, this study focuses on how well public buildings in North Cyprus meet the Energy Performance of Building Directive (EPBD) stated goals for 2020. For this purpose, a typical building located at the Eastern Mediterranean University (EMU) Faculty of Architecture is chosen as a case study.
2. Literature Review
According to Professor François Grade’s research about NZEB design [
17], there are two major factors that must be considered and analyzed in the early design phases to achieve NZEB targets:
- (1)
Optimizing the passive solar energy concepts to reduce building energy consumption, and
- (2)
Generate sufficient electrical energy by renewable energy sources to reach energy balance.
Integration of passive techniques acts as a critical apparatus towards zero energy building design goals. It has direct influences on thermal balance and lighting loads, which affects the electro-mechanical systems of the building. This creates a noticeable indirect reduction in heating/cooling, lighting, and ventilation energy consumption that is sufficiently balanced by renewable energy systems [
17].
Since implementing the passive solar energy in the building influences the loads in the electro-mechanic system, passive strategies takes a vital position in NZEB design. Studies proved that efficient integrating of passive shading controls in the building envelope and building elements dramatically reduce the annual lighting energy demand by 40%, and this percentage increases to 60% if automated shading device have been integrated [
18]. Moreover, effective controlling of daylight can reduce 10%–20% of the annual cooling/heating energy demand [
18]. Furthermore, it indirectly affects challenges facing energy produced by renewable resources. In general, the consideration of optimizing passive heating and cooling strategies are combined together in order to prevent glare by direct sunlight and overheating in cooler seasons. In addition, the thermal mass of the building provides a method to achieve passive cooling, which significantly reduces the cooling loads [
19,
20] for taking advantage of daylight and natural ventilation. Meanwhile, in hot seasons, distinguished by the use of the fresh air and the building’s loss heat at night it is the non-use of the walls’ thermal insulation that prevents heat loss during night time. The appliance of passive strategies constitutes many challenges correlated to the building type, climatic conditions, CO
2 emission levels, and optimum energy performance, consequently, by collaborative research with the Solar XXI project, built in 2006 at LNEG Campus in Lisbon [
21], which claims to be an example of a low solar energy building integrating inert strategies for heating and geo-cooling systems to achieve NZEB [
22]. Photovoltaic panels are integrated in the facade design with a heating system for thermal balance in winter. Otherwise, a geo-cooling system (ground tubes) assisted by night cooling approaches work together to cool the building in summer.
Furthermore, opening sizes and glazing specifications in the facade has a direct influence on the indoor thermal comfort in warm climate conditions [
23], which affects the cooling and heating loads, and on the use of daylight which affects the lighting loads [
24]. In terms of the ventilation impact on building energy consumption, recent research using for dynamic thermal simulations EDSL Tas software found the percentage of the window openings’ influence on the thermal comfort and energy consumption for cooling and heating for different seasons in a hot and humid climate [
25]. These results found that lowering the window to wall ratio (WWR) decreased the energy consumption and a large WWR increases energy consumption. However, a large WWR increases energy consumption in all climates [
26], the small WWR affects the daylighting efficiency [
27], and lighting consumption can be managed by using controllable electric lighting systems and optimum shading devices, especially for large glazing sizes [
28]. However, energy consumed, in this case by HVAC systems for heating and cooling, must kept in mind. The U-value and G-value of the glass are important factors in terms of cooling and heating energy consumption, and lowering the U-value respectively decreases the energy consumption for different WWR and increases the energy efficiency of the building [
29]. Most of NZEBs in research projects apply yearly balance to support their used methods [
30], and the same concept is applied in this paper to investigate optimizing public building towards net zero energy.
The methodologies and the case study building will be described in the following sections, along with the findings of the observations and computer simulations, and a discussion about the suitable design optimizations and potential for achieving net-zero energy in the building.
3. Methodology
Case study problem solving, and surveying methodologies will be used in this research in order to reach conclusions. Firstly, the building has been surveyed and analyzed through observation, which is presented via photos and computer simulations via Autodesk Ecotect analysis [
31] to find and define the problems statistically. The data will be analyzed using both qualitative and quantitative methods to accurately determine the energy problems. Secondly, an energy optimization of these problems has been done through an energy modeling simulation (eQuest energy simulation tool [
32].) based on interviews managed with expert architects in energy efficient buildings and renewable energy technologies, in addition to the passive optimization principles found in the literature. Finally, the energy simulation results after optimization are discussed to make an energy comparison of existing situation and alternatives energy savings to help develop the strategy of achieving net-zero energy use in the case study.
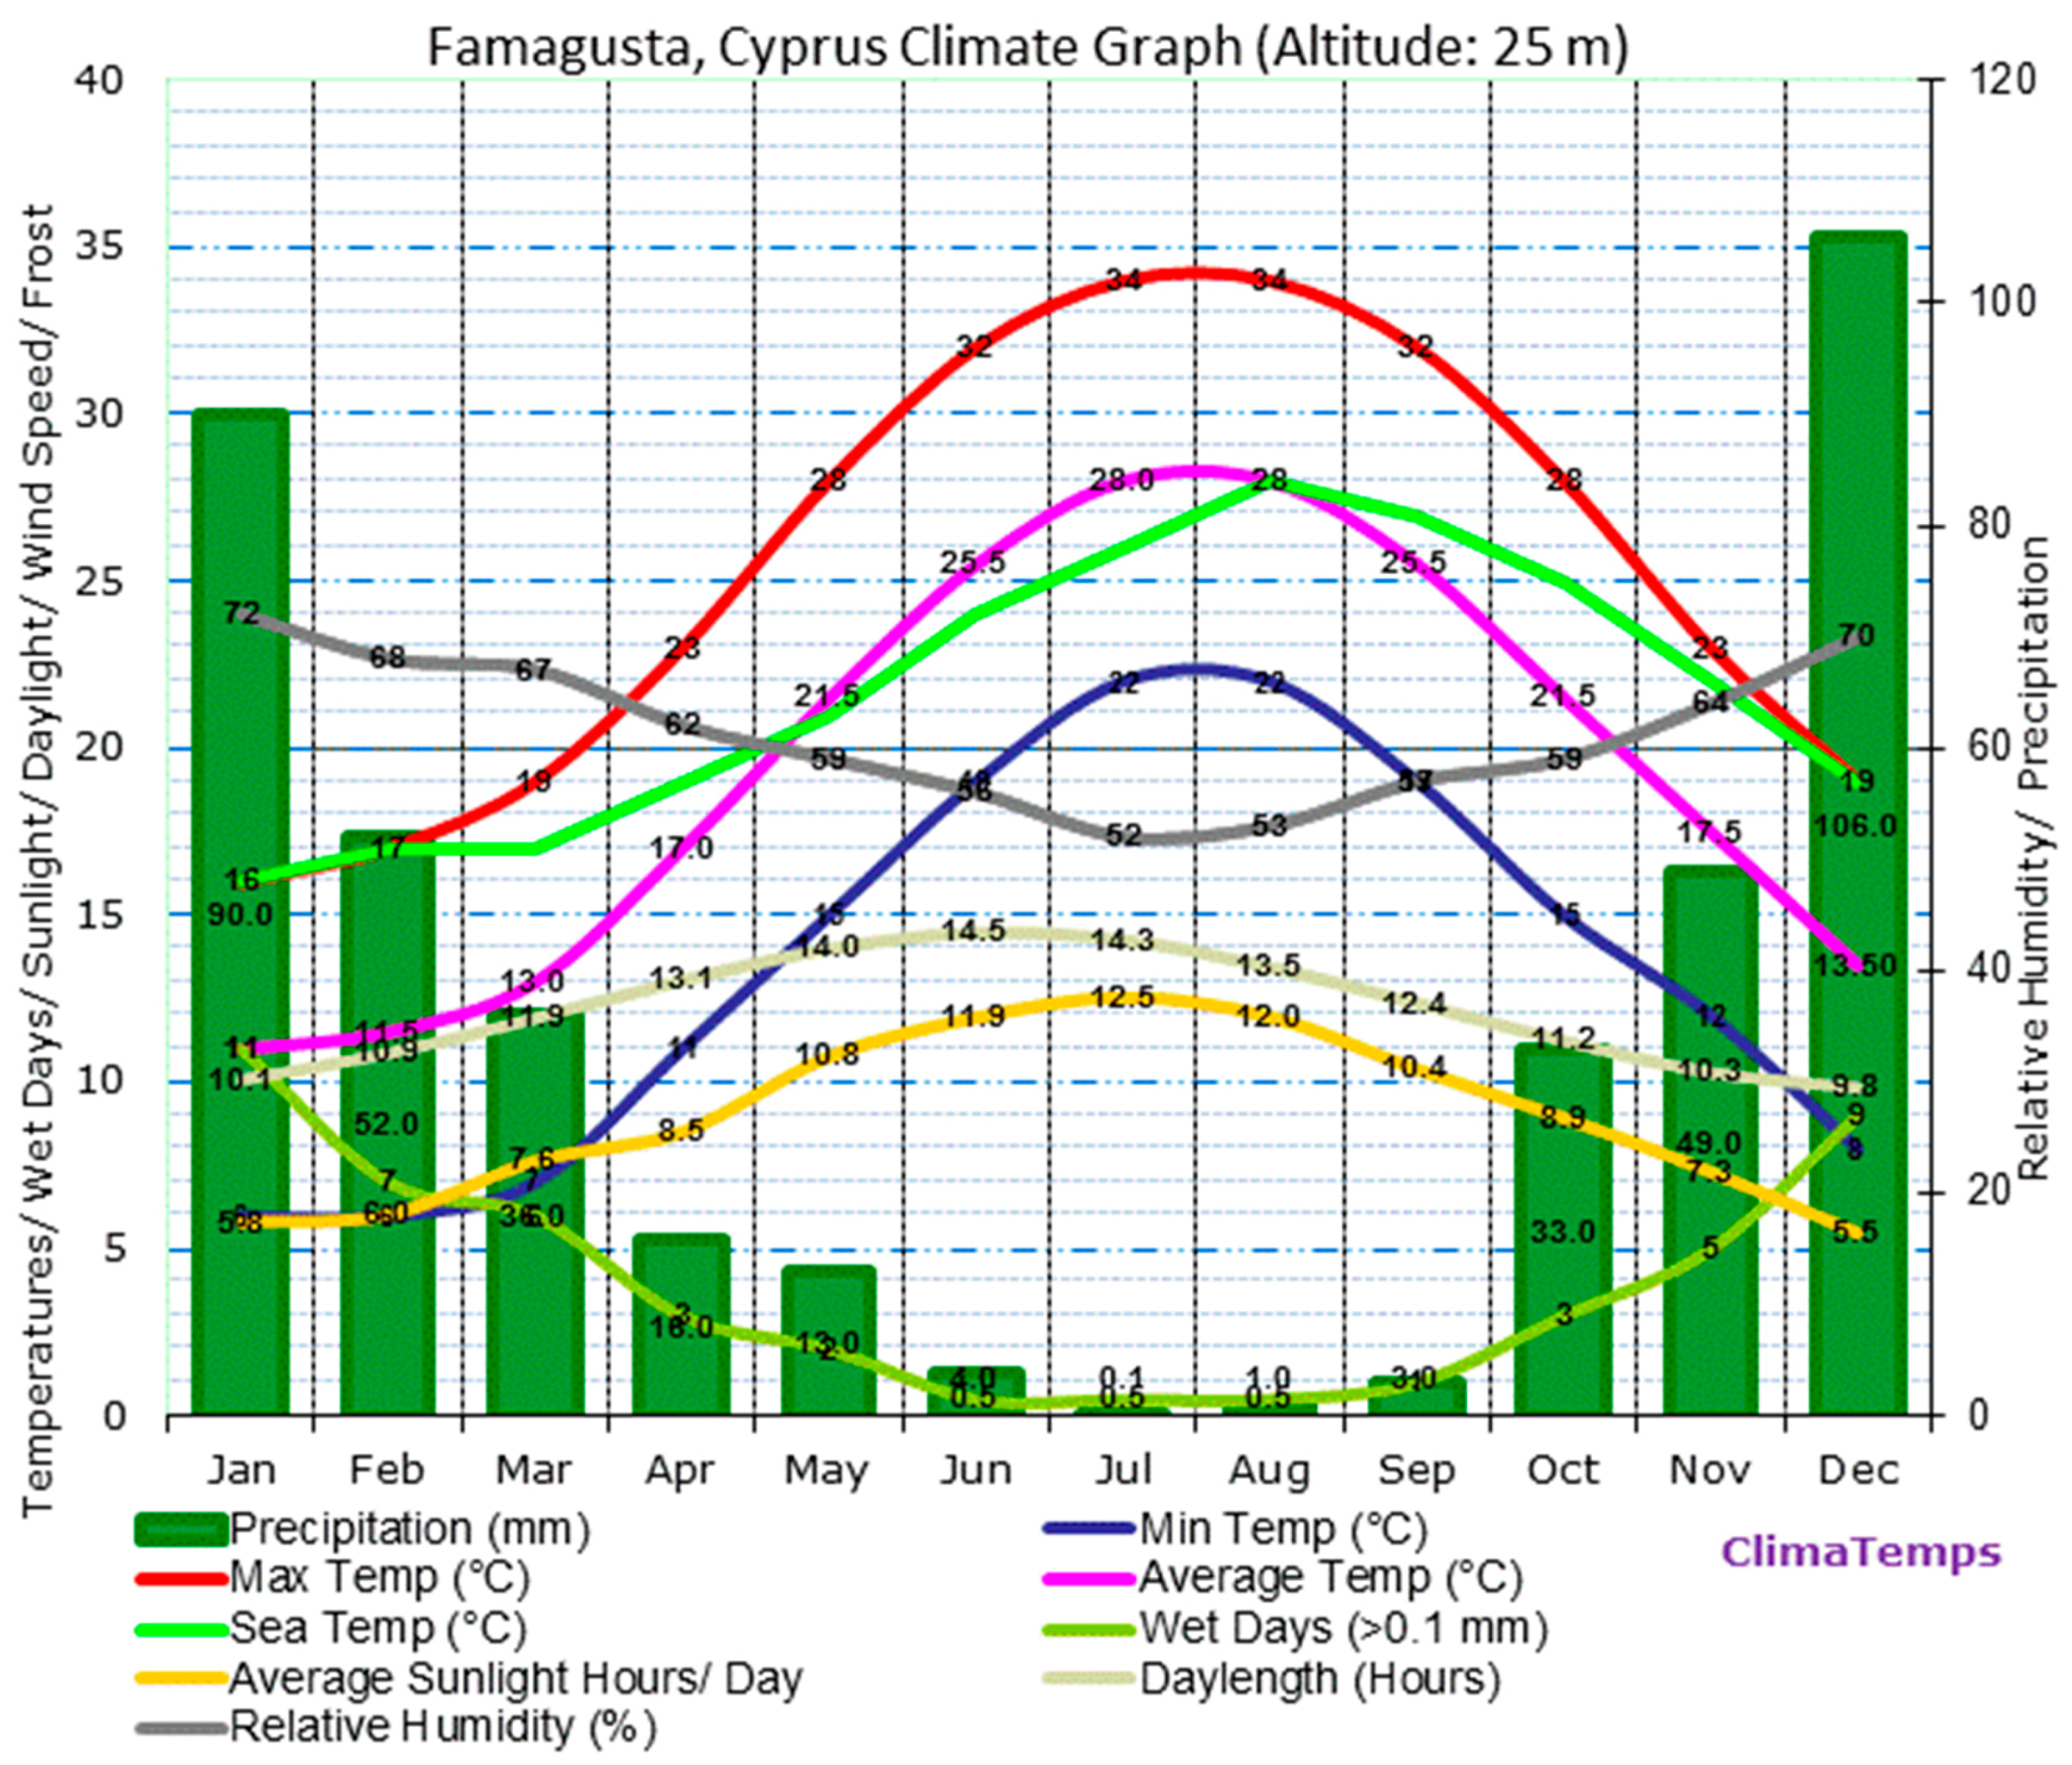
The case study is located in Cyprus-Famagusta, one of the largest islands in the Mediterranean Sea (35° Latitude, 33° Longitude). With a humid-hot climate, the temperature rises above 30 °C in the hottest months during the typical summer season, and the temperature decreases to 3 °C in the winter season (
Figure 1), as stated in the Cyprus meteorological station report about Famagusta [
33].
According to its location, Famagusta has high solar energy during the winter (5.26 kWh/m2/day), which rises to 7.12 kWh/m2/day during the summer season.
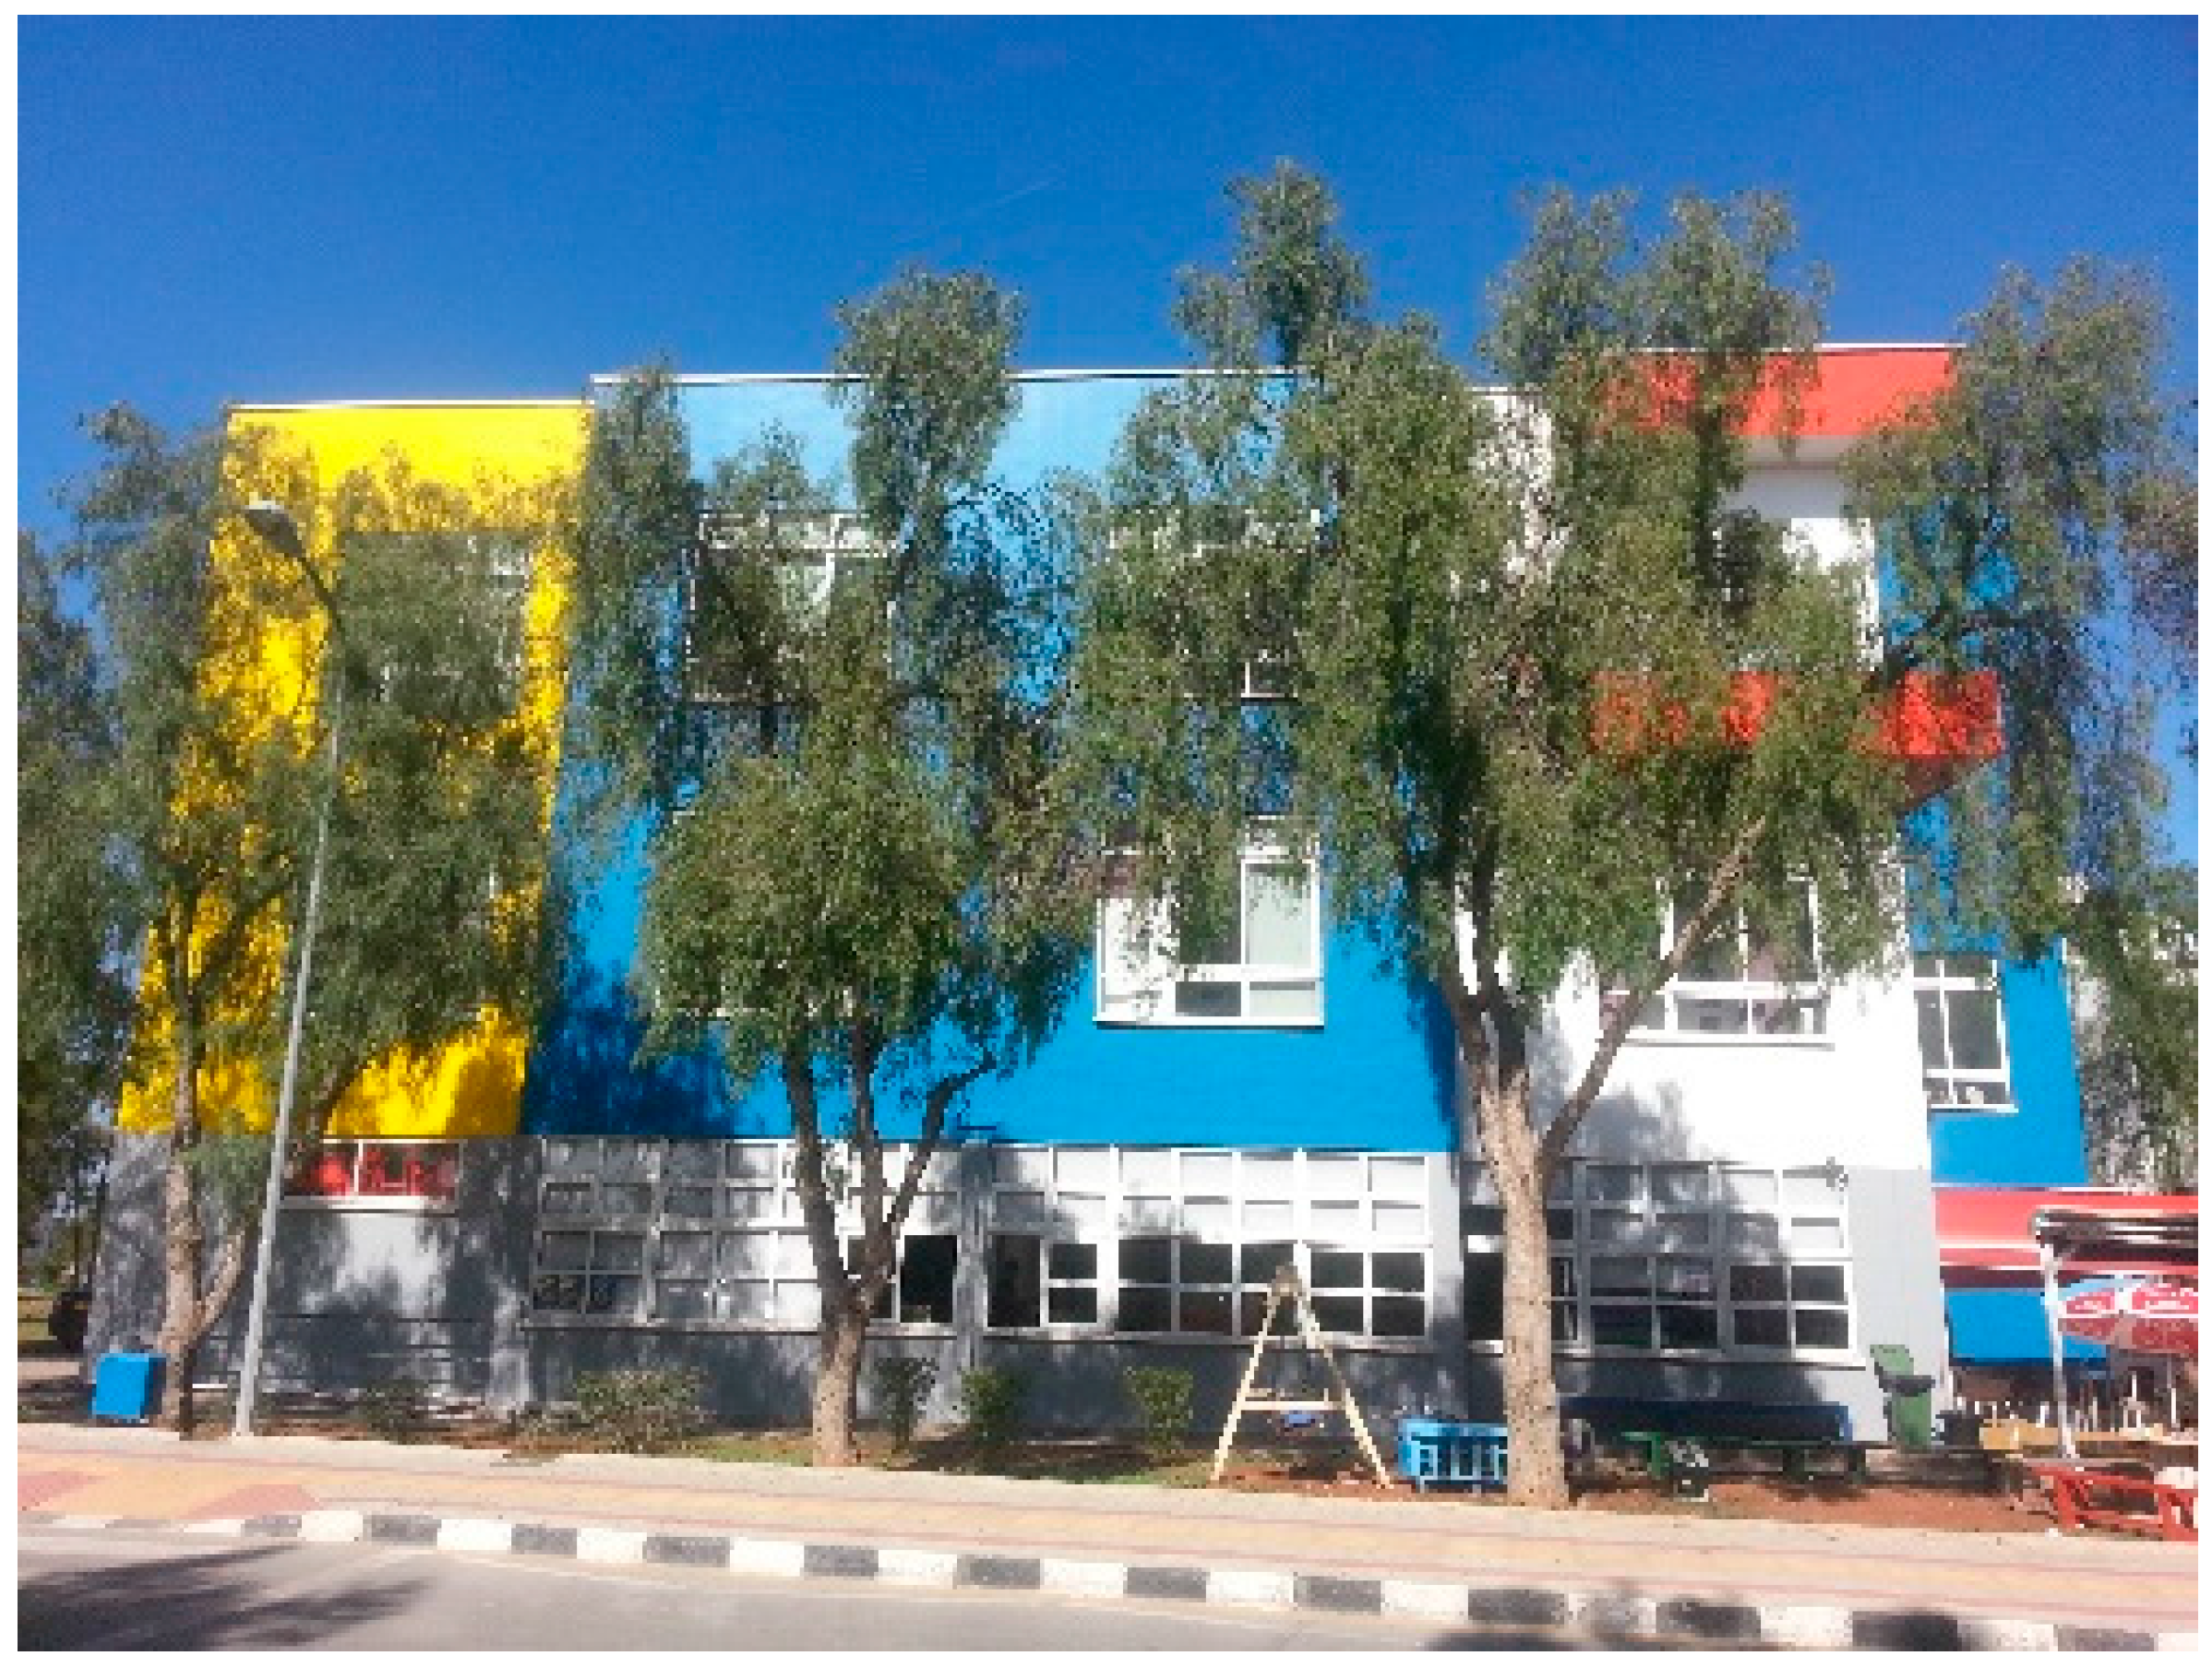
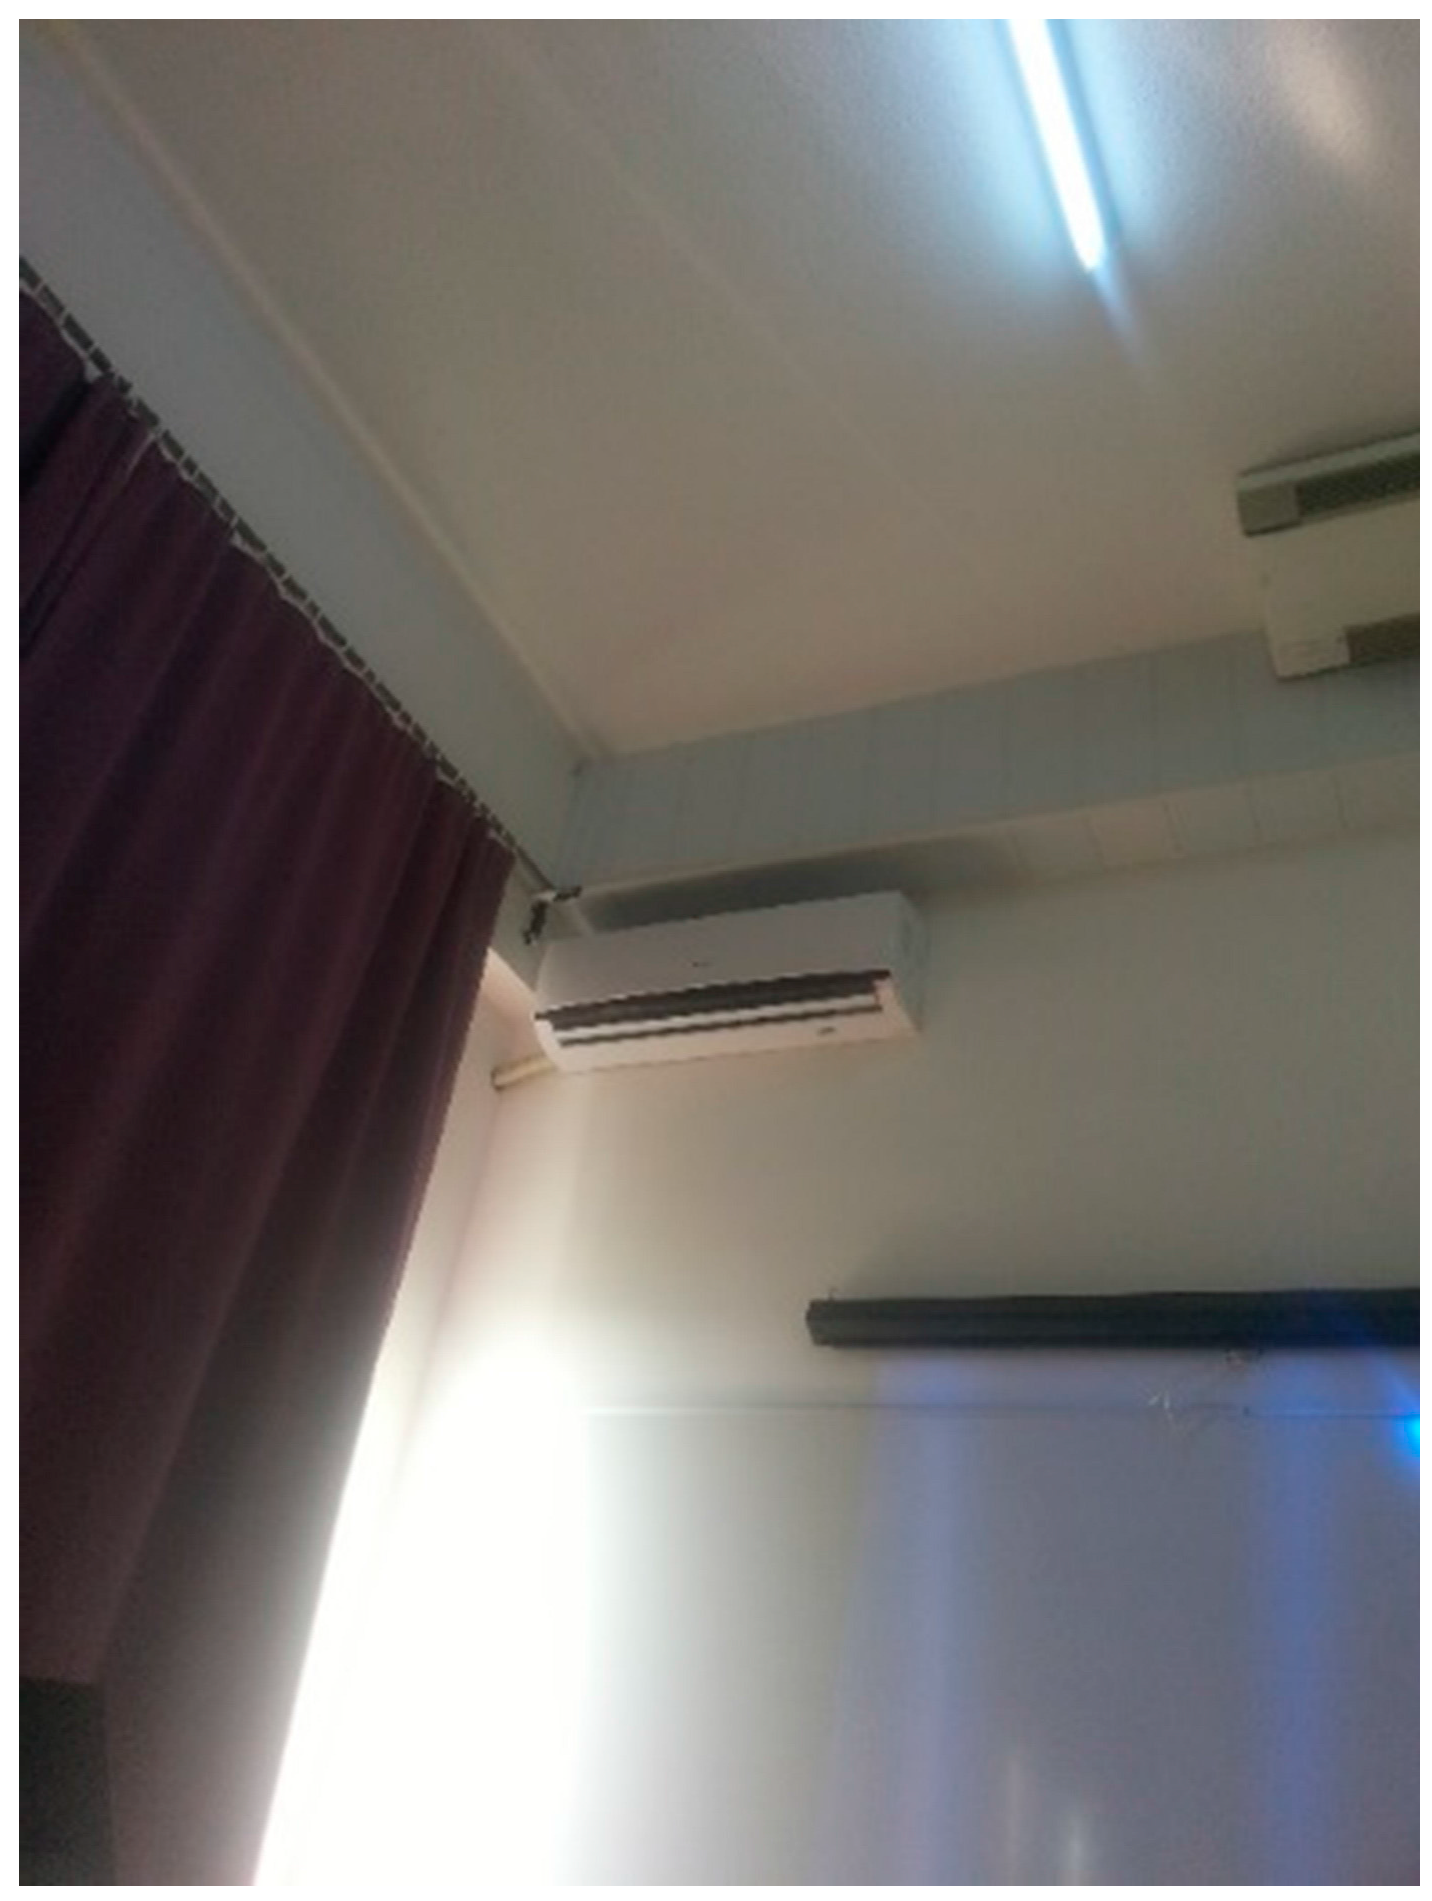
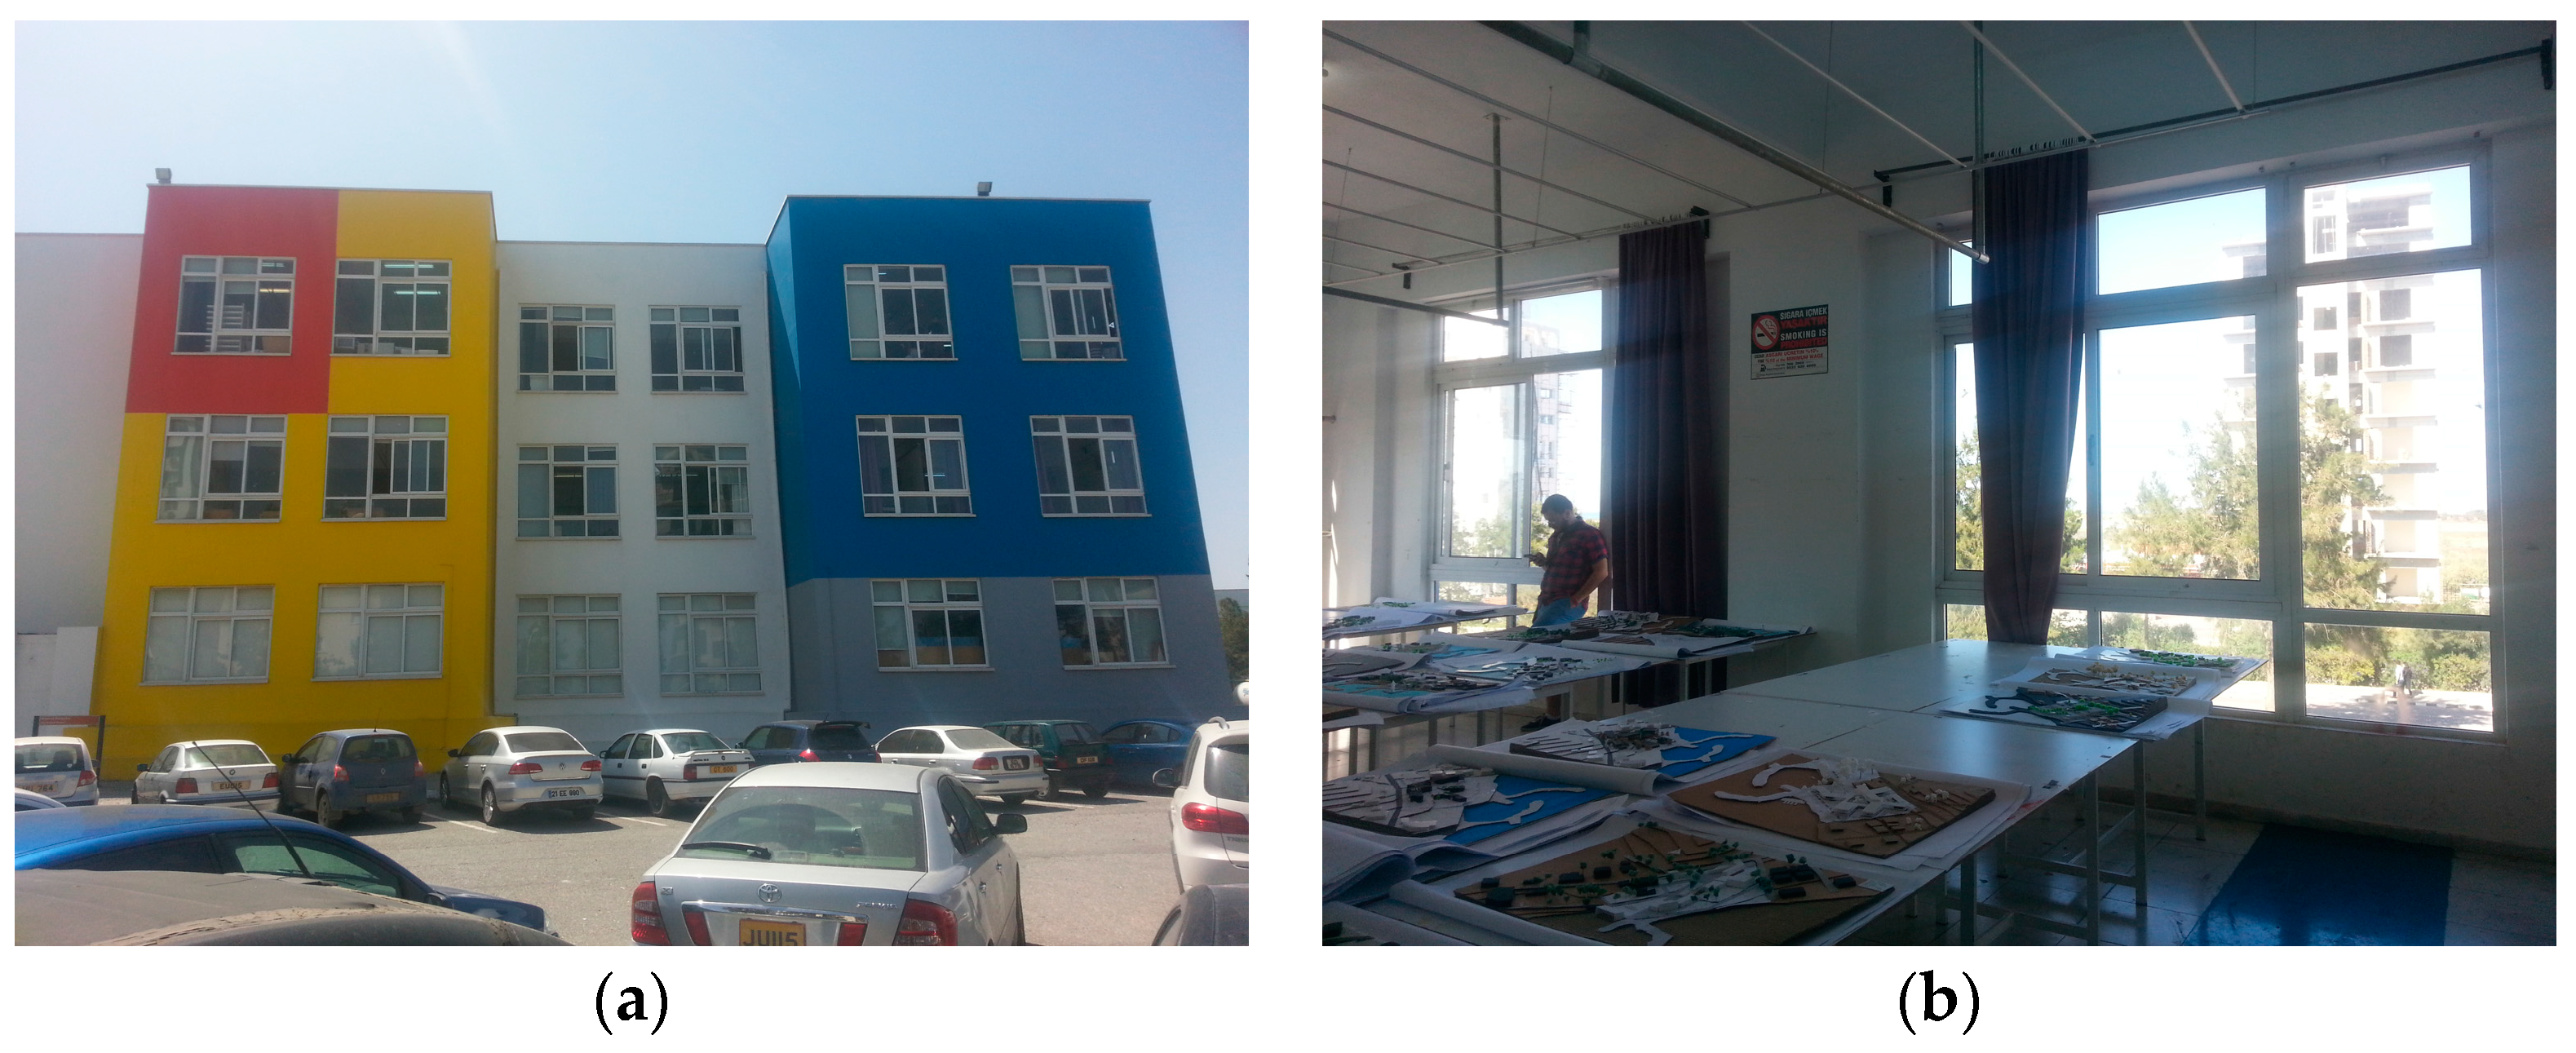
3.1. Case Study: Observation Findings and Analysis
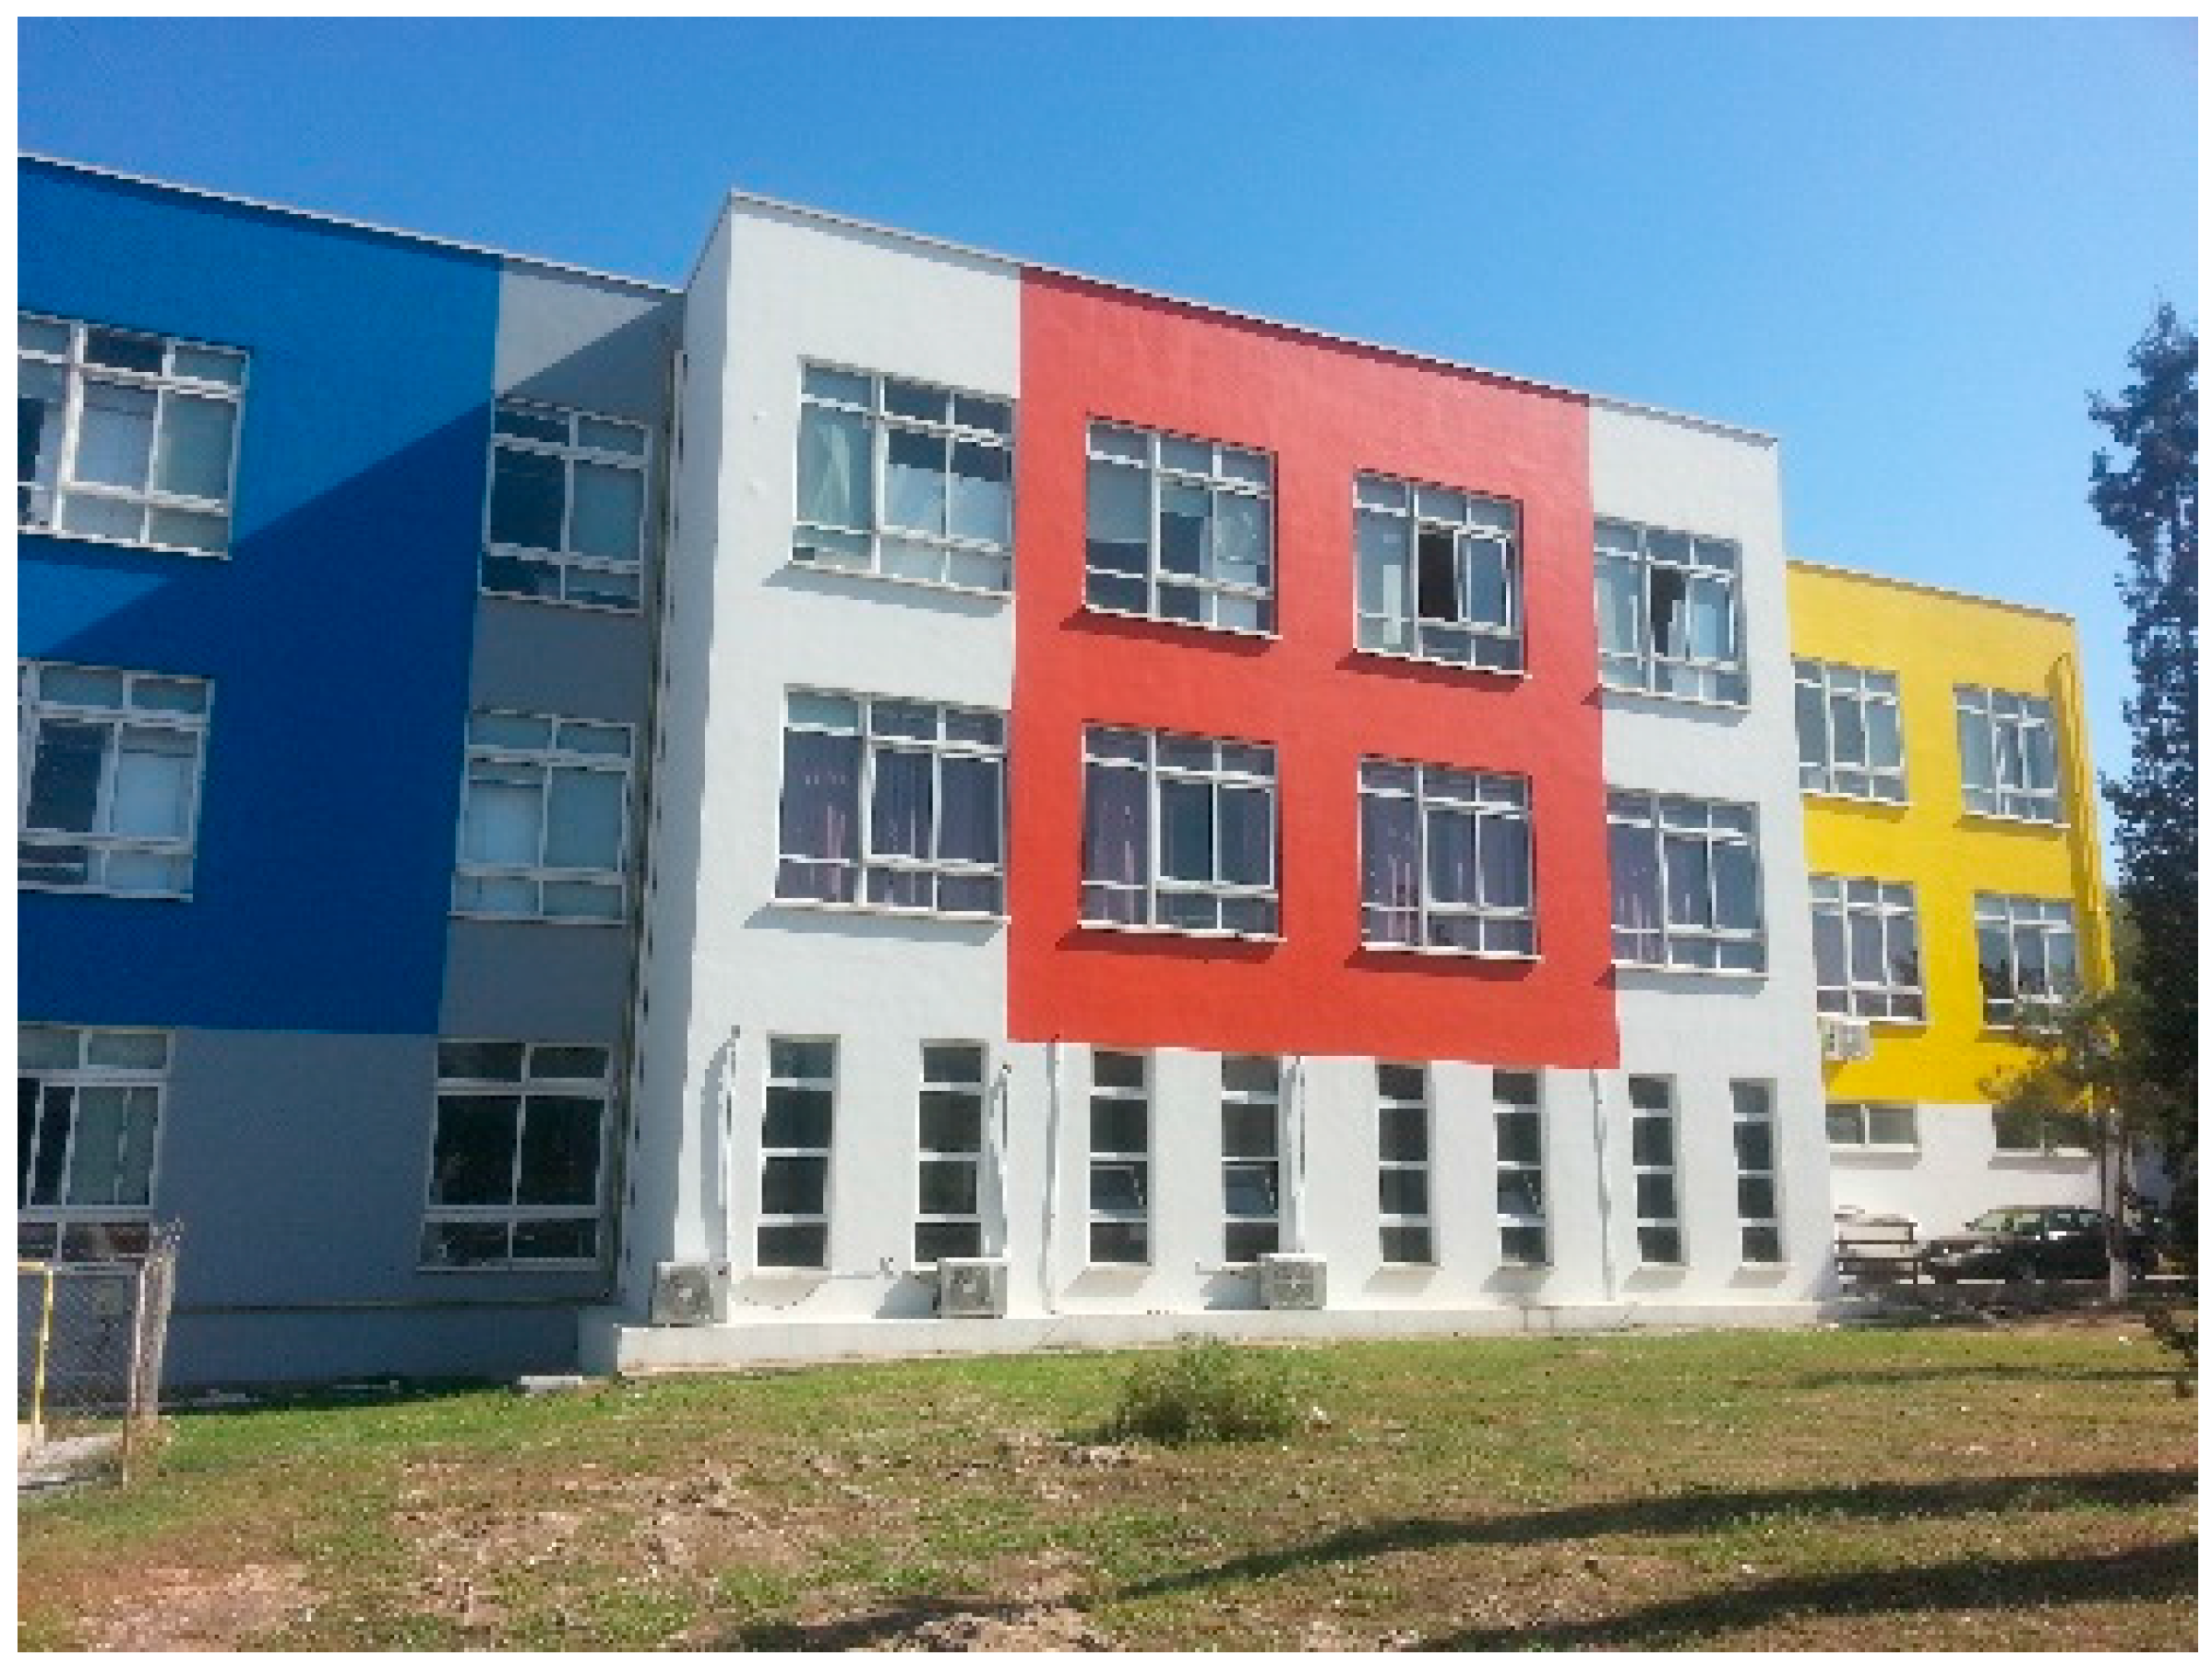
The Colored Building is an educational building with a rectangular shape and has three floors, containing a library and a seminar room, and most of spaces are studios for architectural students. The building is oriented 31° to the north and 59° to the east.
3.2. Case Study: Simulation Findings and Analysis
As it has been stated before in the Methodology section, the case study has been analyzed via computer software tools (Autodesk Ecotect) according to its original orientation and weather conditions. By entering the building envelope parameters and material specifications and glazing transparency, the program can analyze the inputs and provide accurate data on an annual basis which helps to evaluate different passive design elements that influence the energy efficiency of the building.
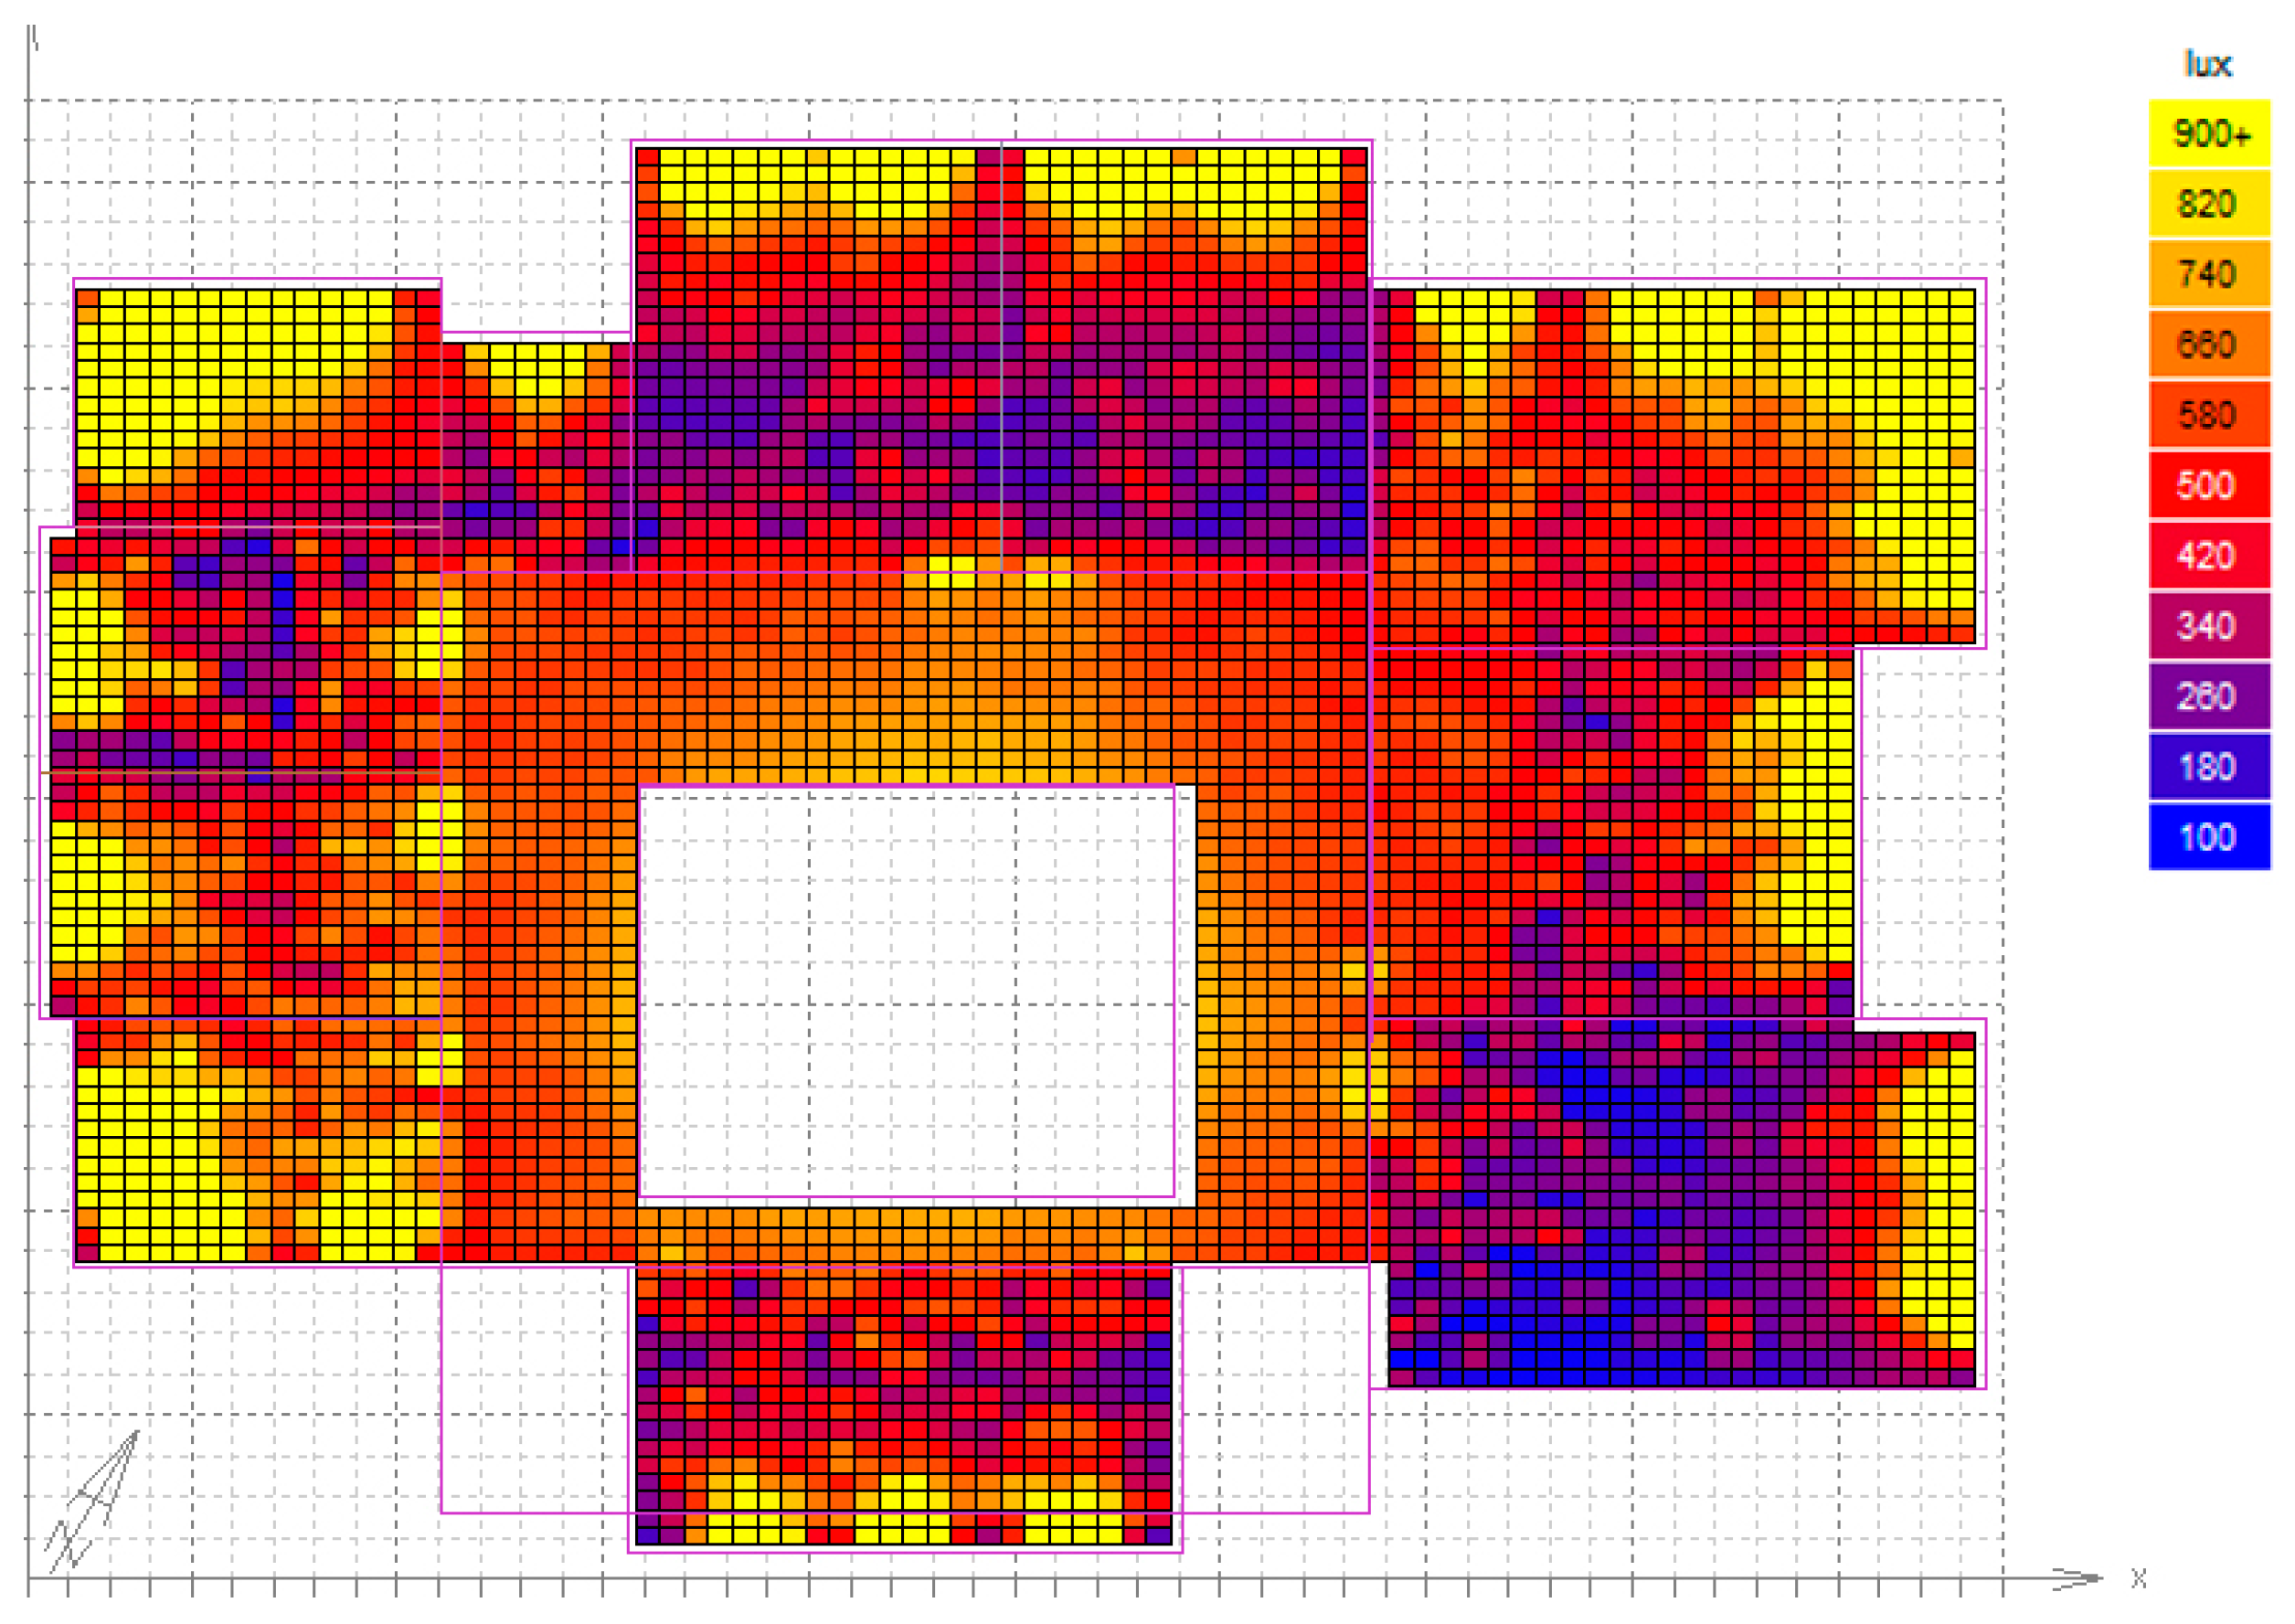
The analysis of daylighting has been conducted according to the sun path during the year and the transmittance and sizes of the windows in all orientations. The results show more than 1100 lux illuminance of daylighting in the interior spaces, the yellow color range shows a high level above that required, as seen in
Figure 7 due to the lack of exterior shading devices, especially of the southwest facade, which faces the most sun radiation during the summer season and causes overheating to the interior spaces.
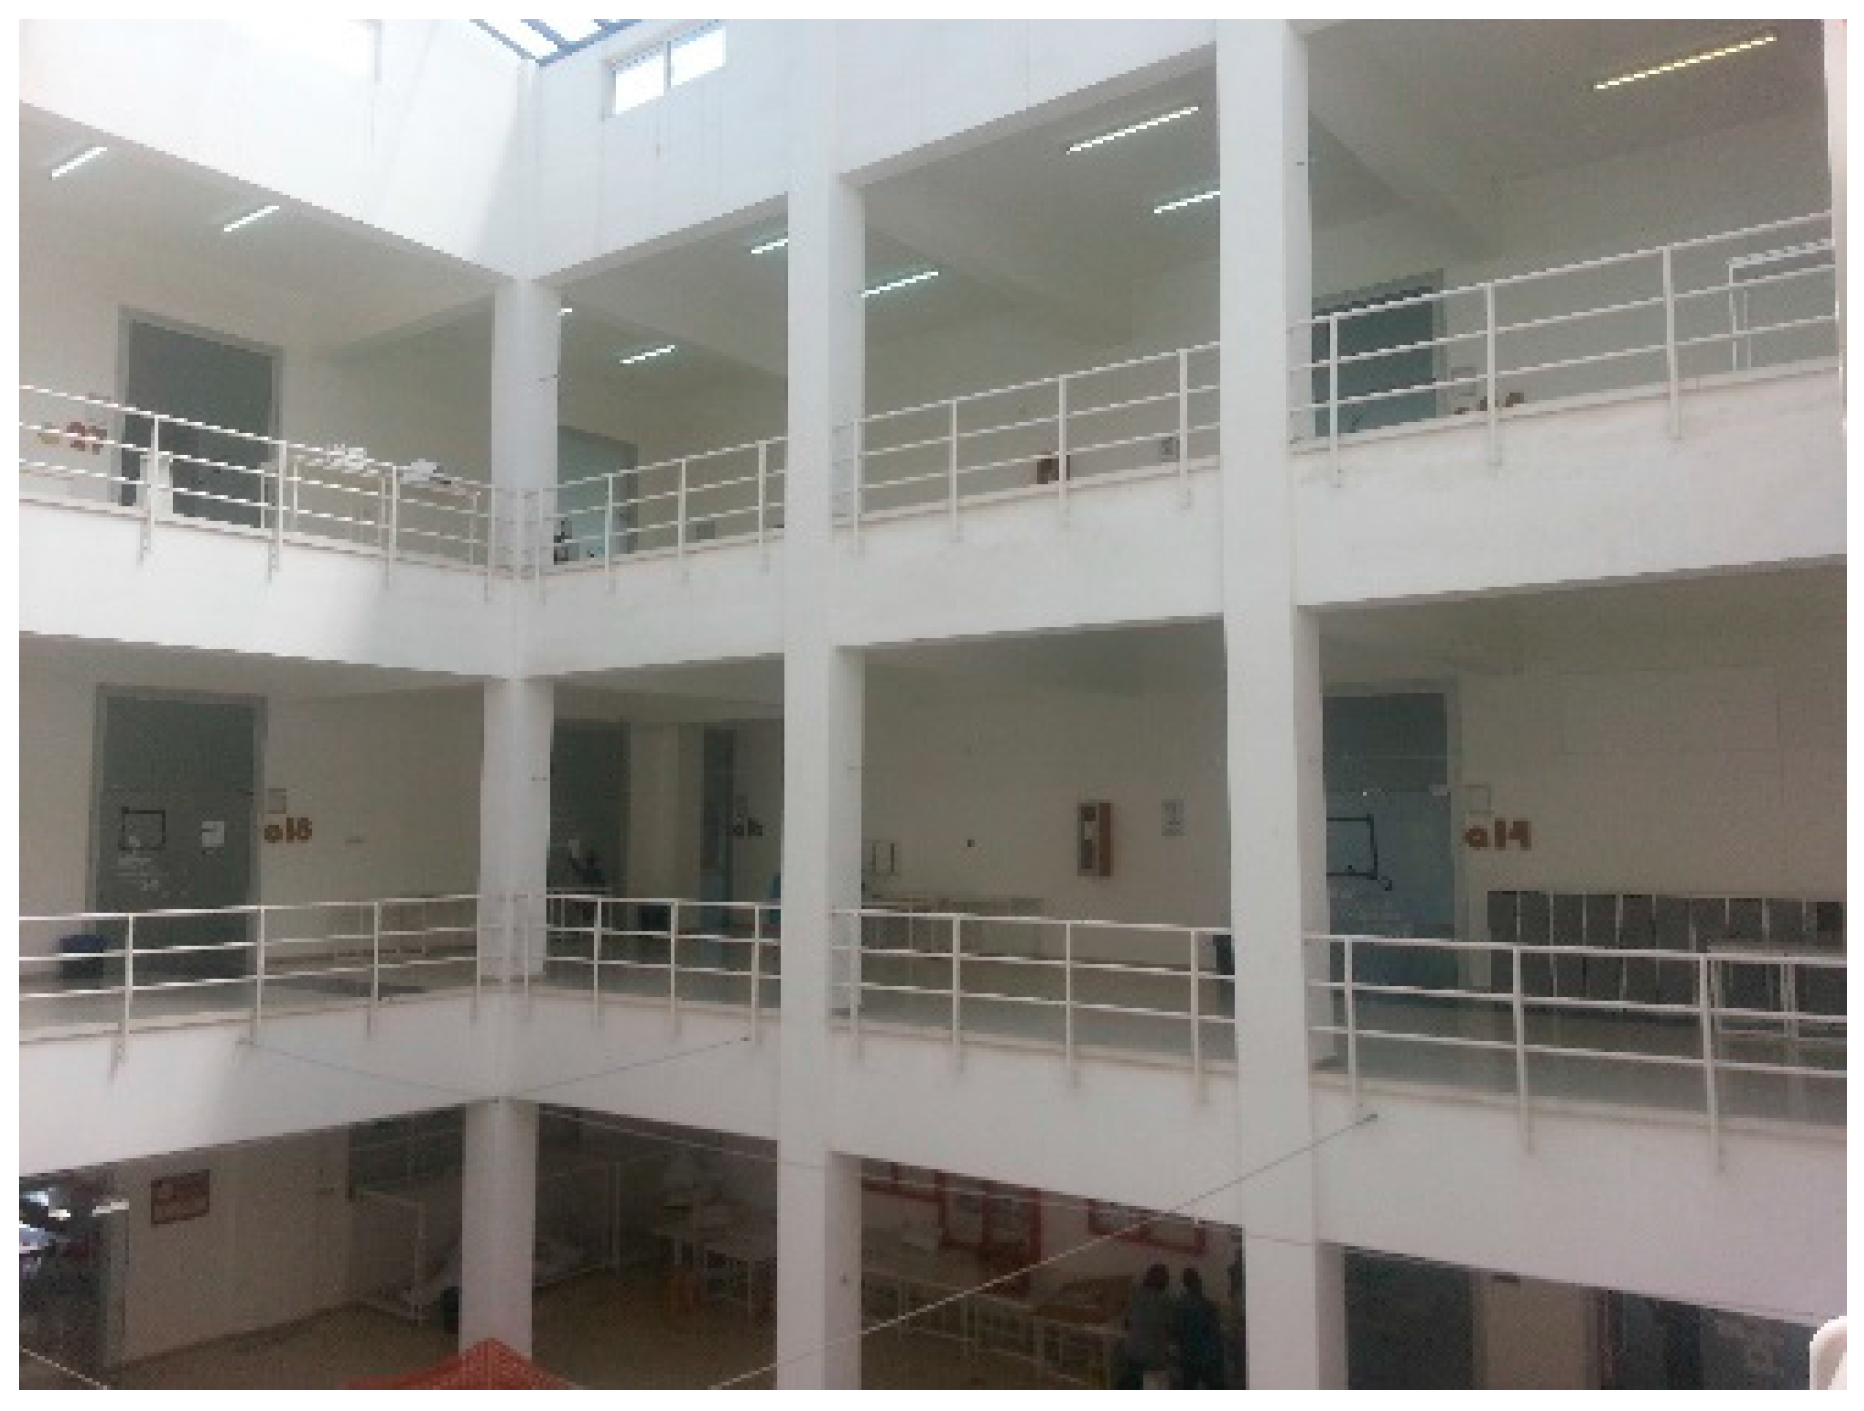
The skylight in the atrium provides acceptable daylight levels (red colour range) to the deep spaces in the building such as the corridors during the day. On an annually basis, this shows that the artificial lights are not required during the day.
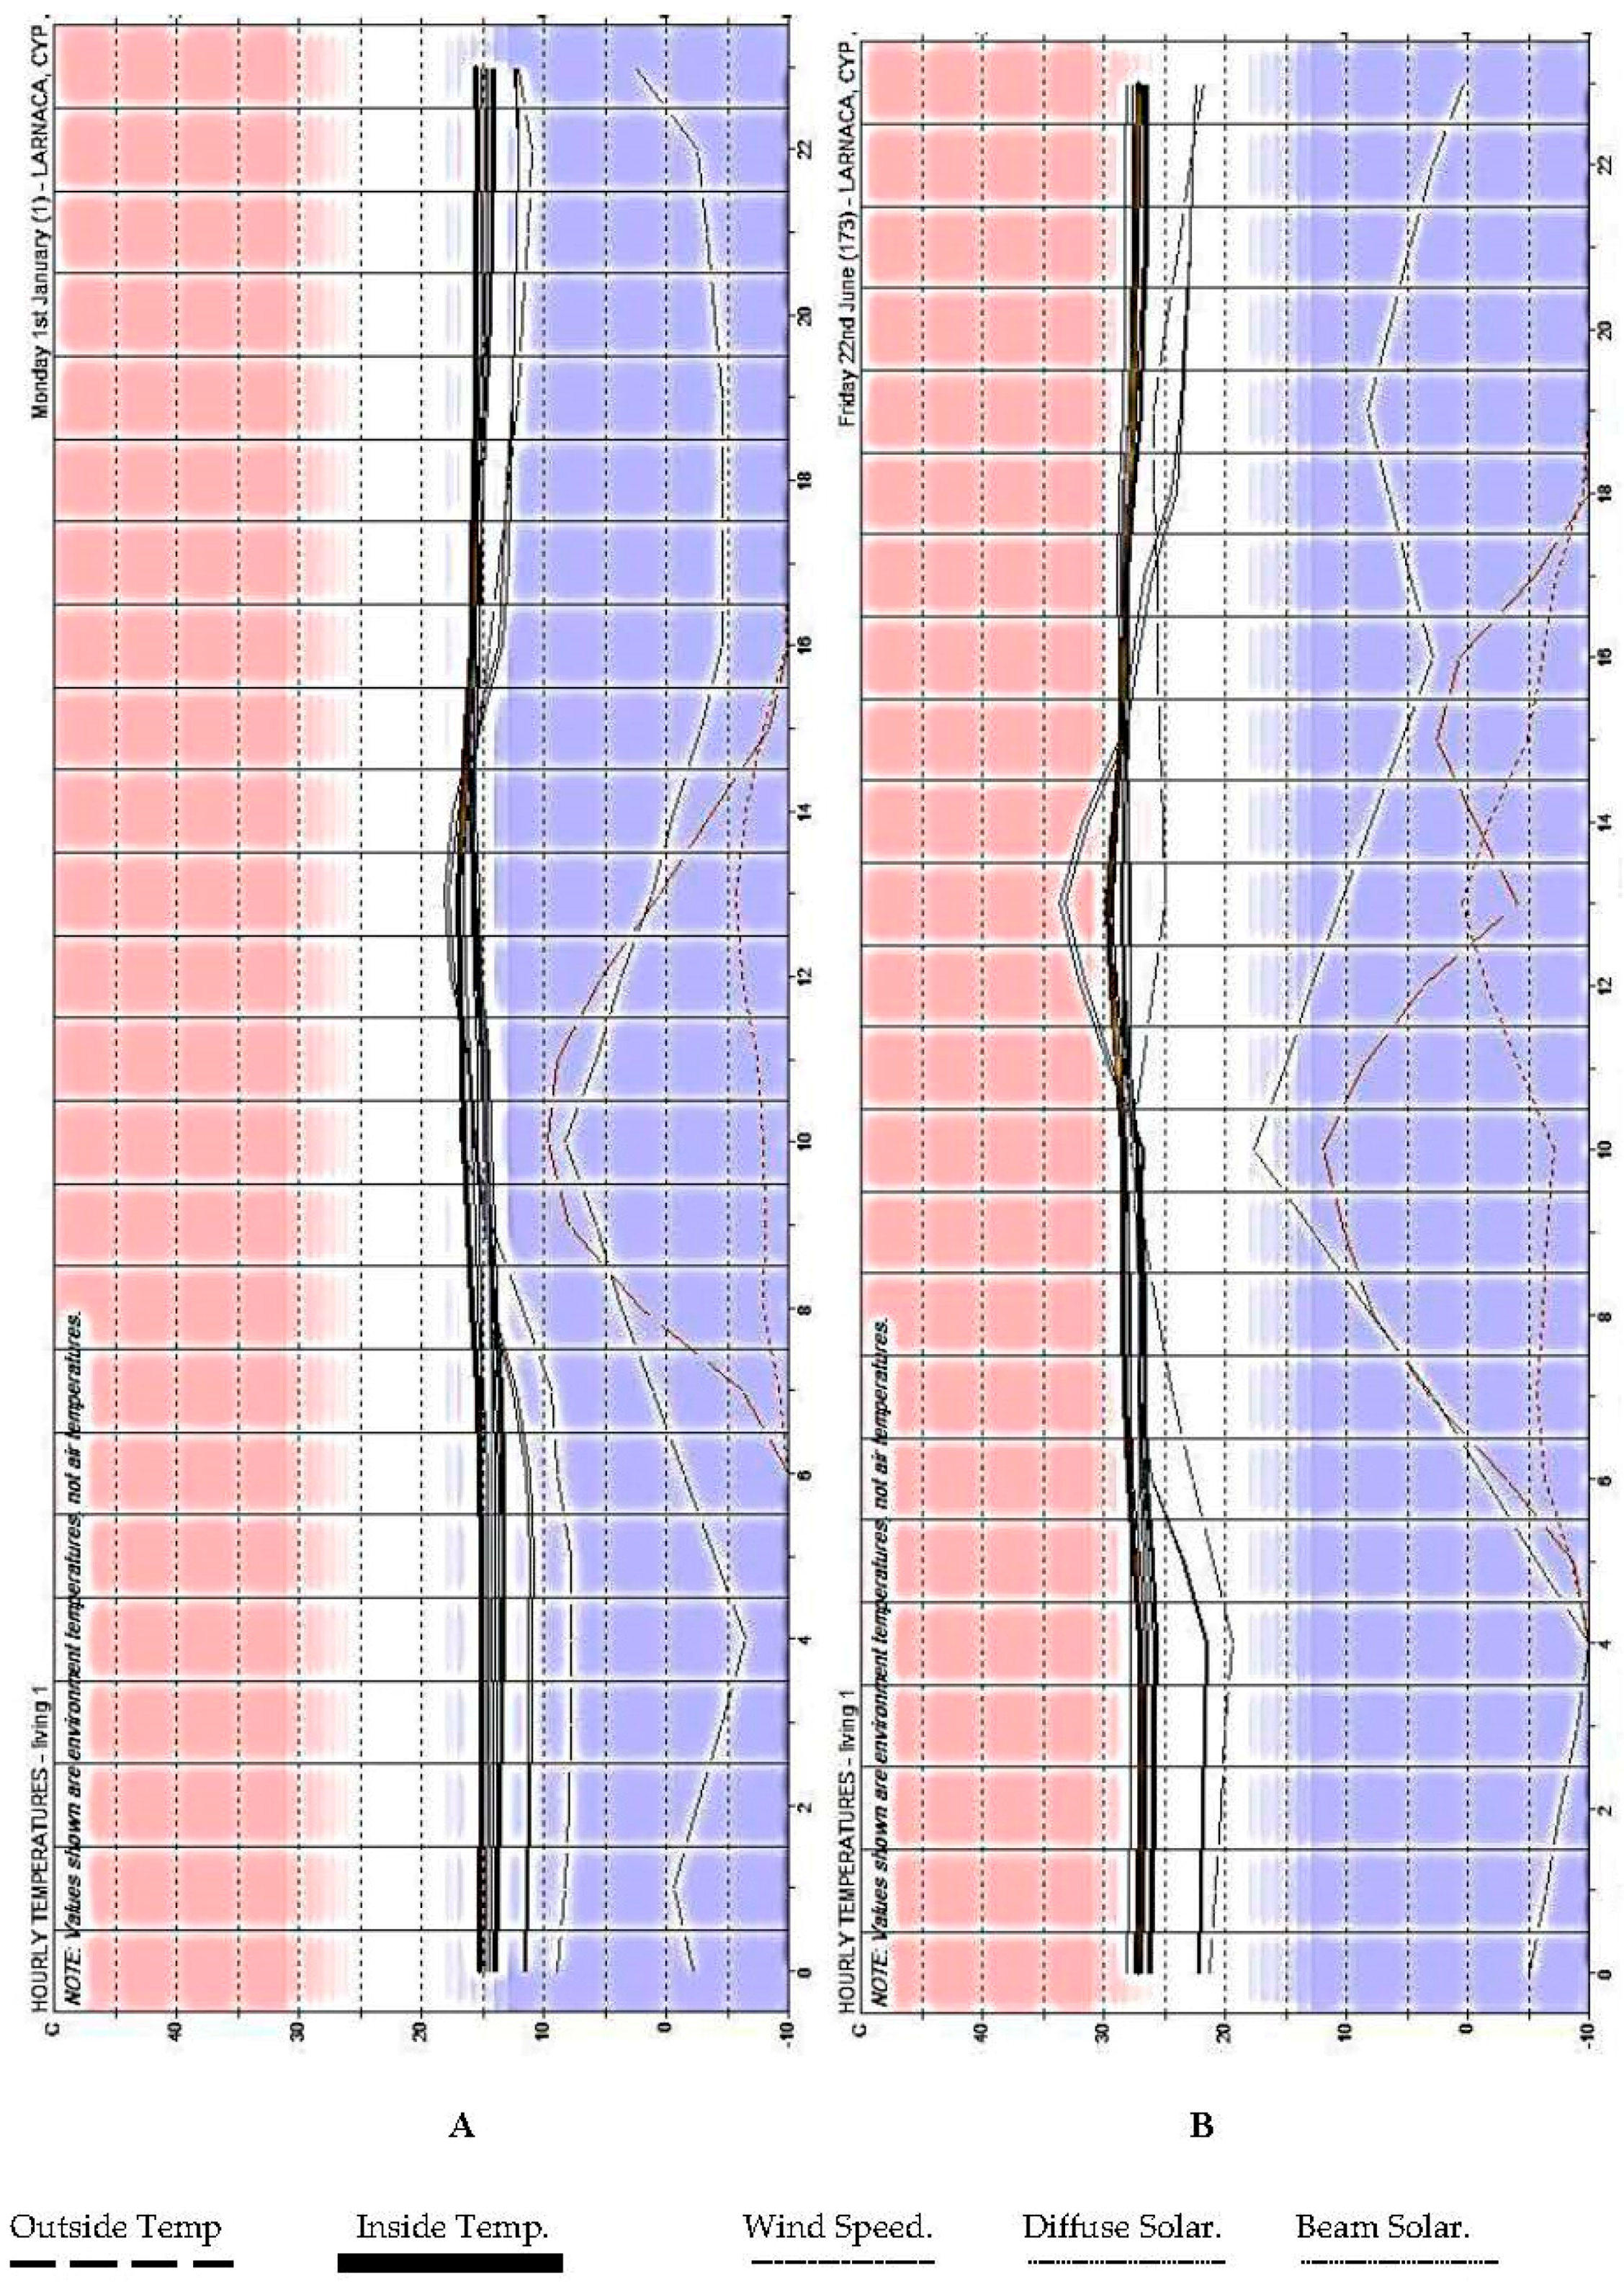
In terms of the interior environment, on an annual basis,
Figure 8 shows hourly temperatures which are examined to define the temperature variable between seasons in the interior spaces. These are used to calculate the cooling/heating load demanded that provides thermal comfort for occupants, and determines the total heat gain according to the building construction materials (walls and windows). The results are as follow:
- (1)
From November to March (winter season): the average internal temperature is between 8 °C and 15 ° C.
- (2)
From April to October (summer season): the average of internal temperature increases to between 20 °C and 33 °C.
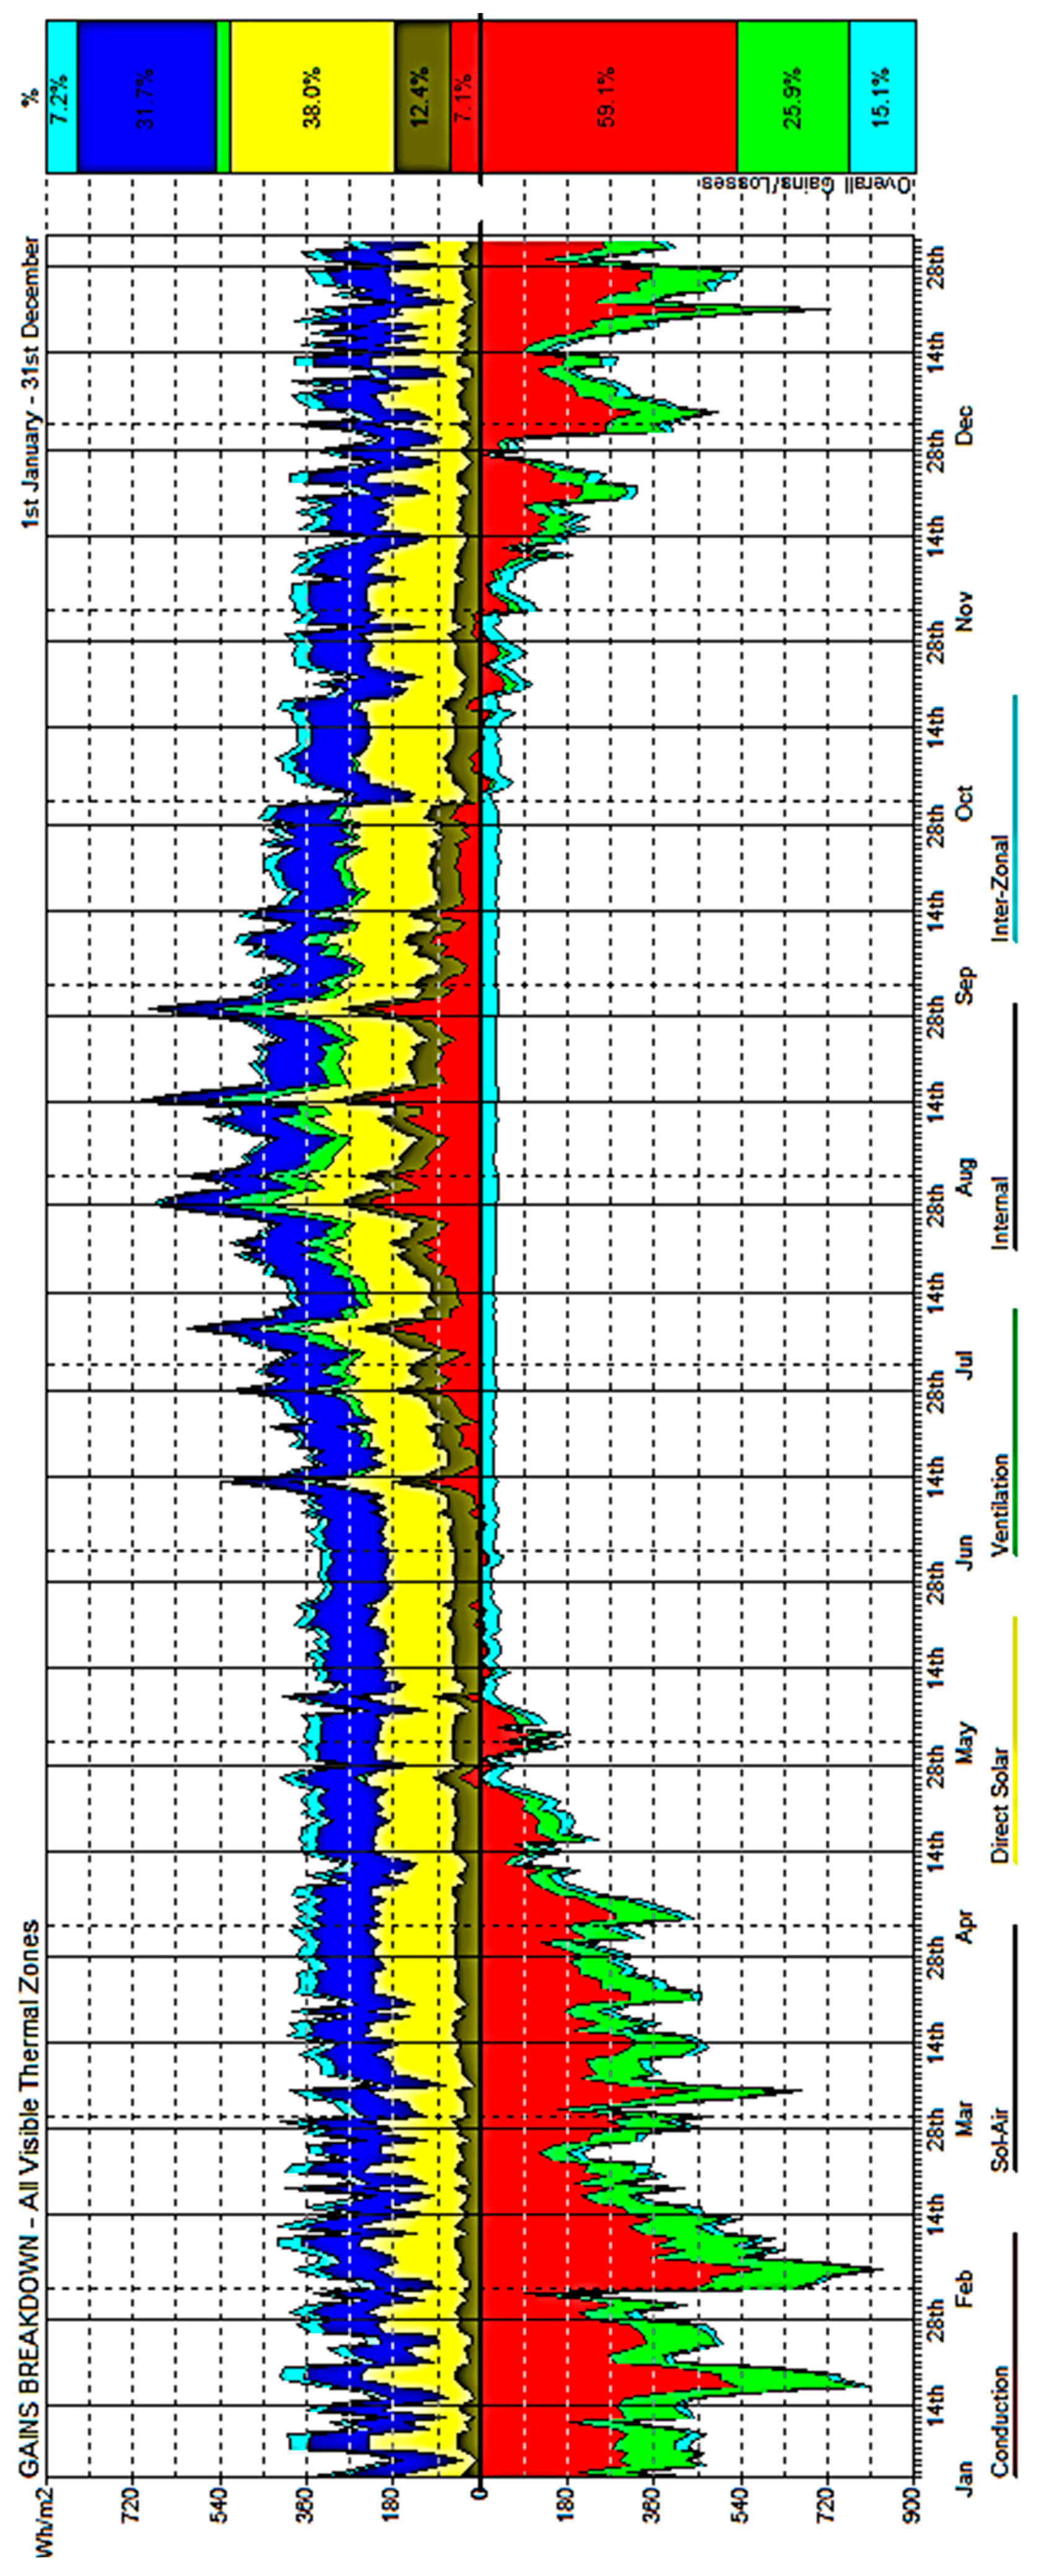
Accordingly, electric energy demand for heating/cooling increases due to the following building envelope solar gain breakdown chart, as seen in
Figure 9, which shows where the heat loss or gain coming from:
About 60% (red color) of the building thermal loss in winter is caused by material conductivity because of the poor thermal insulation while just 7% of the total gain is from the same factor in summer.
About 12% gain is from sol-air (brown color) because of the monocular heating of the building material.
Direct solar radiation (yellow color) is responsible for 38% of heat gain through the year because of the lack of exterior shading and the windows transparency.
Opening sizes, which have a direct impact on ventilation, are major factors causing a 26% drop (green color) in total thermal loss during the winter.
About 31% of gain is from internal spaces (blue color) and a small amount of gain and loss is from the distribution between different spaces (inter-zonal indicator).
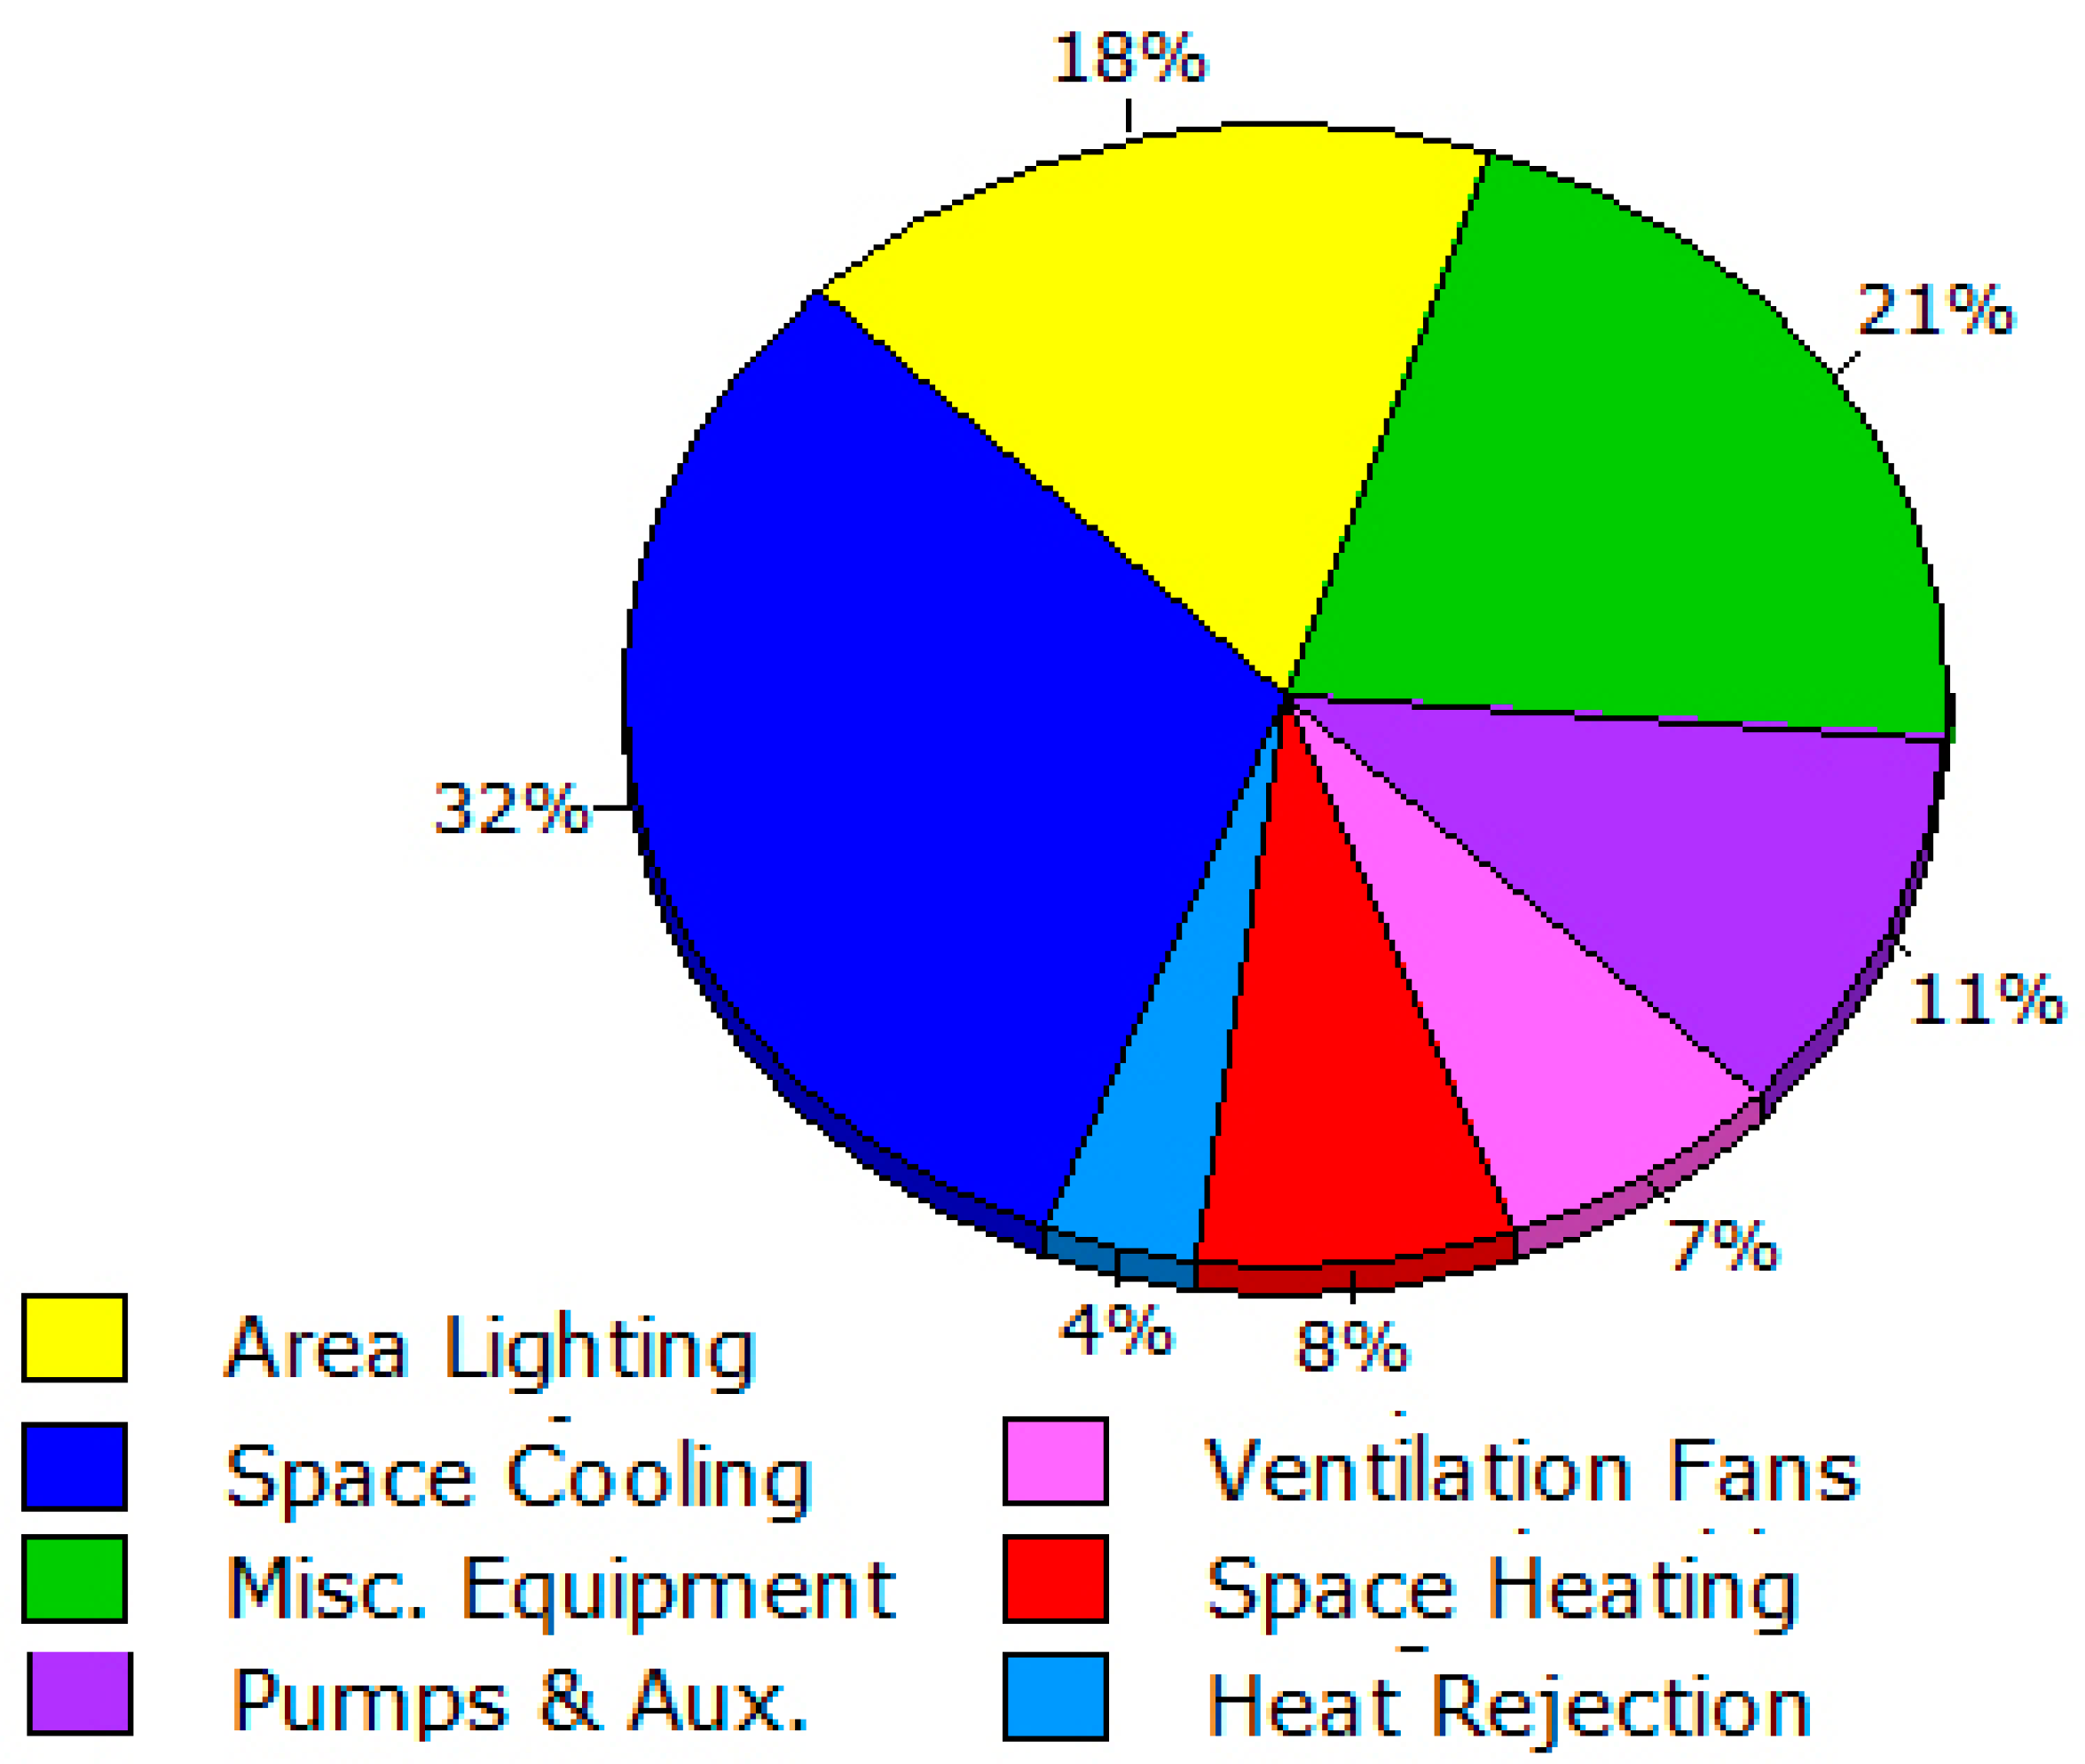
In addition to the previous data findings, an interview was organized with the technical office engineer at Eastern Mediterranean University to provide the technical data of the building. Taking into consideration the internal loads and operating timetables, artificial light efficiency, in addition to the HVAC systems and operating schedules, the building was simulated in software (eQuest) to analyze the annual energy consumption of the case study to accurately understand the energy consumption capacities on an annual basis. The energy breakdown was as follows, and as seen in
Figure 10.
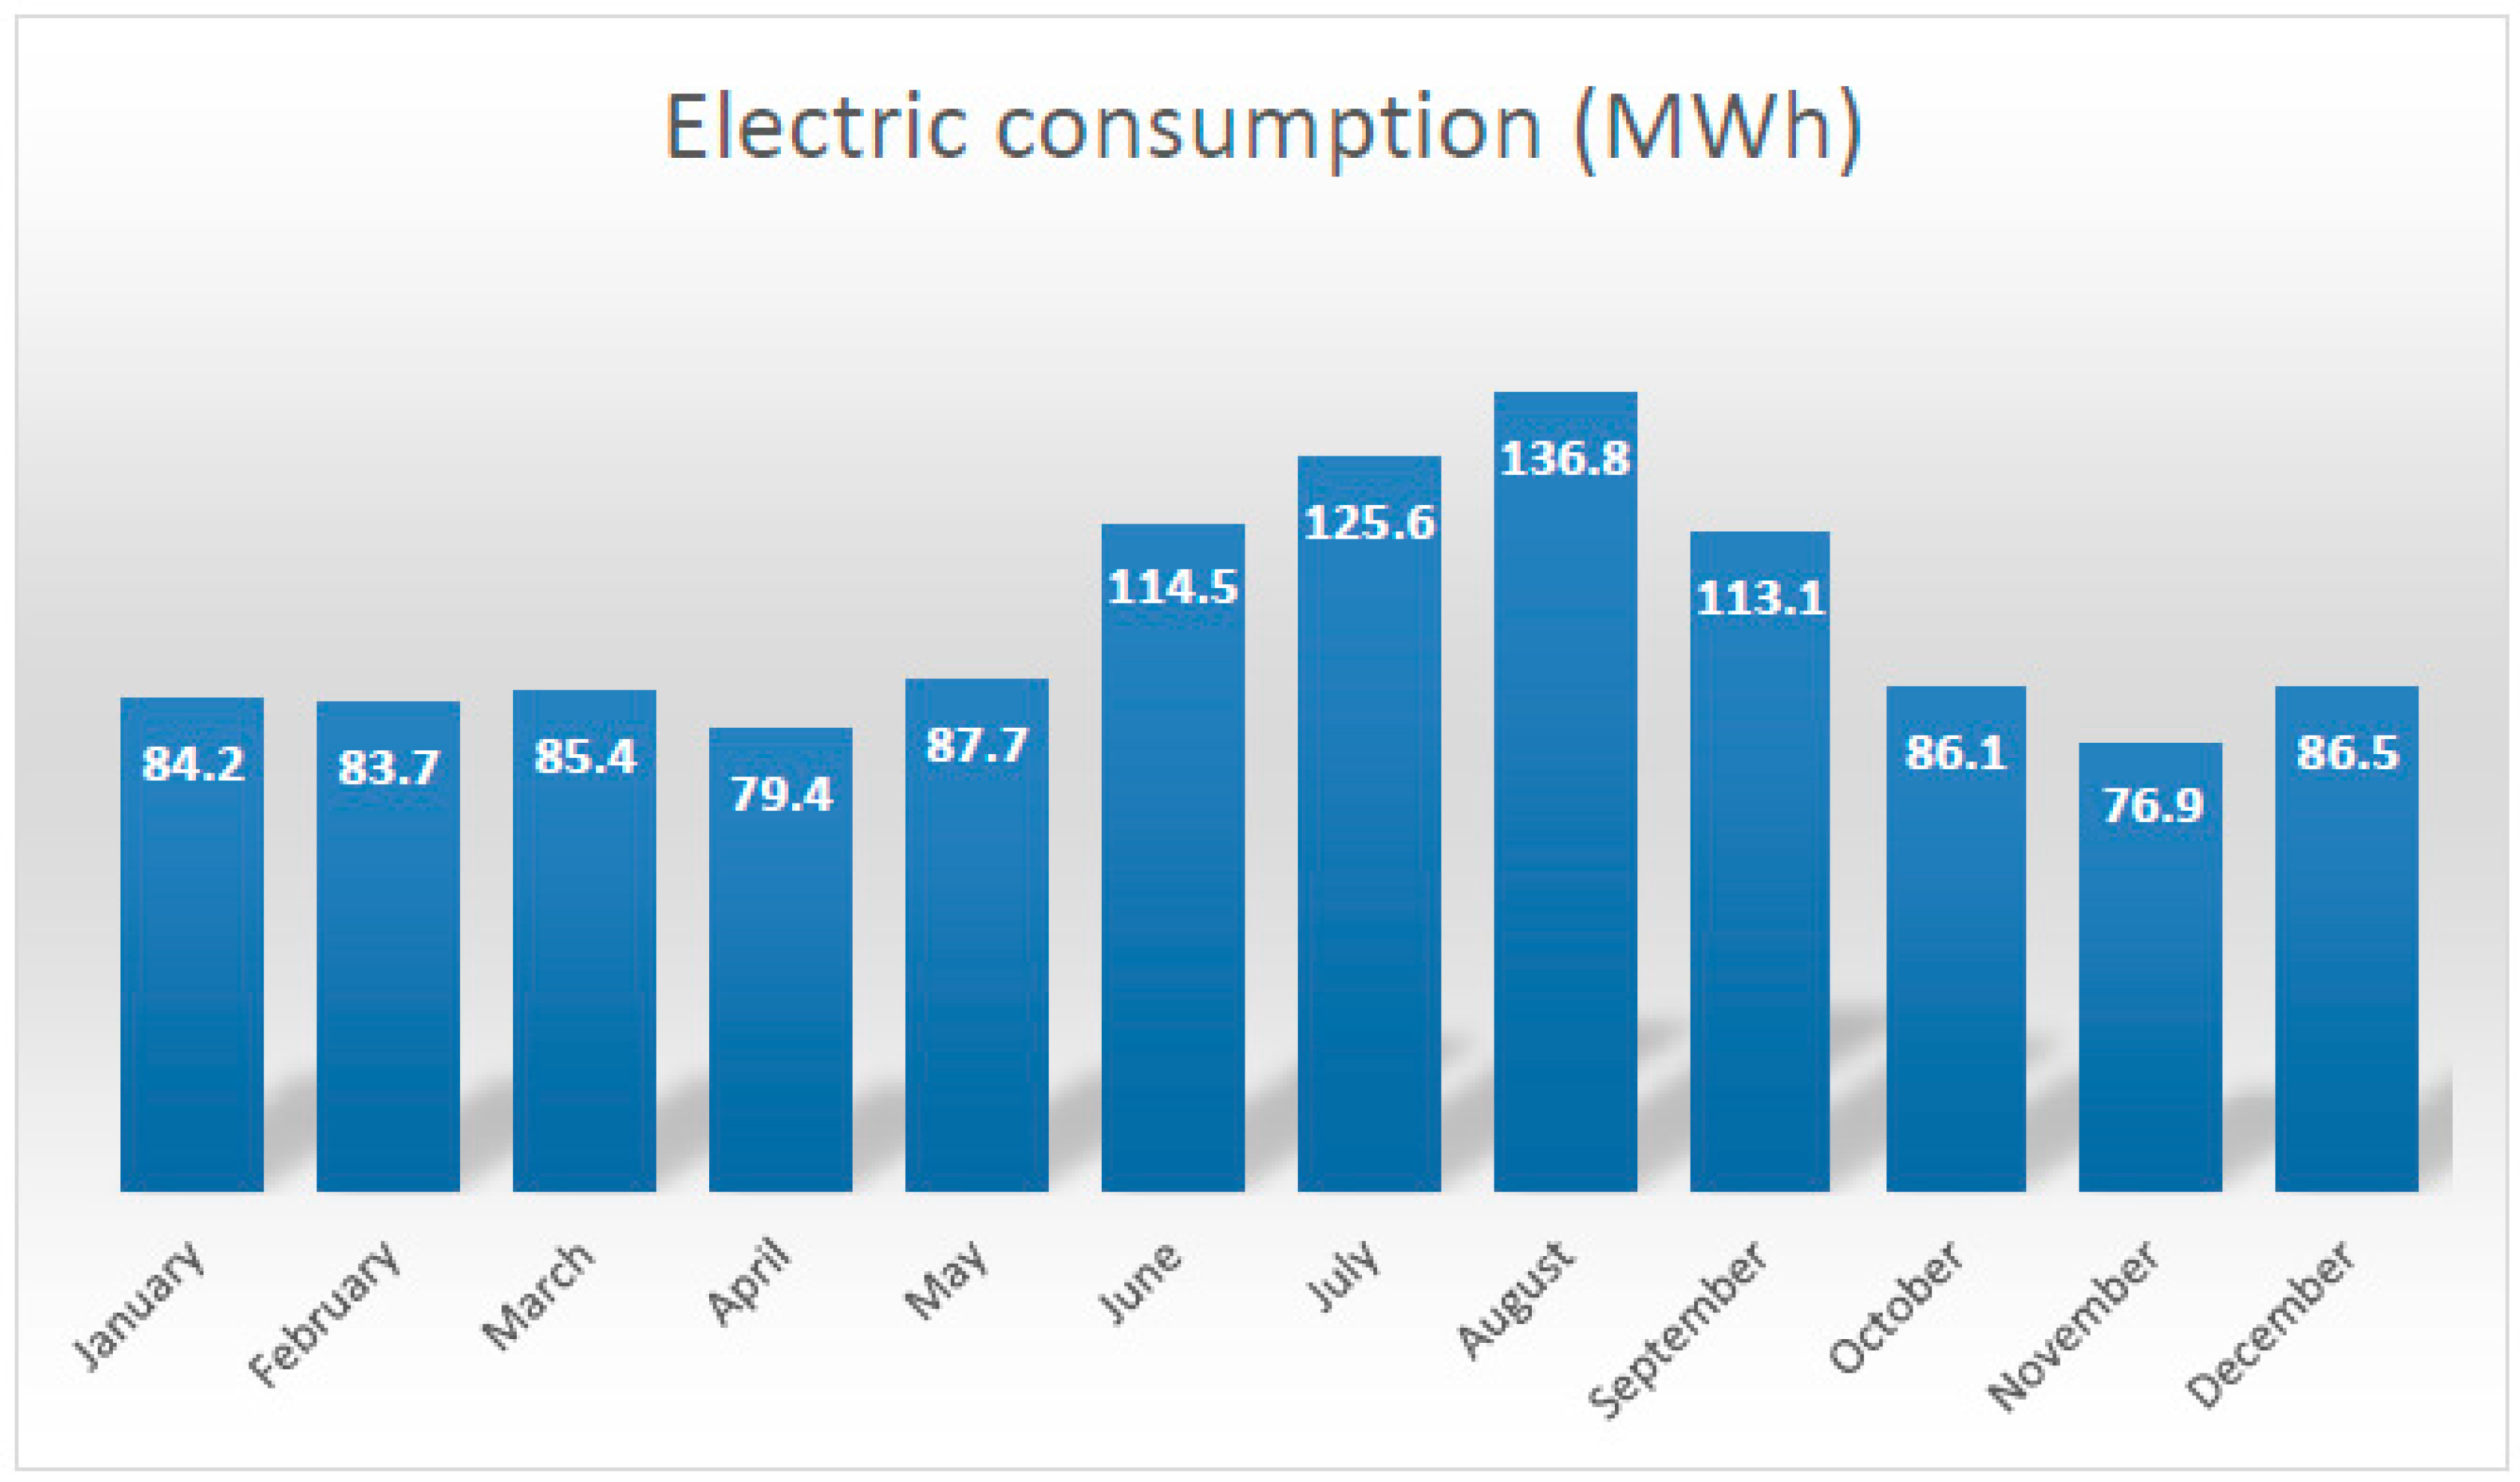
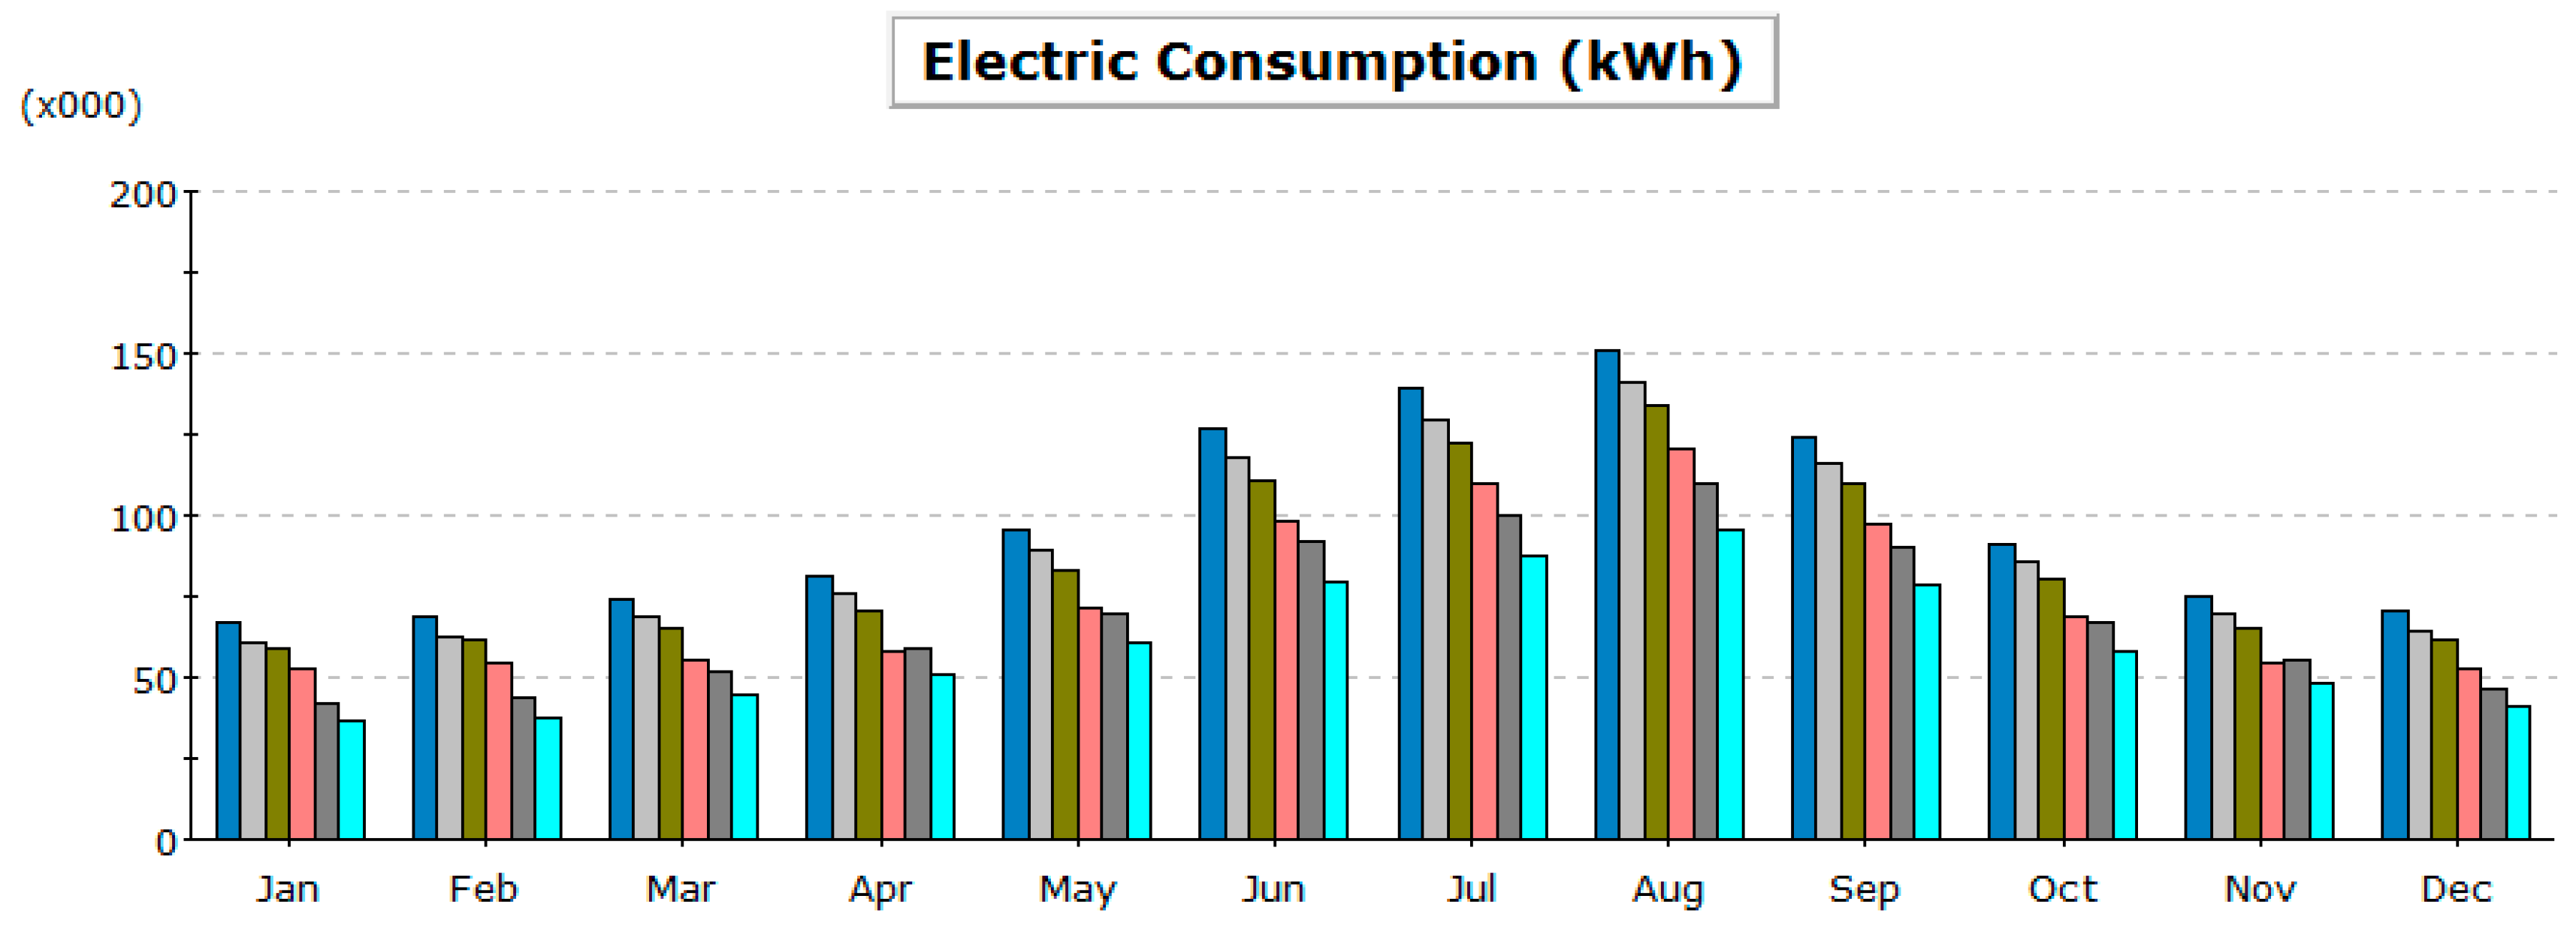
The electric consumption per month was found as follows, and as shown in
Figure 11:
High annual energy consumption (1160 MWh/year).
Energy consumed during the summer (July–September) is greater than the energy consumption during the winter (November–February).
Maximum energy consumption is about 140 MWh in August.
3.3. Optimization Results and Discussions
After addressing the problems that affect the building energy performance, and based on the passive design optimization in the literature, an interview was organized with three architects working in the Faculty of Architecture as academic staff and specialists in the fields of building energy efficiency, green buildings, and renewable energy technologies. The interview was conducted to explore the energy saving potential and suitable passive design strategies that can be optimized to ease achievement of net-zero energy goals. The main recommendations for optimization can be summarized as follows:
In order to reduce building energy demanded for cooling/heating, maximizing the embodied energy preservation by integrating additional insulation materials to the walls, roof, and floor slabs is needed. Since phase change materials (PCM) have shown high thermal storage [
35], it is a recommended solution to be integrated into the building envelope.
Provide high openings at the skylight in the building atrium to activate stack effect ventilation in order to decrease overheating in the building and reduce the cooling demand during the summer.
Use automated exterior shading devices to avoid overheating and glare in the interior spaces and save lighting energy.
Use light sensors to reduce unnecessary lighting consumption during unoccupied times.
Increase the U-value of the windows by replacing them with double or triple low-E glass.
With taking into consideration the interview recommendations, alternative energy simulations were conducted in software (eQuest) in order to acquire a comparison analysis of energy reduction. Throughout the energy optimization process, air conditioning system (HVAC) operating timetables were taken into consideration. The interior lighting demand and lighting power density (LPD) have been optimized according to the daylight measurements and building operating schedules, and all possible passive design optimization strategies have been applied to the building, such as adding high thermal insulation material for walls, as well as increasing the window insulation by using triple low-E coating glazing with argon fill as supernumerary glazing for windows, see supporting drawings in
supplementary 1. By conducting a comparison between the baseline run (existing energy consumption) and alternative runs after optimizations the results show significant savings in energy consumption after each optimization item, as shown in
Figure 12, with a 29% reduction in total annual energy consumption from 1160 MWh/year to just 825.4 MWh/year as shown in run 5 in
Table 6, due to the implementation of all optimizations together. This optimization causes a significant decrease in cooling/heating loads with a 38% reduction in total annual consumption and reaching 719.5 MWh/year, as shown as run 6 in
Table 6. The optimization can be summarized as follows:
Run 2: Window optimization by using triple low-E coating glazing, with argon fill as supernumerary glazing, and timber frames (U-value 1.0 W/m2K).
Run 3: Use of 0.60 m vertical and horizontal fixed exterior shading devices which are 1 m apart from each other.
Run 4: LPD being optimized according to
Figure 7, daylight analysis for different spaces, in addition to the building operating schedules.
Run 5: adding an insulation material to the exterior walls (the existing U-value = 2.62 W/m2K; after insulation = 0.24 W/m2K).
Run 6: Heat sensor added to the existing HVAC system to operate according to the indoor temperature after the above optimization runs (2–5). The temperature is set for 23 °C (winter) and 18 °C (summer).
By comparing between the different runs, it is evident that an improvement in building energy performance could be achieved after optimizing the passive design of the building.
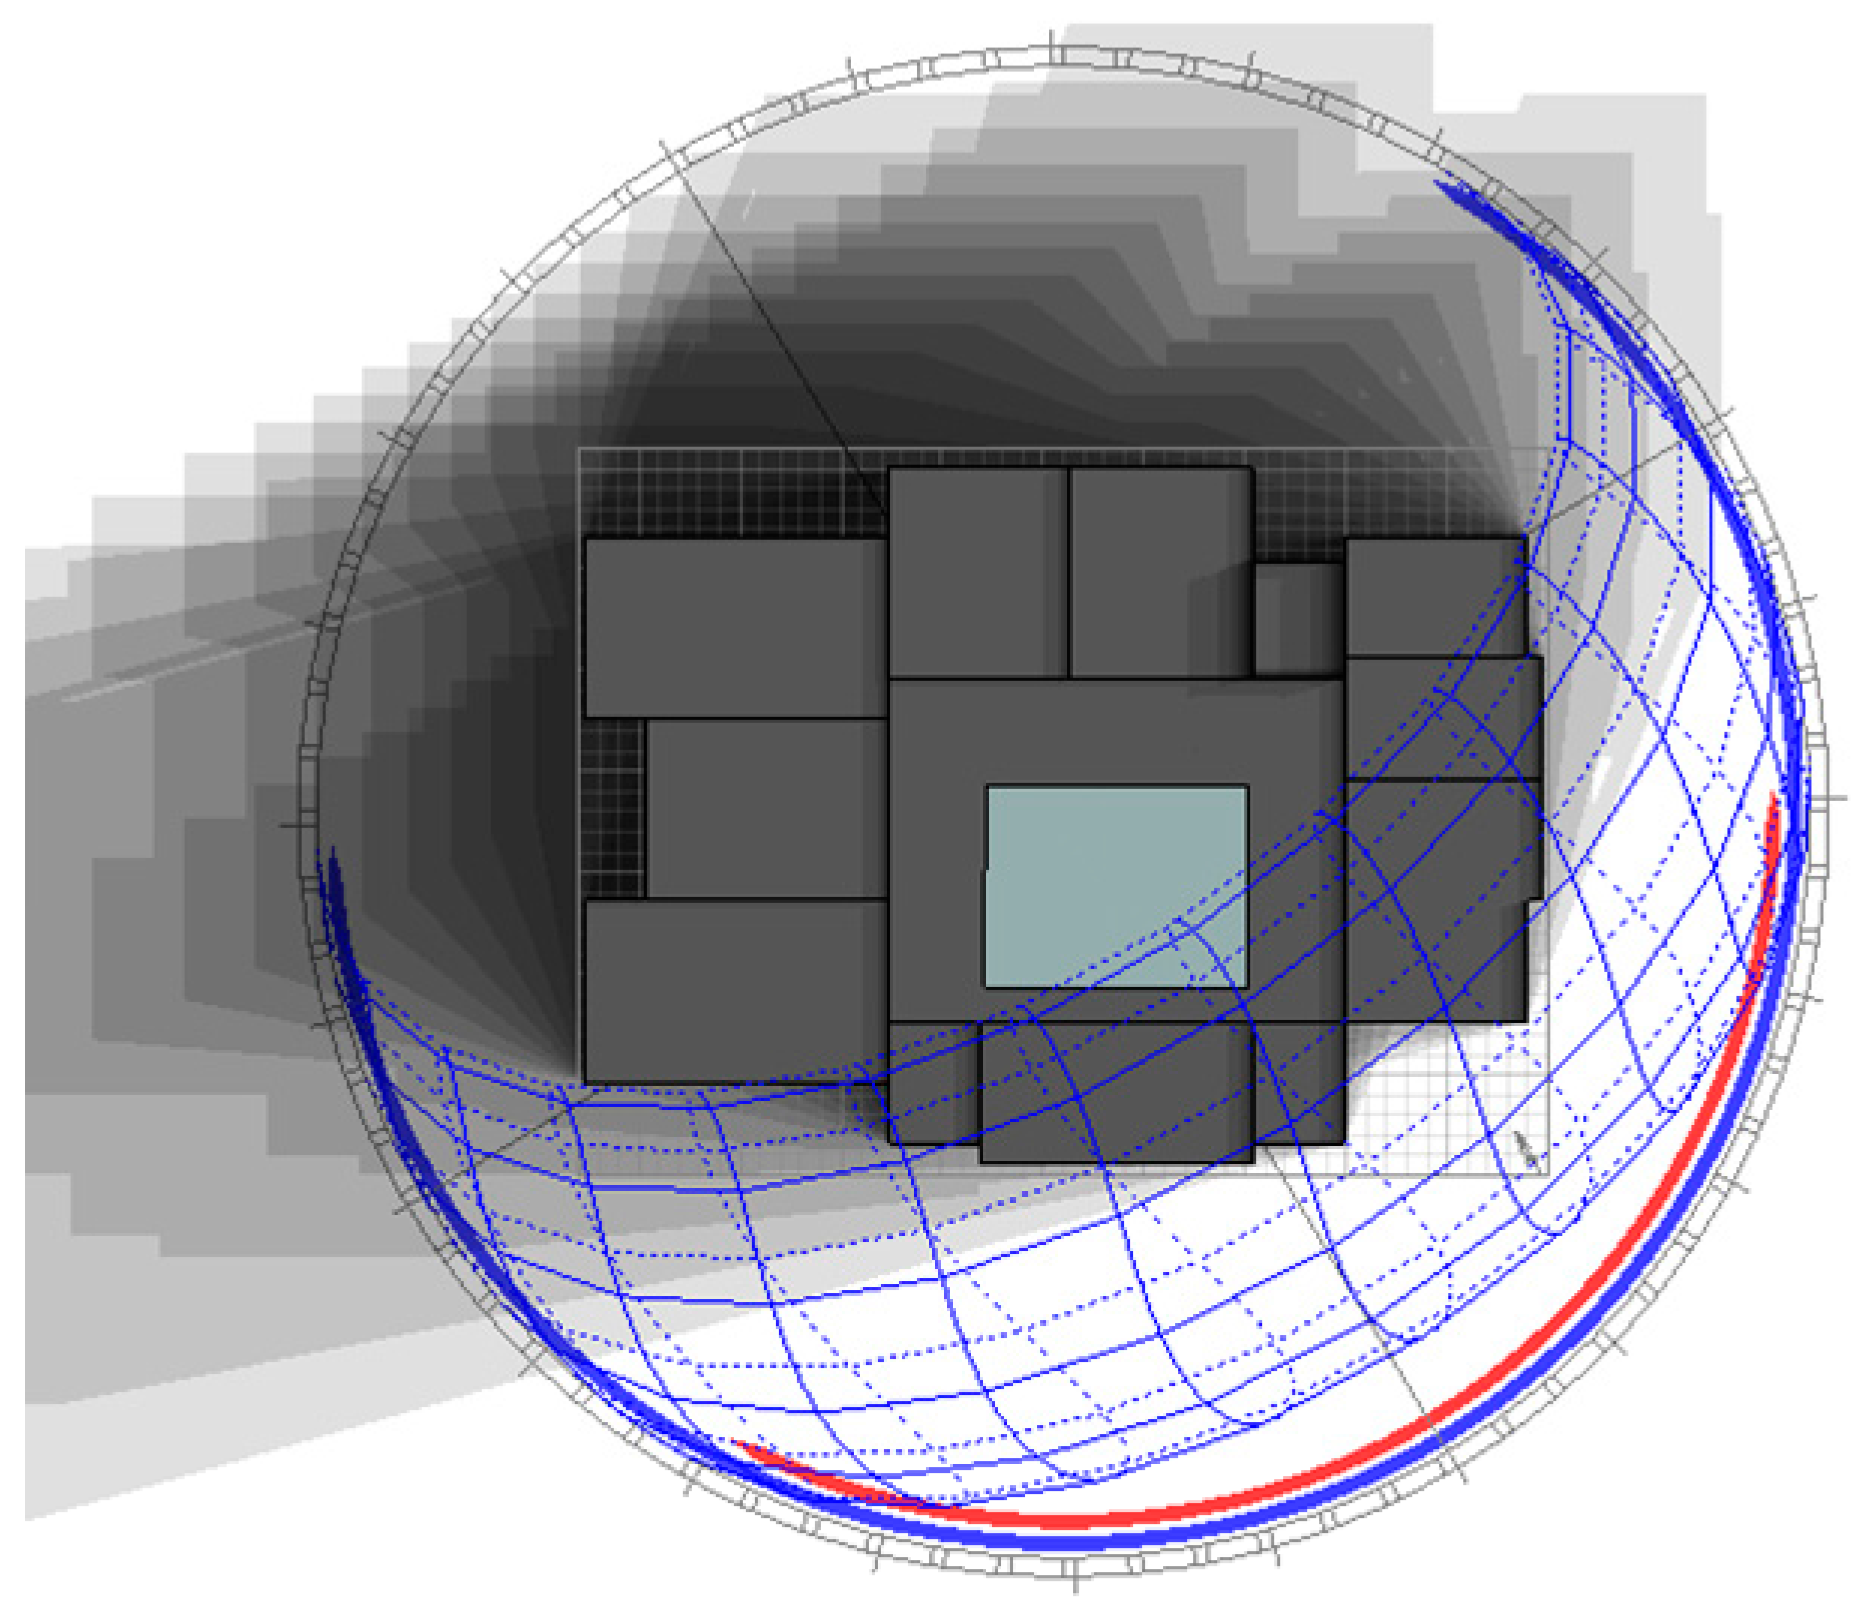
No renewable energy systems are integrated in the building envelope, which play a key role in achieving net-zero energy after optimizing the energy efficiency of the building. According to the annual sun path simulation, as shown in
Figure 13, the best location to integrate renewable energy is the roof, and the southwest and southeast facades.
In terms of generated energy, the statistical analysis based on the insolation energy and the nominal efficiency of the devices, the results show that 170 photo-voltaic panels covering 340 m
2 are needed to provide for the building’s annual energy demands (719.5 MWh), according the previous results (
Table 6) (1500 m
2 is available on the rooftop of the building). This type of renewable energy technology was chosen according to its cost feasibility and accessibility in Cyprus [
1,
16].
4. Conclusions
This research investigated how to achieve net-zero energy in existing buildings. And the objective was how public buildings in North Cyprus can reach net-zero energy goals and play a role in achieving EPBD stated goals for 2020, by taking a public three-story building as a research target, the results show an almost 30% reduction in annual energy consumption after considering passive design strategies to reduce the annual consumption and increase the building energy performance. Most of the energy savings were obtained just through optimizing the existing situation, without replacing or increasing efficiencies. Approximately 11% in energy saving was just from optimizing the existing lighting, and 9% just from optimizing the HVAC system. Furthermore, the objective was to develop a strategy to achieve net-zero energy in the building.
After multiple energy modeling simulations for energy saving options, the annual demanded energy after reduction can be balanced by integrating photovoltaics panels on just 23% of the roof of the building, and the rest available area can be used for generating extra energy to be sell to the national grid. These results demonstrate that this building, like many similar public buildings in North Cyprus, has a high potential for achieving net-zero energy or even producing energy to the national grid. Furthermore, the following recommendations should be studied for more energy saving potential:
Integration of automated shading devices to building windows;
Daylight sensors must be integrated to the lighting system for sufficient energy usage;
Upgrading the existing lighting and HVAC system in terms of energy efficiency for more annual energy savings;
The feasibility of integrating renewable energy sources to the building envelope as additional insulation materials, in terms of technical and aesthetics perspectives;
The economic feasibility and life cycle cost analysis of optimizing the existing building towards a net-zero energy concept; and
Integrate photovoltaics to the building envelope as an additional insulation material, and as exterior shading devices for windows, which can reduce the cost of insulation and shading and provide energy to the building.
Cyprus, as one of the largest islands in the Mediterranean Sea, has a large sector of existing building consuming a great portion of electricity, and has to invest in renovating buildings toward energy efficiency due to the lack of fossil fuel reserves and the high price of imported energy, in addition to take the advantages of energy modeling and simulations softwires which can save time and money in retrofitting buildings towards net zero energy concept.


