Article

Analysis of Potential Rockfalls on a Highway at High Slopes in Cold-Arid Areas (Northwest Xinjiang, China)

1
Key Laboratory of Shale Gas and Geoengineering, Institute of Geology and Geophysics, Chinese Academy of Sciences, Beijing 100029, China
2
University of Chinese Academy of Sciences, Beijing 100049, China
3
Xindikan Geotechnical Engineering Investigation and Design Co., Ltd., Urumqi 830000, China
*
Author to whom correspondence should be addressed.
Sustainability 2017, 9(3), 414; https://doi.org/10.3390/su9030414
Submission received: 12 January 2017 / Revised: 6 March 2017 / Accepted: 8 March 2017 / Published: 10 March 2017
(This article belongs to the Collection Risk Assessment and Management)

Abstract

:
In the steep mountainous areas in northwest Xinjiang, where rock mass is broken seriously due to intense freeze thaw weathering, rockfall is one of the most common geological hazards on highway high slopes. Engineering geological investigations on geological hazards along a segment of the G219 highway was conducted, indicating that rockfalls on the high slopes threaten the safety of vehicles on the highway seriously. In this study, a combination of field investigations, laboratory experiments and numerical simulation methods was performed to identify unstable high slopes, simulate the rockfall trajectories and assess the rockfall hazard in the study area. The results show that there are five high slopes (i.e., W01, W02, …, W05) where rockfall hazard is extremely serious. Considering both the total kinetic energy and the accumulation rate of blocks, rockfall influence area zonation was performed, leading to the conclusions that the sections of highway on W01 to W05 are located at the medium-intensity low-accumulation zone, high-intensity medium-accumulation zone, high-intensity low-accumulation zone, high-intensity low-accumulation zone and medium-intensity high-accumulation zone, respectively. Based on the analysis, a zonation map was accomplished, which could help engineers select effective mitigation measures against rockfalls to avoid casualty and property losses.

1. Introduction

With the promotion of the Western Development strategy, especially the proposal of the One Belt and One Road national strategy, a large number of high-level highways will be planned and constructed in mountainous areas of west China in the future, and rockfall, which is one of the most common geological hazards, is becoming a growing concern. The G219 line of Jimunai-Hebukesaier highway is located at the border of the Aletay region and Tacheng region, Xinjiang Uygur Autonomous Region, China (Figure 1), which is an integral part of the northern section of the Kanas port-Alashankou-Aksu-Yengisar high-level highway, and it has far-reaching significance to promote sound and fast development of the economic society in northwest Xinjiang. This highway is situated in the cold-arid areas in northwest China where the freeze thaw weathering is rather intense. Besides, field investigations show that the Wukeerchaolong gully-Songshu gully segment (the corresponding mileage is K42 + 900 m ~ K50 + 500 m) is located on high slopes where kinds of geological hazards including freezing-thawing, collapse, landslide, debris flow, rockfall and so on, are evolving continually. More remarkable, among them, rockfall is one of the most significant geological hazards in this segment and threatens the safety of people’s lives and the vehicular traffic travelling on the highway seriously.
Rockfall is a special type of landslides, where unstable rock blocks get detached from the slope surface for some reason, and downslope movement occurs rapidly in the modes of falling, sliding, rolling, bouncing or skipping under the action of gravity and stack in the vicinity of obstacles or relatively flat terrain, ultimately [1]. Mechanisms of the detachment include natural climate conditions, such as freezing-thawing [2], anthropogenic activities, such as blasting for slope excavation, seismic activities [3] and slow time-dependent deformation of the slope materials [4]. Not only does rockfall threaten the manmade environment, it also generates loss of human life and property within its influence area seriously because it behaves suddenly, frequently and randomly [5,6].
Compared to other types of landslides the proportion of the rockfall research is really small [7]. However, driven by the demand of city building in mountainous areas, research on rockfall attracts more and more attention of domestic and foreign scholars [8,9]. What is more, an increasing number of highway construction projects need the assessment of rockfall hazard to ensure people’s lives and property security [10,11,12,13,14]. Literature investigation shows that methods for rockfall analysis can be summarized into three main kinds. The first one is field investigation combining geotechnical and geophysical methods, along with the most recent and innovative survey approaches [15,16,17]; however, it is not easy to apply because it is often affected by complex topographic and geologic conditions, and it also requires plenty of human and material resources. The second one is the test method consisting of the laboratory test, in situ test and physical model test [18], but its applicability is subject to a complex model-making process, uncertain influence factors of rockfall, huge difference between test results and situations in the field, etc. The last one is simulation methods, including numerical simulation, analytical simulation and theoretical simulation [19]. With the continuous advances in computer technology, numerical simulation achieves rapid development and improvement, and it has become the most commonly-used method in the study of rockfall [20,21].
In this study, the Wukeerchaolong gully-Songshu gully segment where the rockfall is the most serious was selected as the study area, and rockfall hazard around the study area was investigated and assessed. First of all, both field investigation and UDEC (Universal Distinct Element Code) simulation were applied to determine the location of the unstable rock blocks, as well as the initial position of rockfall. Next, the size range of unstable rock blocks was determined by counting the size of rock blocks that have stacked at the relatively flat terrain of the slopes. Moreover, Rocfall V.4.0 was used to simulate the rockfall trajectory of the unstable rock blocks, and the parameters including runout distance, bounce height, total kinetic energy and translational velocity of the rockfall along the two-dimensional profile were obtained. Finally, based on the field investigation and numerical simulation results, considering both the total kinetic energy and the accumulation rate of the rockfall, the zonation of the areas suffering from the rockfall was performed.

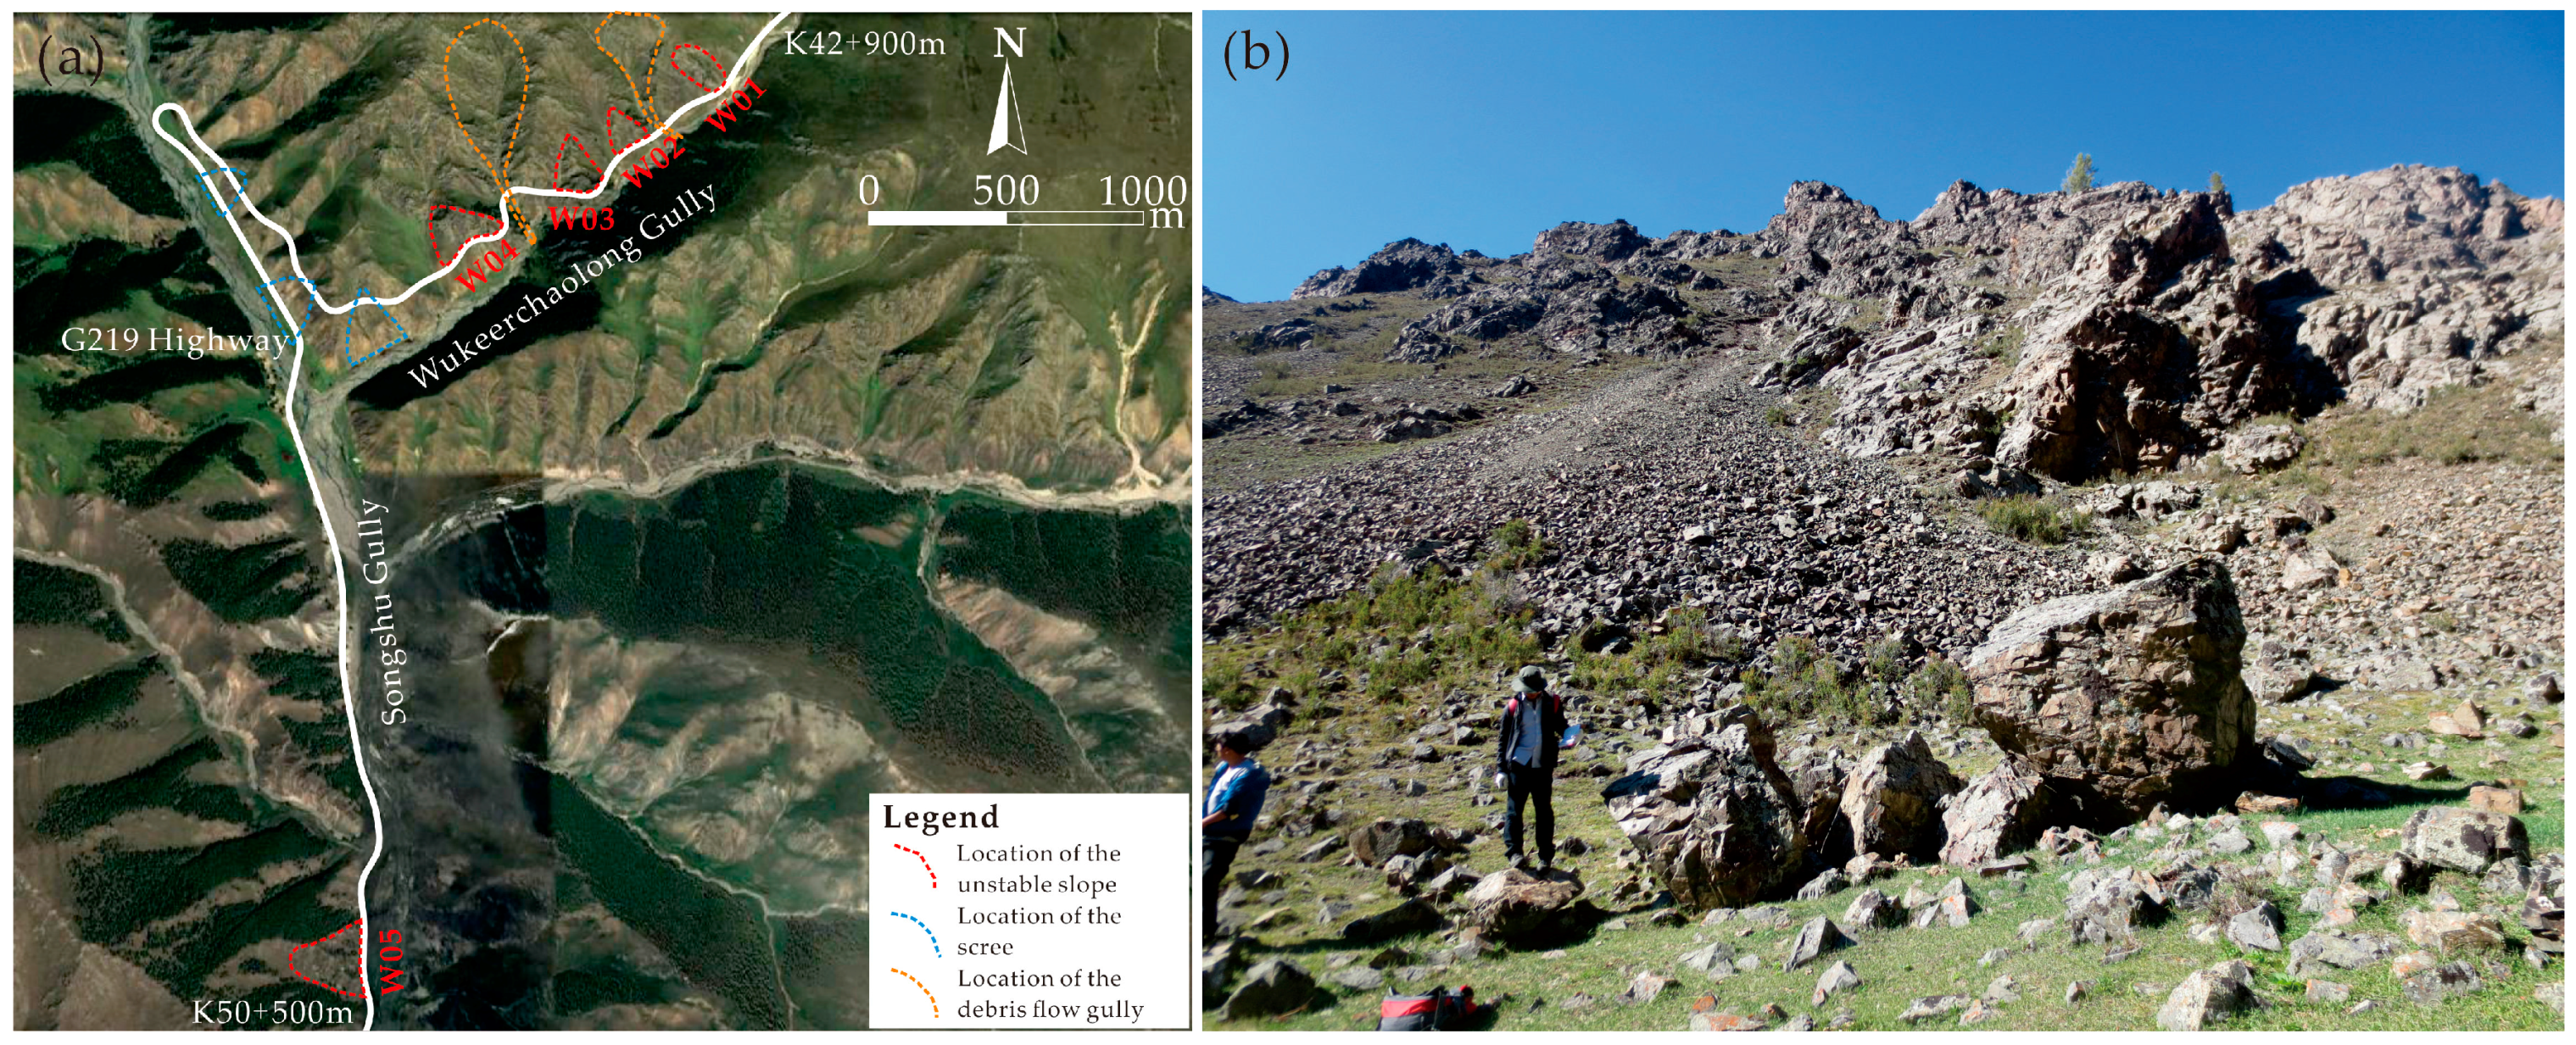
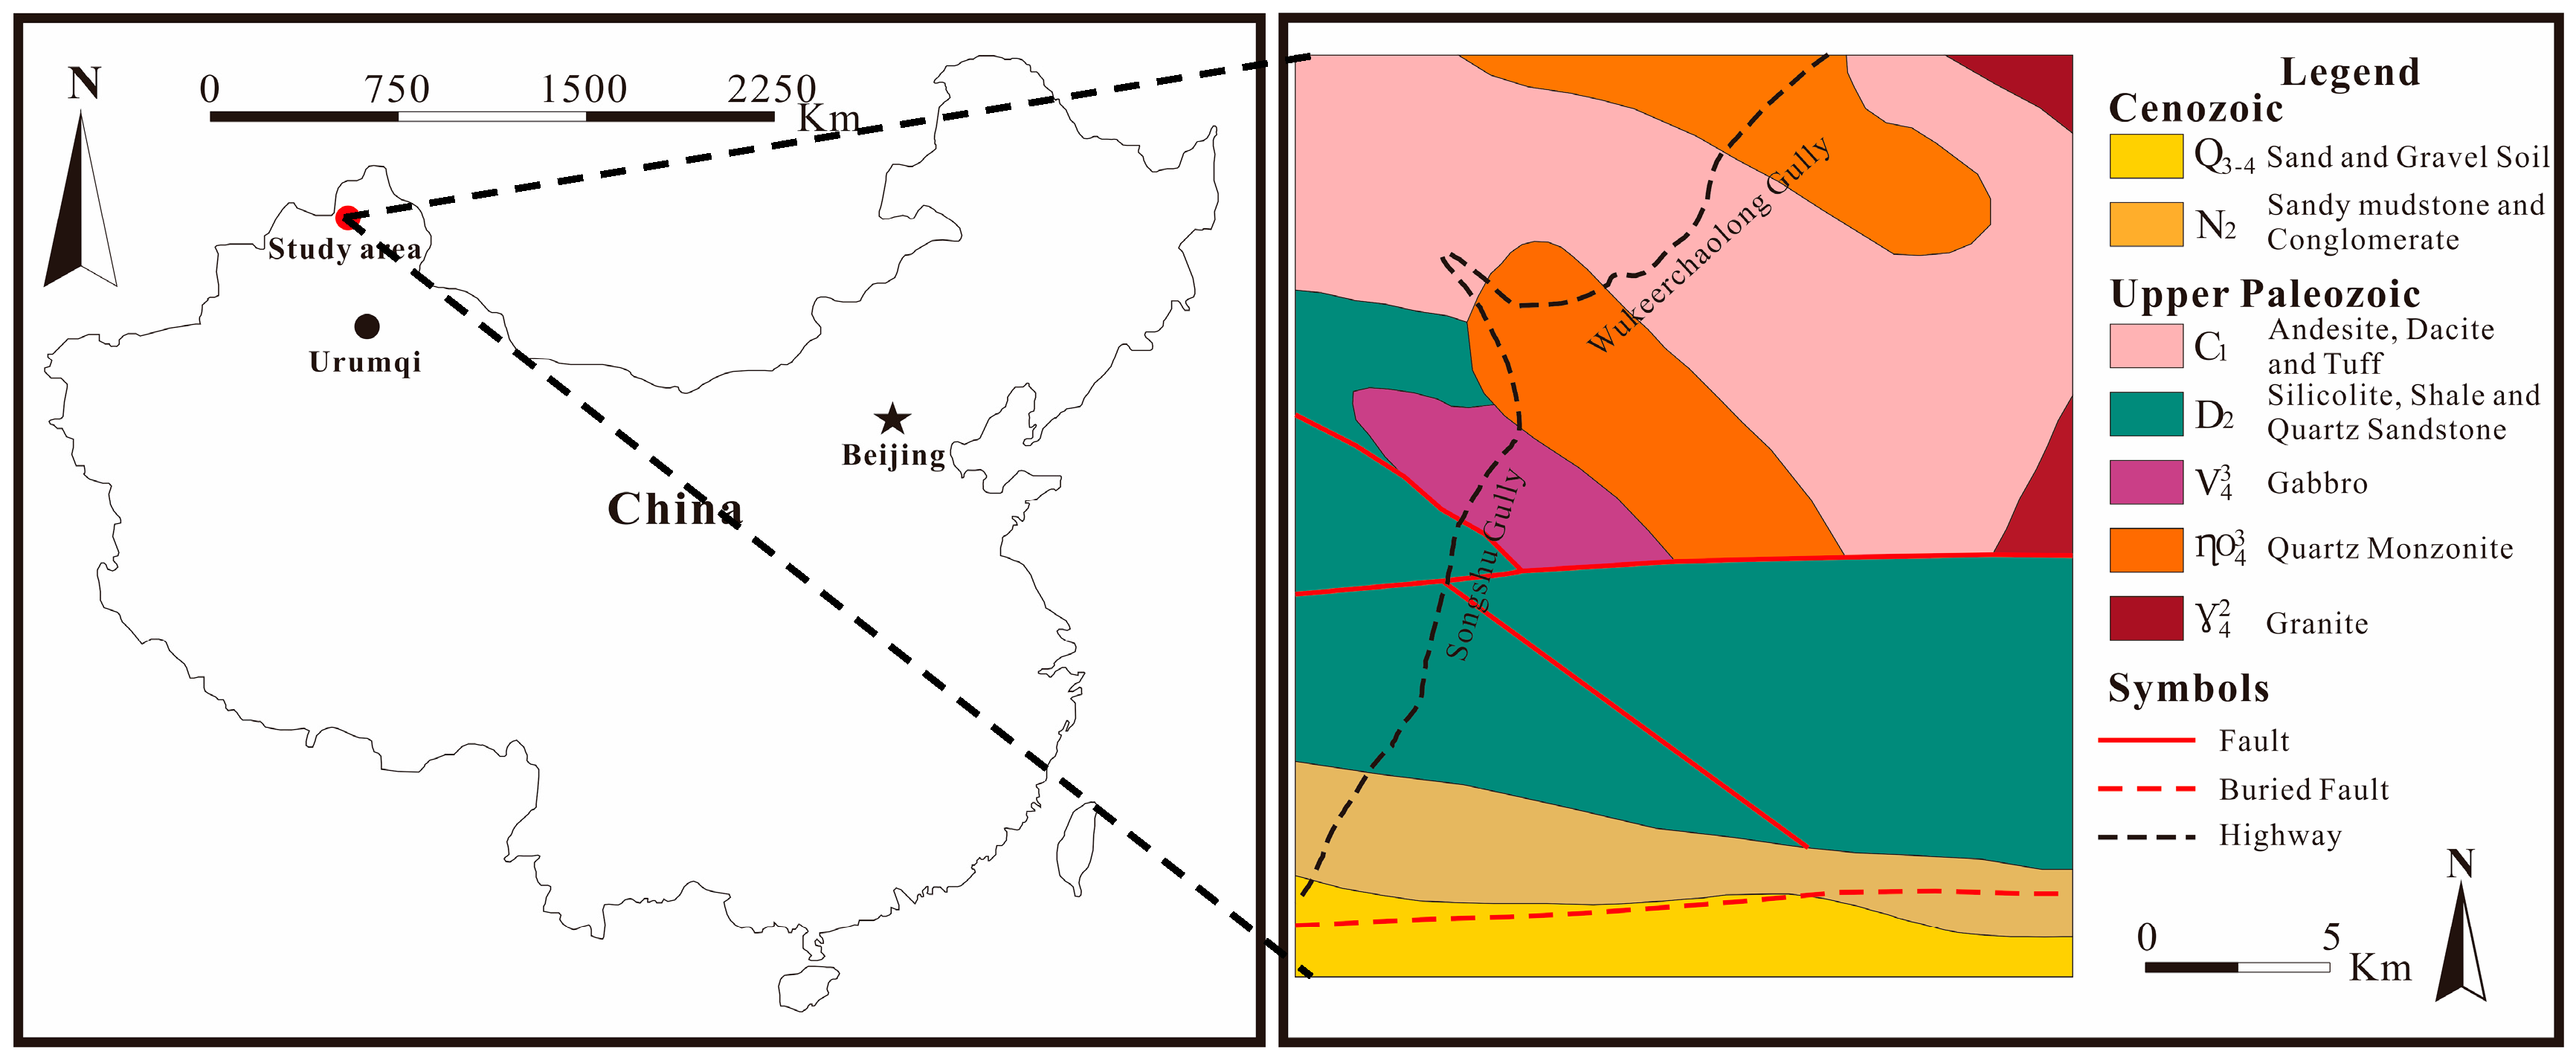
2. Geologic Setting of the Study Area

The study area is located at the southern slope of the Sawuer Mountains, with a maximum altitude of 2300 m, forming plenty of high rock slopes [22]. The average slope gradient value in the study area is about 36°; the gradient value of a few high and steep slopes can reach up to 80°. Mountain river can be seen in the valleys, which is the major source of the surface runoff on the piedmont plain at the southern foot of the Sawuer Mountains. Because of strong erosion, bedrock is exposed, forming the river valley landform with relative elevation up to 200 m. The width of the valley is between 20 and 100 m, and only a one-level river terrace can be seen in the valley, indicating that the valley is still in the development stage. Meteorological data shows the maximum temperature, minimum temperature and annual average temperature of the study area are of 37.2 °C, −23.0 °C and 4.9 °C, respectively, and the annual average rainfall and evaporation are 143.0 mm and 1842.2 mm, respectively, indicating that the study area belongs to a typical cold-arid area [23,24].
As shown in Figure 1, various geological units outcrop in the region, mainly including Upper Paleozoic Middle Devonian Sawuershan Formation (gray quartz sandstone, gray black silicolite and shale), Lower Carboniferous Saerbulake Formation (dark gray andesite, dacite and tuff), Cenozoic Neogene Pliocene (brown red sandy mudstone, conglomerate) and Quaternary Upper Pleistocene-Holocene (sand and gravel soils). In regional structure, the study area belongs to Junggar-Northern Tianshan fold system (I1), Junggar eugeosynclinal fold belt (II1) Sawuer synclinorium (II1-13), bordering Buerjin anticlinorium (II1-11) to the north and Fuhai mountain sag (II1-27) to the south. The axis of Sawuer synclinorium is located at the south of Jimunai. The strata at the axis belong to Early Permian rift sedimentary basin and the south limb composed by Devonian and Carboniferous, however, the later magnetic rock (mainly including quartz monzonite, gabbro and granite) intrusion in Middle Hercynian results in most strata of the north limb being lost. Surrounding the study area, two faults are developed, which are Sawuer fault and Sawuer buried fault, and both of them are nearly orthogonal to the strike of the highway to build. The Sawuer fault is a compression and scissor fault with an approximately E-W trend, and the extension length is about 67 km, but the north limb of the fold fault dips to the north with the western end to the south, and the dip ranges from 70° to 80°. Sawuer buried fault almost runs through the Sawuer piedmont with the eastern section of discontinuous distribution. Additionally, it is about 1 km away from the piedmont with a generally E-W trend. The two faults are both Paleozoic faults, and there is no Cenozoic active fault. Since the Pliocene, neotectonic movement makes the mountain area further expand and uplift, increasing topographic relief, and the Cenozoic rise to a higher position and develop folds and faults, resulting in the development of unexpected geological hazards, such as rockfall, collapse, landslide and debris flow.
The Seismic Ground Motion Parameter Zonation Map of China (GB18306-2001) indicates that the seismic peak acceleration of the study area is 0.05 g, and the site’s characteristic periods of seismic response spectra is 0.35 s, with basic earthquake intensity of VI degree. According to the existing earthquake records since 1977 AD, about 10 events whose magnitudes were more than three affected the area, with the maximum magnitude 5.6.

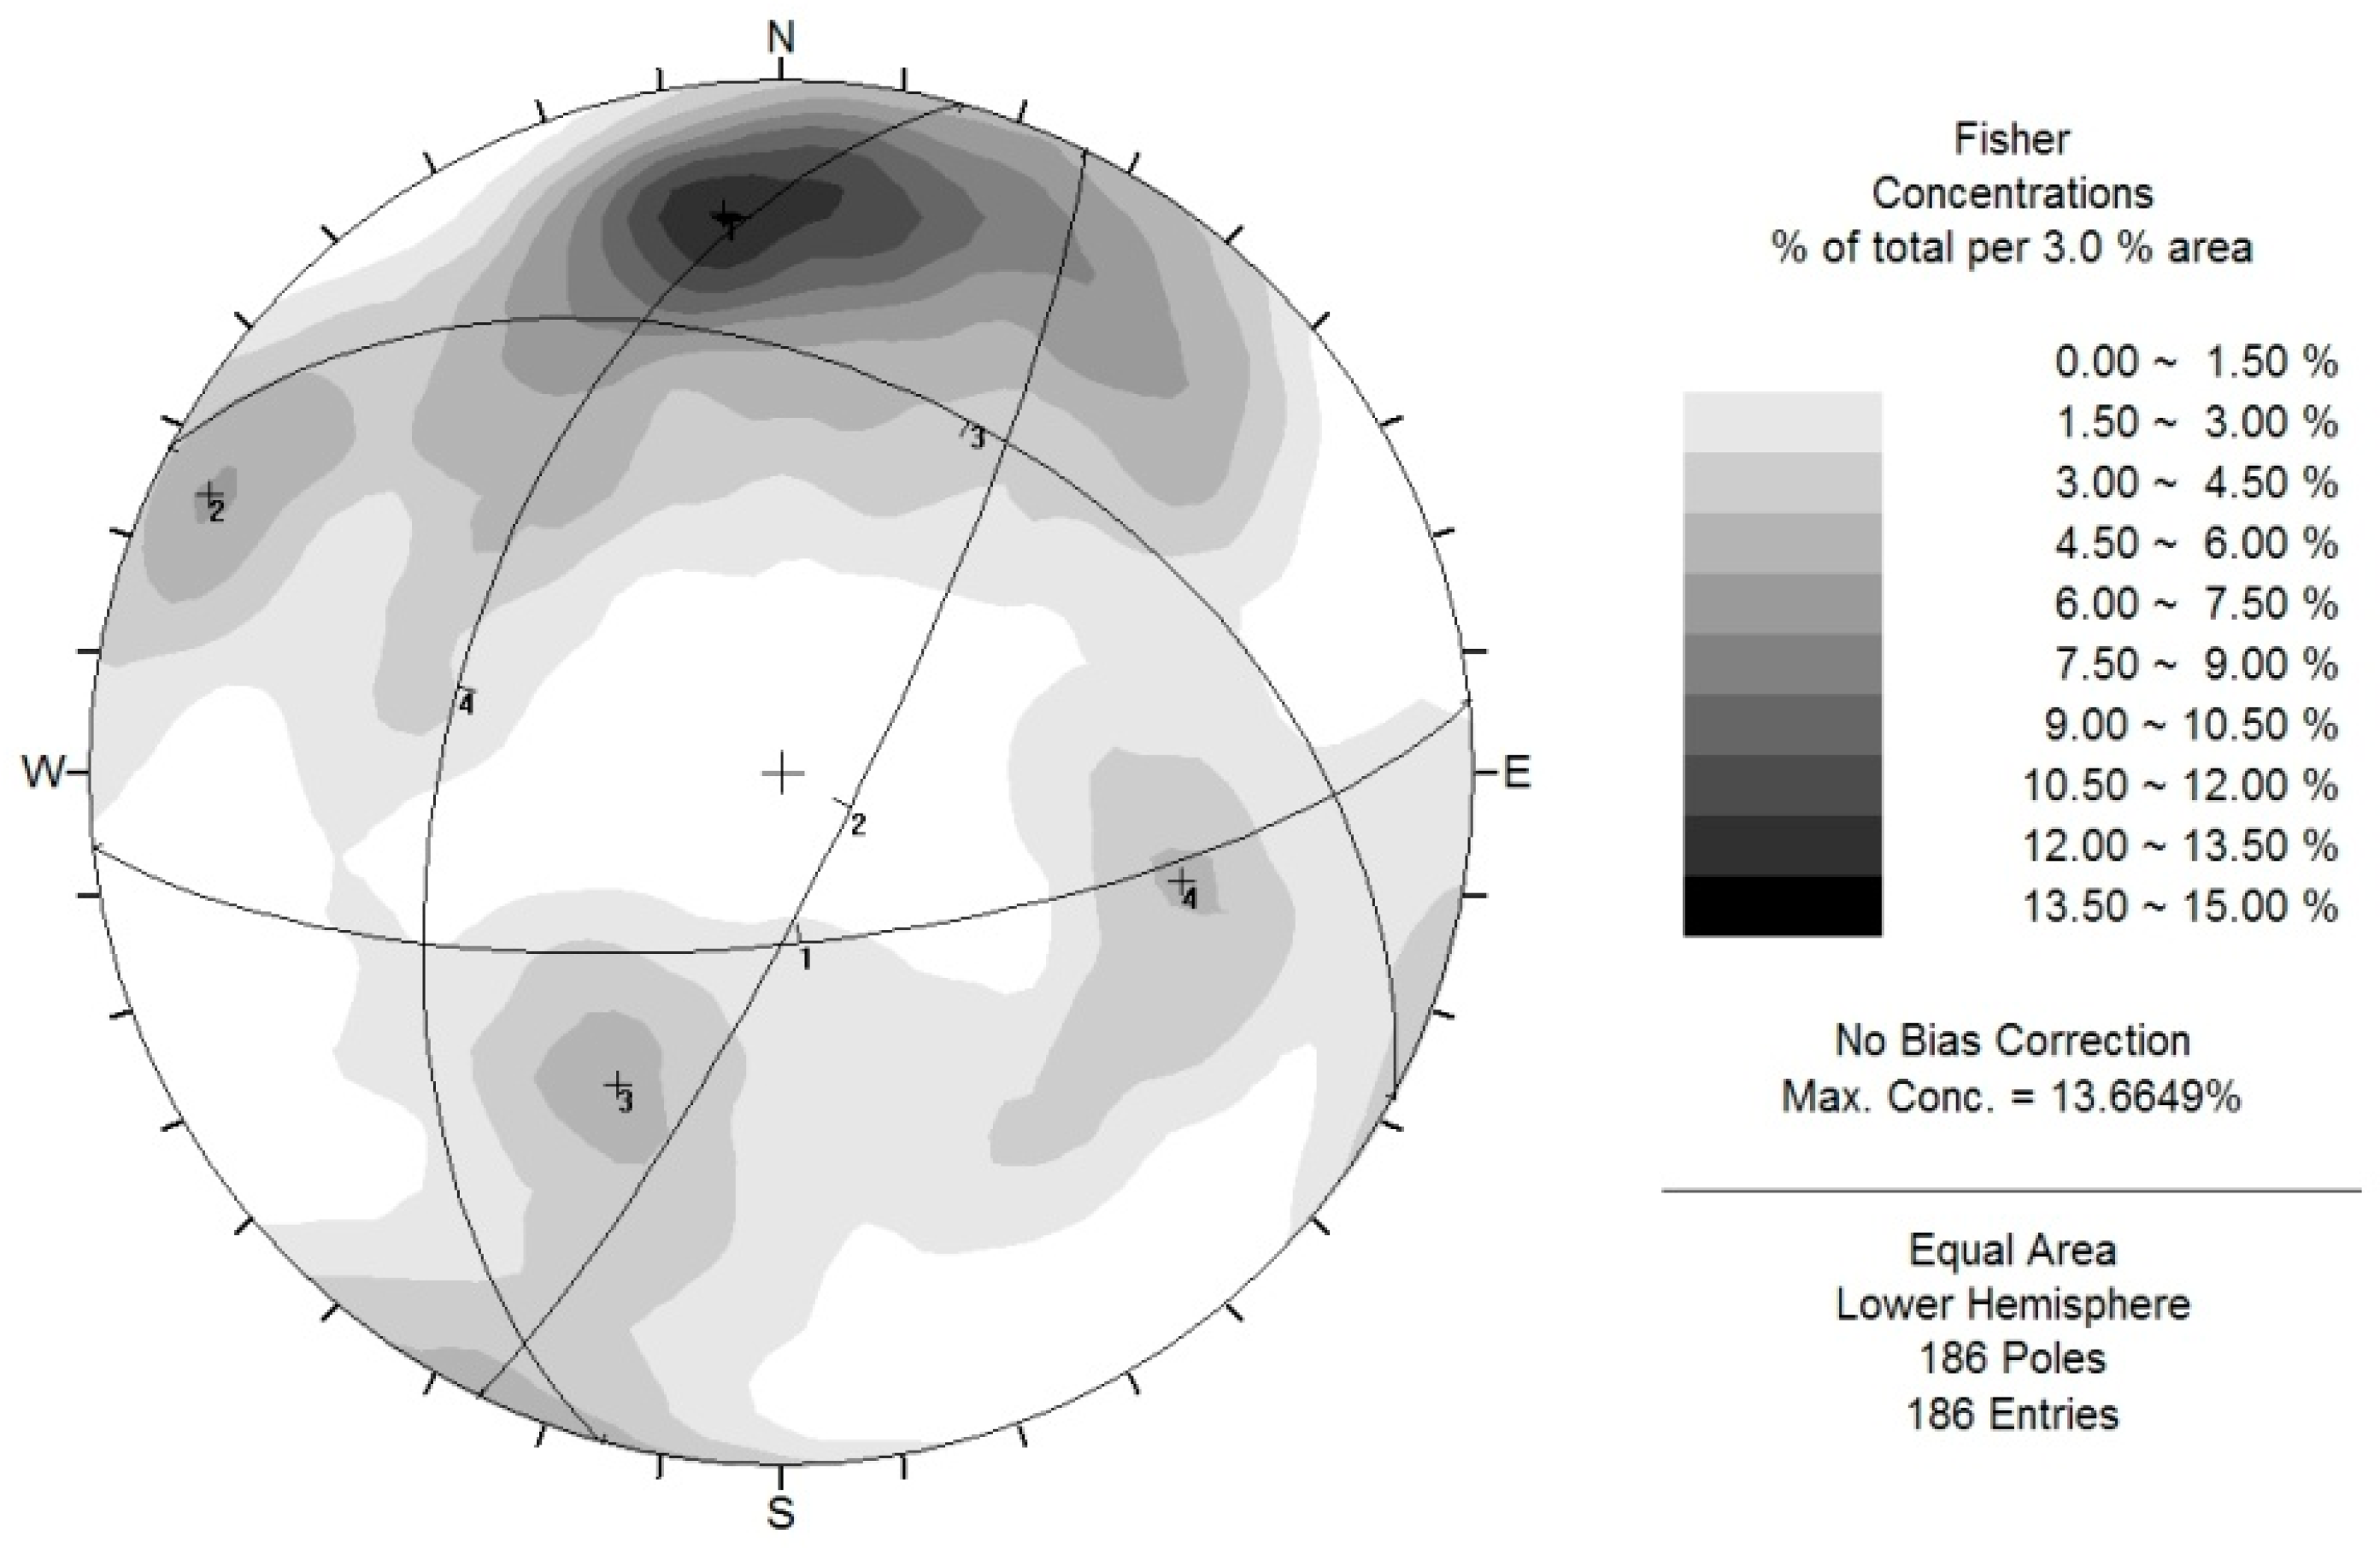
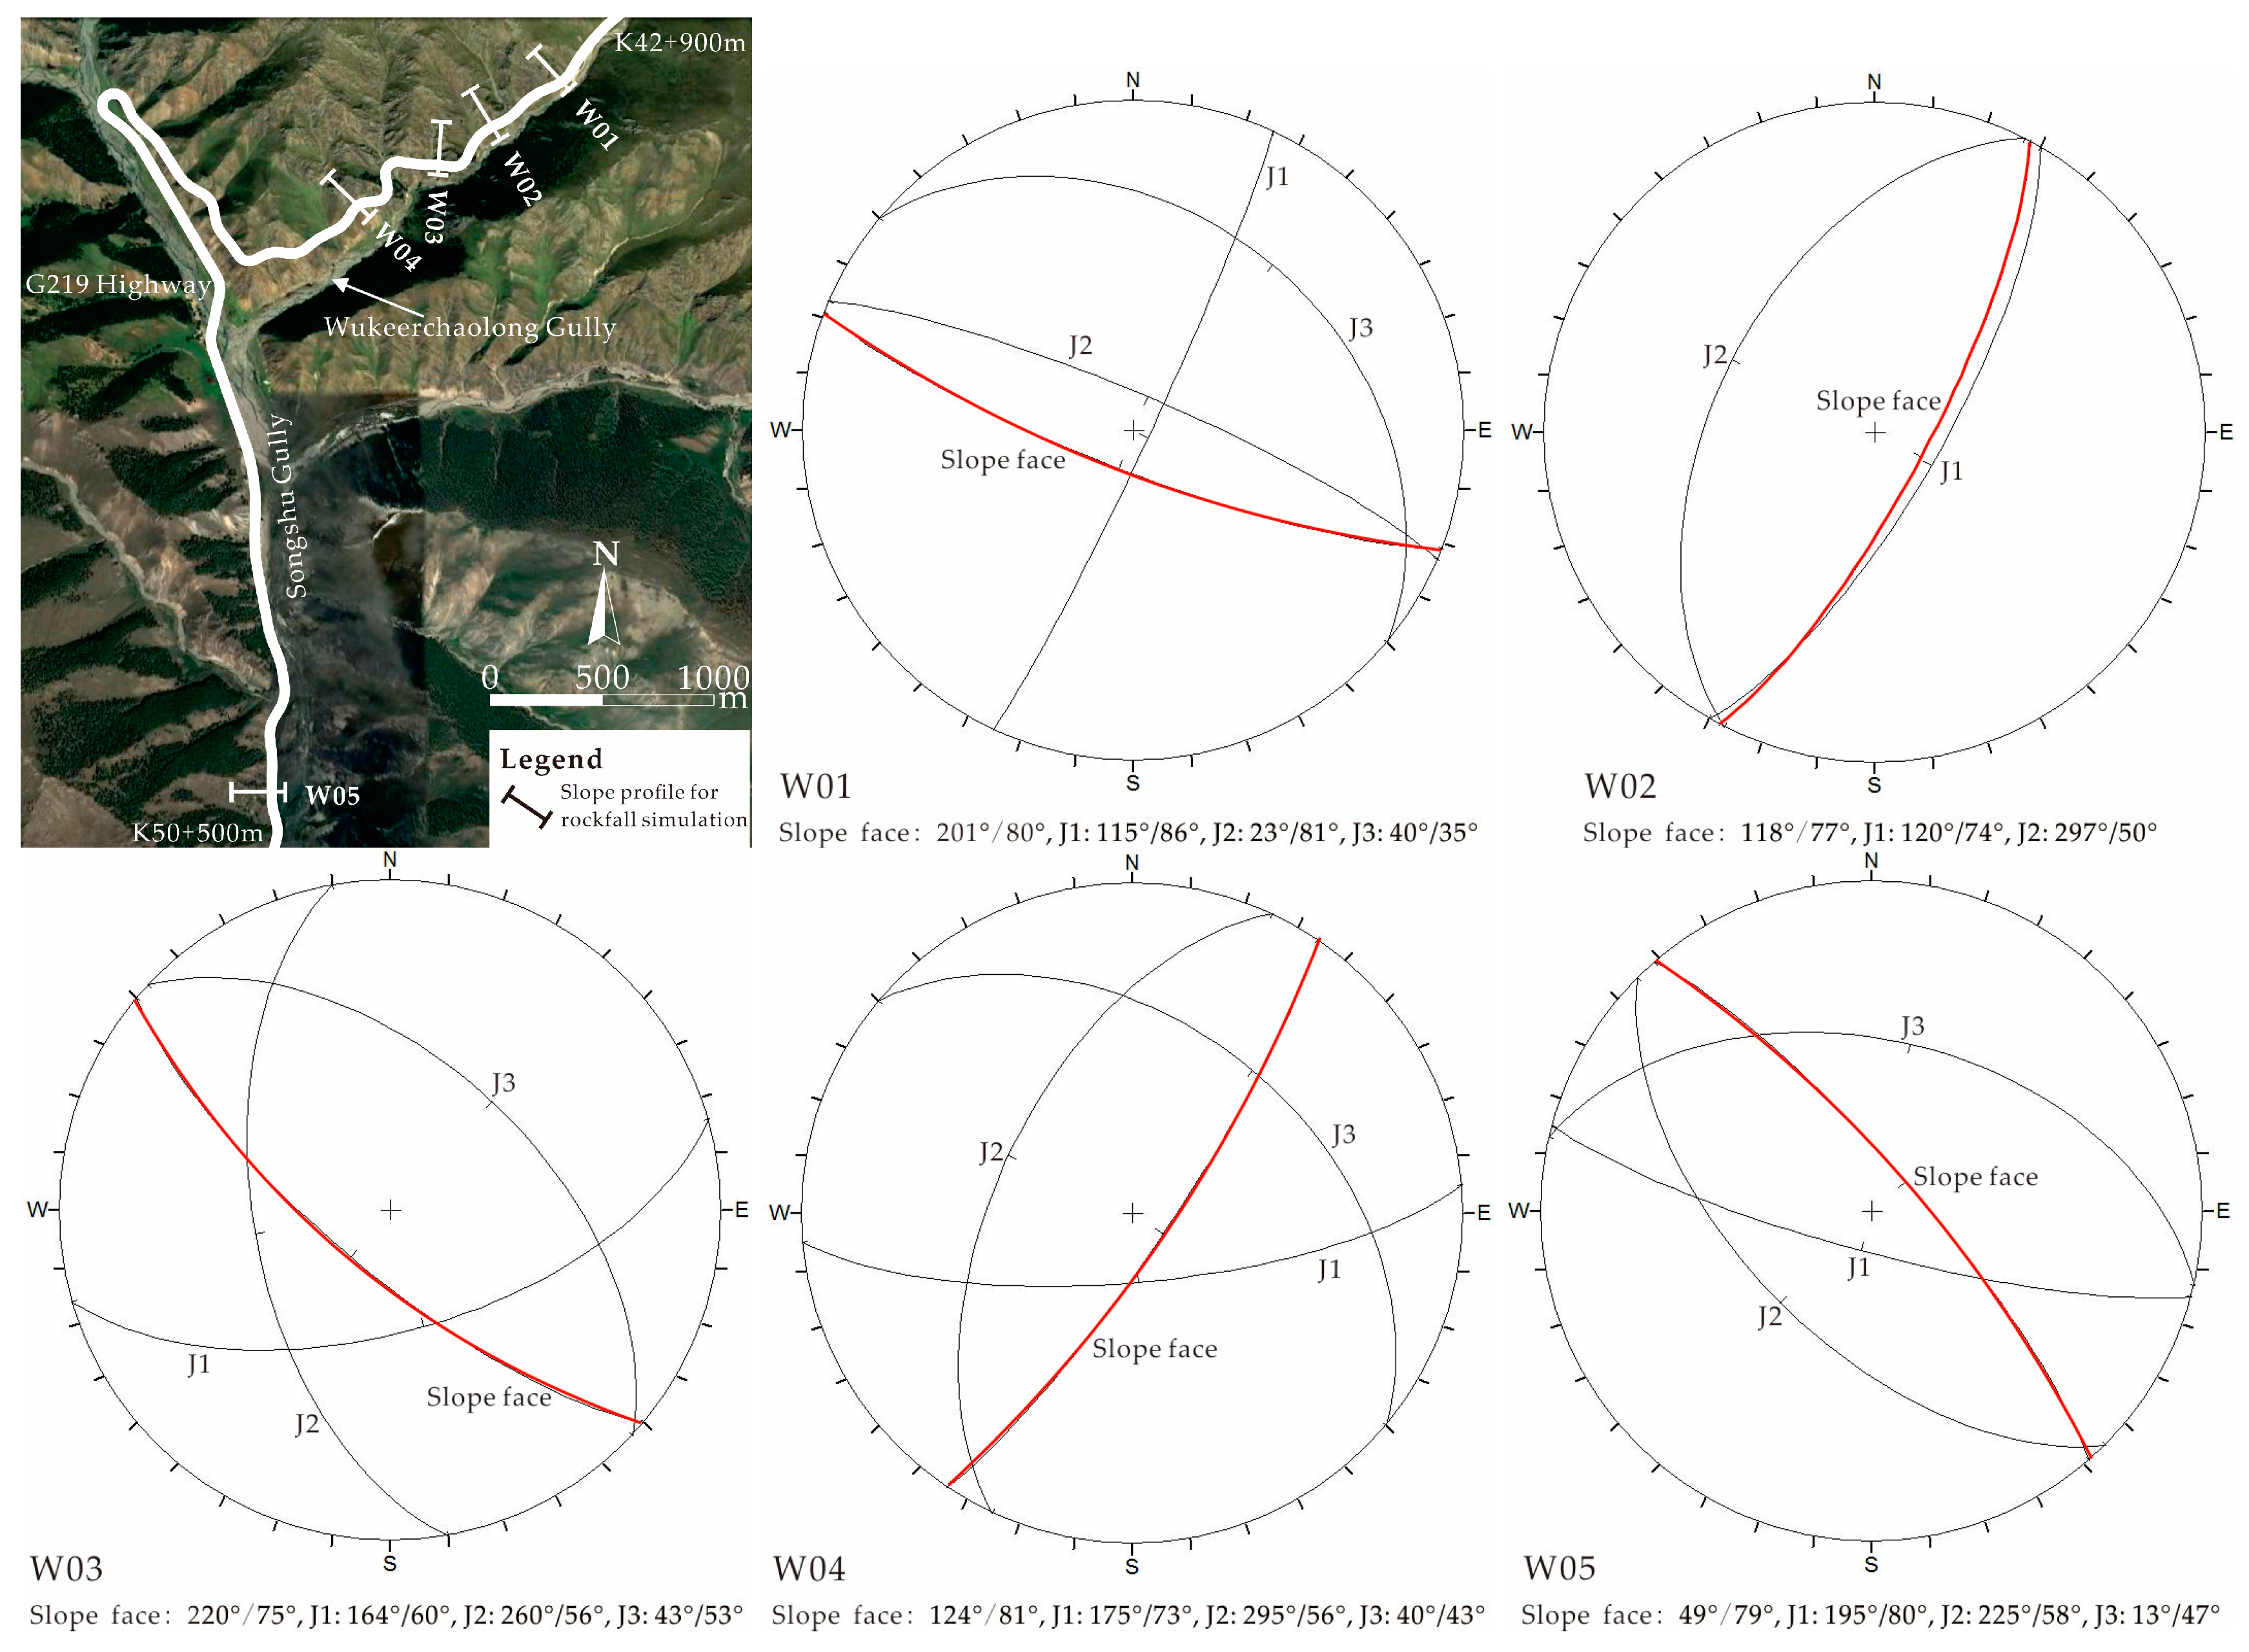
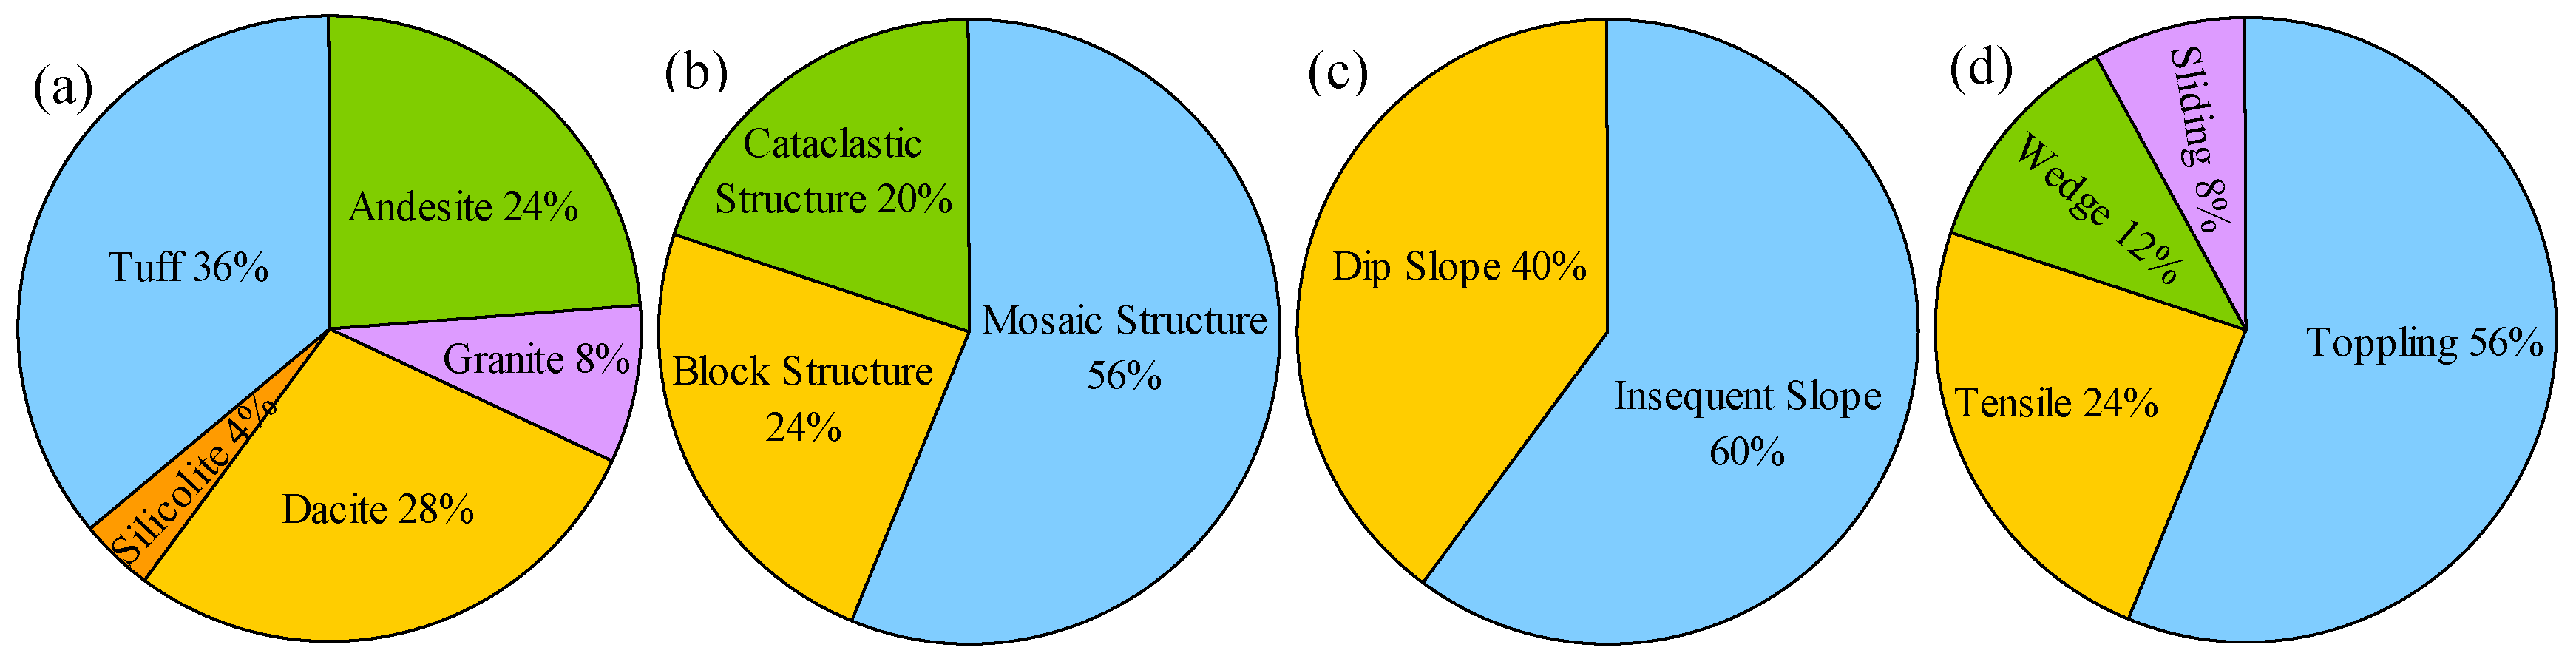
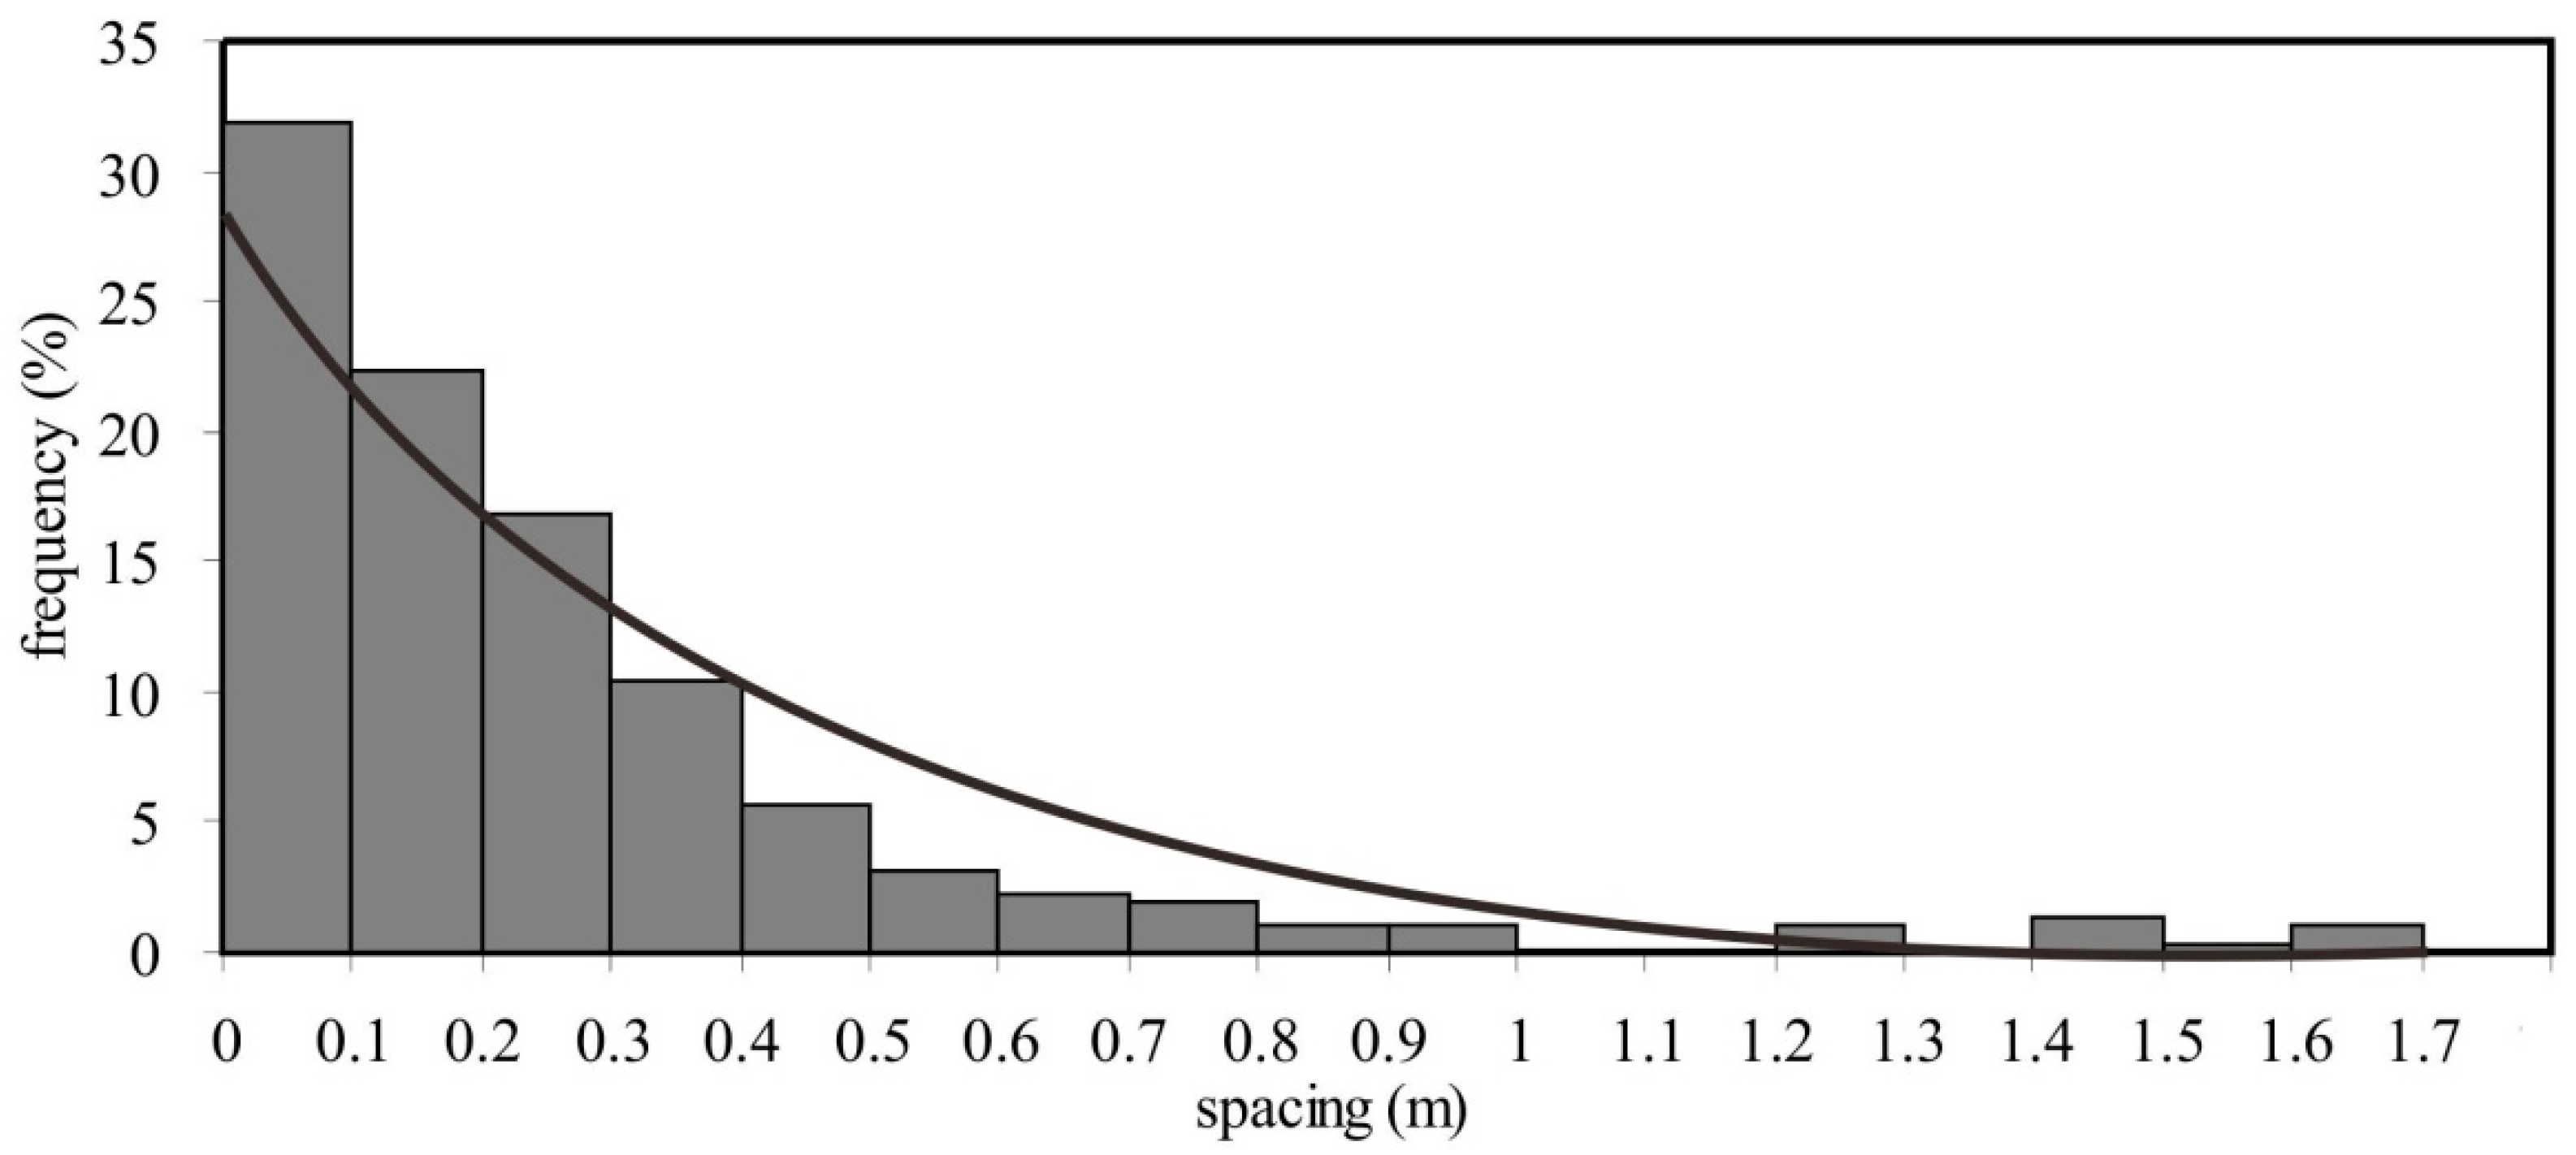
3. Engineering Geology of the Study Area

Through field investigation, a total of 54 unstable slopes, 17 scree and 2 debris flow gullies were found (Figure 2). In terms of lithology, rock structure, slope structure and failure mode, statistical analysis of 54 unstable rock slopes was conducted (Figure 3). Statistical results show these slopes mainly developed in tuff, dacite and andesite, only a small part in granite and silicolite; due to strong tectonic movement, large amounts of discontinuities developed, and rock structures are mainly mosaic structure, followed by block structure and cataclastic structure; a majority of slope structures are insequent slopes and dip slopes; strong freeze thaw weathering makes the steep unloading discontinuities that developed under the action of gravity run through the rock mass, resulting in slope failures, so the potential failure modes are almost toppling and tensile, with a few of wedge and sliding.
In the study area, discontinuities are well developed, and there is no crushed zone. Persistence ranges from 20 cm–20 m, and the aperture is tight to open (less than 50 mm), without infilling. Based on persistence and width (less than centimeters), the class of the joints is between III and IV [25]. Discontinuity (except the bedding planes) spacing shows a good exponential distribution with an average of 0.32 m (Figure 4). The bedding planes are generally planar, while joint surfaces can be classified into three kinds, including planar-rough, undulated-slightly rough and undulated-rough, according to International Society for Rock Mechanics (ISRM) (2007) recommendations. The joint roughness coefficient (JRC) values [26] range between 6 and 8 (Class 4), 8 and 10 (Class 5) and 10 and 12 (Class 6). Discontinuity surfaces were dry, and groundwater seepage was not observed through the discontinuities. The discontinuities surveyed around the study area can be classified into four sets (Figure 5), with average attitude values of 174/70 (Set 1), 116/81 (Set 2), 28/42 (Set 3) and 285/50 (Set 4).
Field investigation and laboratory analysis proved that rockfall is extremely likely to occur on all of the 54 unstable slopes due to the existence of unstable rock blocks. However, for most slopes, the unstable rock blocks are located within the scope of construction and excavation or below the elevation of the highway foundation base, so the potential rockfall will not threaten the safety of people’s lives and the vehicular traffic travelling on the highway. However, on five unstable slopes (i.e., W01, W02, W03, W04 and W05 in Table 1), the unstable blocks are located above the highway under construction (Figure 2). Under the action of continuous rainfall, seismic activities and anthropogenic activities, such as blasting for slope excavation and vehicle vibration, the unstable blocks are likely to lose stability and form rockfalls, which will threaten the people’s lives and property security and affect the normal use of the highway seriously.

4. Results and Discussion

As mentioned above, unstable blocks on five unstable slopes are related to rockfalls in the study area. For that reason, a combination of field investigations, laboratory experiments and numerical simulation methods were performed to determine potential rockfall initial position (namely the location of unstable blocks), rockfall mass, runout distance, bounce height, total kinetic energy and translational velocity, laying the foundation for the next rockfall hazard assessment.

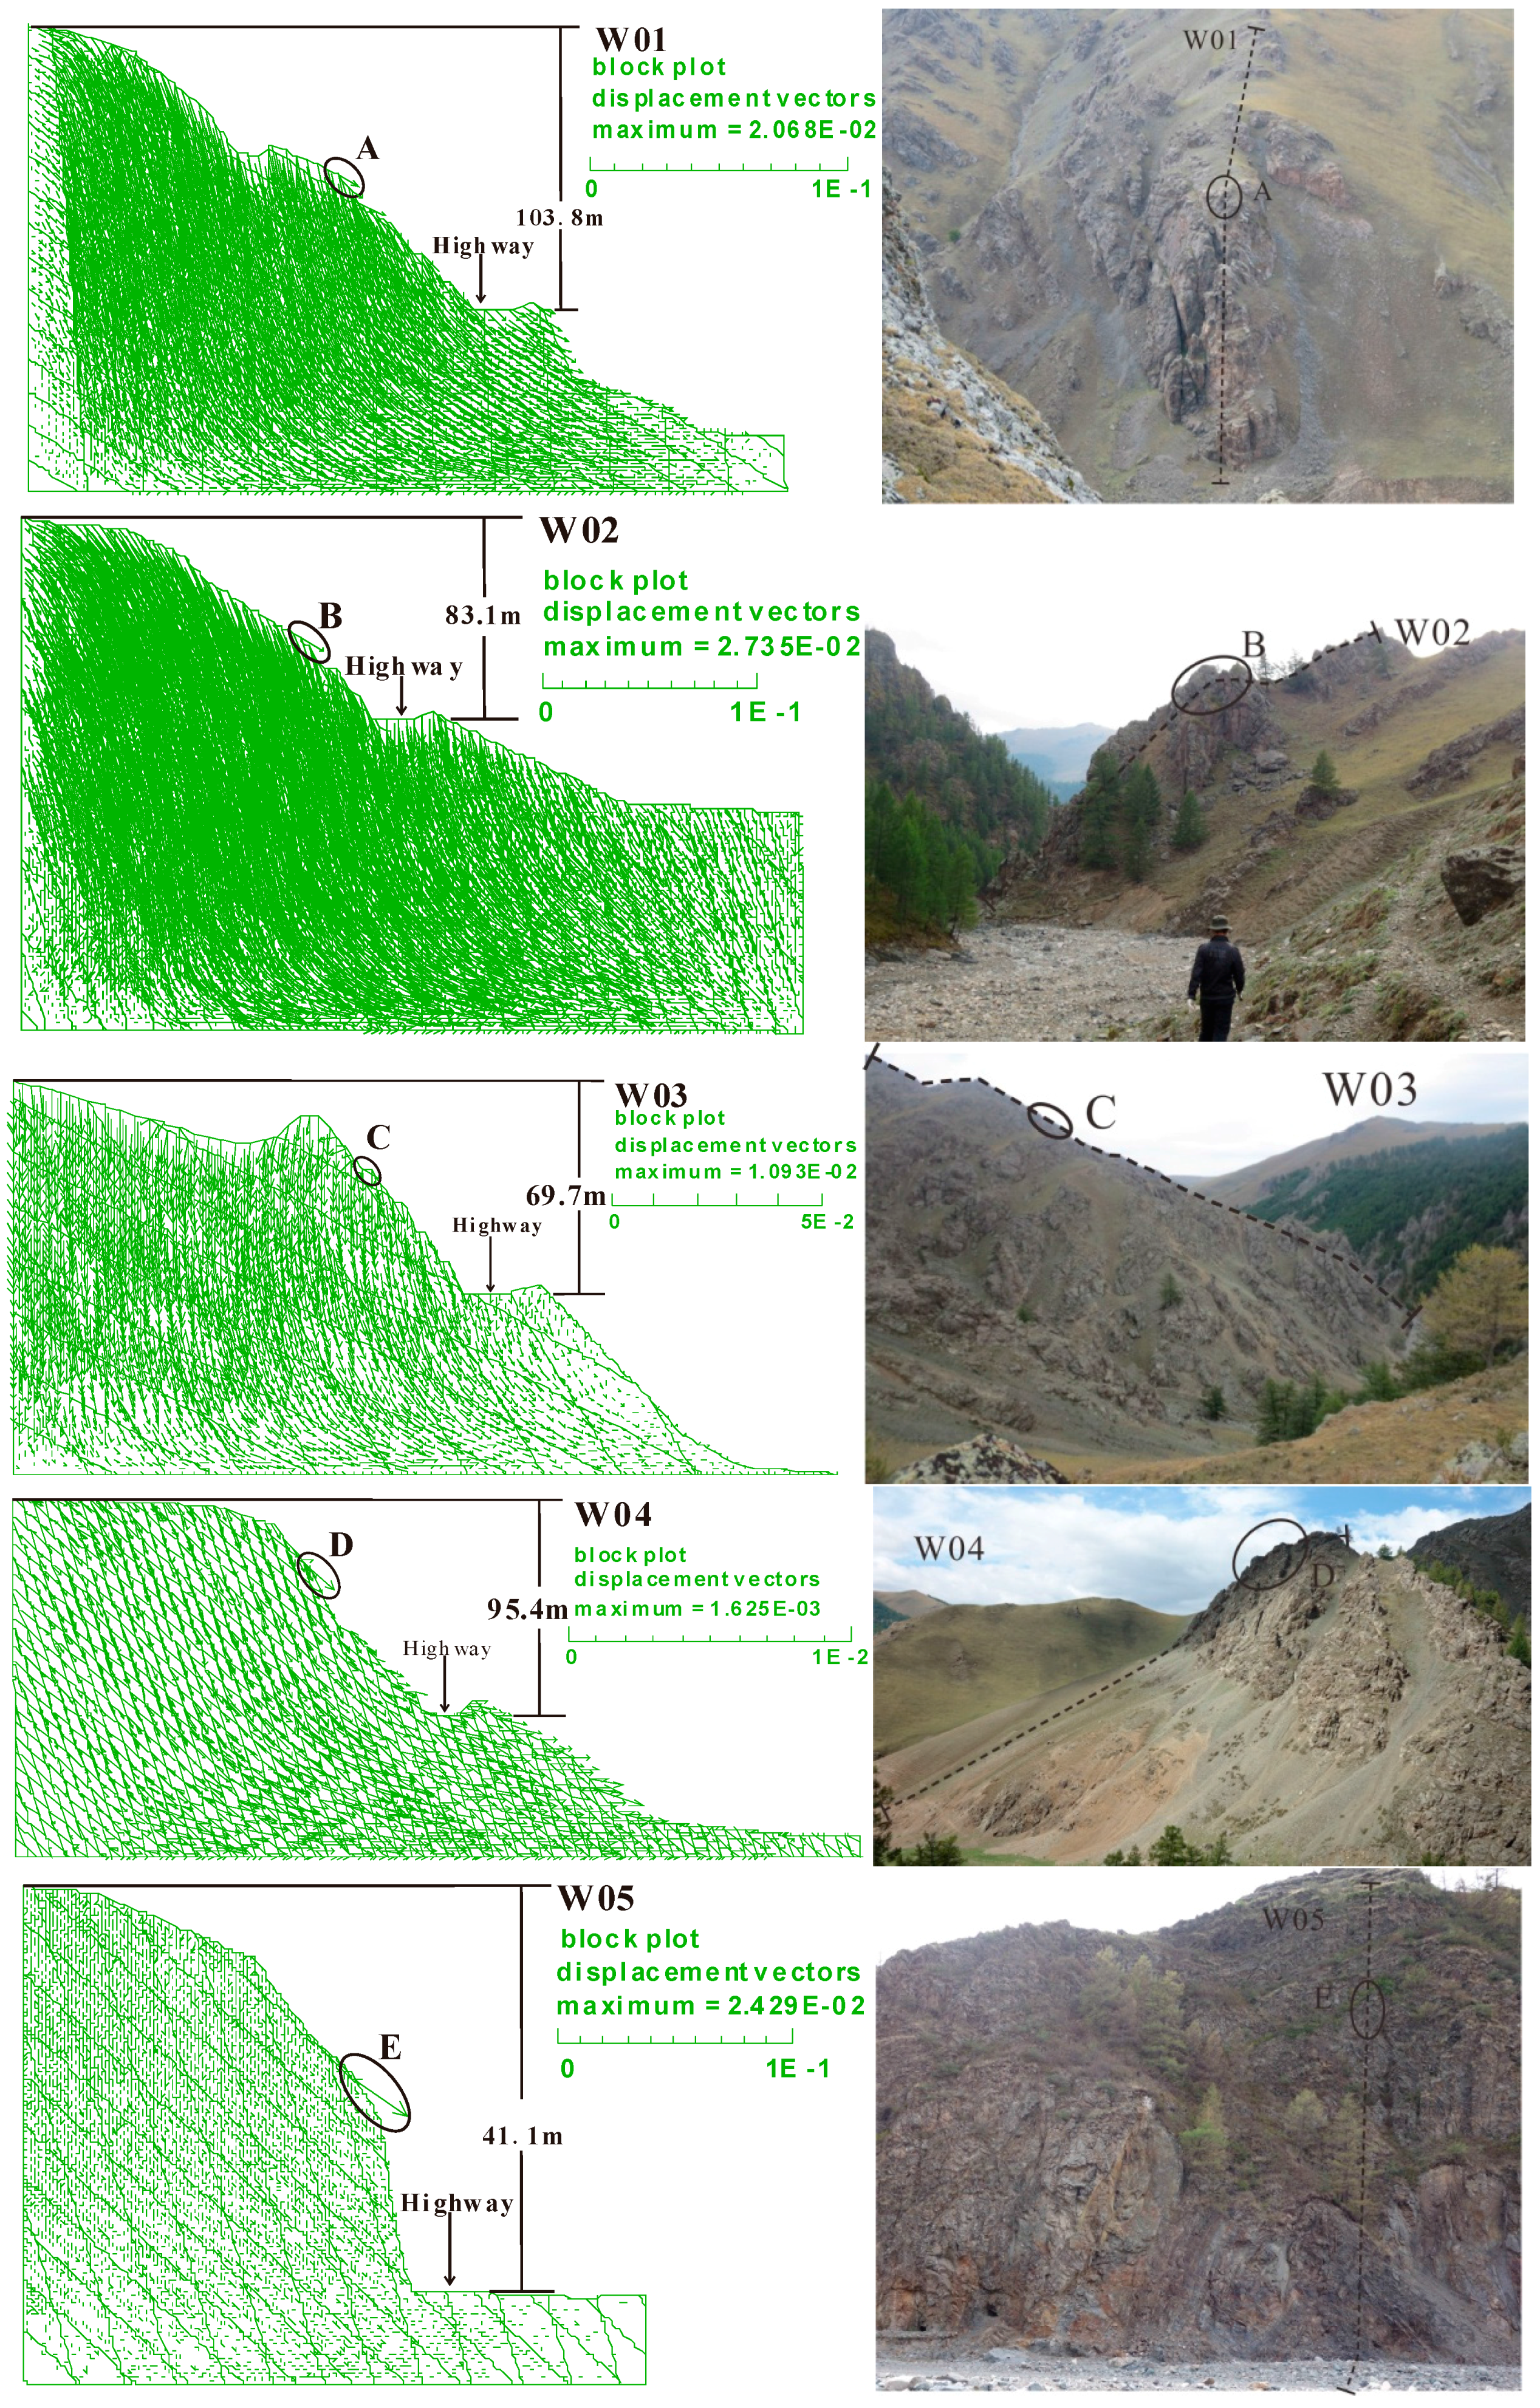
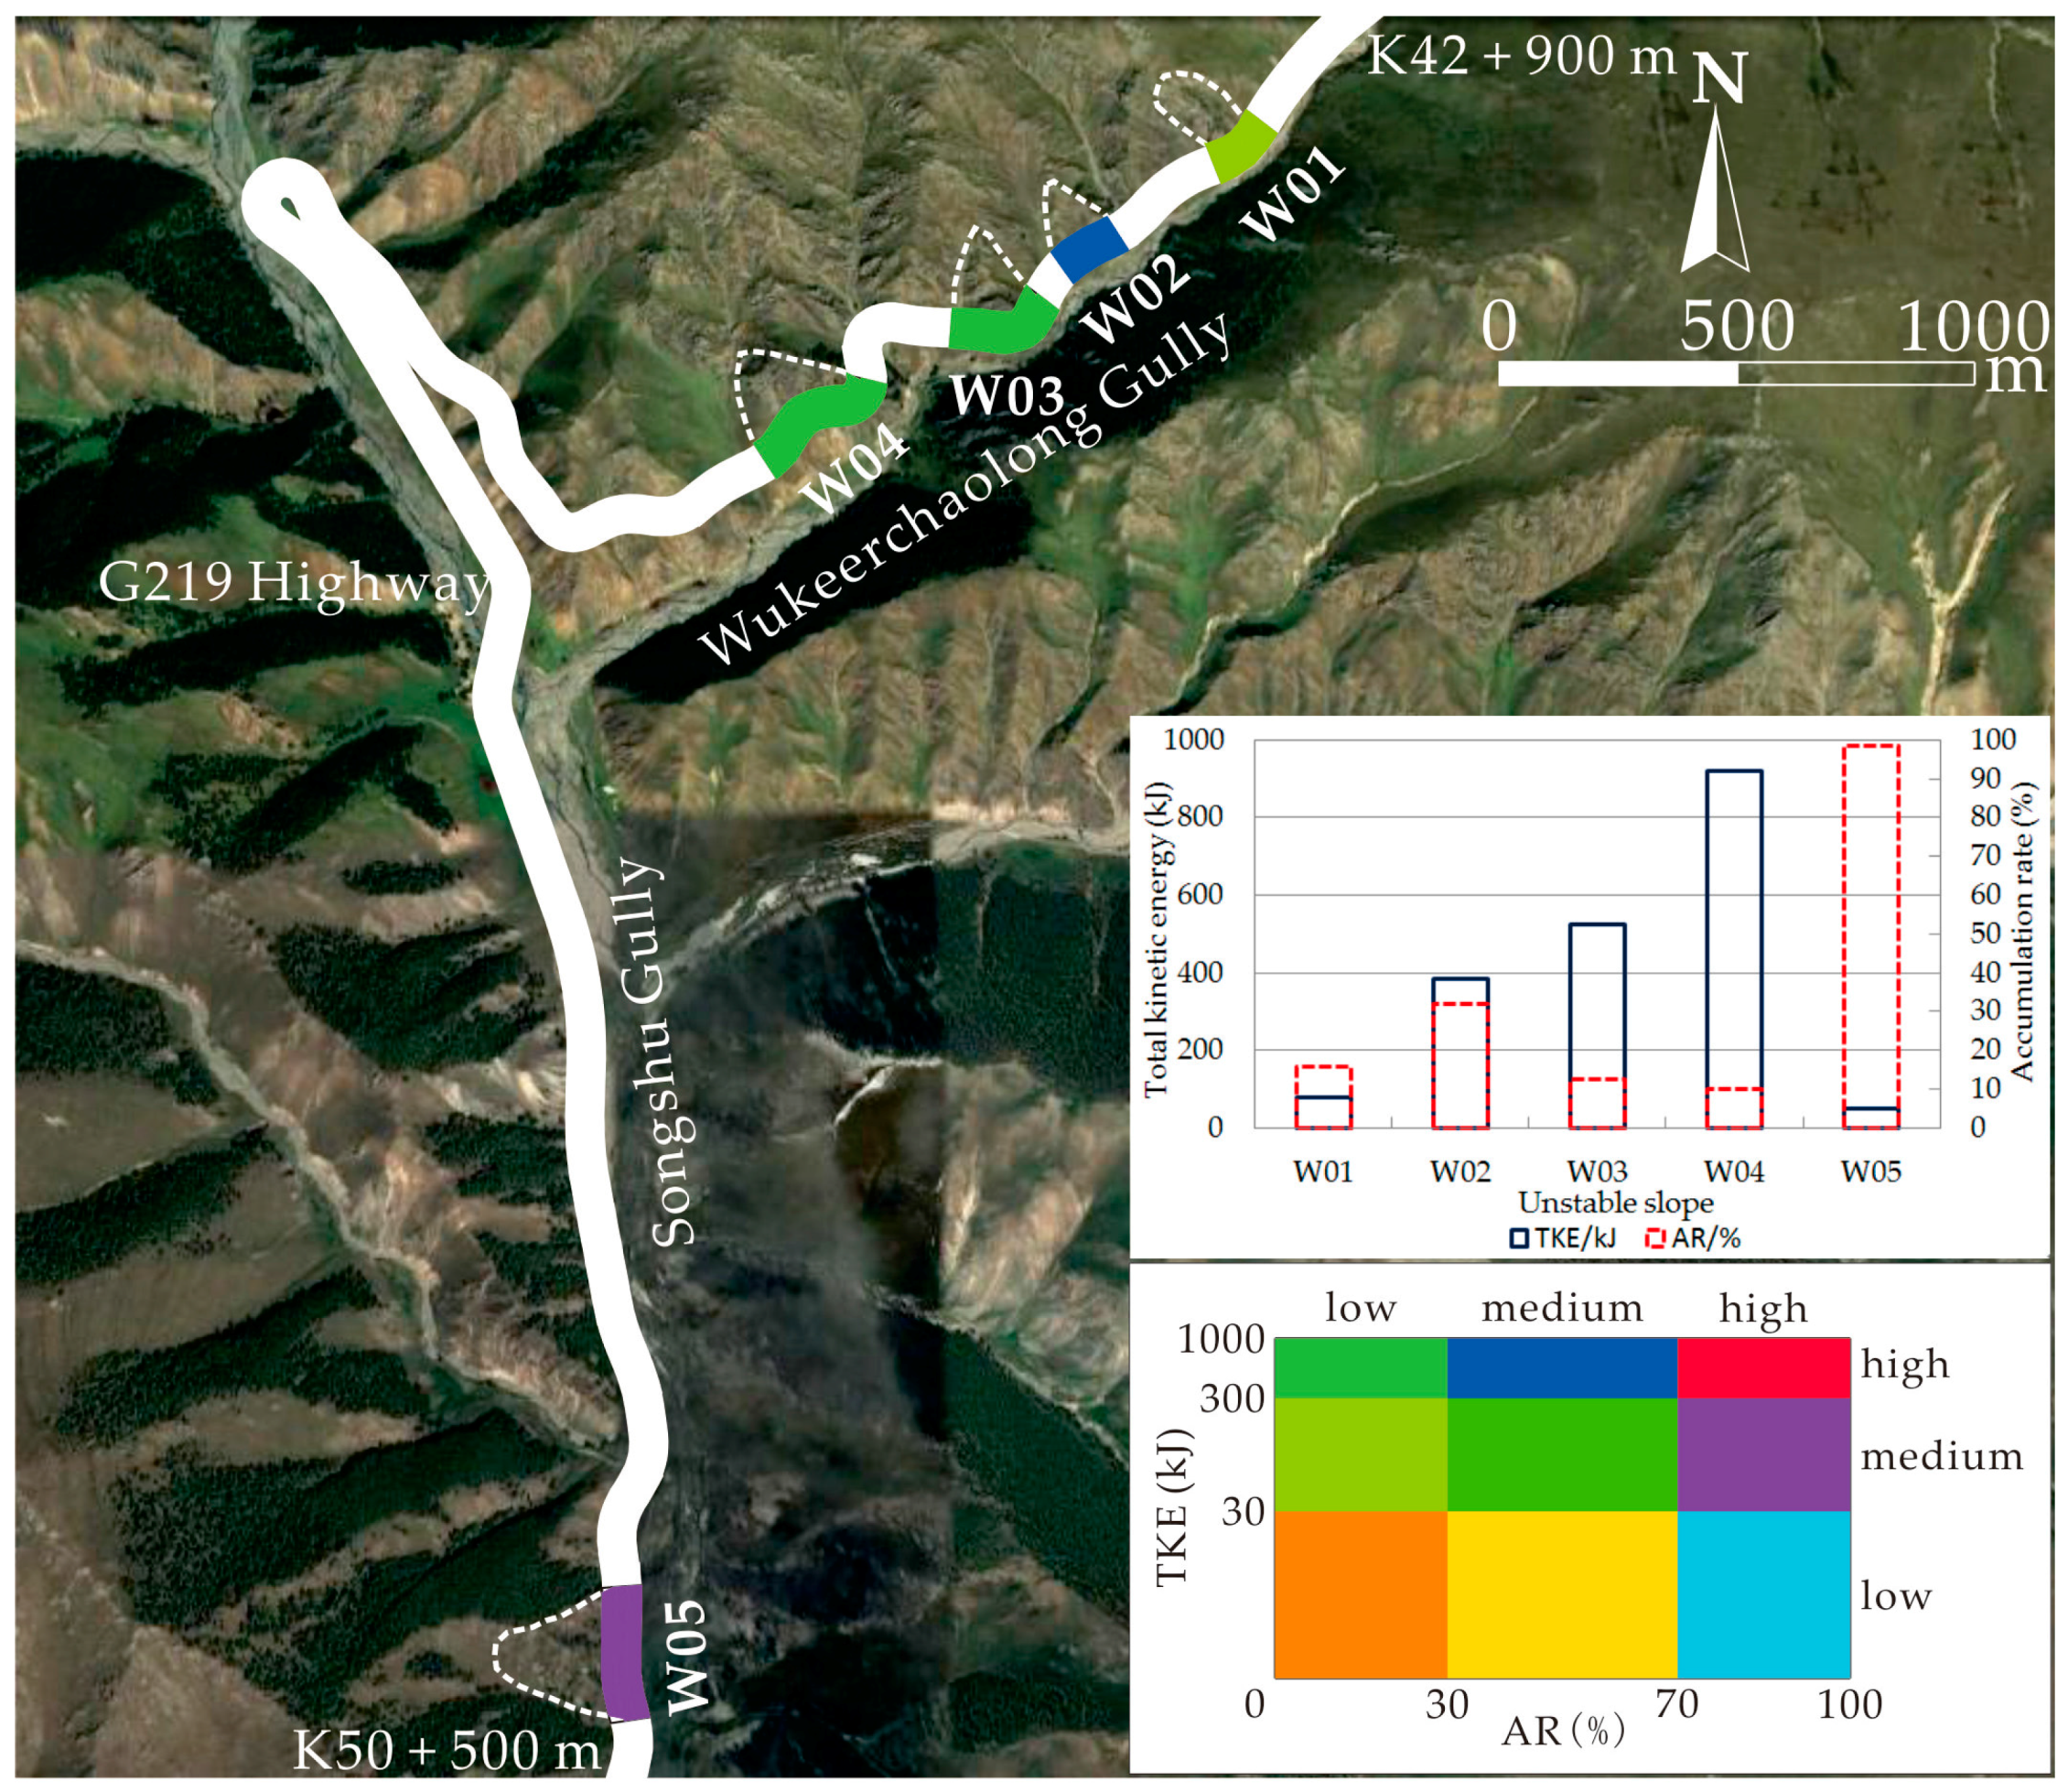
4.1. Potential Rockfall Initial Position

Determining the potential rockfall initial position is the most important part for hazard assessment, and the distinct element method is one of the common methods to research the stability of rock mass with discontinuity [27]. In this study, UDEC was applied to simulate the stable states and deformation processes of the slope profiles obtained from the five unstable slopes, using an elastoplastic constitutive model and Mohr–Coulomb failure criteria. The number of discontinuity sets developed in the unstable slope rock mass and their parameters (Table 2) were obtained through field investigations. Mechanical properties of the rock and discontinuity are usually obtained by laboratory tests or literature query [28]. In this study, laboratory tests including the bulk density test and triaxial compressive strength test for the specimens sampled from the five slopes were performed to characterize the mechanical properties of the rock (Table 3), according to ISRM (2007) recommendations. Additionally, the mechanical properties of the discontinuities (Table 3) were obtained through literature query [29].
The two-dimensional slope profiles of five unstable slopes were obtained from the high resolution topographic map with a scale of 1:1000, which was overlaid on the design parameters of the highway to build using CAD (Computer-Aided Design). Based on the discontinuity parameters, mechanical properties of the rock and discontinuity and two-dimensional slope profiles, UDEC simulations for five unstable slopes were performed. According to the simulation results, the positions where the slope displacement vector was the maximum were determined as the potential rockfall initial positions (A–E in Figure 6). Compared to the data and pictures collected from field investigations, the potential rockfall initial positions determined by UDEC simulations were basically the same as the ones determined in situ. Thus, the exact potential rockfall initial positions on five unstable slopes were verified in situ (Figure 6).
To test for the kinematic feasibility of different failure mechanisms on the basis of the available structural data in Table 2, the stereographic technique (as proposed by Hoek and Bray 1981) was adopted in this study. Results of these analyses show that the unstable blocks on five high slopes recognized in the field and through the UDEC models are subject to instability (Figure 7). The feasible mechanisms for the blocks on W01–W05 are toppling, planar sliding, wedge sliding, wedge sliding and toppling, respectively.

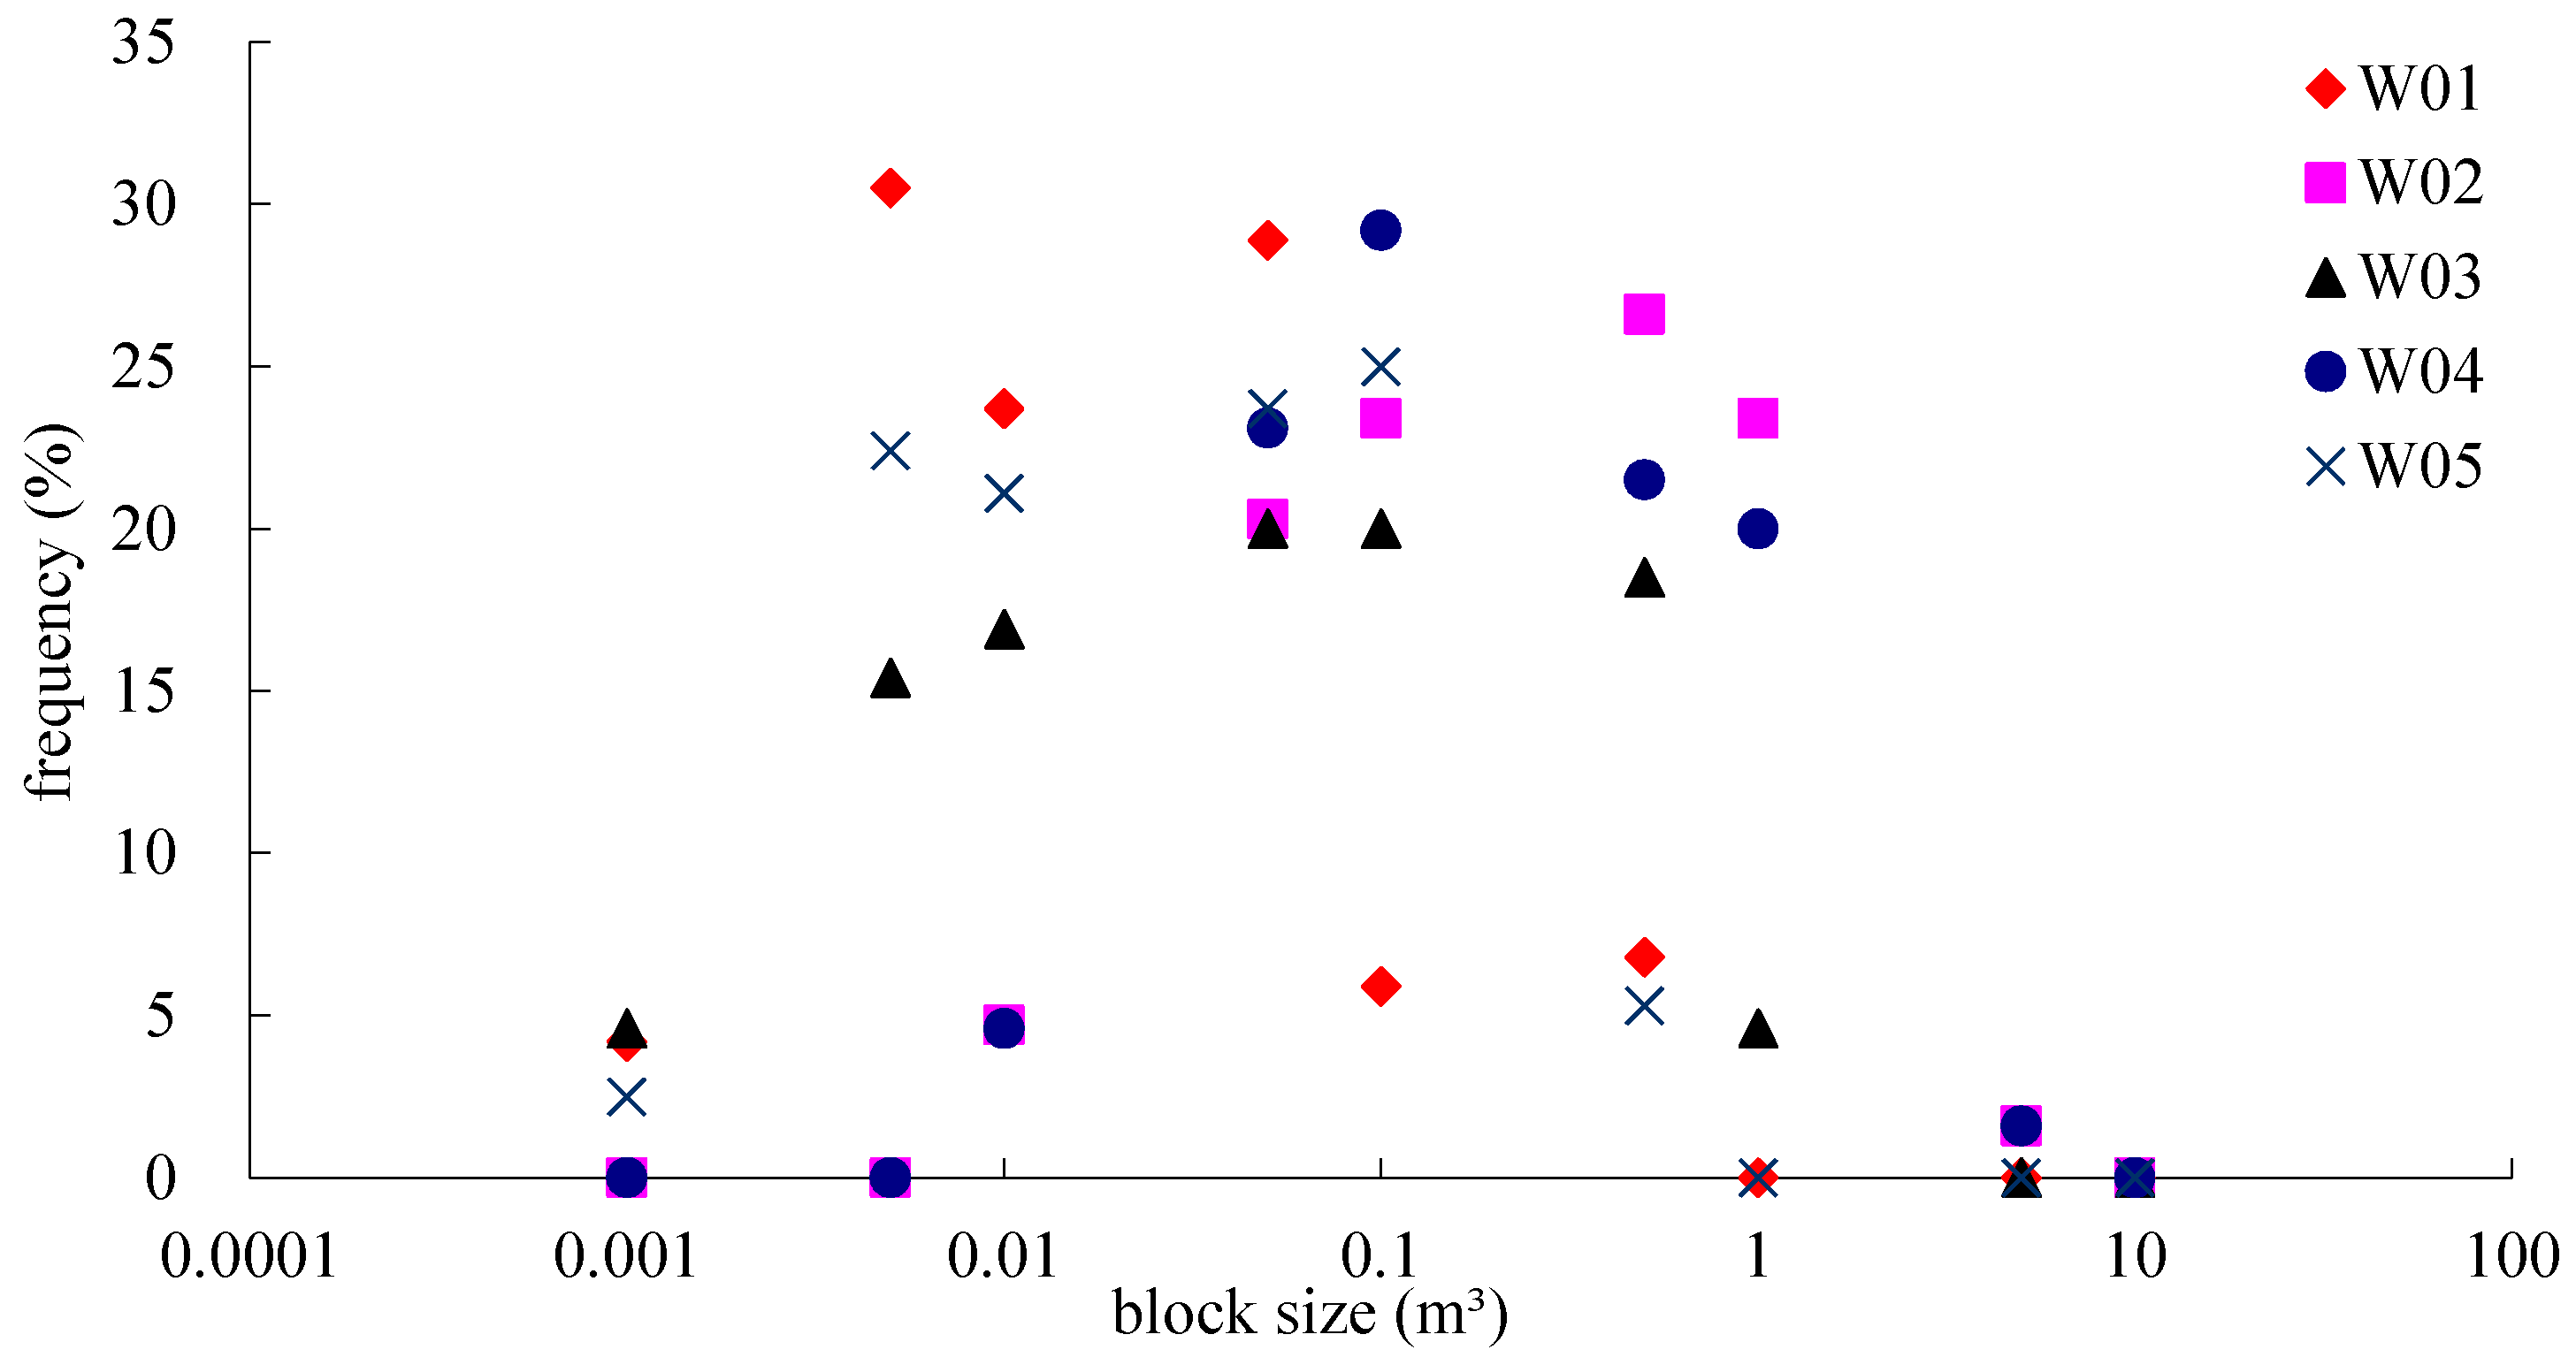
4.2. Rockfall Mass Selection

Rockfall mass is one of the basic parameters for rockfall hazard assessment, which directly affects the kinetic energy of the rockfall. At present, there are two methods including the field survey method and discontinuity density estimation method to determine the rockfall mass [30]. In this study, the unstable blocks were not accessible to measure directly because the unstable slopes were too steep. The size range of unstable blocks was determined by counting the size of rock blocks that have stacked at the relatively flat terrain of the unstable slopes, and according to the density tested in the laboratory, the mass range of unstable blocks was gotten, then six different masses were selected as representative values to conduct rockfall simulations. The size ranges (Figure 8) of unstable blocks on five unstable slopes were obtained from field investigations. Statistical results show the size range of unstable blocks on the W01 unstable slope is between 0.005 m3 and 0.100 m3, with a density of 2850 kg/m3, so the mass range is between 14.3 kg and 285 kg. Therefore, the rockfall mass representative values were set as 10 kg, 50 kg, 100 kg, 150 kg, 200 kg and 300 kg, respectively. Similarly, the size ranges, mass ranges and rockfall mass representative values for the other four unstable slopes could be determined in the same way (Table 4).
In order to verify the accuracy of the statistical analysis method used in this study, the sizes of the unstable blocks were estimated by the discontinuity density of the unstable slopes. Additionally, the estimated size ranges were basically the same with as size ranges determined by this method. This indicates that the statistical analysis method is an effective and accurate method to select the size range of unstable blocks, and it can provide references for future research on rockfall.

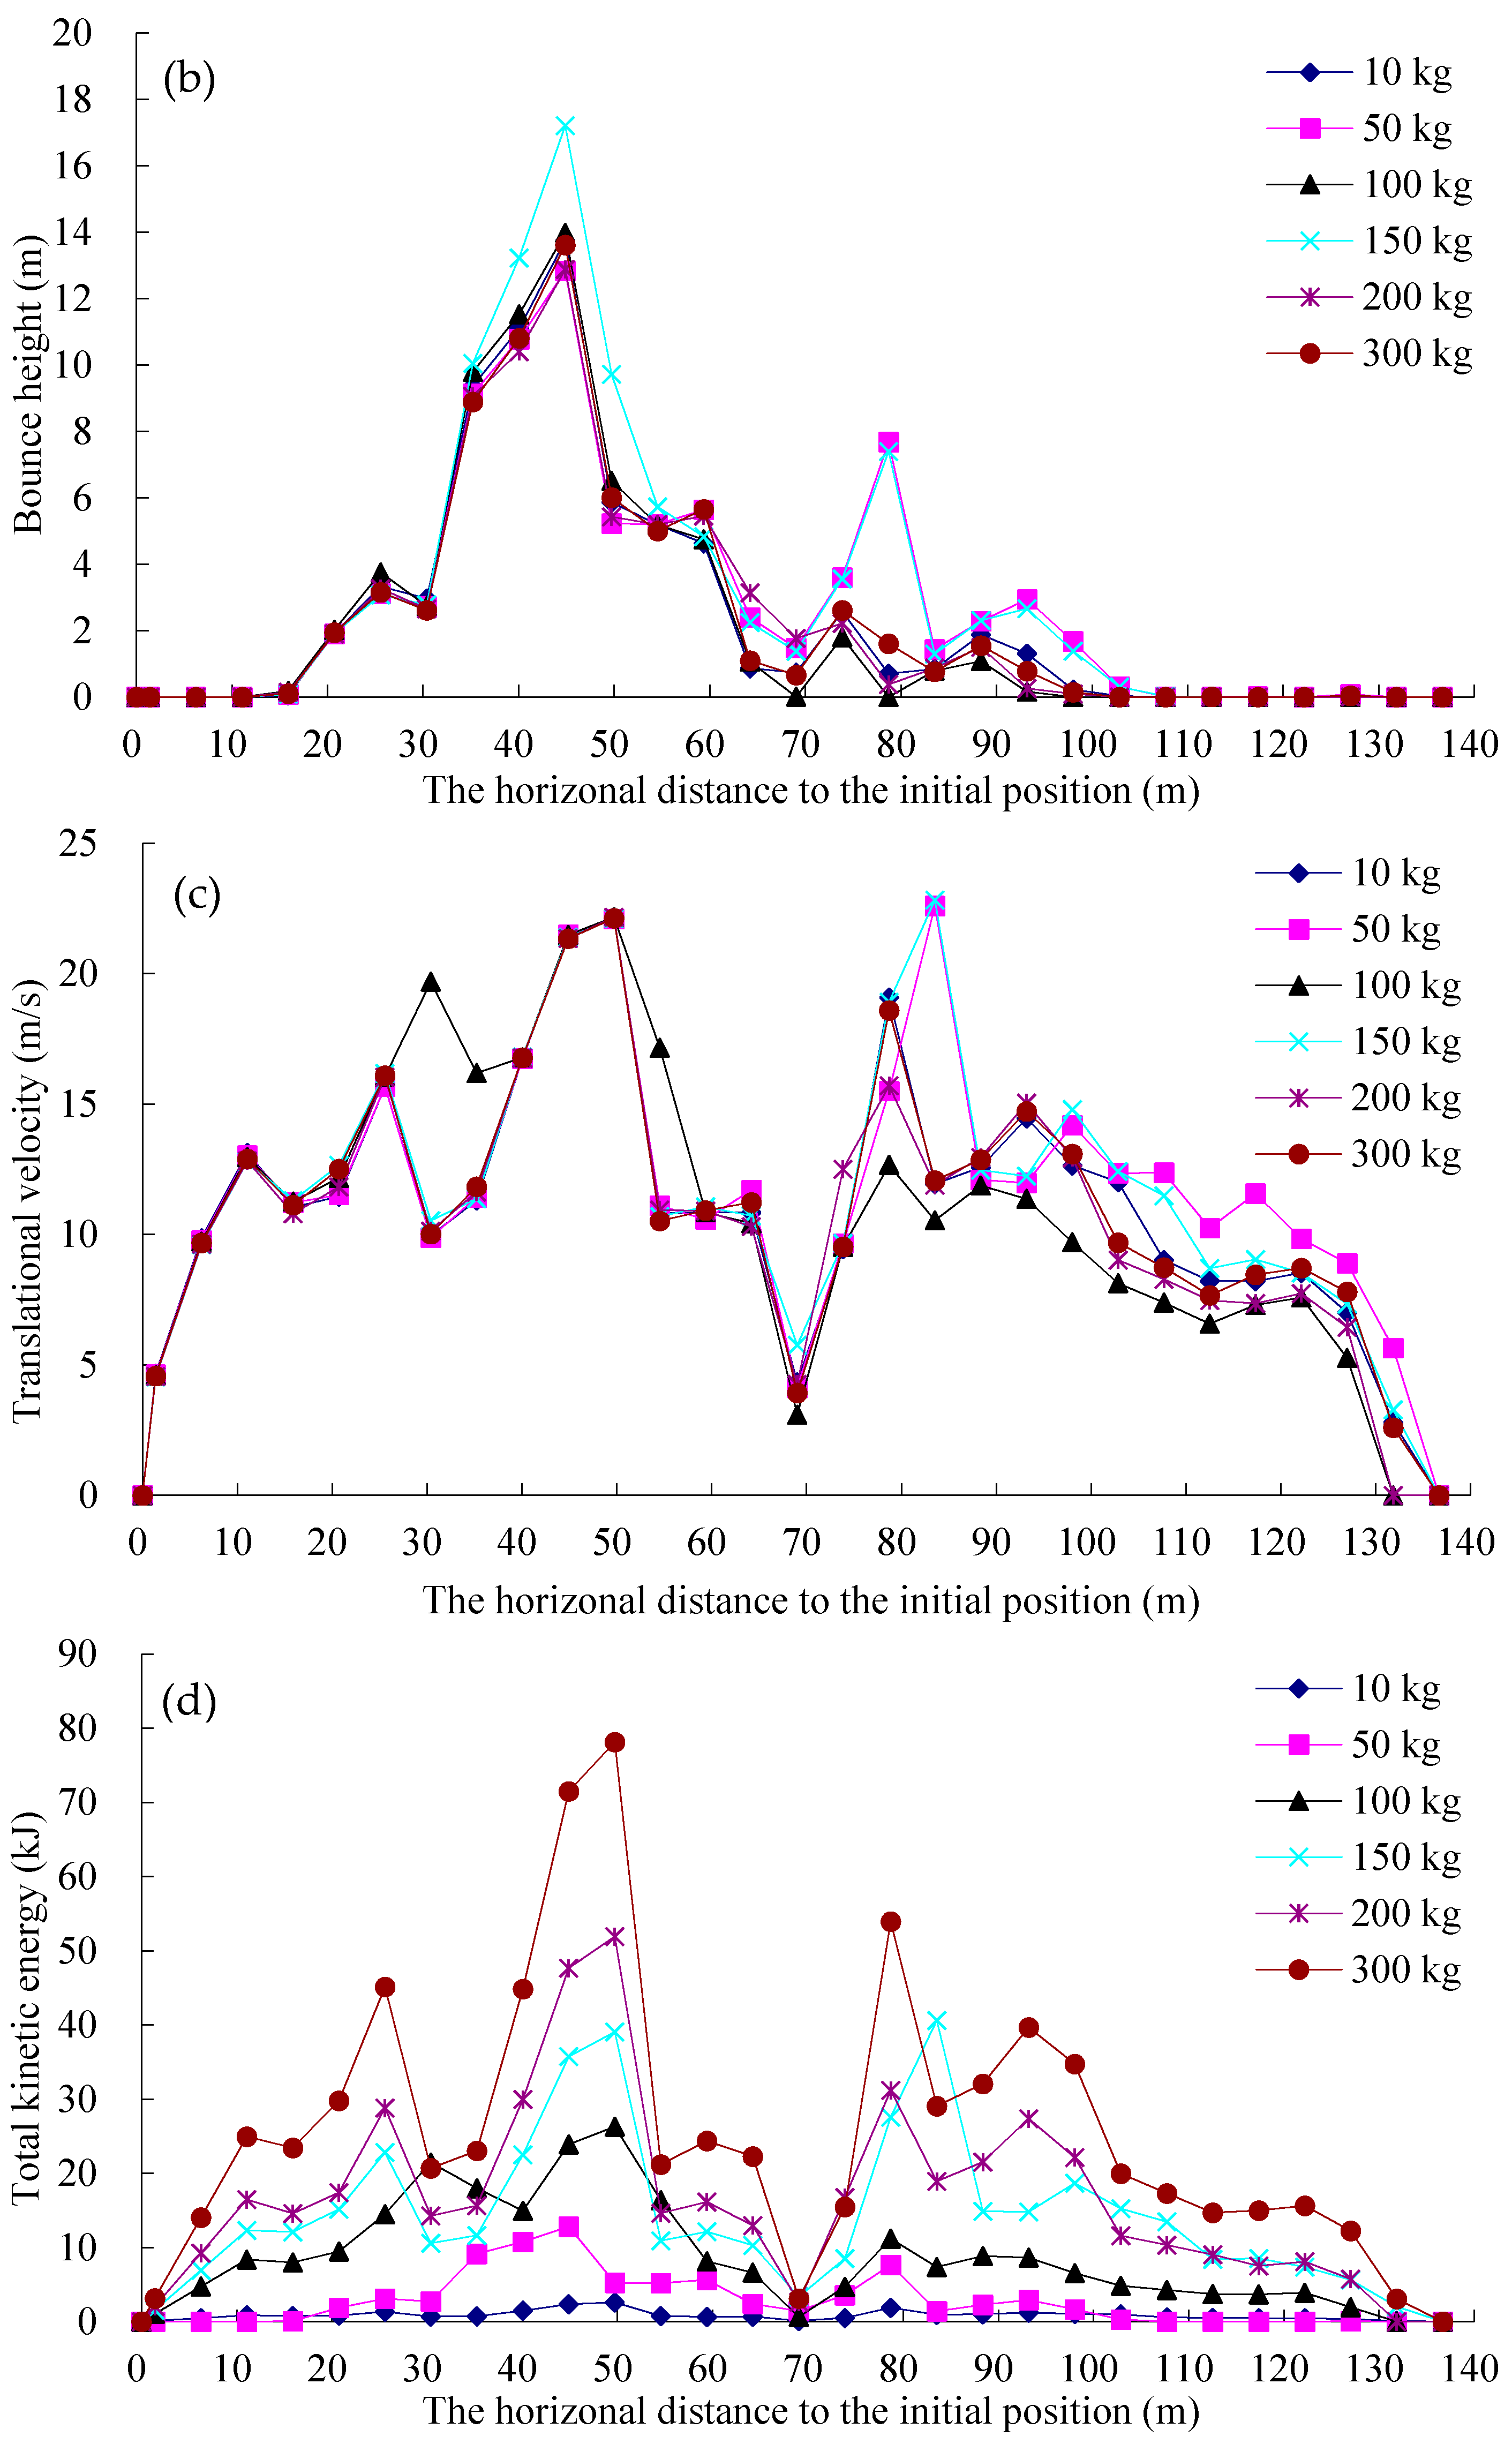
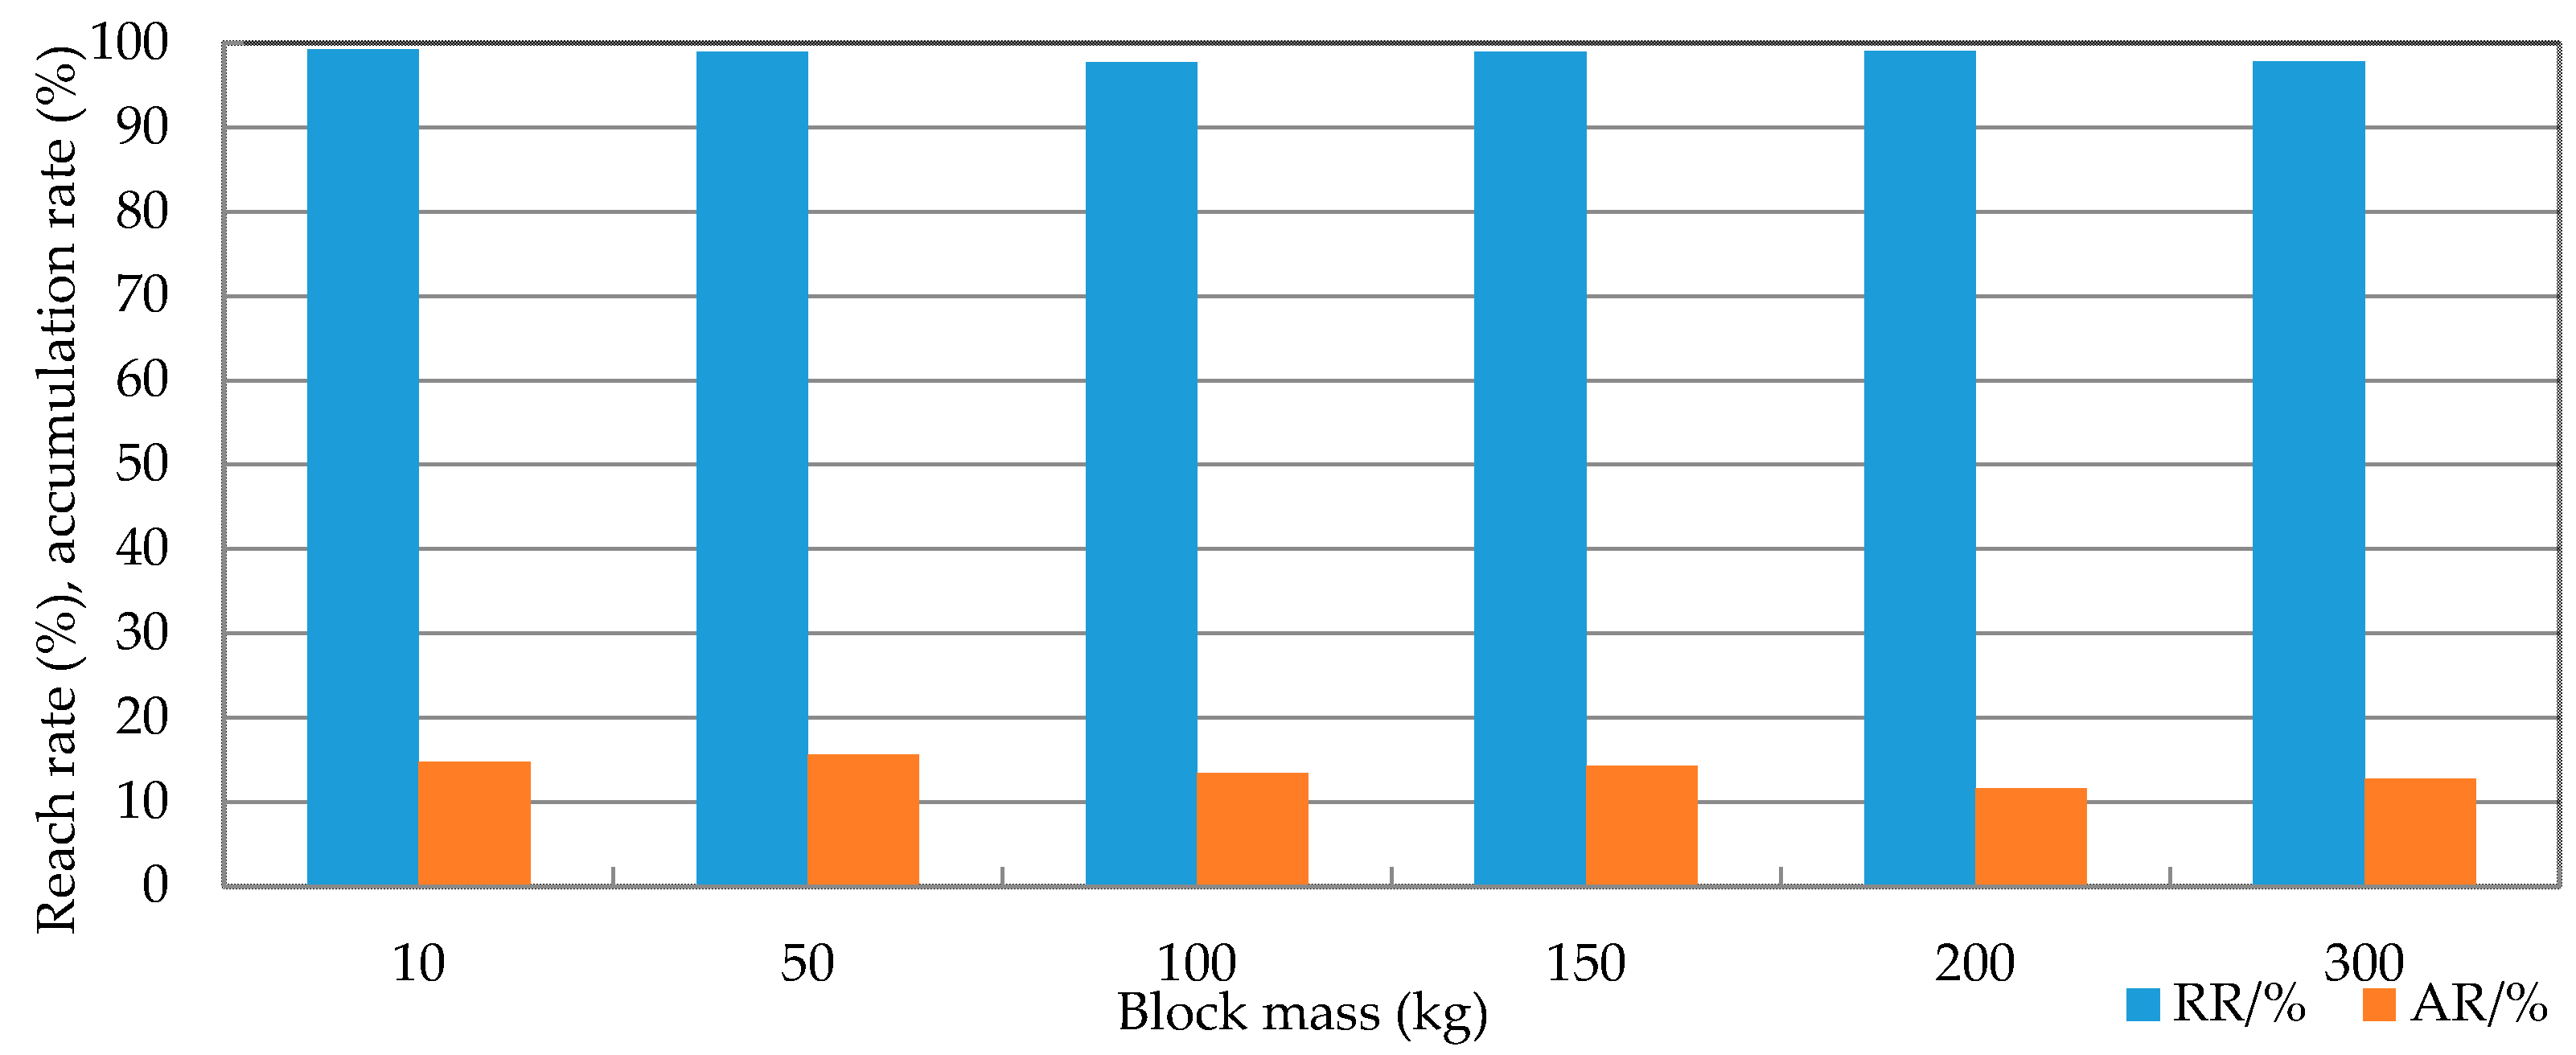
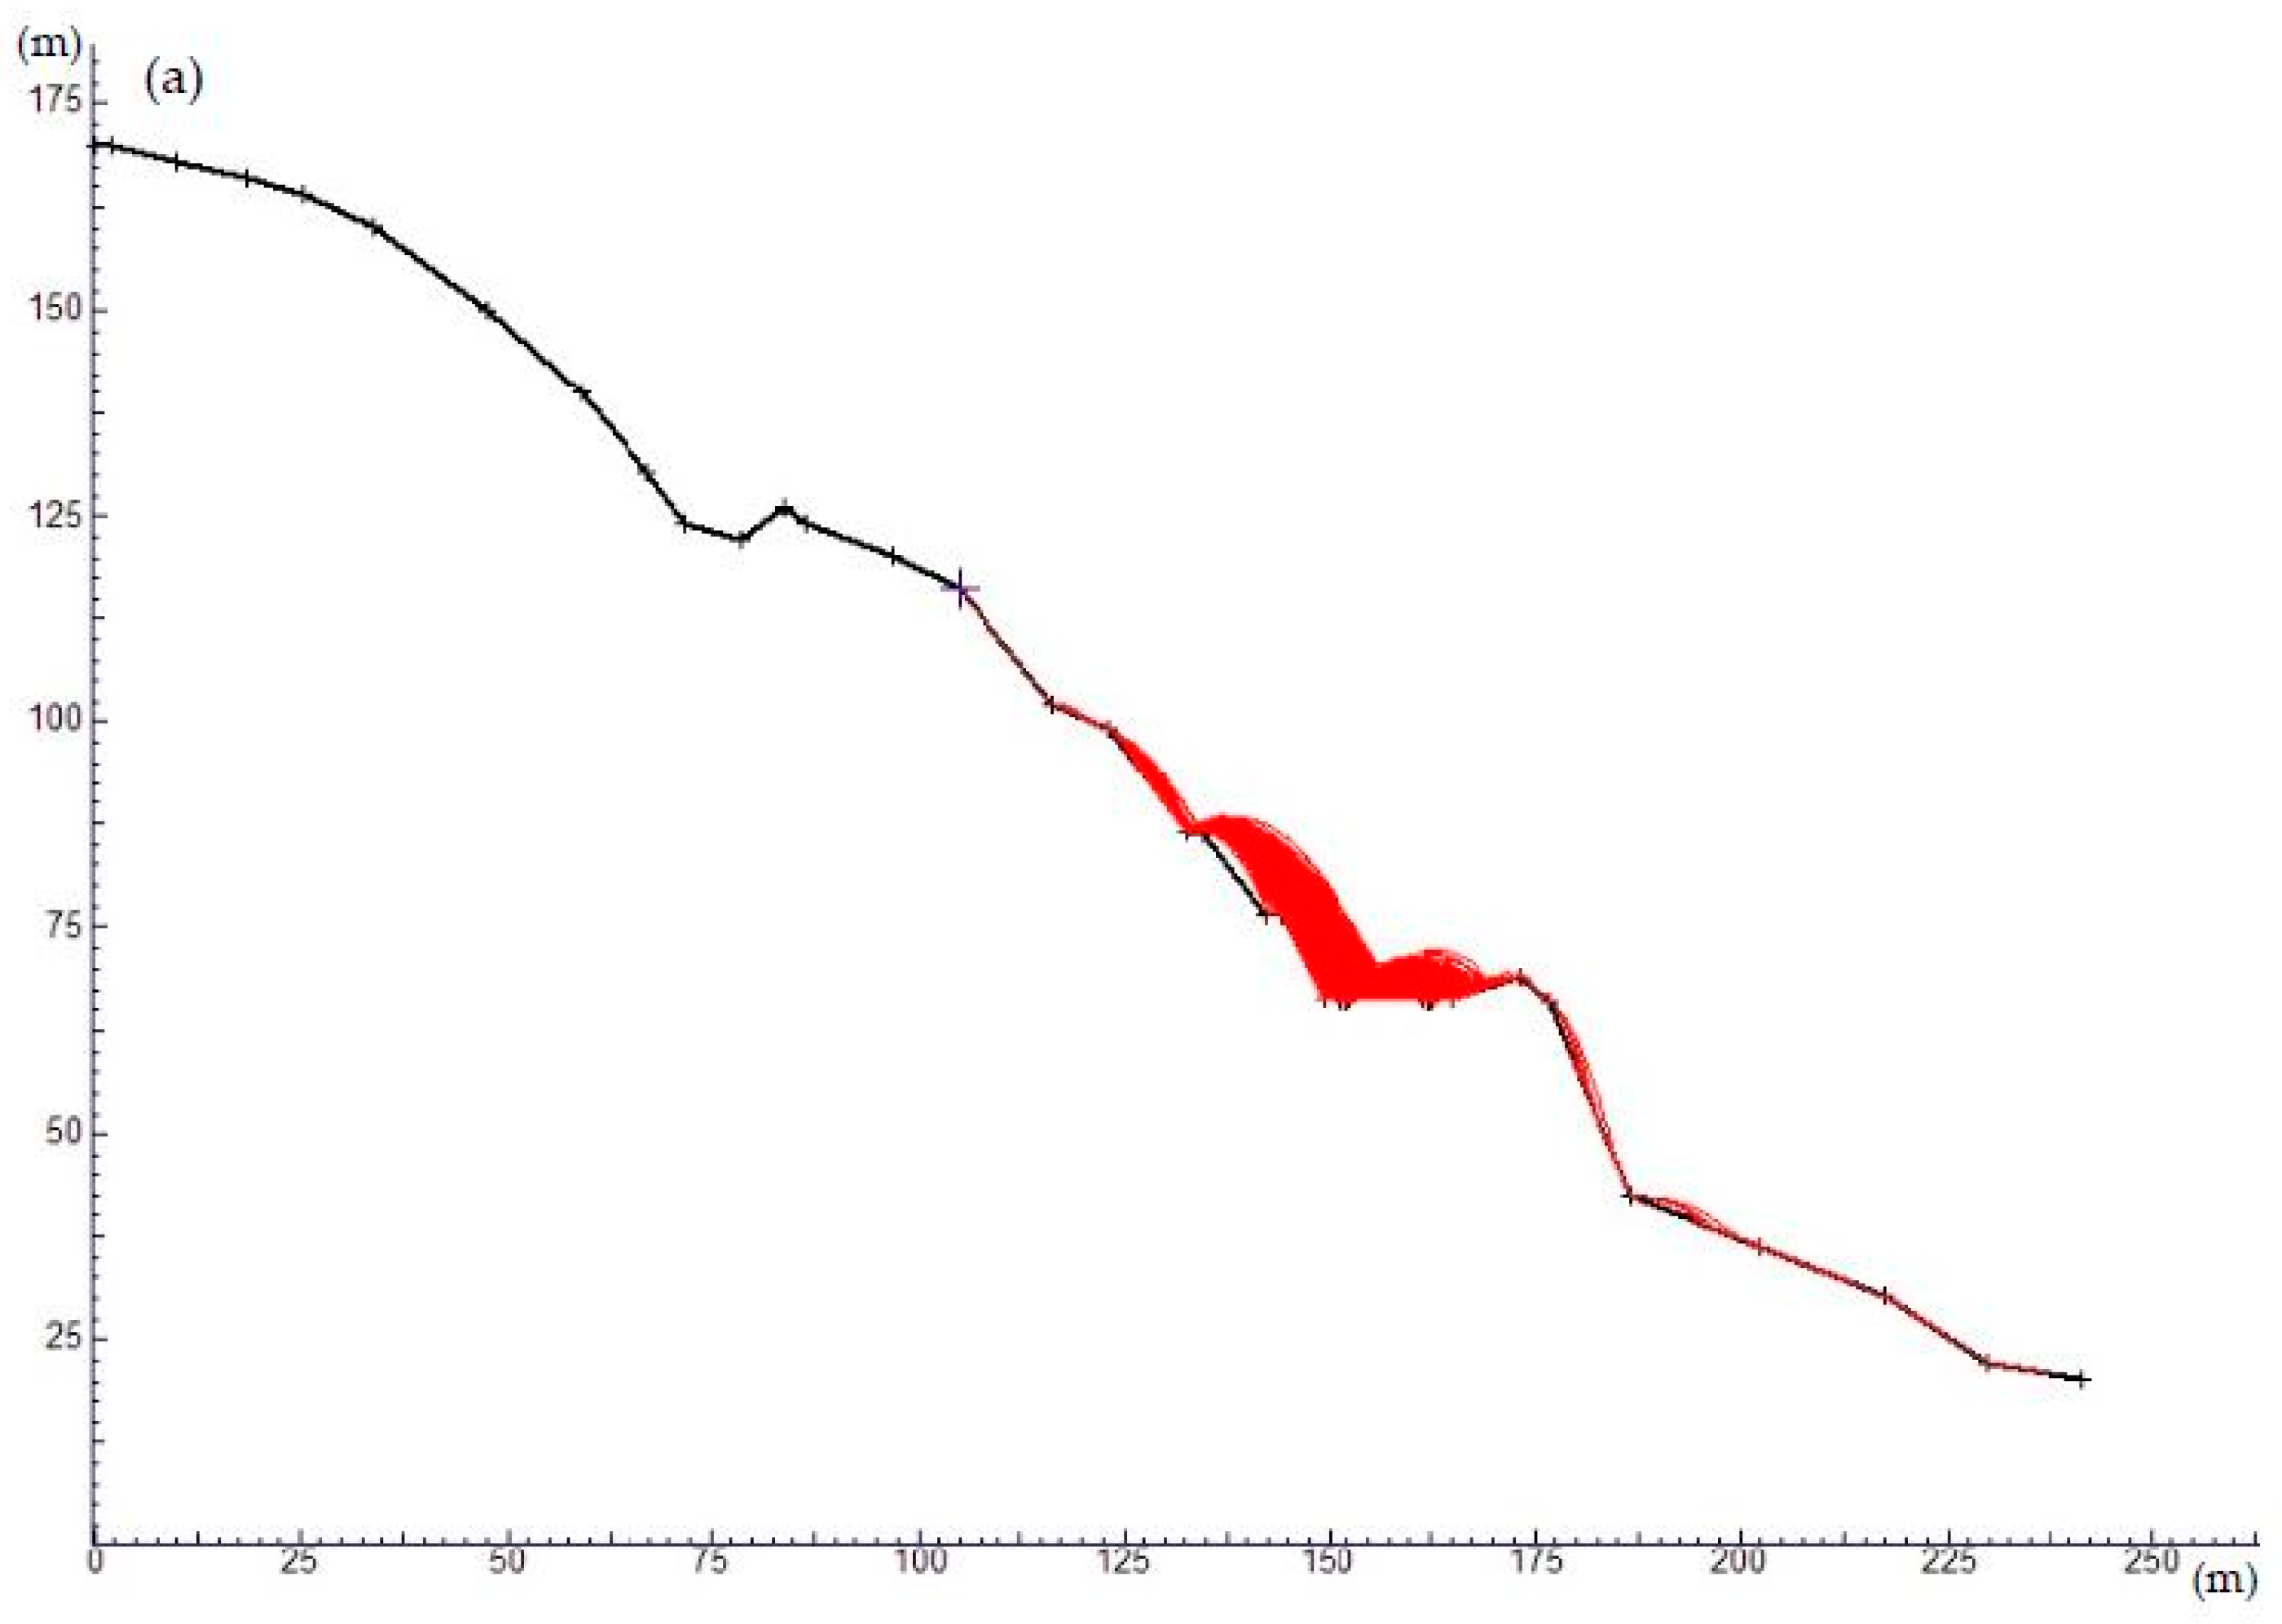
4.3. Rockfall Simulations

Rockfall trajectory is the precondition for rockfall hazard assessment, and it is mostly dependent on numerous parameters, such as slope geometry, surface vegetation, superficial lithology, block mass, block shape and initial velocity [31,32]. Rockfall trajectory can be obtained by means of empirical approaches or numerical simulation [33,34]. In this study, two-dimensional mathematical models of five unstable slopes were built, and Rocfall V.4.0 was applied to conduct rockfall simulations, which provided the arrest point and runout distance of each block, as well as bounce height, kinetic energy and velocity at any point along the slope profile. The important parameters used in the simulation include slope profile, rockfall mass and coefficients of restitution and friction. Slope profiles were obtained from the high resolution topographic map with a scale of 1:1000, which was overlaid on the design parameters of the highway to build using CAD. Rockfall mass was determined by the statistical analysis method. The coefficients of restitution and friction are affected by slope shape, surface vegetation and block shape [35,36], which can be obtained by four methods including in situ tests [37], back analysis [38], theoretical estimation [39,40] and literature query [41]. Because of the impossibility to perform in situ tests and a lack of some historical events records for back analysis and theoretical estimation, the first three methods are not suitable for this study. Hence, in order to select the appropriate coefficients of restitution, literature query [42,43] was used in this study (Table 5). According to the results of field investigations, nearly all of the surface material types along the slope profile for rockfall simulation were bedrock or boulders with little soil or vegetation, except that the surface material on the highway was asphalt, so we assumed that the coefficients of restitution were the same along the slope profile, except on the highway (Table 6). Additionally, the rotational friction angle, surface roughness and initial velocity for the five slopes were selected as 30° ± 2°, 2° and 0 m/s, respectively.
Rockfall simulations were carried out using Rocfall V.4.0 along the two-dimensional slope profile of W01. Table 4 and Table 6 show six different representative values of rockfall mass and values of parameters used in rockfall simulations. Four different parameters were observed in this study including runout distance, bounce height, translational velocity and total kinetic energy (Figure 9) during downslope movement of the rockfall along the profile. The results of the simulations are summarized below.
For different rockfall masses, the extrema and variation trends of runout distance, bounce height and translational velocity are nearly identical on the whole, with partial minor differences. However, the variation trends of total kinetic energy are almost identical, but the extrema vary widely. These findings suggest that along the same slope profile, rockfall mass has significant influence on total kinetic energy of rockfall, but little influence on runout distance, bounce height and translational velocity. On the W01 slope profile, the horizontal distance between potential rockfall initial position and the center line of the highway to build is 52.0 m, and the width of the highway is 11.6 m.
Rockfall trajectory (Figure 9a) and bounce height (Figure 9b) show that when the blocks fell freely from the initial position along the profile, on the slope profile, multiple impacts and bounces occurred. The maximum value for bounce height for blocks with different masses in the order of minimum to maximum in mass was 13.75 m, 12.84 m, 13.98 m, 17.22 m, 12.88 m and 13.61 m, respectively, with horizontal distance from the initial position of 44.9 m. The analysis of end point data extracted from the rockfall trajectory indicates that the runout distance ranged between 44.2 m and 136.5 m, with an average value of 60.5 m. More than 99% of the runout distances distributed between 44.2 m and 68.1 m, only 1% between 68.1 m and 136.5 m. Based on the runout distances, rockfall reach rate and accumulation rate are defined. Rockfall Reach Rate (RR) is defined as the percentage that the number of the blocks that reach the highway accounts for the total number of simulated blocks. The RR for blocks with different masses in the order of minimum to maximum in mass was 99.25%, 98.95%, 97.75%, 98.95%, 99.05% and 97.85%, respectively (Figure 10). Rockfall Accumulation Rate (AR) is defined as the percentage that the number of the blocks that stop motion and stack on the highway accounts for the total simulated blocks. The results show that the AR for blocks with different masses in the order of minimum to maximum in mass was 14.74%, 15.63%, 13.47%, 14.33%, 11.66% and 12.76%, respectively (Figure 10).
The changes of translational velocity and total kinetic energy during the rockfall occurred are shown in Figure 9c,d, indicating that the total kinetic energy of blocks has a direct relationship with their mass and the square of the velocity. Translational velocity and total kinetic energy further decreased after continuous impacts along the slope, and both of them continued to be increased until reaching the maximum value. Depending on the change trends of translational velocity and total kinetic energy, it is easy to find that the horizontal distance between the initial position and the place where the strongest impact occurred was about 49.7 m, indicating that the strongest impact occurred on the highway pavement with the maximum total kinetic energy. Rockfall impact would inevitably cause strong damage to the highway and threaten people’s lives and property security seriously.
The rockfall trajectory, bounce height, translational velocity and total kinetic energy of the other four unstable slopes were achieved by using the above rockfall simulation method. Based on the same statistical analysis method, runout distances, maximum values for bounce height, translational velocity, total kinetic energy and their corresponding locations, reach rates and accumulation rates of blocks with different masses for five unstable slopes were obtained after calculating and analyzing (Table 7).
The runout distances, highway locations and rockfall reach rates in Table 7 show that on all of the five unstable slopes, the highway is located at the rockfall influence areas. On the W01, W02, W03 and W04 slopes, the sections of the highway are located between the minimum and the maximum runout distance with minimum rockfall reach rates of 97.75%, 85.99%, 98.20% and 98.70%, respectively, and in case of rockfall, people and the vehicular traffic within these areas would be likely injured and endangered. However, on the W05 high slope, about one third of the highway pavement in width is located between the initial position and the minimum runout distance, with the other between the minimum and the maximum runout distance, and the rockfall reach rate was 100%. Once rockfall occurred, people and the vehicular traffic travelling in this area would be injured and endangered seriously.

4.4. Rockfall Influence Area Zonation

Rockfall influence area zonation can help engineers to select effective mitigation measures against rockfall to avoid casualty and property losses [44,45,46]. Perret et al. mentioned that according to the total kinetic energy, the rockfall influence area could be classified into the low-intensity zone, medium-intensity zone and high-intensity zone [47]. Wang et al. put forward that using minimum and maximum runout distances, the zonation could be defined as highly dangerous zone, dangerous zone and not dangerous zone [48]. Since the blocks that are in motion have some kinetic energy, blocks that reach the highway scope will impact the highway heavily, which will not only shorten its service life, but also cause a serious threat to people’s lives and the vehicular traffic travelling on the highway; besides, blocks stacking on the highway will seriously affect its normal use and increase cleanup tasks.
In this study, the rockfall influence area between initial position and maximum runout distance is zoned simultaneously considering the maximum total kinetic energy and maximum accumulation rate of rockfall obtained from rockfall simulations. According to total kinetic energy, the rockfall influence area can be classified into three intensity zones: low-intensity zone, referring to the area where the energy value is less than 30 kJ; medium-intensity zone, where the energy value ranges from 30 to 300 kJ; high-intensity zone with an energy value more than 300 kJ. At the same time, according to accumulation rate, the rockfall influence area can be divided into three zones. The zone with an accumulation rate less than 30% is defined as the low-accumulation zone. In the case of rockfall, the rockfall is less likely to stack on the highway and affect its normal use weakly. The zone with an accumulation rate between 30% and 70% is defined as the medium-accumulation zone. In the case of rockfall, the rockfall is likely to stack on the highway and affect its normal use relatively strongly. The zone with an accumulation rate more than 70% is defined as the high-accumulation zone. In the case of rockfall, the rockfall is very likely to stack on the highway and affect its normal use strongly. Thus, the rockfall influence area can be classified into nine zones applying the above two zonation principles simultaneously. The analysis and resulting zonation map (Figure 11) show that the sections of the highway on the W01, W02, W03, W04 and W05 high slopes are located at the medium-intensity low-accumulation zone, high-intensity medium-accumulation zone, high-intensity low-accumulation zone, high-intensity low-accumulation zone and medium-intensity high-accumulation zone, respectively.

5. Conclusions

In this study, the Wukeerchaolong gully-Songshu gully segment of the G219 line of Jimunai-Hebukesaier highway was selected as the study area, where rockfall is one of the most common geological hazards on highway high slopes. Field investigations indicated that the study area is located in steep mountainous areas belonging to a cold-arid area in northwest China, and due to the existence of large amounts of unloading discontinuities and the strong freeze thaw weathering, numbers of unstable blocks on the high slopes get detached from the slope surface and form rockfalls recurrently, resulting in the highway in the study area being in danger of rockfalls, which threaten the safety of people’s lives and the vehicular traffic travelling on the highway seriously.
In order to determine the rockfall hazard around the study area, a combination of field investigations, laboratory experiments and numerical simulation methods were performed. In particular, this is the first time that the statistical analysis method was used to select the size range of unstable blocks, which could provide references for the future research on rockfall. As a result, five high slopes (i.e., W01, W02, W03, W04 and W05) have been identified where the sections of the highway are at the risk of potential rockfalls. Based on the rockfall total kinetic energy and accumulation rate obtained from the rockfall simulation results, rockfall influence area zonation was performed to estimate the sections of the highway exposed to different degrees of rockfall hazard, leading to the conclusions that the sections of highway on W01–W05 are located at the medium-intensity low-accumulation zone, high-intensity medium-accumulation zone, high-intensity low-accumulation zone, high-intensity low-accumulation zone and medium-intensity high-accumulation zone, respectively.
Based on the analysis, a zonation map was accomplished, which shows that mitigation measures are needed on all five high slopes. According to the practical conditions of the study area, available mitigation measures were put forward, including using a controlled blasting technique during the excavation, trimming and removing the available unstable blocks, covering the small blocks with restraining nets, reinforcing the relatively large ones by rock bolts and constructing retaining walls and catch ditches at the toe of the slope.

Acknowledgments

This study is financially supported by the National Natural Science Foundation of China (41372324), the National Basic Research Program of China (973 Program) (2014CB046901) and the China Postdoctoral Science Foundation funded project (2015M580135).

Author Contributions

All authors were responsible for different parts of this paper. Peng Yang, Yanyan Li, Yanjun Shang and Huilun Wang conducted field investigations. Peng Yang and Yanyan Li wrote the whole paper. Yanjun Shang and Kun Li revised the paper.

Conflicts of Interest

The authors declare no conflict of interest.

References

  1. Ritchie, A.M. Evaluation of rockfall and its control. J. Exp. Psychol. Appl. 1963, 2, 291–304. [Google Scholar]
  2. Matsuoka, N.; Sakai, H. Rockfall activity from an alpine cliff during thawing periods. Geomorphology 1999, 28, 309–328. [Google Scholar] [CrossRef]
  3. Marzorati, S.; Luzi, L.; Amicis, M.D. Rock falls induced by earthquakes: A statistical approach. Soil Dyn. Earthq. Eng. 2002, 22, 565–577. [Google Scholar] [CrossRef]
  4. Dorren, L.K.A. A review of rockfall mechanics and modelling approaches. Prog. Phys. Geogr. 2003, 27, 69–87. [Google Scholar] [CrossRef]
  5. Flageollet, J.C.; Weber, D. Fall. In Landslide Recognition; Dikau, R., Brunsden, D., Schrott, L., Ibsen, M.L., Eds.; Wiley: Chichester, UK, 1996; pp. 13–28. [Google Scholar]
  6. Abebe, B.; Dramis, F.; Fubelli, G.; Umer, M.; Asrat, A. Landslides in the Ethiopian highlands and the Rift margins. J. Afr. Earth Sci. 2010, 56, 131–138. [Google Scholar] [CrossRef]
  7. Sassa, K.; Tsuchiya, S.; Ugai, K.; Wakai, A.; Uchimura, T. Landslides: A review of achievements in the first 5 years (2004–2009). Landslides 2009, 6, 275–286. [Google Scholar] [CrossRef]
  8. Ulusay, R.; Gokceoglu, C.; Topal, T.; Sonmez, H.; Tuncay, E.; Erguler, Z.A.; Kasmer, O. Assessment of environmental and engineering geological problems for the possible re-use of an abandoned rock-hewn settlement in Urgup (Cappadocia), Turkey. Environ. Geol. 2006, 50, 473–494. [Google Scholar] [CrossRef]
  9. Tunusluoglu, M.C.; Zorlu, K. Rockfall hazard assessment in a cultural and natural heritage (Ortahisar Castle, Cappadocia, Turkey). Environ. Geol. 2009, 56, 963–972. [Google Scholar] [CrossRef]
  10. Budetta, P. Assessment of rockfall risk along roads. Nat. Hazards Earth Syst. Sci. 2004, 4, 71–81. [Google Scholar] [CrossRef]
  11. Ansari, M.K.; Ahmad, M.; Singh, R.; Singh, T.N. Rockfall assessment near Saptashrungi Gad temple Nashik, Maharashtra, India. Int. J. Disaster Risk Reduct. 2012, 2, 77–83. [Google Scholar] [CrossRef]
  12. Palma, B.; Parise, M.; Reichenbach, P.; Guzzetti, F. Rockfall hazard assessment along a road in the Sorrento Peninsula Campania southern Italy. Nat. Hazards 2012, 61, 187–201. [Google Scholar] [CrossRef]
  13. Youssef, A.M.; Maerz, N.H.; Alotaibi, A.A. Stability of Rock Slopes along Raidah Escarpment Road, Asir Area, Kingdom of Saudi Arabia. J. Geogr. Geol. 2012, 4, 48–70. [Google Scholar] [CrossRef]
  14. Pappalardo, G.; Mineo, S.; Rapisarda, F. Rockfall hazard assessment along a road on the Peloritani Mountains (northeastern Sicily, Italy). Nat. Hazards Earth Syst. Sci. 2014, 14, 2735–2748. [Google Scholar] [CrossRef] [Green Version]
  15. Zhang, L.; Xu, B.; Shang, Y.; Zhu, J.; Yang, Z. Engineering geological investigation and assessment on rockfall hazard along Basu Linzhi section of south line of Sichuan-Tibet highway. Chin. J. Rock Mech. Eng. 2004, 23, l551–l557. [Google Scholar]
  16. Mineo, S.; Pappalardo, G.; Rapisarda, F.; Cubito, A.; Di Maria, G. Integrated geostructural, seismic and infrared thermography surveys for the study of an unstable rock slope in the Peloritani Chain (NE Sicily). Eng. Geol. 2015, 195, 225–235. [Google Scholar] [CrossRef]
  17. Pappalardo, G.; Mineo, S.; Zampelli, S.P.; Cubito, A.; Calcaterra, D. InfraRed Thermography proposed for the estimation of the Cooling Rate Index in the remote survey of rock masses. Int. J. Rock Mech. Min. 2016, 83, 182–196. [Google Scholar] [CrossRef]
  18. Yilmaz, I.; Yildirim, M.; Keskin, I. A method for mapping the spatial distribution of rockfall computer program analyses results using ArcGIS software. Bell. Eng. Geol. Environ. 2008, 67, 547–554. [Google Scholar] [CrossRef]
  19. Guzzetti, F.; Crosta, G.; Detti, R.; Agliardi, F. STONE: A computer program for the three-dimensional simulation of rock-falls. Comput. Geosci. 2002, 28, 1079–1093. [Google Scholar] [CrossRef]
  20. Jaboyedoff, M.; Labiouse, V. Technical Note: Preliminary estimation of rockfall runout zones. Nat. Hazards Earth Syst. Sci. 2011, 11, 819–828. [Google Scholar] [CrossRef] [Green Version]
  21. Li, L.; Lan, H. Probabilistic modeling of rockfall trajectories: A review. Bell. Eng. Geol. Environ. 2015, 74, 1163–1176. [Google Scholar] [CrossRef]
  22. Wang, G. Discussion on Designing and Reinforcing of High Man-Made Slopes. J. Gansu Sci. 2003, S1, 5–9. [Google Scholar]
  23. Chen, R.; Kang, E.; Wu, L.; Yang, J.; Ji, X.; Zhang, Z. Cold Regions in China. J. Glaciol. Geocryol. 2005, 4, 469–475. [Google Scholar] [CrossRef]
  24. Zhao, H.; Zhao, X.; Zhang, T.; Zhang, X.; Li, Y.; Liu, L. Desertification Process and Its Spatial Differentiation in Arid Areas of Northwest China. J. Desert Res. 2011, 1, 1–8. [Google Scholar]
  25. Gu, D. Rock Mass Structure. In Basis of Rock Engineering and Geomechanics; Zhou, W.F., Ed.; Science Press: Beijing, China, 1979; pp. 204–207. [Google Scholar]
  26. Barton, N.; Choubey, V. The shear strength of rock joints in theory and practice. Rock Mech. Rock Eng. 1977, 10, 1–54. [Google Scholar] [CrossRef]
  27. Zhou, X.Q.; Xu, W.Y.; Niu, X.Q.; Cui, Y.Z. A review of distinct element method researching progress and application. Rock Soil Mech. 2007, 28, 408–416. [Google Scholar]
  28. Pappalardo, G. Correlation between P-Wave Velocity and Physical–Mechanical Properties of Intensely Jointed Dolostones, Peloritani Mounts, NE Sicily. Rock Mech. Rock Eng. 2015, 48, 1711–1721. [Google Scholar] [CrossRef]
  29. Lang, Q.L. Prediction Research of Collapse and Landslide Caused by Volcanic Eruption in Changbai Mountains. Ph.D. Thesis, Jilin University, Changchun, China, 2014; p. 68. [Google Scholar]
  30. Palmstrom, A. Measurements of and correlations between block size and rock quality designation (RQD). Tunn. Undergr. Space Technol. 2005, 20, 362–377. [Google Scholar] [CrossRef]
  31. Okura, Y.; Kitahara, H.; Sammori, T.; Kawanami, A. The effects of rockfall volume on runout distance. Eng. Geol. 2000, 58, 109–124. [Google Scholar] [CrossRef]
  32. Vijayakumar, S.; Yacoub, T.; Curran, J.H. On the Effect of Rock Size and Shape in Rockfall Analyses. 1996. Available online: https://www.rocscience.com/documents/pdfs/library/Effect-of-Rock-Size-on-Rocfall-Analysis.pdf (accessed on 9 March 2017).
  33. Evans, S.G.; Hungr, O. The assessment of rockfall hazard at the base of talus slopes. Can. Geotech. J. 1993, 30, 620–636. [Google Scholar] [CrossRef]
  34. Azzoni, A.; Barbera, G.L.; Zaninetti, A. Analysis and Prediction of Rockfalls Using a Mathematical Model. Int. J. Rock Mech. Min. Sci. Geomech. Abstr. 1995, 32, 709–724. [Google Scholar] [CrossRef]
  35. Dorren, L.K.A.; Berger, F.; Putters, U.S. Real-size Experiments and 3-D Simulation of Rockfall on Forested and non-forested Slopes. Nat. Hazards Earth Syst. Sci. 2006, 6, 145–153. [Google Scholar] [CrossRef]
  36. Asteriou, P.; Saroglou, H.; Tsiambaos, G. Geotechnical and kinematic parameters affecting the coefficients of restitution for rock fall analysis. Int. J. Rock Mech. Min. 2012, 54, 103–113. [Google Scholar] [CrossRef]
  37. Giacomini, A.; Buzzi, O.; Renard, B.; Giani, G.P. Experimental studies on fragmentation of rock falls on impact with rock surfaces. Int. J. Rock Mech. Min. 2009, 46, 708–715. [Google Scholar] [CrossRef]
  38. Budetta, P.; Santo, A. Morphostructural evolution and related kinematics of rockfalls in Campania (southern Italy): A case study. Eng. Geol. 1994, 36, 197–210. [Google Scholar] [CrossRef]
  39. Kobayashi, Y.; Harp, E.L.; Kagawa, T. Simulation of rockfalls triggered by earthquakes. Rock Mech. Rock Eng. 1990, 23, 1–20. [Google Scholar] [CrossRef]
  40. Chau, K.T.; Wong, R.H.C.; Wu, J.J. Coefficient of restitution and rotational motions of rockfall impacts. Int. J. Rock Mech. Min. 2002, 39, 69–77. [Google Scholar] [CrossRef]
  41. Youssef, A.M.; Pradhan, B.; Al-Kathery, M.; Bathrellos, G.D.; Skilodimou, H.D. Assessment of rockfall hazard at Al-Noor Mountain, Makkah city (Saudi Arabia) using spatio-temporal remote sensing data and field investigation. J. Afr. Earth Sci. 2015, 101, 309–321. [Google Scholar] [CrossRef]
  42. Liu, H.M. Research on the Motion Trajectory of Rockfall in Tianchi Lake Area of Changbai Mountain Longmen Peak. Master’s Thesis, Jilin University, Changchun, China, 2012; p. 83. [Google Scholar]
  43. Schweigl, J.; Ferretti, C.; NÖssing, L. Geotechnical characterization and rockfall simulation of a slope: A practical case study from South Tyrol (Italy). Eng. Geol. 2003, 67, 281–296. [Google Scholar] [CrossRef]
  44. Corominas, J.; Copons, R.; Moya, J.; Vilaplana, J.M.; Altimir, J.; Amigó, J. Quantitative assessment of the residual risk in a rockfall protected area. Landslides 2005, 2, 343–357. [Google Scholar] [CrossRef]
  45. Topal, T.; Akin, M.; Ozden, U.A. Assessment of rockfall hazard around Afyon Castle, Turkey. Environ. Geol. 2007, 53, 191–200. [Google Scholar] [CrossRef]
  46. Volkwein, A.; Schellenberg, K.; Labiouse, V.; Agliardi, F. Rockfall characterization and structural protection—A review. Nat. Hazards Earth Syst. Sci. 2011, 11, 2617–2651. [Google Scholar] [CrossRef] [Green Version]
  47. Perret, S.; Dolf, F.; Kienholz, H. Rockfalls into forests: Analysis and simulation of rockfall trajectories—Considerations with respect to mountainous forests in Switzerland. Landslides 2004, 1, 123–130. [Google Scholar] [CrossRef]
  48. Wang, X.L.; Zhang, L.Q.; Wang, S.J.; Agliardi, F.; Frattini, P.; Crosta, G.B.; Yang, Z.F. Field investigation and rockfall hazard zonation at the Shijing Mountains Sutra caves cultural heritage (China). Environ. Earth Sci. 2012, 66, 1897–1908. [Google Scholar] [CrossRef]
Figure 1. Location of the study area and geological map (modified after the Institute of Geology Beijing, 1993).
Sustainability 09 00414 g001
Figure 2. Investigation results of the study area: (a) the distribution of geological hazards; (b) an example of rockfall.
Sustainability 09 00414 g002
Figure 3. Statistical results of 54 unstable slopes: (a) lithology; (b) rock mass structure; (c) slope structure; (d) failure mode.
Sustainability 09 00414 g003
Figure 4. Discontinuity spacing histogram and best fitting exponential distribution excluding bedding planes.
Sustainability 09 00414 g004
Figure 5. Contour plot and great circles of the discontinuities surveyed in the study area.
Sustainability 09 00414 g005
Figure 6. Displacement vectors and potential rockfall initial positions (AE) for the five slope profiles.
Sustainability 09 00414 g006
Figure 7. Slope profiles for rockfall simulation and stability analysis for the unstable blocks on five high slopes.
Sustainability 09 00414 g007
Figure 8. Statistical results of block size ranges of five unstable slopes.
Sustainability 09 00414 g008
Figure 9. Rockfall simulations results for W01 slope: (a) rockfall trajectory; (b) bounce height; (c) translational velocity; (d) total kinetic energy.
Sustainability 09 00414 g009aSustainability 09 00414 g009b
Figure 10. Reach rate and accumulation rate histogram for W01 slope. RR, Reach Rate; AR, Accumulation Rate.
Sustainability 09 00414 g010
Figure 11. Zonation map based on the computed total kinetic energy and accumulation rate.
Sustainability 09 00414 g011
Table 1. Five unstable slopes selected to assess rockfall hazard in the study area.
No.Corresponding MileageAltitude (m)LithologyRock Mass StructureSlope StructureFailure ModeVolume
(m3)
W01K43 + 120 ~ K43 + 220 m2157GraniteMosaicInsequentToppling31,758
W02K43 + 600 ~ K43 + 672 m2158AndesiteMosaicDipSliding23,520
W03K43 + 900 ~ K43 + 980 m2138AndesiteMosaicDipWedge43,000
W04K44 + 520 ~ K44 + 640 m2095DaciteMosaicDipWedge13,772
W05K50 + 152 ~ K50 + 366 m1914SilicoliteMosaicInsequentToppling43,125
Table 2. Numbers and parameters of the discontinuity sets in five unstable slopes.
No.Set NumberAverage AttitudePersistence (m)Spacing
(m)
JRCTypeWeathering
W01J1115°/86°15–200.4–1.313UnloadingModerately
J223°/81°9–120.3–0.47TectonicSlightly
J340°/35°4–60.3–0.46TectonicModerately
W02J1120°/74°8–120.3–1.09UnloadingSlightly
J2297°/50°2–40.3–0.57TectonicModerately
W03J1164°/60°4–50.5–1.07TectonicModerately
J2260°/56°5–70.6–1.56TectonicSlightly
J343°/53°2–60.2–0.35TectonicModerately
W04J1175°/73°10–154.0–5.07UnloadingSlightly
J2295°/56°2–50.2–0.59TectonicModerately
J340°/43°4–60.2–0.56TectonicModerately
W05J1195°/80°15–255.0–8.015TectonicModerately
J2225°/58°5–80.4–0.88TectonicSlightly
J313°/47°4–60.2–0.57TectonicModerately
Table 3. Mechanical properties of rock and discontinuity used in Universal Distinct Element Code (UDEC) simulation.
PropertyW01W02W03W04W05
RockNumber of specimen55555
Lithology of specimenGraniteAndesiteAndesiteDaciteSilicolite
Density (g/cm3)2.852.652.652.632.75
Cohesion (MPa)2.51.91.91.61.9
Friction angle (°)4543434241
Elasticity modulus(GPa)252323209
Poisson’s ratio0.250.240.240.230.22
JointCohesion (MPa)0.480.230.230.150.43
Friction angle (°)3532323035
Normal stiffness (GPa/m)16.915.615.612.011.4
Tangential stiffness (GPa/m)7.56.36.35.04.4
Table 4. Representative values of rockfall mass used in the simulation of rockfall.
No.Size Range (m3)Density (g/cm3)Representative Values (kg)
M1M2M3M4M5M6
W010.005–0.1002.851050100150200300
W020.010–1.0002.6550100500100020002500
W030.005–0.5002.65105010050010001500
W040.050–1.0002.631005001000150020002500
W050.005–0.1002.751050100150200300
Table 5. Coefficients of restitution retrieved from the literature.
AuthorsMaterial TypeRtRn
Liu (2012)Hard surface paving0.87–0.920.37–0.42
Bedrock or boulders with little soil or vegetation0.83–0.870.33–0.37
Talus with little vegetation0.83–0.870.30–0.33
Talus with some vegetation0.80–0.830.30–0.33
Soft soil slope with little vegetation0.80–0.830.28–0.32
Vegetated soil slope0.78–0.820.28–0.32
Schweil et al. (2003)Asphalt0.90 ± 0.040.40 ± 0.04
Table 6. Parameters used for the rockfall simulation.
ParametersW01W02W03W04W05Asphalt
Number of rockfalls10001000100010001000
Coefficient of normal restitution0.37 ± 0.030.34 ± 0.030.34 ± 0.030.33 ± 0.030.37 ± 0.030.40 ± 0.04
Coefficient of tangential restitution0.87 ± 0.040.86 ± 0.040.86 ± 0.040.85 ± 0.040.87 ± 0.040.90 ± 0.04
Rotational friction angle (°)30 ± 230 ± 230 ± 230 ± 230 ± 230 ± 2
Surface roughness (°)222222
Initial velocity (m/s)000000
Table 7. Values for each parameter extracted from rockfall simulation for five unstable slopes.
No.HR (m)BM (kg)RD (m)L (m)BH (m)L (m)TV (m/s)L (m)TKE (kJ)RR (%)AR (%)
W0146.2–57.81044.2–133.044.913.7549.722.249.72.6299.2514.74
5044.2–136.544.912.8449.722.149.712.8498.9515.63
10044.2–130.844.913.9849.722.249.726.3097.7513.47
15044.2–133.444.917.2249.722.149.739.0598.9514.33
20044.2–131.244.912.8849.722.249.751.9199.0511.66
30044.2–132.744.913.6149.722.149.778.1397.8512.76
W0228.1–39.75026.1–46.626.410.4831.716.134.37.6585.9929.53
10026.1–46.526.49.6531.716.033.014.7988.6931.83
50026.1–48.126.49.9531.716.033.074.2289.2928.63
100026.1–47.126.410.2931.716.134.3156.3687.6927.53
200026.1–47.126.410.0731.716.133.0295.9187.7928.93
250026.1–46.826.410.0631.716.034.3383.7788.2930.13
W0342.2–53.81040.1–62.840.013.1342.426.042.43.5198.609.41
5040.1–61.940.012.9442.425.942.417.4398.2012.51
10040.1–63.340.012.9142.426.042.434.8898.3011.41
50040.1–63.340.012.8642.426.042.4175.4999.4010.91
100040.1–63.140.012.7642.425.942.4348.6198.909.31
150040.1–63.440.013.0242.425.942.4525.5299.2011.11
W0450.8–62.410048.6–64.649.418.8139.526.139.536.4799.909.41
50048.6–64.649.419.2739.526.339.5184.7299.6010.01
100048.6–64.649.419.9839.524.339.5323.2399.708.71
150048.6–64.649.419.2539.524.139.5478.4499.608.41
200048.6–64.649.418.3339.524.539.5659.1898.709.51
250048.6–64.649.418.0939.526.339.5920.7899.008.91
W057.2–18.81011.2–20.41.324.423.015.83.01.65100.098.60
5010.4–21.21.324.443.016.13.08.51100.096.00
10011.7–20.81.324.423.016.03.016.86100.093.49
15010.8–20.51.324.423.015.93.025.17100.097.70
20010.5–20.51.324.383.016.03.033.92100.096.20
30011.8–21.21.324.413.015.83.049.31100.097.00
Note: HR = Highway Range (m); BM = Block Mass (kg); RD = Runout Distance (m); L = Location (m); BH = Bounce Height (m); TV = Translational Velocity (m/s); TKE = Total Kinetic Energy (kJ); RR = Reach Rate (%); AR = Accumulation Rate (%).

