Article

Public Open Space Development for Elderly People by Using the DANP-V Model to Establish Continuous Improvement Strategies towards a Sustainable and Healthy Aging Society

1
Faculty of Humanities and Arts, Macau University of Science and Technology, Avenida Wai Long, Taipa 999078, Macau, China
2
Graduate Institute of Urban Planning, College of Public Affairs, National Taipei University, 151, University Rd., San Shia District, New Taipei City 23741, Taiwan
3
School of architecture and urban planning, Guangdong University of Technology, 100, West Ring Road, Panyu District, Guangzhou 510006, China
4
Zhongshan Institute, University of Electronic Science and Technology of China, 1, Xueyuan Road, Shiqi District, Zhongshan 528402, China
5
College of Creative Design, Asia University, 500, Lioufeng Rd., Wufeng, Taichung 41354, Taiwan
*
Author to whom correspondence should be addressed.
Sustainability 2017, 9(3), 420; https://doi.org/10.3390/su9030420
Submission received: 31 December 2016 / Revised: 25 February 2017 / Accepted: 7 March 2017 / Published: 11 March 2017

Abstract

:
With the global trend of population aging, how to integrate the health needs of elderly people into public open space (POS) development while taking into account public interest is a major challenge in the 21st century. Although the issues of elderly people’s health and their POS needs are receiving increasing attention, research on continuous improvement strategies for POS for healthy aging societies is still limited. Hence, this study explored continuous improvement strategies thoroughly and systematically by using the DANP-V model. The findings revealed cognitive differences between expert and elderly groups. Moreover, water features, waste management, and co-maintenance spaces were the three criteria with the largest gap value. POS improvement has previously been implemented based on a priority order ranked from the criterion with largest gap value to the criterion with the smallest one. However, an alternative approach based on the cause–effect relationship is proposed in this paper. The study findings have both theoretical and practical implications for POS planners and designers.

1. Introduction

Amidst increasing concern about urban populations’ health problems, researchers from a wide range of disciplines have turned their attention to the underlying cause–effect relationships between the urban built environment and public health [1,2,3,4,5]. With the global growth of elderly populations, emphasizing the increasing needs of older people in considerations of the public interest presents a novel challenge for the development of public open spaces in the 21st century [6]. Determining the exact meaning of POS has not been a straightforward process, and many scholars have presented a variety of restricted or distinct definitions. Most debate has focused on the following areas: the phrasing “land that has been developed for purposes other than building construction” is too general [7]; areas meant for vehicle usage (roads or parking) cannot be incorporated into POS, but it is less clear whether some roads (bicycle path, road verges, and pavements) that are not meant for motor vehicles should be defined as POS; whether green spaces within urban areas or those on the edges of urban areas should be included in POS; and whether the ownership of POS should be included in these considerations. In this study, POS is defined as “space within the urban environment which is readily accessible to the community regardless of its size, design or physical features and which is intended for, primarily, amenity or physical recreation, whether active or passive” [7,8]. According to the World Health Organization (WHO) [9], whether longevity benefits or burdens a society depends largely on the health of the elderly population. Moreover, “Healthy Ageing” was proposed as a policy objective by the WHO [10]. One of the sub-goals in the Global Strategy and Action Plan on Ageing and Health is “providing safe, inclusive, and accessible public spaces for elderly persons” [10].
Continuous improvement is necessary to reduce the inadaptability of existing POS [8,11,12]. The main reasons include: (1) the limited availability of urban planning resources [13]; (2) changes in the characteristics of different generations of elderly people [8]; and (3) the acceptable range of surrounding change under the elderly’s sense of control [14,15]. Until recently, most studies on the health of elderly people and POS have focused on the following themes: (1) providing credible evidence of the relationship between the health of elderly people and the outdoor environment [16,17]; (2) identifying the causal mechanisms underlying the aforementioned relationship [18,19,20,21]; and (3) identifying the attributes of POS [13,22,23] that are likely to determine elderly people’s behavior and thereby affect their health (such as deciding between whether to exercise outdoors or meet friends). However, it is unclear which environmental factors are most significant and influential in determining the preferences of elderly people regarding POS; the development of continuous improvement strategies and the identification of improvement priorities that can enable healthy aging have yet to be explored.
Thus, this study explored systematic and continuous improvement strategies for POS that can realize the aspiration level of achieving a healthy aging society. First, a bridge linking POS and healthy aging—namely, sub-goals, causal mechanisms, behavior needs, and criteria (attributes/factors)—and the pretest of indicators were used to determine the key evaluation criteria [24] of POS. Second, the DANP-V model was used to evaluate contemporary POS. The DANP-V model is a hybrid technique that combines the three techniques. The DEMATEL technique was applied to obtain an influential network relationship map (INRM) for proposing some systematic thinking and the influential weights (IWs) of the evaluation criteria according to a process termed the DEMATEL-based analytic network process (ANP) or called “DANP” for realizing priority criteria. Thereafter, a modified VIKOR method was applied to evaluate a POS in the campus of the Harbin Institute of Technology (HIT) with two different groups (the experts and the elderly) for discovering problems, then the systematic and continuous improvement strategies was developed. This POS is frequently used by elderly people, is located in the inner city, and is representative of the increasing aging population in China; hence, it was selected as an empirical case.
The results indicate that the cognition of the experts and elderly participants was somewhat different. In addition, water features, waste management, and co-maintenance spaces were the three criteria with the greatest gap values. According to conventional wisdom, POS improvement should be implemented based on a priority order, starting with these three criteria with the greatest gaps. However, according to the DANP-V method, POS improvement for promoting a healthy aging society should be implemented from the perspective of the whole system, and implementation should start from the cause–effect root of these three criteria, rather than from these three criteria themselves. Therefore, high-quality vegetation should be the first priority for improvement in this study.
The rest of paper is organized as follows. In Section 2, previous studies (on POS, healthy aging, continuous improvement strategies, and three potential mechanisms) are reviewed to determine the evaluation attributes of POS, and the pretest of indicators, superiority of the DANP-V model, and research procedure are shown. Section 3 describes the empirical case selection and data collection, followed by a discussion. The final section focuses on the crucial findings and discusses future research directions.

2. Constructing Evaluation Attributes of POS and Research Procedure

This section is divided into six subsections. To construct the evaluation attributes of POSs, the first subsection involves exploring the new challenges of POSs in the context of the global population aging process; in the second subsection, the applicability and necessity of continuous improvement strategies for POSs are discussed with a view to facilitating sustainable healthy aging; in the third subsection, the approach to constructing environmental attributes is discussed in detail; then, the forth subsection describes a pretest of these attributes to assess the validity of the indicators. To explain the analysis method, the superiority of the DANP-V model for addressing specific issues and the whole research process are shown in the fifth and sixth subsection severally.

2.1. New POS and Healthy Aging

Several studies have identified a relationship between outdoor environments and the health status of populations [25]. This relationship is supported by changes in mortality, disease prevalence, physical function, and mental health status in different environments [26]. Moreover, the relationship between outdoor environment and people’s health is a recurring theme. According to Thompson’s review [5], many scholars studied the relationship between the outdoor environment and human health in the 18th century, when researchers tended to focus on the benefits obtained by social elites. By contrast, recent studies on these issues have been based on an interconnected perspective involving all levels of society [5]. The changing social and cultural attitudes toward the outdoor environment can be attributed to increased emphasis on its being public; in this study, POS was regarded as a kind of outdoor urban environments oriented toward the needs of the public.
The demographic aging trend has led to increasing demands for the needs of elderly people to be more fully integrated into society, presenting challenges for the development of POS in the 21st century [6]. According to the WHO [9], the proportion of the global population aged over 60 years will increase from 12% to 22% between 2015 and 2050. Longevity provides an opportunity to reassess the extent of the benefits of this demographic transition, which will be heavily dependent on one key factor, namely the health of the elderly population [9]. Thus, the WHO proposed the Healthy Ageing project, which focuses on the process of developing and maintaining functional ability. Functional abilities that enable well-being to be maintained in older age are determined by individual capacity, the environment (with the physical environment being a crucial component), and their interactions [9]. For example, the goals of Global Strategy and Action Plan on Ageing and Health [10] is based on the Sustainable Development Goals, one of which is to “make cities and human settlements inclusive, safe, resilient, and sustainable by providing universal access to safe, inclusive, and accessible green and public spaces, in particular for elderly persons.” The WHO [10] notes that POS are vital, even though they exert indirect effects on health. Therefore, to achieve healthy aging, developing some “new” POS based on existing open spaces for the elderly [6] is necessary.
The evaluation criteria used depend on the type of POS. According to purpose, it could be classified as open spaces meant for environmental conservation or open spaces meant for recreation, culture, and education. According to space form, it could be classified as the spaces to pass through or the spaces in its own right [11]. The former ones include some spaces such as bicycle paths, footpaths and pavements which are part of the urban fabric and attached to the motorway. The latter are the spaces with their own sense of identity, including some block spaces such as parks, plazas, campuses and also some linear features such as nature trails and cycle ways, which are physically separated from the motorway. To identify the criteria and evaluate the indicators, the types of POS must be clearly restricted. Thus, considering the goal of healthy aging, this study focused on POS that are of block type and intended for recreational purposes.

2.2. Continuous Improvement Strategies for POS for Healthy Aging

Establishing gradual and continuous improvement strategies has proven to be an effective and intensive approach for developing POS for elderly people in the context of different aging population characteristics and limited public health resources. Elderly people are undeniably more vulnerable because of their declining health and functional status, financial strain, and social isolation [25,27,28]. Environmental barriers may prevent them from participating in outdoor activities, and they may also experience negative feelings because of stress produced by the surrounding environment. So they often expect changes to result in unfavorable environments. However, When environmental change is beyond the adaptation level of elderly people, they may also feel uncomfortable or disturbed because of the loss of the sense of control [14,15]. Furthermore, with changes in their socioeconomic and cultural environments, their needs and expectations regarding outdoor spaces also change. Yung et al. [8] emphasized that the POS needs of elderly people in Hong Kong with a higher education level and higher income were different from those of elderly people from the last generation. Briefly, the continuous improvement of POS is superior to one-time improvement because of the characteristics of the elderly population.
From the perspective of available resources, all countries face major challenges when ensuring that their health and social systems are well prepared for the aging process—particularly low- and middle-income countries, which will account for 80% of the elderly population by 2050 according to the WHO [9]. For example, China, which has the highest proportion of elderly people because of its huge population base, is undergoing the demographic aging process before becoming rich; this trend will definitely affect aging-related policies and program implementation nationwide [29]. The reasonable arrangement of limited resources is vital to such countries. Furthermore, to improve POS by using limited resources, some scholars suggest that the needs and preferences of elderly people should be evaluated first, and the priority and effectiveness of environmental interventions should be then clarified [8,19]; this approach can improve the efficiency of resource input to achieve outcomes that meet aspirations. Moreover, the identification of effective approaches to POS planning and design enhances environmental equity, which is regarded as an essential factor in realizing an inclusive, healthy aging society [8,19,30].

2.3. Mechanisms and Environmental Attribute Construction

Effect mechanisms can explain the health benefits of the environment for the elderly population [25]. Therefore, using the mechanisms underlying the “health–environment” relationship is very effective for discovering the physical environmental attributes of POS that are suitable for healthy aging. According to the WHO, health is defined as a state of complete physical, psychological, and social health and not merely the absence of disease or infirmity. Based on this definition, three potential mechanisms have been mentioned frequently, namely outdoor physical activity, contact with nature, and social interaction [19,31]. This study used these three potential mechanisms to discover correlative environmental attributes of POS (Figure 1).
First, outdoor physical activity is considered to be a bridge linking the outdoor environment with elderly people’s health. According to Sugiyama and Thompson [19], physical activity is associated with various health benefits in elderly people, such as minimizing the physiological changes of aging; preventing common chronic diseases; improving functional capability; enhancing sleep quality; improving cognitive function; compensating for negative events; preventing depression. Moreover, the underlying causes of these benefits including enhanced muscle strength, aerobic capacity, balance, and flexibility; increasing cerebral blood flow; increasing exposure to naturalistic light; and increasing neurotransmitter levels (details showed in Figure 1). Overall, abundant evidence indicates that participation in regular physical activity has substantial benefits for elderly people’s physical health [32,33]. Thus, POS is necessary to enhance the mobility of elderly people and reduce the probability of falling (Figure 1). For the mobility dimension, six evaluation attributes have been identified from the POS design literature, as follows: legibility [8,34,35], interior to exterior connection [8,23,34], barrier-free sidewalks [13,25,35], route patterns [8,13,34], sufficient lighting [8,23,34], and traffic calming [9,22,34].
Second, the mechanism of contact with nature also plays a crucial role in linking health benefits with the outdoor environment, as demonstrated by adequate and strong evidence [5,36,37]. Maller et al. [38] observed that contact with nature promotes health and well-being, as indicated by positive effects on blood pressure, cholesterol, “outlook on life,” and stress reduction. De Vries [39] reported that the possible reasons for the positive effects include improvement in air quality, stimulation of physical activity, facilitation of social contacts, and restoration and reduction in stress. Among them, stress reduction provides the most plausible and comprehensive explanation [40]. Therefore, the health benefit of contact with nature is mainly related to psychosocial health, which is consistent with previous stress reduction theories such as Ulrich’s psycho-evolutionary theory and Kaplans’ attention restoration theory [5]. According to the aforementioned discussion, POS is assumed to improve elderly people’s health by providing natural elements with a pleasing appearance and organized surroundings for relaxation [8,22] (Figure 1). Therefore, an aesthetically pleasing appearance is a primary consideration in the dimension of contact with nature, which includes the crucial criteria of high-density vegetation [13,34,41], high-quality vegetation [11,23,34,42,43], water features [13,42,43], waste management [8,11,13,23,34,35,43], natural art design [22,34,44], and microclimate [11,23,42].
Third, social interaction is a significant mechanism underlying the relationship between environmental interventions with POS and elderly people’s social health; social interaction can reduce the risk of dementia and depressive symptoms and enhance the sense of value, purpose, identity, attachment, as well as the sense of safety from crime [19]. Aging is a process associated with gradually declining social roles and the increasing possibility of social isolation. Social isolation negatively affects health and increases the mortality rate [45]. POS can reduce social isolation and provide an appropriate place for social interaction in which environmental factors have a positive effect on informal social contact among neighbors [46] (Figure 1). This observation is also consistent with Greenbaum’s prediction that some informal social contacts (such as high-frequency visual contact, greeting) can help stronger social ties grow [47]. More importantly, numerous studies have indicated that some environmental attributes can promote these informal social behaviors. According to Zeisel and Griffin (1975), elderly people prefer to sit close to active places, such as sidewalks, to observe their environment. Thus, it is crucial to properly arrange seating with right-angled, appropriate canopies [11], and seats on pathways [13] for this purpose. The availability of accessible community resources also affects elderly people’s health [25]. Therefore, access to life facilities enables elderly people to combine walking with other daily social activities, which can intensify their visual contact and greeting frequency [22]. Moreover, Co-maintenance spaces such like communal gardens, as a type of therapeutic landscape, can offer a place for elderly people to share skills and even develop social networks [18]. Creating adequate intimate seating and multifunctional spaces [11] promotes their well-being and sense of control [48] by providing more forms of contact and opportunities for making decisions, as well as realizing personal responsibility based on stronger social ties. As mentioned in some POS studies [11,23], play areas for children can foster multigenerational interaction and enjoyment. Historical and cultural heritage, which can foster a sense of place and local identity for elderly people [49], should be integrated into POS designs [8]. Therefore, the criteria of this dimension are seats on pathways, access to life facilities, Co-maintenance spaces, intimate seating, multifunctional spaces, play areas for children, and historical and cultural heritage.
Notably, these three mechanisms also have interdependent relationships among each other. For example, Booth et al. [20] attempted to identify the social cognitive and perceived environmental influences—particularly social support, facility access, and neighborhood safety—that are associated with physical activity in elderly adults. Shared movement can also produce supportive social spaces [50]. Perceived green spaces has a moderating role in the relationship between the availability of green space types and social contacts among aging neighbors [41], particularly in inner-city POS [46].
Finally, based on the literature on the evaluation indicators for the pretest mentioned above, the results can be summarized as in Table 1.

2.4. Pretest of Indictors

A semi-structured questionnaire was used to conduct the pretest of indicators and included two parts. The first part examined the importance of indictors by using a five-point Likert scale representing the importance of each criterion, with 1 representing “not important”; 2 “not important”; 3 “normal”; 4 “important”; and 5 “very important”. The scale verified the importance of each criterion, which was drawn from a literature review conducted by experts. Using the open interview technique, the second part attempted to improve the criteria and their definitions with the help of experts’ experience.
The operation of the pretest of indictors can also be divided into two parts. The first part investigated the importance of each criterion according to expert opinion and observed the extent of importance based on the average index. Because 4 represents importance on the Likert scale, this study utilized 4 as the threshold value to measure each criterion. Criterion values over 4 could be regarded as important. Criterion values below 3 implied that the criterion was less important and was eliminated. For criterion values between 3 and 4, a second round of expert investigation and interviews was required to confirm the importance of the criterion and the reasons for the outcome; this process was repeated until all indicators had been confirmed. The second part includes the dimension and criterion sections. The experts could suggest different dimensions and criteria based on judgments derived from comprehensive considerations, which were influenced by the research target and objective of each criterion. Finally, it was necessary to clarify the criteria based on suggestions for each criterion to ensure the validity of the research framework.
This study evaluated the indicators of POS for the elderly based on the literature review. In this study, 53 questionnaires were distributed to 53 professional landscape planners and designers through the Internet. The first round of investigation revealed that four questionnaires were invalid because of missing values, whereas the remaining questionnaires were valid. Most indicators had values over 4, implying their importance. However, five indicators had values between 3 and 4, namely microclimate, play areas for children, traffic calming, legibility, and historical and cultural heritage. Thus, the second round of the survey regarding the five indicators (with values between 3 and 4) was performed. The second round of the questionnaire focused on the opinions of 49 experts, who had replied in the first round. The discussions of whether these factors with lower scores are retained or deleted are as follows.
For legibility (3.67) indicator, the experts considered that the elderly population always used POS within a certain distance (approximately 400 m or 10 min) because of their walking limitations [23,35]; POSs used by the elderly for daily activities should typically be located not far from residential areas. Hence, orientation boards and information panels are less important to elderly people who use a POS daily. However, some experts have argued that these boards and panels should be retained, because the convenience and safety of an inclusive environment design should not depend upon abstract understanding of the environment. For the historical and cultural heritage (3.57) indicator, the experts believed that this indicator has potential indirect contributions to health; some studies have shown that elderly people are enthusiastic about historical and cultural elements, which can provide an opportunity for them to reminisce, enhancing perceived interest, attractiveness, and sense of local identity [49,51]. For the microclimate (3.46) indicator, experts stated the natural enjoyment dimension generally corresponded with the demand of viewing and relaxing, mostly focused on relaxing, and overlapped with the criterion of comfortable seating with suitable orientations on pathways. Thus, the criterion of microclimate was eliminated. For the traffic calming (3.26) indicator, the experts suggested that the traffic calming (3.26) indicator is more suitable for evaluating POS with space forms of passing though rather than that with block forms, based on the classification of POS in this study. Therefore, the criterion of traffic calming was removed. The criterion of play areas for children (3.16) was also eliminated because experts believed that the target of this study is elderly people (over the age of 65 years), who regularly use the POS for leisure or entertainment purposes and seldom looked after children. They also suspected that the case from which these criteria were derived was excessively particular and thus the criteria were not universally applicable.

2.5. Evaluation Methods for POS

In previous POS studies, some scholars have been more concerned with the establishment of guidelines for universal accessibility and precautionary installations and less focused on the comprehensive evaluation of environment with the aim of health. Although some POS designs conformed to the guidelines and standards of preventive facilities, these universal indicators cannot fully meet the needs of users [8], because of their multiple health needs. Thus, it is necessary to design the POS indicators according to various requirements. Some scholars have also used qualitative and quantitative analysis methods to examine users’ experience and satisfaction with POS. The behavioral observation method can be used to analyze which physical elements of design attract or deter use [52], as demonstrated in the I’DGO study on design findings and recommendations for POS [34]. The operational process is easy to understand, and the means of data collection is more acceptable to respondents than other methods because it involves fewer disturbances. However, this method is difficult to implement because of the considerable length of time required. For instance, OPEN space researchers conducted a total of 4643 behavioral observations across nine sites for a study on pedestrian-friendly neighborhoods [53]. Focus group analysis, which is a rapid and convenient approach to generating data, have both been used to assess elderly people’s POS needs and to examine public understanding of a favorable POS from the perspective of cognitive and perceived environments [8,22]. However, this qualitative method functions within a given cultural context. Therefore, it is often difficult to obtain samples that represent the target population [54]. Personal projects analysis (PPA), logistic regression, and conjoint analysis are the main quantitative analysis methods. PPA analysis has the advantage that it can measure the degree of environmental supportiveness based on a set of personally salient activities (e.g., according to the needs and desires of the elderly population). Nevertheless, this method can only address activities that people either perform or plan to perform, and it cannot elicit activities that people have decided not to perform [19]. Logistic regression has the advantage of solving the category attribute data [12,31], whereas conjoint analysis is helpful for understanding the relative importance of factors [13,49]. However, this statistical analysis method is based on the assumption that the factors are independent. However, in reality, a certain degree of correlation always exists among different factors, and even a certain degree of conflict exists among multiple attributes. Therefore, using the DANP-V model as a realistic analysis method is crucial.
The multiple-criteria decision-making (MCDM) method is concerned with structuring, solving decisions, and planning problems that involve multiple conflicting criteria. Moreover, the DANP-V model is a hybrid technique in the MCDM method and has four characteristics [55,56,57]: (1) releasing the hypothesis of independence criterion, based on the correlation of criteria [58]; (2) enabling the criteria to run program selection in the case of conflicting attributes [59]; (3) using the aspiration level as a benchmark to avoid “picking the best apple from a barrel of rotten apples” and replace the past evaluation method based on the relative standard in criteria [60]; (4) proposing an improvement strategy fundamentally and systematically [61]. Specifically, no study has used the MCDM method to assess the improvement priorities of POS with respect to healthy aging. Therefore, this study used the DANP-V model to evaluate the existing POS and develop gradual and efficient improvement strategies towards achieving the healthy aging goals.

2.6. Research Procedures

The DANP-V model is a hybrid technique in MCDM. Based on the aforementioned studies, the DANP-V model is a combination of three techniques, namely the DEMATEL technique, DANP technique, and modified VIKOR method [62]. In this study, the model was divided into three phases, as shown in Figure 2 (details are provided in “Research steps” in the Appendix). In the first phase (DEMATEL-based ANP), the INRM (influential network relationship map) of the dimensions and criteria was developed [63]. In the second phase, the DANP technique was used to train the relation matrix of total influence from the first phase into Influential Weights (IWs, also called “global weights”) of the criteria (vector w g ) by using the basic concept of the operation process of ANP and then to calculate the local weights of each criterion (vector w C l ) and dimensions (vector w D l ) [62,64]. The result is termed IWs. In the third phase, the modified VIKOR method was used to identify the problematic criteria in this project, with a larger gap value of the criterion representing a more significant drawback [65,66,67]. Finally, this study used the INRM to discover the factors affecting the problematic criteria and propose some systematic strategies for avoiding the “stopgap piecemeal” problem.
The main purpose of the first phase is to help decision makers understand the mutual influence among the factors in the POS design. Therefore, the questionnaire was used to understand the degree of influence of criteria from the pairwise comparison by experts and was integrated into the initial matrix; subsequently, the DEMATEL technique was used to calculate the relation matrix of the total influence of dimensions (TD) and criteria (TC) and to develop the INRM of the criteria and dimensions. Finally, by overlapping the INRM of criteria and dimensions, the whole INRM can be obtained. The second phase aims to distinguish the priority order based on the influence degree. Therefore, the IWs can be obtained by limiting the weighted matrix W , which was weighted by normalizing the relation matrix of the total influence of dimensions ( T D α ), and the unweighted supermatrix W α , which was developed from the relation matrix of total influence of criterion (TC). The third phase aims to establish an improvement strategy based on the fundamental approach of gap values for continuous improvement and sustainable development. Thus, the process uses the modified VIKOR method to evaluate and identify the gaps of criteria, and INRM is then used to discover the root of the problem systematically. Finally, strategies for continuous improvement and sustainable development can be recommended towards achieving the requisite aspiration level.

3. Empirical Case

This section describes empirical case selection, data collection, and the analytical procedure in detail. Moreover, based on the INRM and the performance evaluation result, the priority of improvement and comprehensive analysis are primarily discussed.

3.1. Empirical Case Description

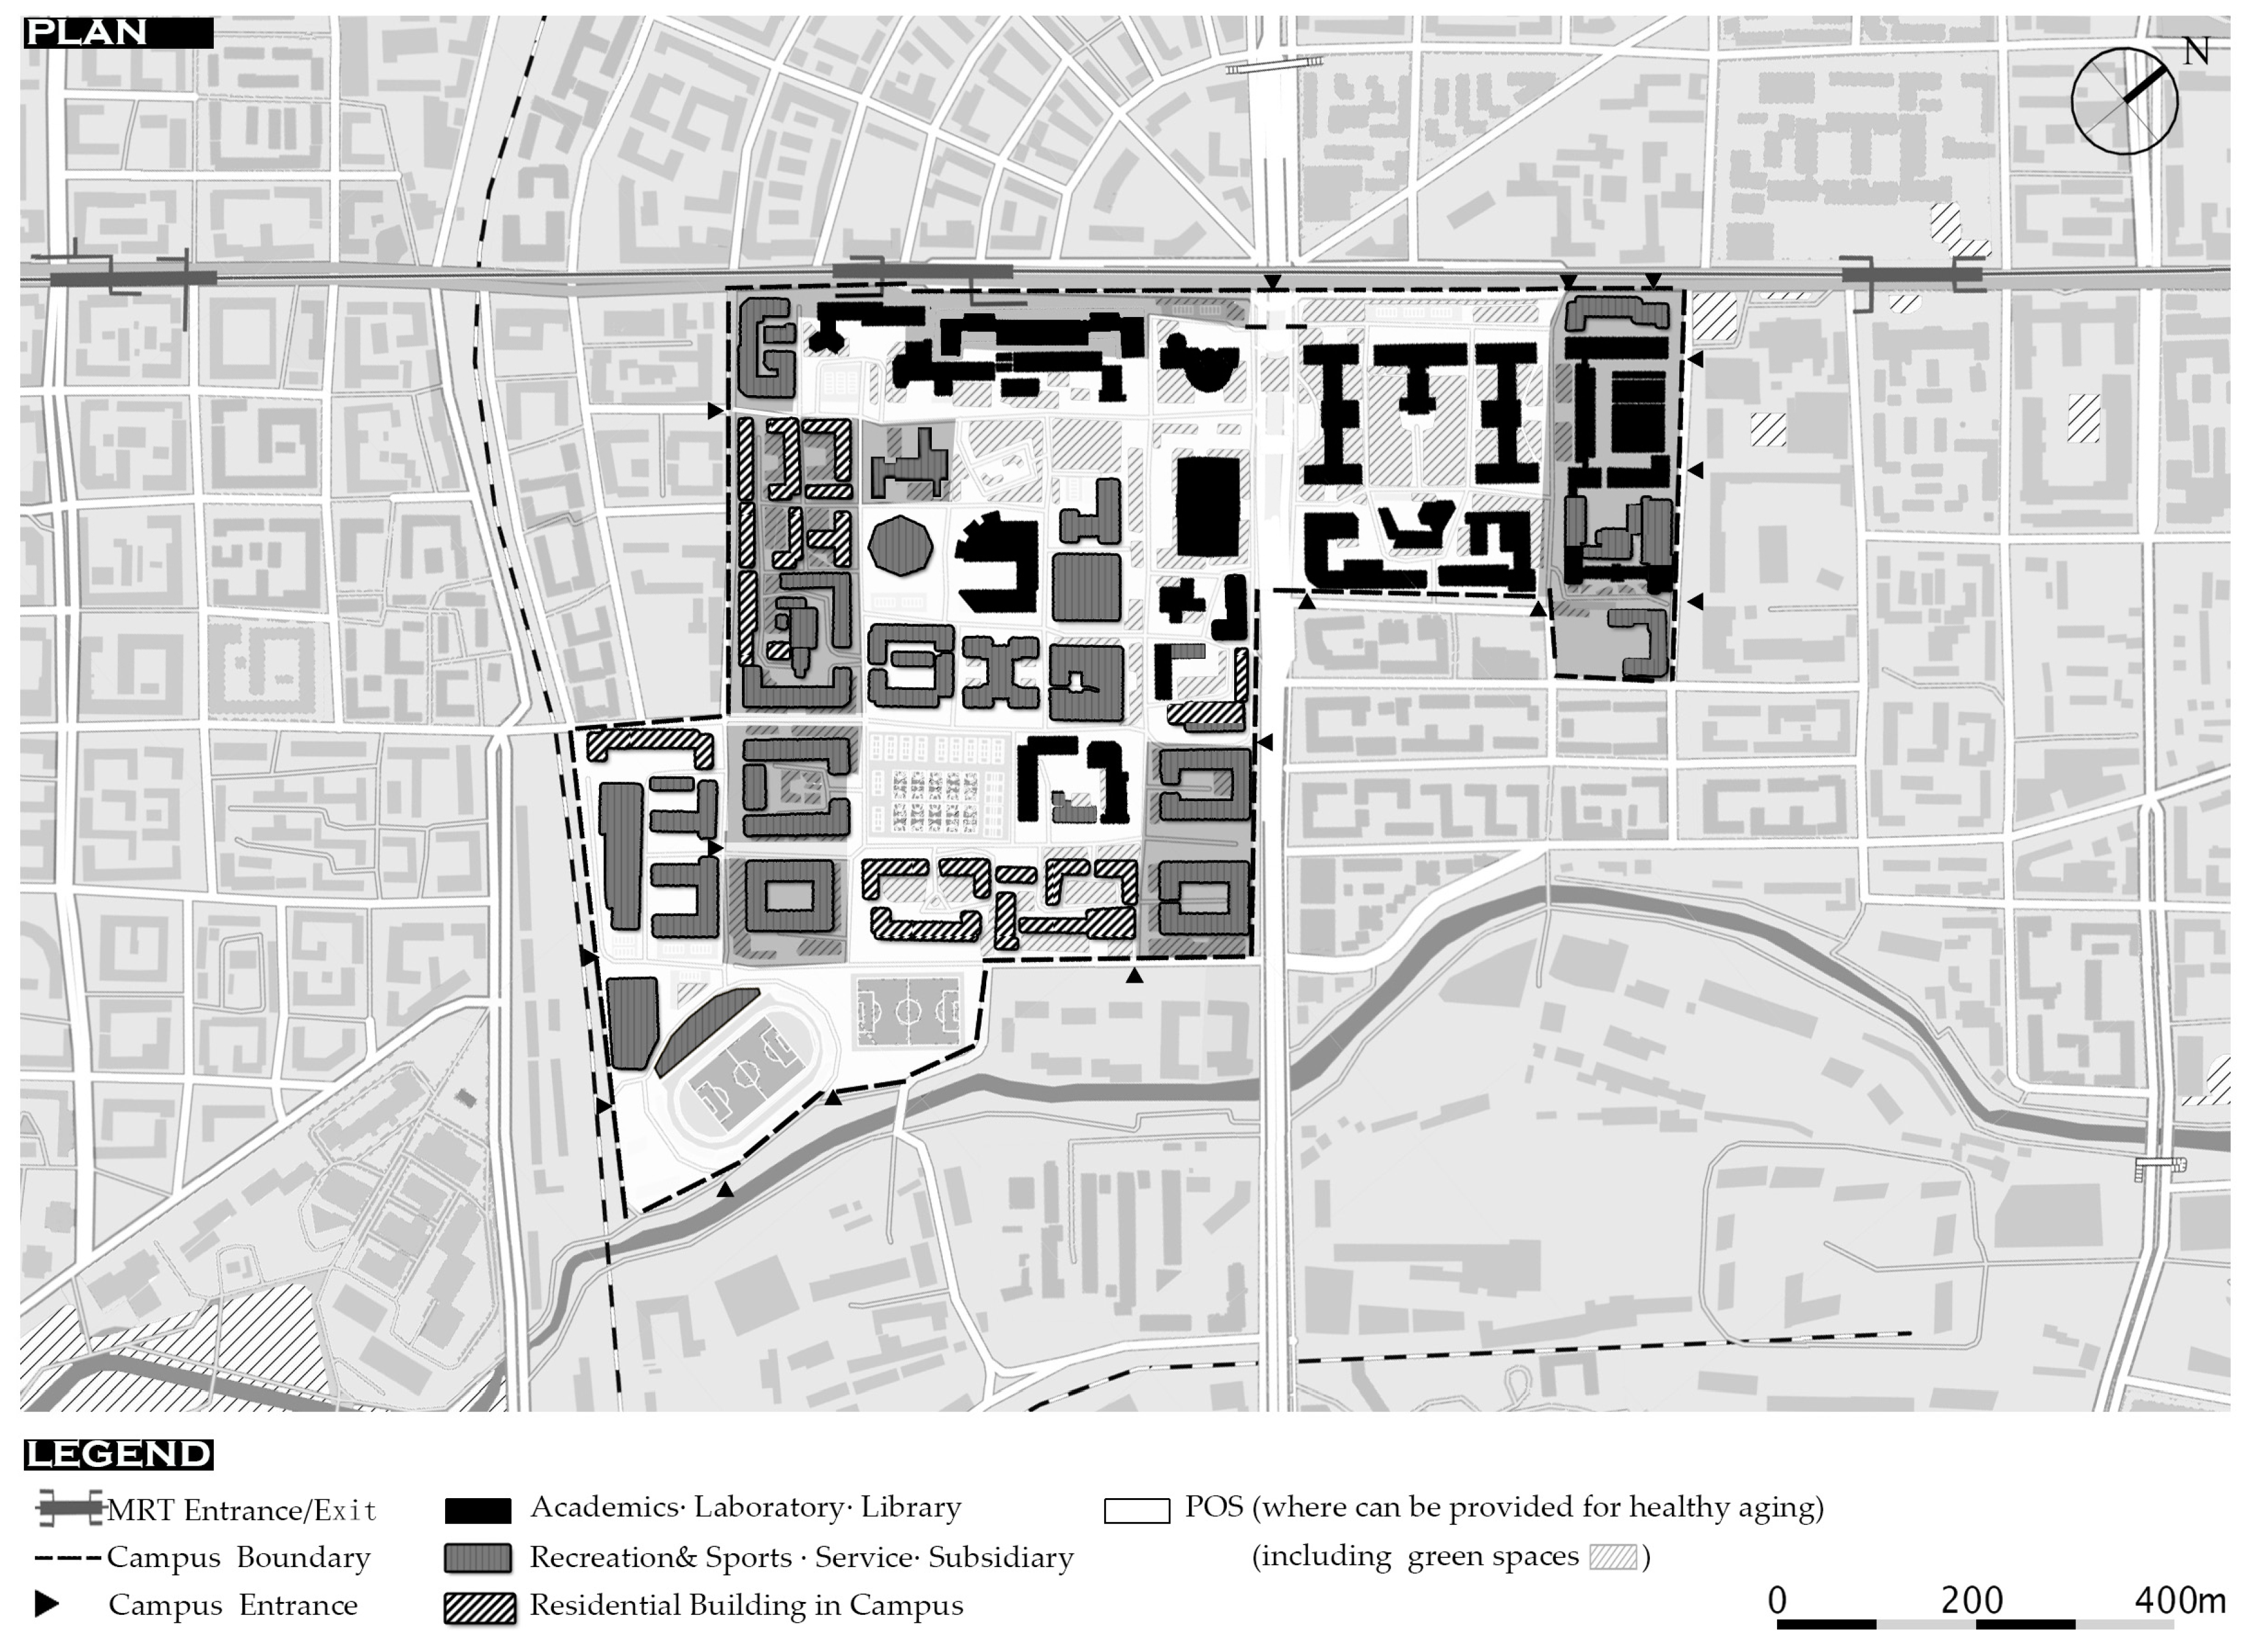
The case selected for this study is an open space in the main campus of the Harbin Institute of Technology (HIT) (Figure 3). The campus is located in the city center with a total area of approximately 66.8 ha, a building area of 1,270,000 square meters, and a floor area ratio of nearly 1.3. According to historical records, several functional areas, such as student and teacher living areas, teaching areas, sports zones, and logistics areas, have been gradually built in the main campus of HIT for different purposes and ages, without following the holistic principles of campus planning. Moreover, no clear boundary restricts access to the main campus, and an urban arterial road has even been constructed across the POS (public open space). This POS serves an educational function, is part of the urban POS system, and is open for public usage because of the POS insufficiency in Harbin city center. The reasons for selecting the open space in the main campus of HIT as a case study are as follows:
First, Harbin city is facing a serious trend of population aging. It is predicted that the population aged over 60 years will increase from approximately 1,840,000 (19.2% of the total population) to approximately 2,150,000 (approximately 22% of the total population) from 2015 to 2020. The aging society, the “empty nest” phenomenon, shrinking family sizes, and increasingly elderly households have become more prominent; moreover, the total elderly population has a certain proportion with low income levels. Thus, developing a sustainable society for the elderly population is necessary.
Second, the study site is located in the inner city, which has a high proportion of elderly people as residents, as was confirmed by the data collected from several street organizations located close to the POS (collection date, 29 August 2016). Some communities have a high proportion of elderly residents. For example, elderly people numbering 1743 comprise approximately 24.5% of the Fuhua community, 1483 of the HIT community (30.9%), 1091 of the Guixin community (14.2%), 1397 of the Chunming community (18.7%), 1488 of the Nonghang community (23.6%), and 1009 of the Tiewa community (13.3%). According to the statistical information from the questionnaire, elderly people who participate in outdoor activities in the POS at HIT are mainly from these nearby communities.
Third, the government and HIT implemented a joint program to gradually improve the environment (i.e., POS) for elderly people. With the development of the concept of urban sustainability concept and because of new environmental demands resulting from the changing population structure—such as the built urban environment being unable to meet the comprehensive needs of the elderly population—the local government has implemented an urban redevelopment process to improve the physical environment for the elderly population. The interim assessment report of the 12th Five-Year Plan for the elderly population revealed that Nangang district lacks open spaces and infrastructure facilities compared with other districts in Harbin city [68]. This POS insufficiency is attributed to the high building density and the lack of storage land. Therefore, the 13th Five-Year Plan [69] addresses the issues of the elderly population through an urban development strategy and accelerates the development of a liveable environment system and activity places for the elderly. Thus, to improve the POS in Harbin city center, the local government assisted HIT in redeveloping the campus and open space for the elderly population. Sharing POS with the campus is an effective approach to enhancing utilization efficiency and maximizing joint use opportunities of compatible facilities and space. These redevelopment projects in HIT and the environmental reconstruction projects for an aging society promoted by local government in the city center have been implemented near simultaneously. After obtaining funding, the building schedule and other key projects have been established gradually for the redevelopment of the POS.
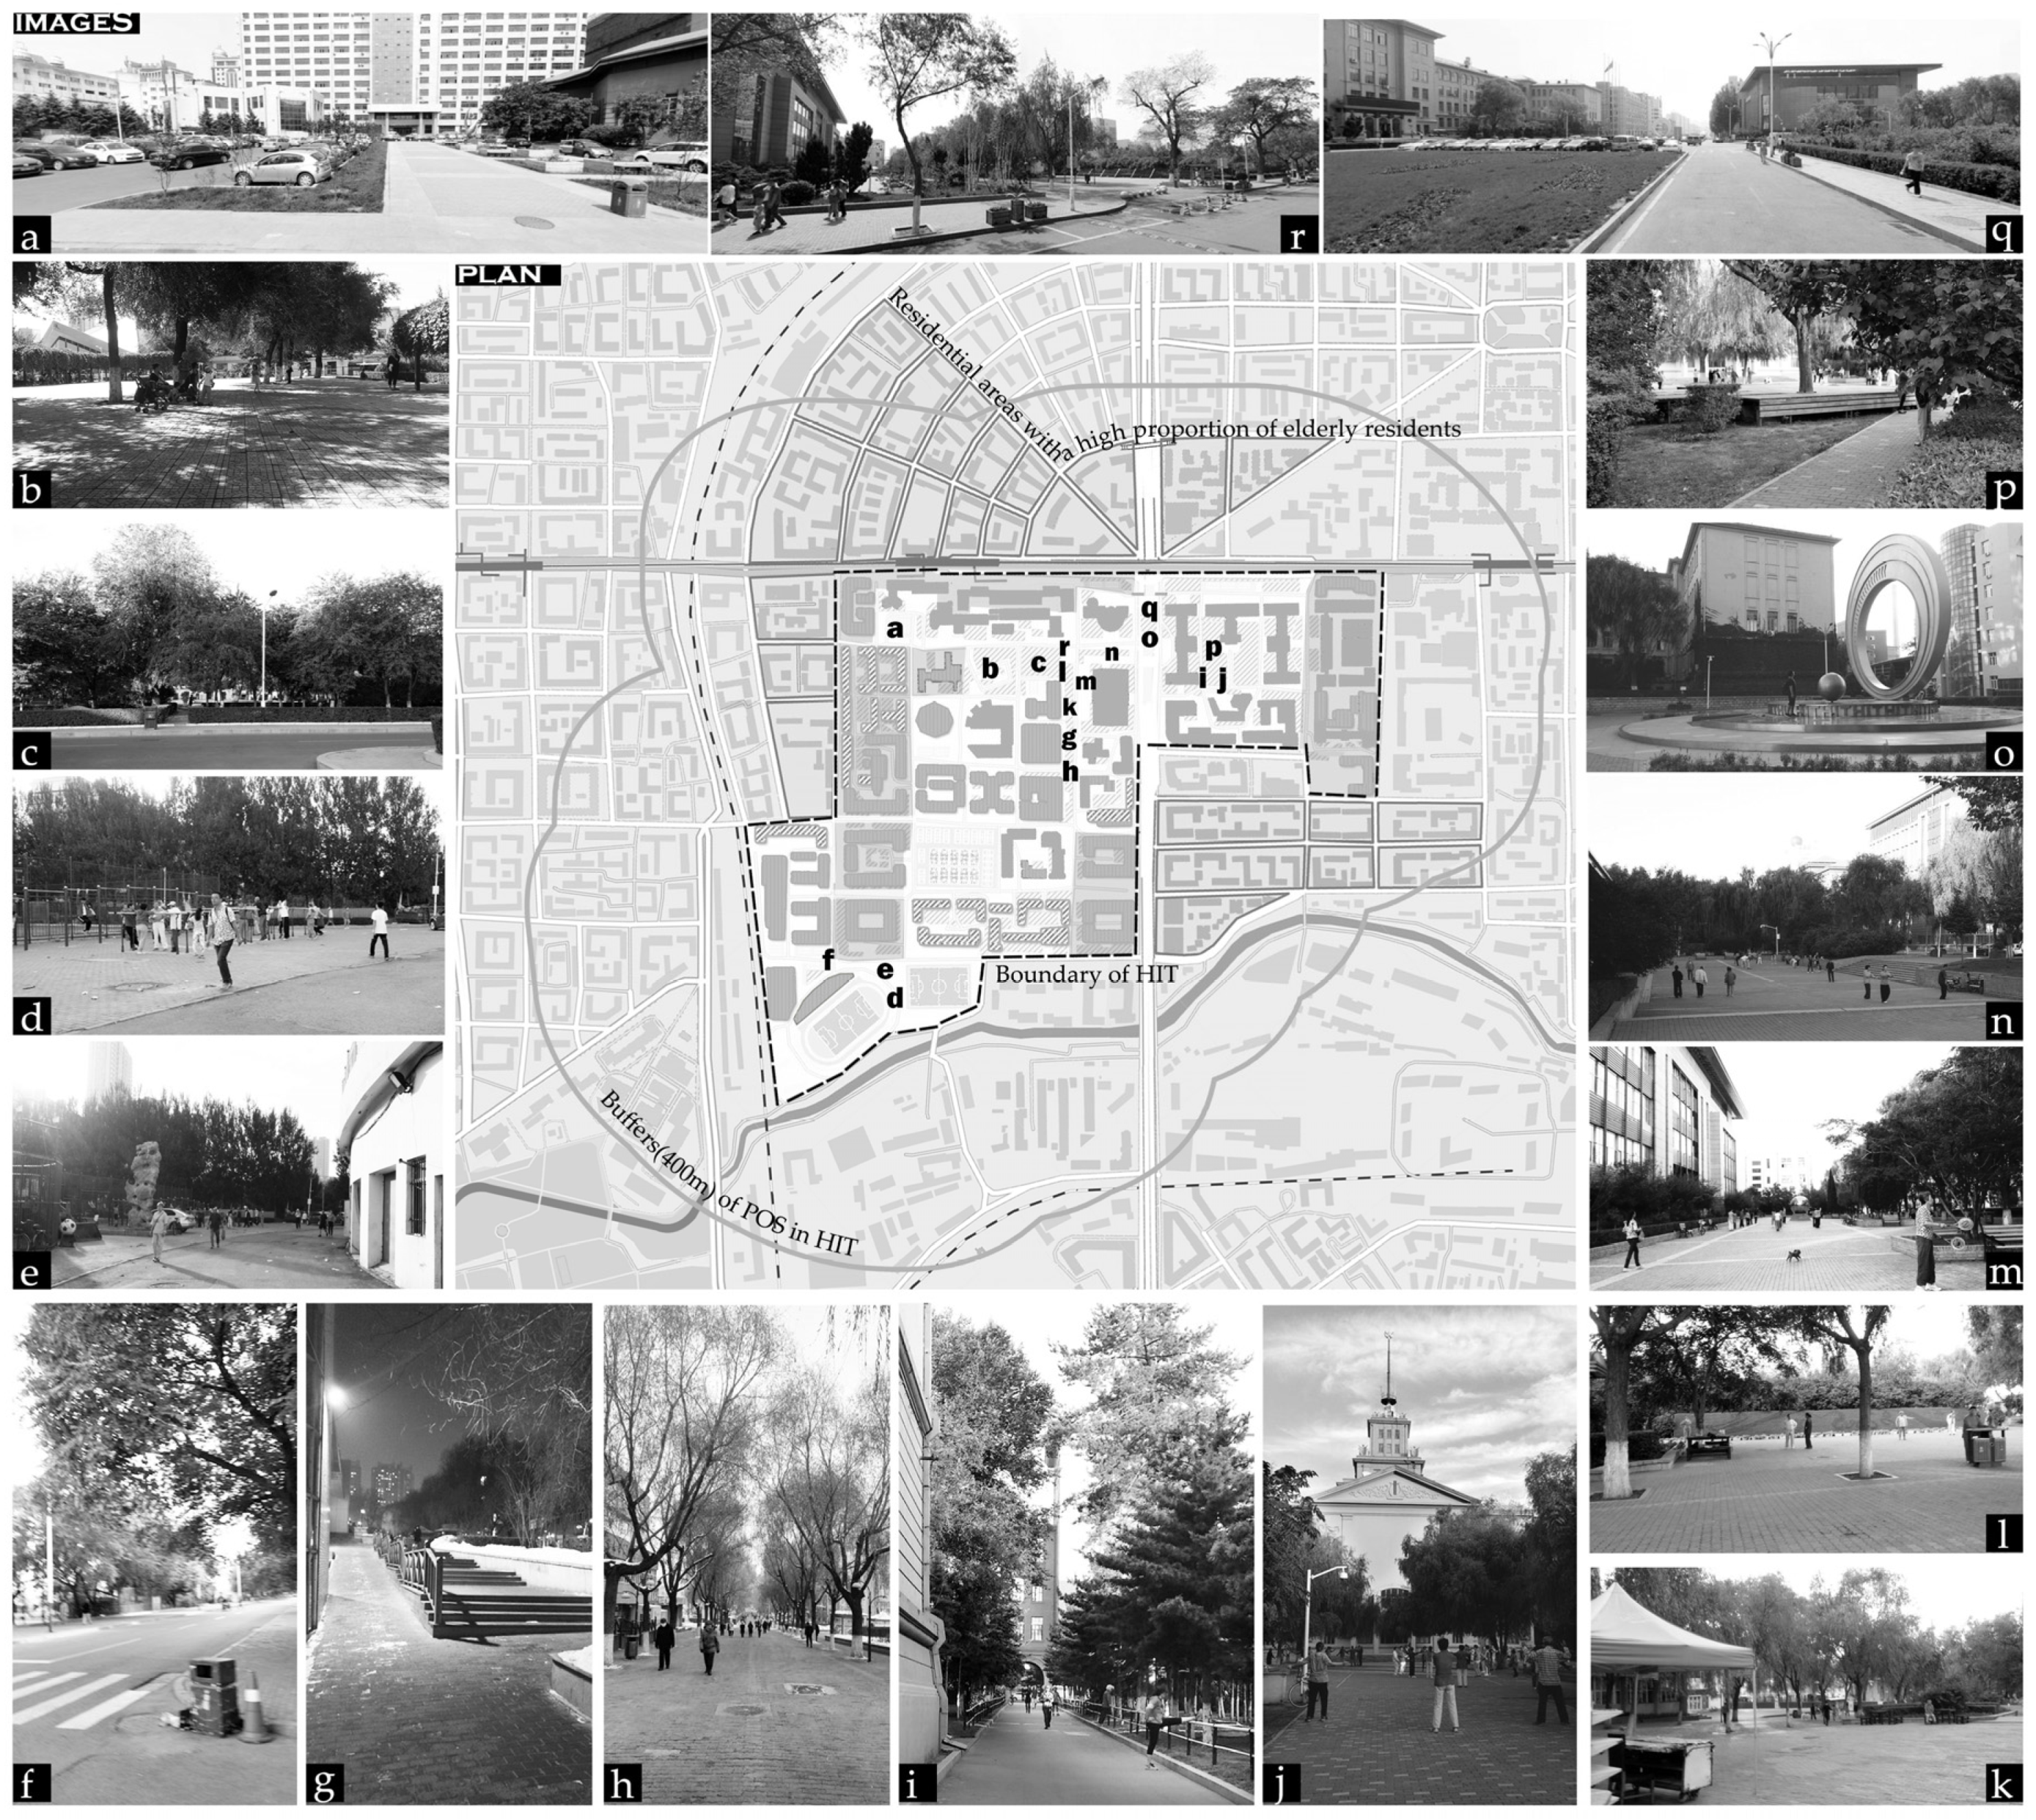
The current status of the redevelopment project in the campus is as follows. For the regional boundary, the construction of the front gate has been completed at the entrance to monitor external vehicles and individuals. No large area lawn exists due to the dual effects of restrictive land use and climate. Thus, for the purposed of greening, the larger green area includes three nearly 1-ha green spaces (Vineyard, Alumni Woods, and the backyard of the Hang Tian building; Figure 4b,c,j, respectively), and the remaining small green area consists of trees beside the street and flowerbeds in front of each college (Figure 4h,q, respectively). For the waterscape, the POS initially included an outdoor swimming pool and a fountain, but these features were abandoned because of the difficulty of restoration and maintenance (Figure 4a,b, respectively). The public facilities of HIT are a large supermarket, three small kiosks (Figure 4k), and toilets on the ground floor of various departments including the teaching building and the canteen. The POS has two historic buildings and two monuments or sculptures of cultural significance, including the “Star of HIT” (depicting the minor planet named after HIT; Figure 4o) and a globose sculpture relying on the technology of Seamless Welder (Figure 4m). Other types of construction, such as ramps, sidewalks, and building entrances, have currently achieved the minimum standards of the Codes of Accessibility Design (GB50763-2012; Figure 4g,h,k,l). In addition, the university and activity centers for elderly people have been designated for open use.
In conclusion, based on the rapid growth of the elderly population in Nangang district and Harbin city and the progressive urban redevelopment measures of the local government, the POS in HIT was selected as a highly appropriate empirical case to research continuous improvement strategies for a healthy aging society.

3.2. Data Collection

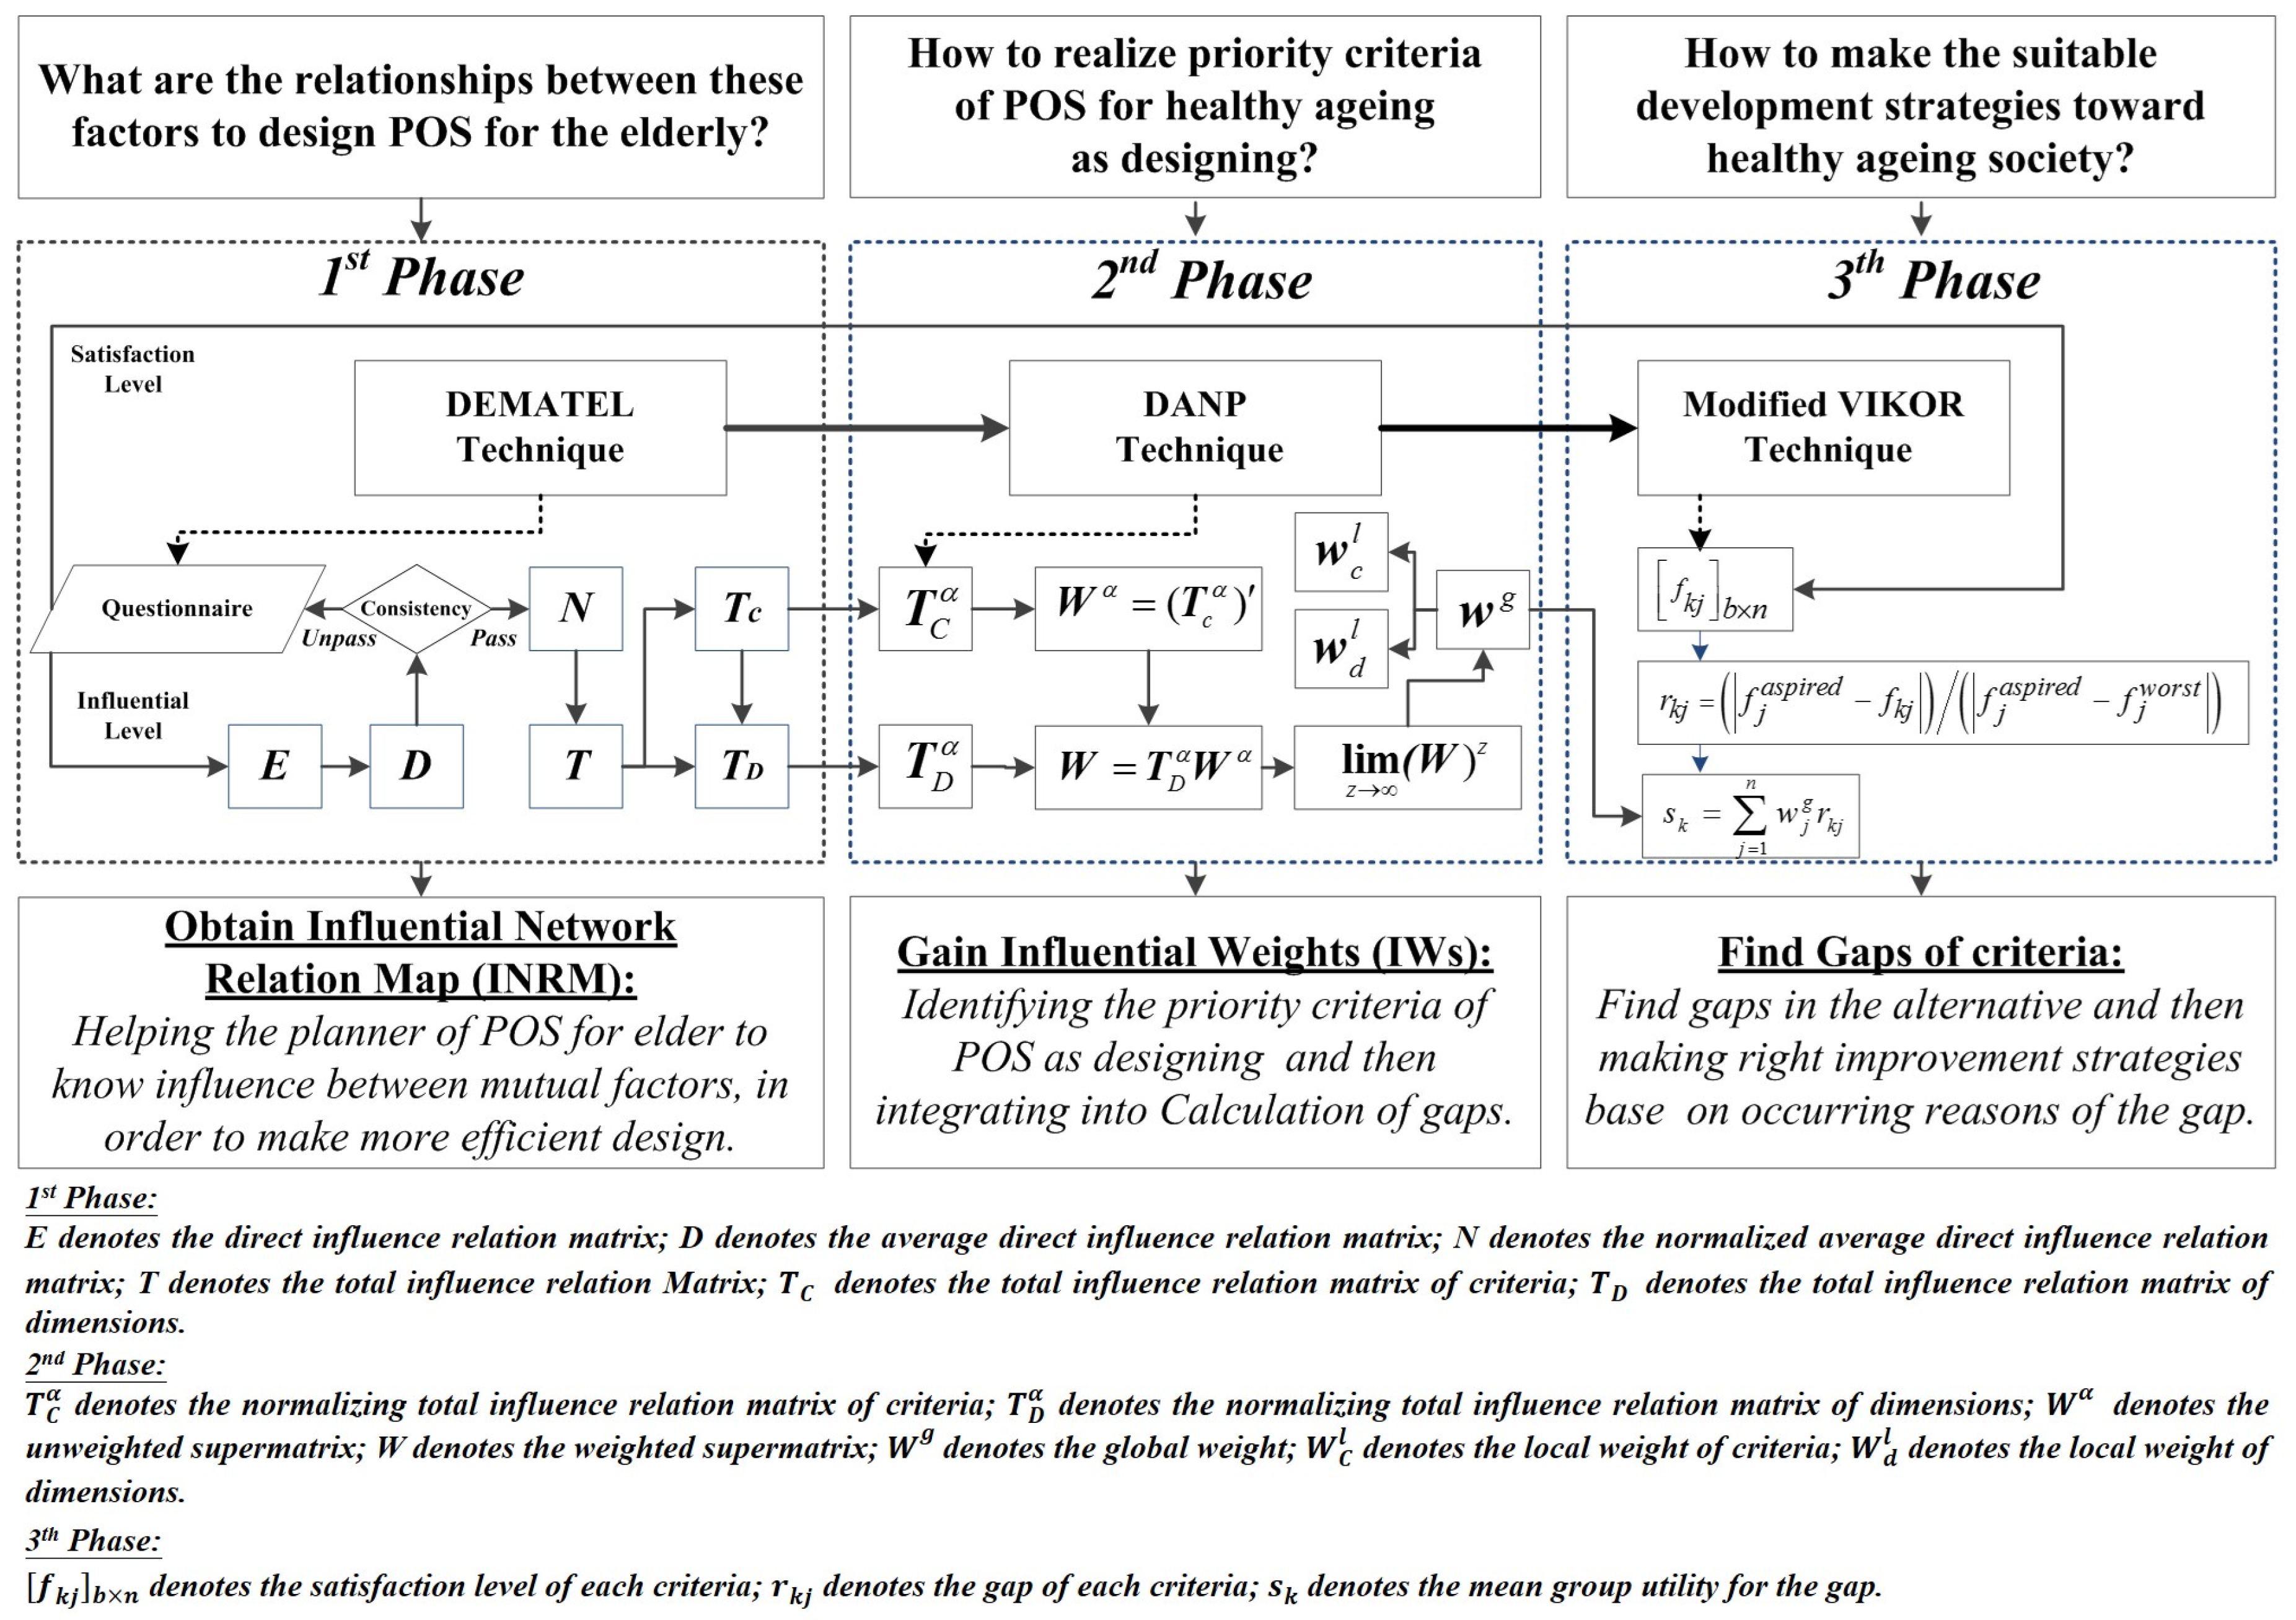
This section explains the operation of data collection and the choice of interviewees, including the expert and user groups. A DEMATEL questionnaire was employed to explore the relationships between the 16 criteria, meaning that experts were suitable interviewees to answer the questions. A VIKOR questionnaire was used to collect data on the degree of satisfaction with each criterion, so this questionnaire was completed by the elderly participants. Decisions being made by experts on behalf of users was formerly a conventional means of decision-making, but is now often considered controversial. So this study interviewed two groups (experts and users) for the satisfaction section and compared their results.
The expert questionnaires were separately administered in the first and third phases (Figure 2). In the first phase, 13 DEMATEL questionnaires were returned, comprising four invalid questionnaires and nine valid questionnaires. The expert interviewees were selected as follows. First, interviewees came from a wide variety of industry, official, and university circles; second, the interviewees were required to have a deep understanding of the topic at hand, whether theoretically or practically. In a detailed description, eight experts engaged in urban planning or landscape planning and had landscape design experience related to the pension industry, and the remaining experts were from the Department of Health Industry Management and had considerable research experience related to the health of the elderly population. Five experts were professional scholars, of whom two were professors, and the others worked in design institutes and had the highest qualification. Third, the chosen interviewees were required to understand the purpose and operating process of the DEMATEL questionnaire. The aforementioned four questionnaires were judged invalid largely for this reason. To improve validity, questionnaires were administered in the form of structured interviews, and any confusion about the questions was cleared by the authors. The average time for questionnaire completion was approximately 3.5 h.
In the third phase (Figure 2), 40 performance (modified VIKOR) questionnaires were administered over the Internet to another expert group in person-to-person form; therefore, all 40 questionnaires were valid. All of the experts graduated from the architecture school of HIT, implying that they had sufficient knowledge of the study site, as well as being landscape planners or urban designers with professional understanding of environmental gerontology. Hence, these experts could answer the questionnaires, which contained 16 evaluation criteria of POS and the satisfaction degree of each criterion. Moreover, the responses about the each criterion of the study site were rated on a scale from 1 to 10, with 1 representing extremely dissatisfied and 10 extremely satisfied.
The interviewees who were administered the modified VIKOR questionnaire in the third phase were people aged over 65 years (defined as elderly according to the WHO) and were active on the HIT campus from 5 July to 5 October 2016. According to their own experience of the HIT campus, these interviewees provided their satisfaction degree for the 16 evaluation criteria of POS in the paper-and-pencil questionnaire. The author and four trained graduate students randomly distributed the questionnaire on campus at five different periods (05:00–07:00, 07:00–11:00, 11:00–17:00, 17:00–21:00, and 21:00–24:00). When recruiting elderly people, the researchers confirmed whether they met the study requirements and obtained their consent for the interviews. In the survey, the preferred participants were elderly people who were resting, reading books, or exercising (stretching or walking) rather than those performing collective activities and looking after children. The researchers explained that the survey data will remain confidential, participation is voluntary, and that the elderly people could abstain from participating in this study. The research questions about social statistical information, detailed address, and other confidential information had to be as clear as possible to avoid any misunderstanding from the elderly participants. Two questions (“Whether Living Alone” and “Monthly income”) were deleted from the questionnaires, because a large number of participants did not respond to these questions. Some participants expressed distrust for the research generally, had concerns about privacy, and believed that the information might be used to make unwanted changes in their neighborhood. In addition, for respondents with visual impairment, researchers read the questionnaire and helped them to complete the questionnaire. A total of 205 questionnaires were administered and collected, including 59 invalid questionnaires. A questionnaire was considered invalid when a substantial number of questions in the survey were left unanswered. Among the target population (65 years or older), 79 (54.1%) were women. The majority (91.8%) of participants who completed the questionnaire were healthy and active, and 8.2% reported some mobility limitation. A total of 100 (68.5%) persons visited the POS daily.

3.3. Result and Discussion
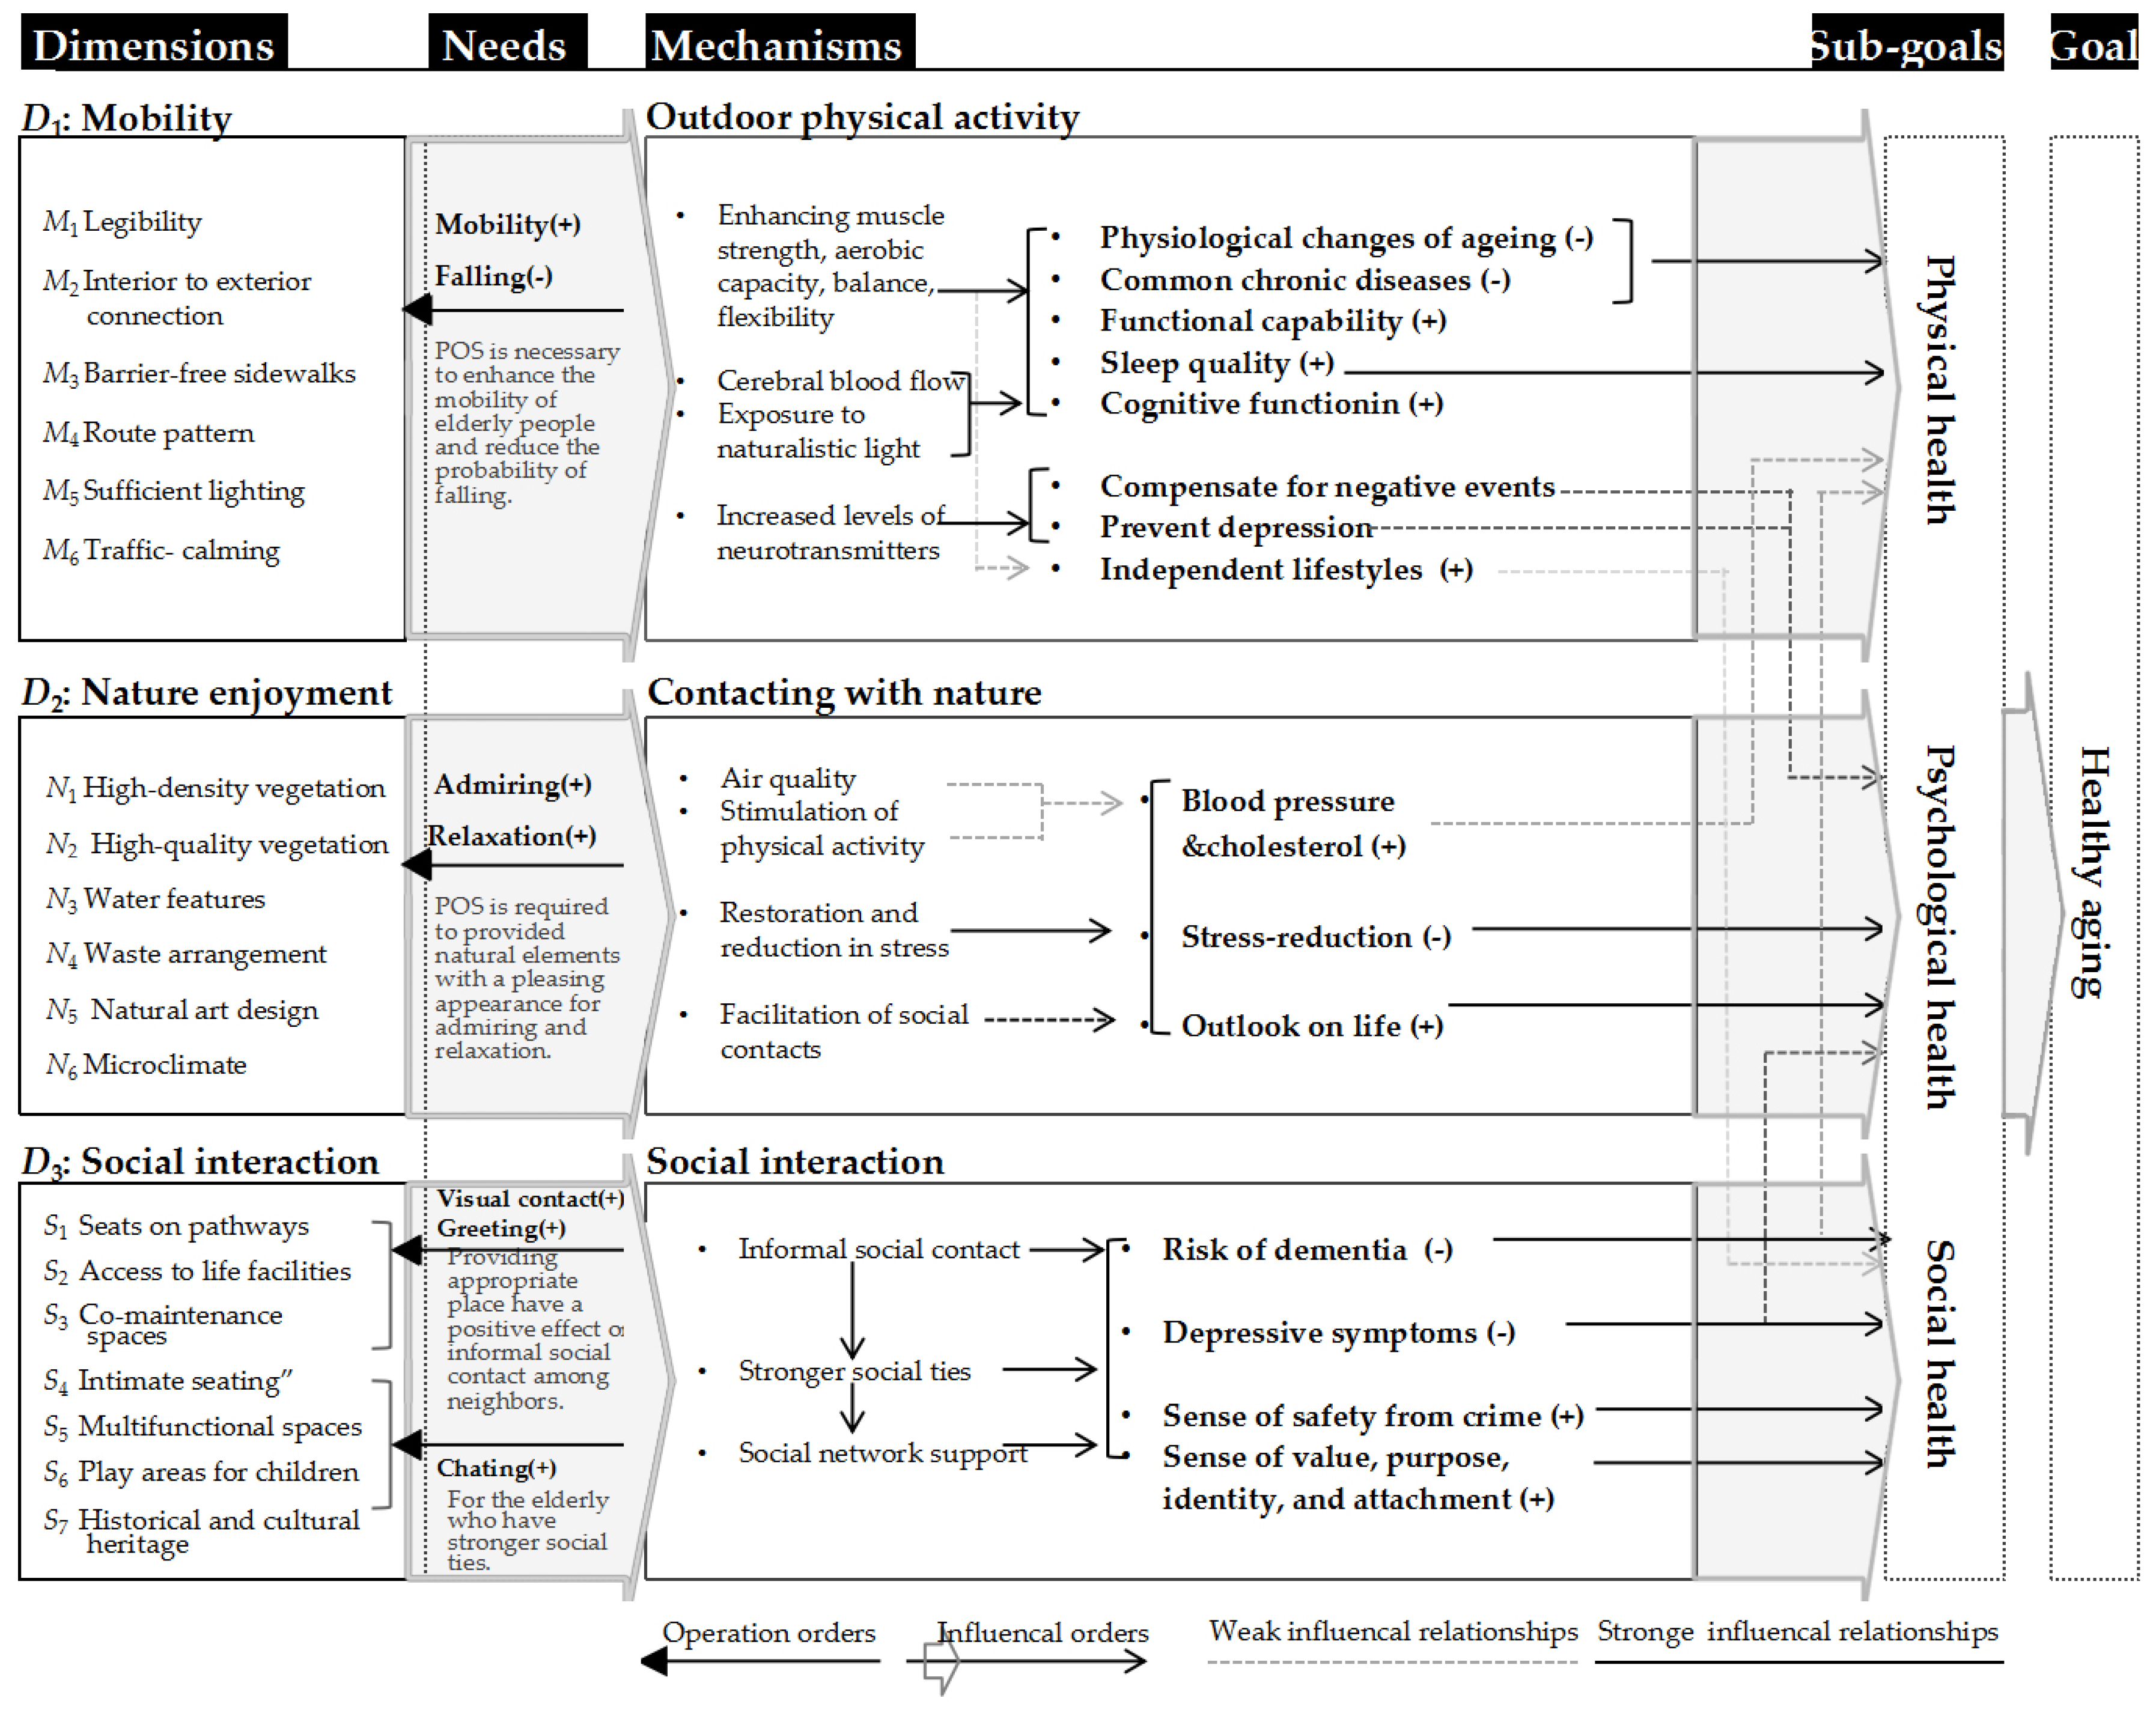
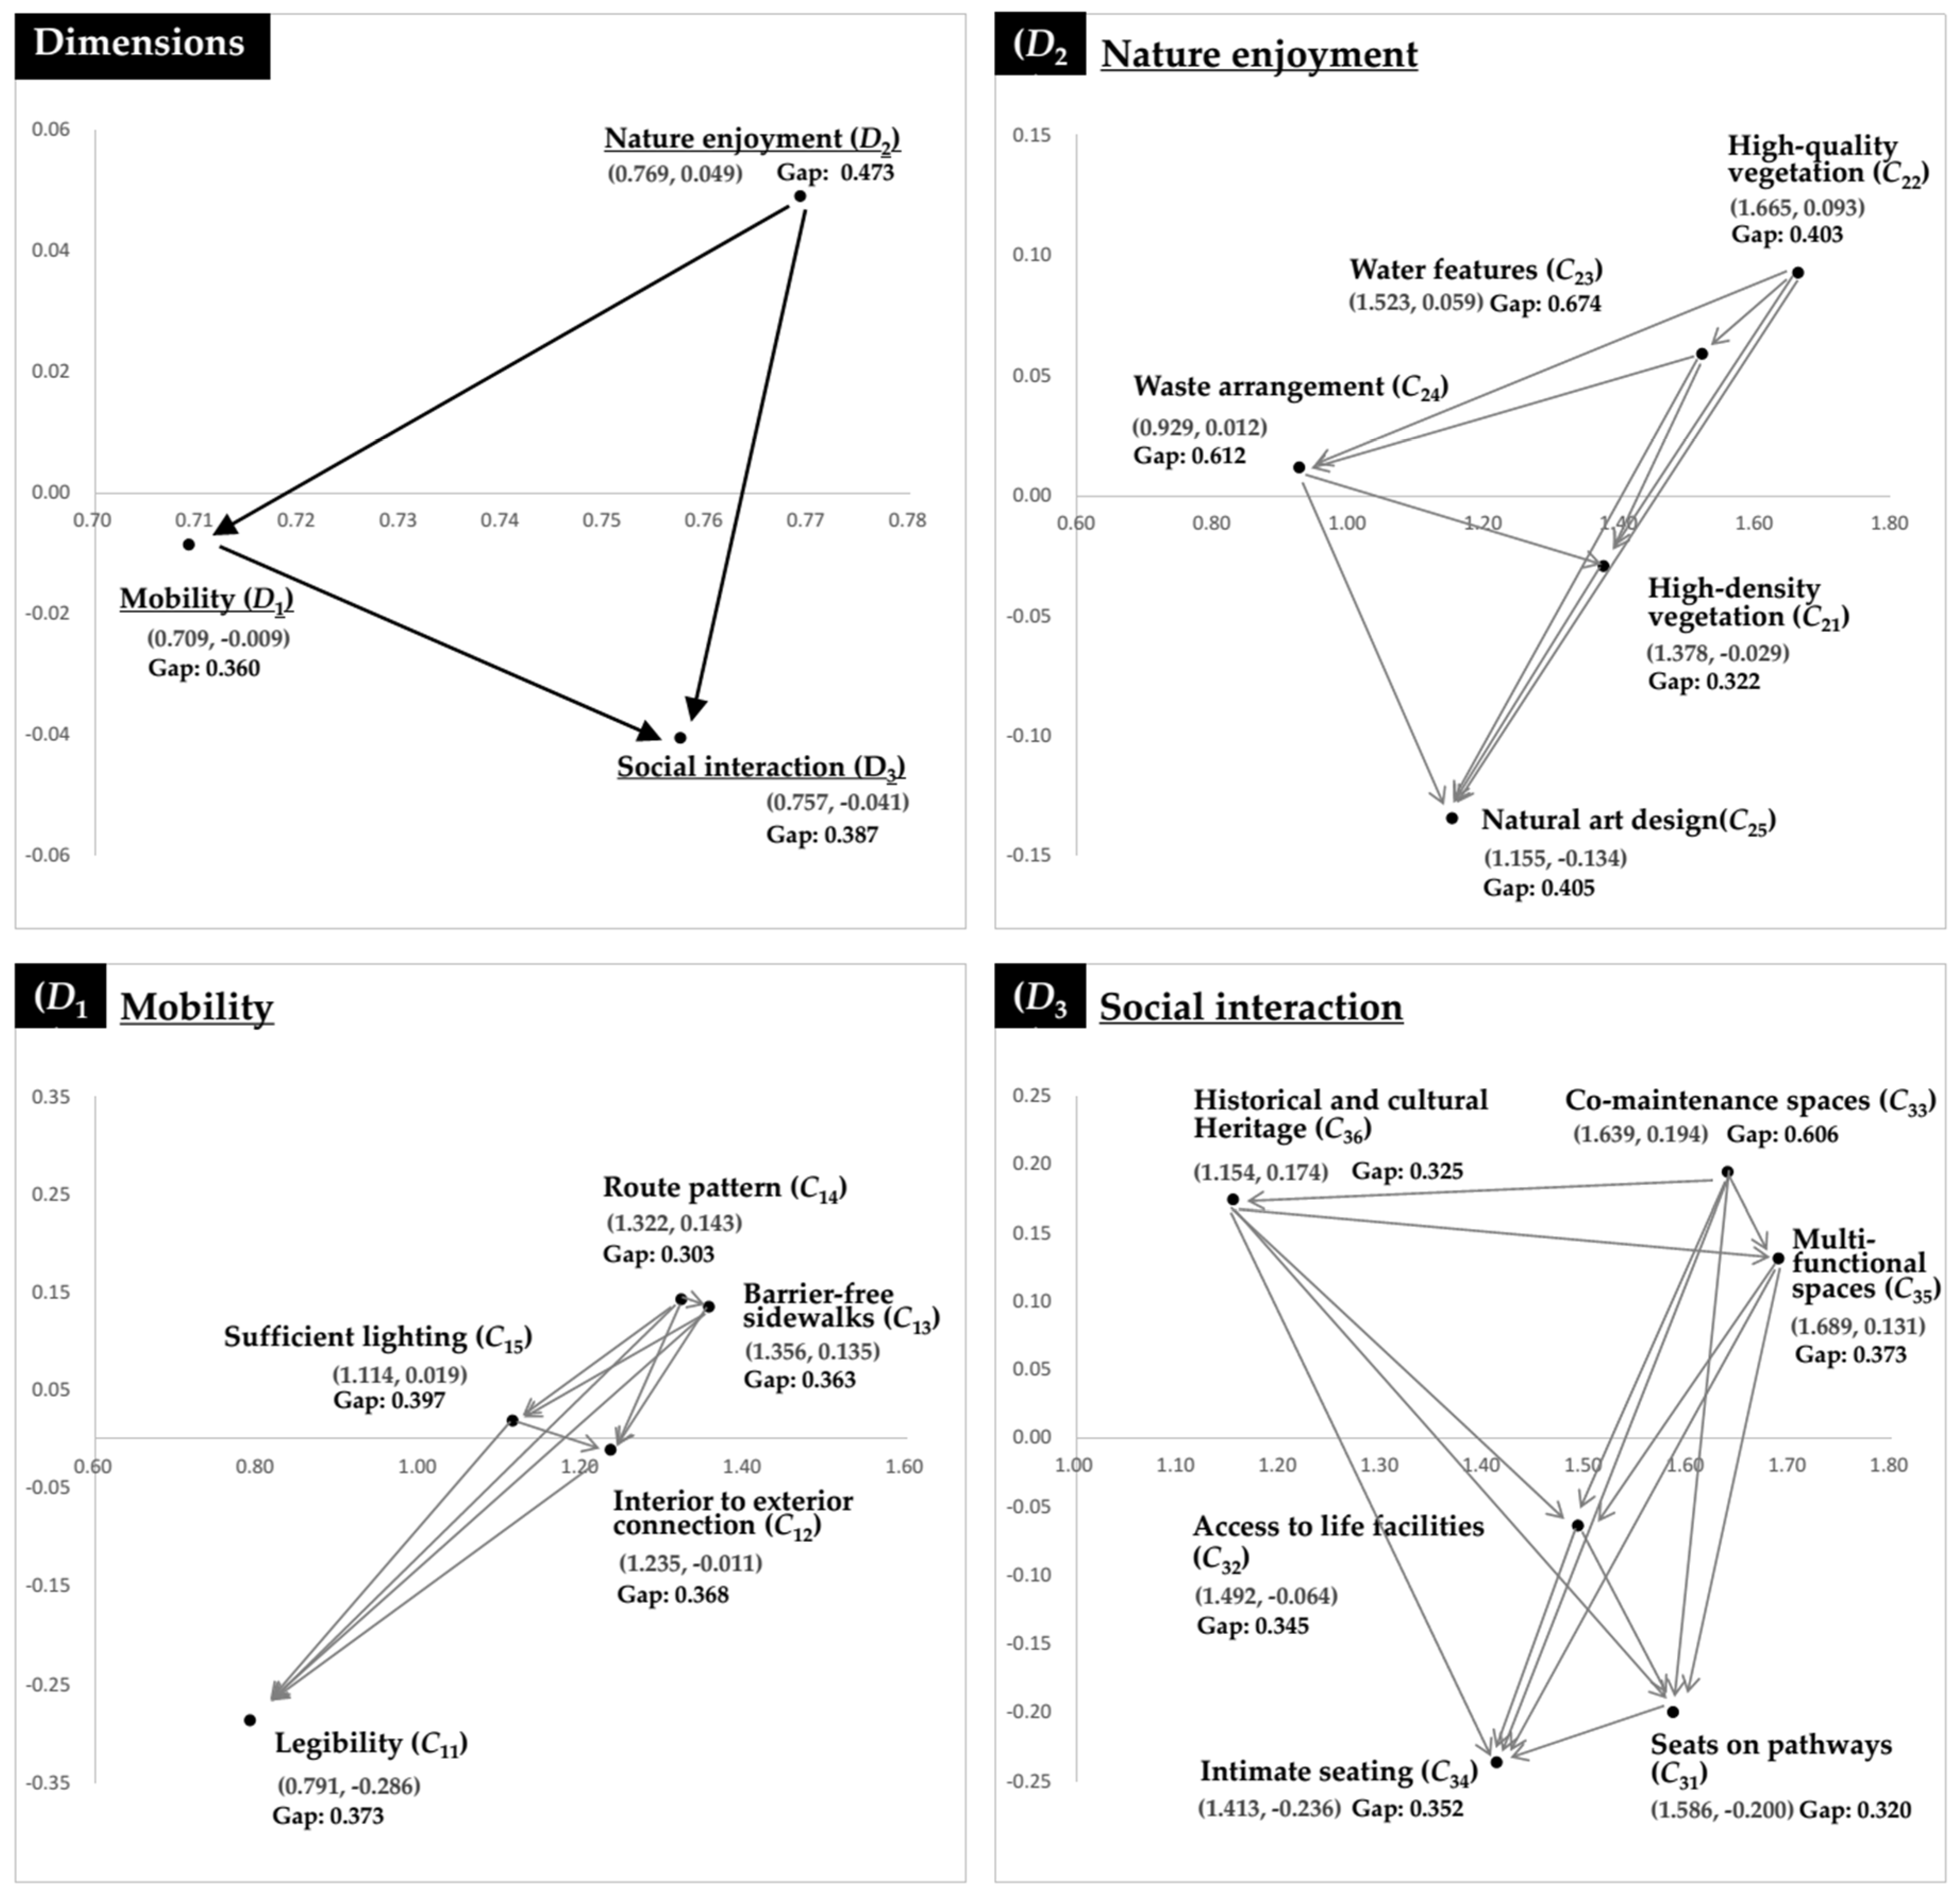
The INRM in Figure 5 illustrates the structure of interactions in the improvement model. Social interaction (D3) was influenced by mobility (D1) and nature enjoyment (D2), whereas mobility (D1) was influenced by nature enjoyment (D2). Therefore, to improve the social interaction (D3) dimension of POS, the improvement of criteria in the mobility (D1) and nature enjoyment (D2) dimensions should be emphasized. Moreover, to improve the mobility (D1) dimension of POS, the improvement of criteria in the nature enjoyment (D2) dimension should be emphasized. Thus, the priority of influence of the three dimensions could be ordered as nature enjoyment (D2), mobility (D1), and social interaction (D1). Similarly, from the perspective of INRM, the route pattern (C14) was the most influential criterion in mobility (D1), and the remaining criteria could be ordered as C13, C15, C12, and C11. High-quality vegetation (C22) was the most influential criterion in nature enjoyment (D2), and the remaining criteria could be ordered as C23, C24, C21, and C25. Co-maintenance spaces (C33) were the most influential criterion in social interaction (D1); the remaining criteria could be ordered as C36, C35, C32, C31, and C34.
The empirical case for using POS to achieve a healthy aging society in Harbin can be established through performance evaluations and improvements that incorporate VIKOR, based on the IWs found through DANP (Table 2). The total gap value is a sum of all criterion gap values, which can be obtained from the product of each local weight and its gap. A gap represents the distance between a criterion’s performance and the aspiration level. In this study, two gap values were derived from the expert and elderly groups. Furthermore, these gaps were improved to enhance each dimension/criterion’s performance.
The integration values for performance and gaps are presented in Table 2. The nature enjoyment (D2) dimension exhibited the largest gap value (0.473), and among its criteria, water features (C23) exhibited the largest gap value (0.674). Therefore, the POS can proceed with priority improvement by using the criteria with the largest gap value. The following criteria exhibited large gap values: waste management (C24) (0.612), Co-maintenance spaces (C33) (0.606), natural art design (C25) (0.405), and high-quality vegetation (C22) (0.403). The following criteria exhibited relatively small gap values: route patterns (C14) (0.303), seats on pathways (C31) (0.320), and high-density vegetation (C21) (0.322); however, their absolute values were still large (to 0). Thus, this POS has serious problems, and several improvements need to be implemented to achieve a POS that realizes healthy aging goals.
For the continuous improvement strategy for the POS in this empirical case, the influence relationships and the influential degree of the dimensions and criteria are discussed. Based on the INRM (Figure 5) and performance evaluation results (Table 2), two primary discussions are elaborated as follows: priority of improvement and comprehensive analysis according to the evaluation results of the expert and elderly groups.
To determine improvement priorities, gap values should be considered first. The absolute integration gap values of all three dimensions in Table 2 were significantly high and ranked as follows: nature enjoyment (D2), 0.473 (to 0); social interaction (D3), 0.387; and mobility (D1), 0.360. This result indicates that the development of POS in HIT for healthy aging is still in the initial stage, and the performance level is relatively low. Mobility (D1) exhibited a relatively small gap value, indicating that this dimension was regarded as more essential and received relatively more support from decision makers. The last stage of the improvement project focuses on enhancing mobility and accessibility. Moreover, it has achieved the minimum standards of Codes of Accessibility Design (GB50763-2012). Despite these measures, the needs of the elderly population have not been fully met. Yung et al. [8] argued that POS planned and designed simply based on universal accessibility standards cannot completely fulfill the needs of elderly people. They also suggested the effectiveness and the inclusiveness of the evaluation standards of POS should be regularly reviewed and adjusted. Some criteria exhibited extremely large gap values, such as water features (C23) (0.674), waste management (C24) (0.612), co-maintenance spaces (C33) (0.606), natural art design (C25) (0.405), and high-quality vegetation (C22) (0.403), all of which belong to the dimensions of nature enjoyment (D2) and social interaction (D3). This finding implies that these aspects of the POS in HIT should be improved first. POS improvement was previously implemented based on the priority order from the criterion with the largest gap value to the criterion with the smallest value. By contrast, the DANP-V model uses a systematic approach to address the problems from the root. For example, in this case, water features (C23), which exhibited the largest gap value among the 16 criteria, was given the first priority for improvement following the conventional approach. In fact, the POS of HIT previously had two water features (a swimming pool and a fountain), which the elderly interviewees reminisced about. These areas had been transformed into small squares and a parking area (Figure 4a), because of land use limitations and the difficulty of maintaining them in a cold climate. Moreover, it would be difficult to build a new water feature. However, the DANP-V model could identify the criteria affecting the satisfaction degree of water features. Figure 5 shows that the satisfaction degree of high-quality vegetation (C22) can affect the satisfaction degree of water features. This finding suggests that for this case, decision makers should allocate more resources to the root of the problem. Moreover, waste management (C24) exhibited the second largest gap value. Some residents believed that more disposal facilities should be provided for waste from pets, although the existing facilities met the current standards (1/100–200 m) in the Code of Urban Environmental Sanitation Facilities Planning (GB 50337-2003) (Figure 4f,l,n). However, others argued that even with sufficient sanitation facilities, it is difficult to guarantee a clean and tidy environment (Figure 4e); they considered unsanitary behavior to be a problem of upbringing. By contrast, this result revealed a new perspective: that the satisfaction degree of waste arrangement (C24) was influenced by water features (C23) and high-quality vegetation (C22), as shown in Figure 5. As mentioned, the satisfactoriness of water features (C23) can be improved by providing high-quality vegetation (C22). According to the performance and gap values of high-quality vegetation (C22) (ranked fifth) in Table 2, the satisfaction degree of this criterion was also very low. In recent years, the greening projects of the POS in this case mainly concentrated on planting more trees. The satisfaction degree of high-density vegetation (C21) was higher than that of high-quality vegetation (C22), indicating that the elderly respondents gained more travel motivation from the quality rather than quantity of natural elements (Figure 4c,i). To date, many problems have been detected with respect to vegetation arrangement in this POS, such as the plant combination pattern, coordination with existing landscape elements, and landscape conservation and management (Figure 4d,l,p,r). From the results, the low quality of the natural landscape is likely to result in uncivilized behavior, which may be regarded as a sign that elderly people are not safe and unwelcome. As indicated by the broken windows theory, a low quality environment can powerfully affect and induce the formation of negative attitudes that exhibit no awareness of environmental protection and are inclined to immoral behavior [70]. Similarly, Gibson and Werner [71] used the empirical method to explore the relationship between smokers’ behavior and the environment, and they discovered that uncivilized behavior is not necessarily related to personality problems and is more likely to be influenced by environmental designs and their implications. Therefore, attention should be paid to improving the quality of vegetation design. As demonstrated by Finlay et al. [42], environmental interventions that positively influence elderly adults’ quality of life need not even be on a largescale. Smaller features, such as a small and exquisite green plot or a courtyard fountain, can have a significant effect.
In this study, performance and gap values were synthetically obtained from the survey data of both experts and elderly participants. First, the gap values from the designer questionnaires were generally larger than that from the elderly questionnaires. This difference can be attributed to the following reasons: (1) the standard of professional assessment may be stricter than that of the populace and (2) difference in living quality expected by different age groups. Kane [72] found that the expectations of quality of life among seniors decline with age. Regarding subjective impression of well-being, elderly participants seemed more optimistic and therefore often scored higher than younger adults. (3) Compared with designers, the elderly people interviewed in this study have typically lived around HIT for a long time and experienced a long self-adaptive process. According to the person–environment fit theory proposed by Lawton [16], the self-adaptive ability of the elderly population enables their adjustment to external environmental stimuli when exposed to those stimuli for a long time. This concept can explain why elderly people express comparatively more satisfaction, even when facing inclement environments.
Second, these findings, derived from the comparison of the results of two groups, indicate that experts and elderly people provide generally consistent arrangement patterns for the criteria, particularly the first three criteria. However, we also need to pay attention to the significant difference in two criteria orders. For sufficient lighting (C15) (nine different orders), it is more likely that designers believe that elderly people prefer exercising in the daytime, and the existing lighting facilities can meet their demands. However, 54.1% of elderly respondents were active in the evening (approximately 17:00–21:00), and some believed that the brightness of the lighting facilities was insufficient. For intimate seating C34 (six different orders), the privacy degree required by the elderly in the case is relatively low. Nonetheless, designers use numerous evaluation standards, which are mostly obtained from their own experience of nursing projects for the elderly population, causing the larger gap values. Finally, considering the special needs of elderly people, the findings of this study indicate that public participation should be emphasized. Elderly people should be encouraged to communicate their preferences for the improvement process of POS for healthy aging. Combining the evaluation results from experts and users, decision makers can more favorably identify the requirements and priority orders from user groups.

4. Conclusions

This study offers useful insights into the theoretical investigation and practical improvement for POS intended to achieve healthy aging in aging societies. First, this study adds new evidence to the growing body of knowledge regarding the associations between elderly people’s health and the characteristics of POS. Second, translating multidisciplinary knowledge about “elderly people’s health-POS” into the evaluation framework (“goal–subgoals–mechanisms–needs–criteria”) can provide significant contributions to the identification of environmental attributes. Third, the hybrid MCDM model combining DANP and Modified VIKOR methods was used to evaluate the existing POS for proposing continuous and efficient improvement strategies for healthy aging and for avoiding “stopgap piecemeal” practice. Previous studies have shown that three mechanisms, namely physical activity, contact with nature, and social interaction, can influence each other [20,41,46,50]. Our findings suggest that nature enjoyment (D2) is the most influential dimension, and the degree of influence of social interaction (D3) is the lowest among all dimensions. Therefore, we should pay more attention to the nature enjoyment (D2) criterion in design because it plays a decisive role in elderly people’s decisions about whether to visit POS and guides the proper behaviors for health. Finally, according to the cognitive differences reflected by the gap in priorities between the expert and elderly groups, we suggest that for the improvement of POS for the elderly population in urban redevelopment areas, decision makers should pay more attention to users’ aspirations and preferences.
The limitations of this study should be acknowledged, as they may provide guidance for future research. This cross-sectional study used a convenience sample of elderly users in the POS in the HIT campus to explore the continuous improvement strategies of POS, which may limit the generalizability of the research findings. A single set of planning guidelines and improvement strategies may not be appropriate for all places. However, our process and evaluation framework can be used as a reference for investigating improvement priorities of POS in many areas. Moreover, it is a great challenge for planners and designers to incorporate the broad spectrum of needs of different age groups [8], because users with different social and cultural requirements or different ages may have different needs and perception preferences. This study has also taken a first step in the incorporation process by understanding the needs of the elderly population. Future research may explore continuous improvement strategies with the integration of multi-group preferences in performance. Moreover, to resolve conflicts from different groups, time programing should be considered seriously in addition to space programing [6]. Some conflicts can be resolved by dynamic multistage evaluation, which can be regarded as a participatory planning process that considers the evaluation result [6]. With the changing demographic patterns and users’ characteristics, users’ behaviors and preferences will change over time [12]. Even over a defined period, POS characteristics may change following environmental interventions, and users’ degree of satisfaction may change [25]. In conclusion, future studies should consider performing multistage evaluation of a POS, preferably with regards to the different levels of planning and improvement, to determine which environmental attribute changes are most likely to impart the maximum benefits for elderly people’s health.

Acknowledgments

The authors are extremely grateful for the Sustainability journal editorial team’s valuable comments on improving the quality of this article. This research was partially supported by grant MOST-104-2410-H-305-052-MY3 of the Ministry of Science and Technology, Taiwan (New concepts and trends of hybrid dynamic MCDM model in developments and its applications).

Author Contributions

Bo-Wei Zhu and Lei Xiong provided the research idea and the purpose of this study topic; Gwo-Hshiung Tzeng, Shan-Lin Huang and Bo-Wei Zhu designed the research; Bo-Wei Zhu, Lei Xiong, and Shan-Lin Huang collected and analyzed the data; Bo-Wei Zhu, Shan-Lin Huang, Jia-Rui Zhang, and Lei Xiong wrote the paper; finally, Gwo-Hshiung Tzeng provided the ideas and research methods, and supervised, corrected, and revised this paper. All authors have read and approved the final manuscript.

Conflicts of Interest

The authors declare no conflict of interest.

Appendix A. Research Steps

The DANP-V model, which was adopted for this study, was proposed by Tzeng [73,74], who combined new concepts and techniques to solve complex and dynamic real-world problems. Hence, this part is divided into three steps: the DEMATEL technique, the DANP technique, and the modified VIKOR method.

Appendix A.1. DEMATEL Technique

Step 1: Establish the direct influence relation matrix E . Data were obtained using the questionnaire, and the scales used in the questionnaire involved an integer score of 0, 1, 2, 3, or 4, ranging from 0 representing absolutely no influence to 4 representing very high influence, according to natural language criteria from linguistics. The respondent had to be an expert in the field and use the pairwise comparison method to evaluate the degree of influence of the criteria, and to show the degree to which each criterion i affects each criterion j. This matrix must be a n × n nonnegative matrix. According to the results from H experts, the direct influence relation matrix E is shown in Equation (A1), and the direct influence relation matrix from all experts is E h = [ e i j h ] n × n , h = 1 , 2 , ... , H , where E 1 , ... , E h , ... , E H .
E = [ e 11 e 1 j e 1 n e i 1 e i j e i n e n 1 e n j e n n ]
Step 2: Constitute the average direct influence relation matrix D . The average scores of the H experts are d i j = 1 H h = 1 H e i j h . The average matrix is called the average direct influence relation matrix D and represents the degree of influence that one criterion exerts on another and the degree of influence that the criterion receives from another, as shown in Equation (A2):
D = [ d 11 d 1 j d 1 n d i 1 d i j d i n d n 1 d n j d n n ] .
Step 3: Examine consensus. The value of consensus can be estimated by Equation (A3), which represents the level of experts’ consensus. The threshold of the average gap ratio is 5% in statistics; a value less than 5% implies a confidence level above 95%, which also represents a stable system. Conversely, if an unstable system is obtained, the first phase should be implemented again to verify whether data collection is correct and whether the number of experts is sufficient.
Average gap-ratio in consensus ( % ) = 1 n ( n 1 ) i = 1 n j = 1 n ( | d i j H d i j H 1 | / d i j H ) × 100 %
Step 4: Formulate the normalized average direct influence relation matrix N . The normalized average direct influence relation matrix N is acquired by normalizing the matrix D. The matrix N is easily derived from Equations (A4) and (A5), in which all principal diagonal criteria are equal to 0:
N = b D
b = min { 1 max 1 i n j = 1 n d i j , 1 max 1 j n i = 1 n d i j } .
Step 5: Construct the total influence relation matrix T . A continuous decrease of the indirect effects of problems moves with the powers of the matrix N , e.g., N 2 , , N , and lim q N q = [ 0 ] n × n , for lim q ( I + N + N 2 + + N q ) = ( I N ) 1 , where I is a n × n unit matrix. The total influence relation matrix T is a n × n matrix and is defined by T = [ t i j ] n × n ,   i , j = 1 , 2 , ... , n , as shown in Equation (A6).
T = N + N 2 + ... + N q = N ( I + N   +   N 2 + ... + N q 1 ) = N ( I +   N   +   N 2 + ... + N q 1 ) ( I N ) ( I N ) 1 = N ( I N ) 1 ,   when   lim q N q = [ 0 ] n × n
Step 6: Illustration of INRM. The total influence relation matrix T of INRM can be acquired using Equations (A7) and (A8) to generate each row sum and column sum in the matrix T , respectively:
o = ( o i ) n × 1 = [ j = 1 n t i j ] n × 1 = ( o 1 , ... , o i , ... , o n )
r = ( r i ) n × 1 = ( r j ) 1 × n = [ i = 1 n t i j ] 1 × n = ( r 1 , ... , r j , ... , r n ) ,
where o i is the sum of a row in the total influence relation matrix T , which represents the total effects (both direct and indirect) of criterion/perspective i on all other criteria/perspectives [ j = 1 n t i j ] n × 1 . Similarly, r j is the column sum in the total influence relation matrix T , which represents the total effects (both direct and indirect) of criterion/perspective j received from all other criteria/perspectives [ i = 1 n t i j ] 1 × n . ( o i + r i ) provides an index of the strength of the total influences given and received; that is, ( o i + r i ) indicates the degree of importance of the criterion/perspective i in the system. In addition, ( o i r i ) provides an index of the degree of the cause of the total influence. If ( o i r i ) is positive, then criterion/perspective i is a net causer, and if ( o i r i ) is negative, then criterion/perspective i is a net receiver.
Step 7: Construct the total influence relation matrix of criteria T C and dimension T D . The total influence relation matrix of criteria T C from each perspective (dimension or cluster), with different degrees of influence relation for the criteria, is shown in Equation (A9), where j = 1 m m j = n , m < n , and T c i j as a m i × m j matrix.
T C = D 1 D j D m c 11 c 1 m 1 c j 1 c j m j c m 1 c m m m D 1 c 11 c 12 c 1 m 1 D i c i 1 c i 2 c i m i D m c m 1 c m 2 c m m m [ T c 11 T c 1 j T c 1 m T c i 1 T c i j T c i m T c m 1 T c m j T c m m ] n × n | m < n , j = 1 m m j = n ,
where D m is the mth cluster; c m m is the mth criterion in the mth dimension; and T c i j is a submatrix of the influence relation for the criteria from a comparison of the ith dimension with the jth dimension. In addition, if the ith dimension has no influence on the jth dimension, then submatrix T c i j = [ 0 ] , demonstrating the independence (no influence relation) of each criterion on other criteria. Moreover, the total influence relation matrix of dimension T D is shown in Equation (A10):
Τ D = [ t 11 t 1 j t 1 m t i 1 t i j t i m t m 1 t m j t m m ] m × m .
The DANP-V model is required to identify the dimensions and criteria individually while proposing an improvement strategy; thus, drawing the INRM of dimensions and criteria should be divided into the matrix T C and the matrix T D .

Appendix A.2. DANP Technique

Step 1: Calculate the unweighted supermatrix W α . Normalize the total influence relation matrix T C by dimensions (called “clusters”) as shown in Equation (A11):
T C α = D 1 D j D m c 11 c 1 m 1 c j 1 c j m j c n 1 c m m m D 1 c 11 c 12 c 1 m 1 D i c i 1 c i 2 c i m i D m c m 1 c m 2 c m m m [ T c α 11 T c α 1 j T c α 1 m T c α i 1 T c α i j T c α i m T c α m 1 T c α m j T c α m m ] n × n | m < n , j = 1 m m j = n ,
where T C α denotes the normalizing total influence relation matrix of criteria by dimensions, and T c α 14 is derived from Equations (A12) and (A13). Similarly, T c α m m can be obtained:
t i 14 = j = 1 m 4 t i j 14 , i = 1 , 2 , , m 1
T c α 14 = c 11 c 1 i c 1 m 1 c 41      c 4 j    c 4 m 4 [ t 11 14 / t 1 14 t 1 j 14 / t 1 14 t 1 m 4 14 / t 1 14 t i 1 14 / t i 14 t i j 14 / t i 14 t i m 4 14 / t i 14 t m 1 1 14 / t m 1 14 t m 1 j 14 / t m 1 14 t m 1 m 4 14 / t m 1 14 ] = [ t 11 α 14 t 1 j α 14 t 1 m 4 α 14 t i 1 α 14 t i j α 14 t i m 4 α 14 t m 1 1 α 14 t m 1 j α 14 t m 1 m 4 α 14 ] .
According to the pairwise comparisons of the criteria and on the basis of the basic concept of ANP, the unweighted supermatrix W α can be obtained by transposing the normalized influence relation matrix T C α by dimensions (clusters), that is, W α = ( T C α ) , as shown in Equation (A14):
W α = ( T C α ) = D 1 D i D m c 11 c 1 m 1 c i 1 c i m i c m 1 c m m m D 1 c 11 c 12 c 1 m 1 D j c j 1 c j 2 c j m j D m c m 1 c m 2 c m m m [ W 11 W i 1 W m 1 W 1 j W i j W m j W 1 m , W i m W m m ] n × n | m < n , j = 1 m m j = n .
Step 2: Calculate weighted supermatrix. The normalized total influence-relation matrix of dimensions T D α can be obtained through the total influence-relation matrix T D divided by d i = j = 1 m t i j , i = 1 , 2 , ... , m , as shown in Equation (A15):
Τ D α = [ t 11 / d 1 t 1 j / d 1 t 1 m / d 1 t i 1 / d i t i j / d i t i m / d i t m 1 / d m t m j / d m t m m / d m ] m × m = [ t 11 α D t 1 j α D t 1 m α D t i 1 α D t i j α D t i m α D t m 1 α D t m j α D t m m α D ] m × m .
The matrix T D α and the unweighted supermatrix W α and the weighted supermatrix W can be easily obtained by Equation (A16), where t i j α D is a scalar and j = 1 m m j = n :
W = T D α W α = D 1 D i D m c 11 c 1 m 1 c i 1 c i m i c m 1 c m m m D 1 c 11 c 12 c 1 m 1 D j c j 1 c j 2 c j m j D m c m 1 c m 2 c m m m [ t 11 α D × W 11 t i 1 α D × W i 1 t m 1 α D × W m 1 t 1 j α D × W 1 j t i j α D × W i j t m j α D × W m j t 1 m α D × W 1 m t i m α D × W i m t m m α D × W m m ] .
Step 3: Limit weighted supermatrix. Limit the weighted supermatrix by raising it to the zth power until the supermatrix has converged and become a stable supermatrix. The global priority vectors, global weight w g —which are called the IWs of DANP—are obtained, such as lim z ( W ) z , where z represents any number of power. By summing the IWs of each criterion in every dimension, the local weight of dimension w D l can be obtained. Subsequently, the global weight of each criterion can be divided by the local weight of its own dimension to yield the local weight of criteria w c l .

Appendix A.3. Modified VIKOR Method

Step 1: Derive the positive ideal solution and the negative ideal solution replaced by the aspiration levels and the worst value to fit the current real-world situation. Define the best value (aspiration level) shown as f j a s p i r e d in j criterion and the worst value f j w o r s t for all criteria, which can be acquired from the traditional form to the modified form.
(1)
The traditional approach for deriving the positive ideal solution and negative ideal solution is as follows:
The positive ideal solution: f = ( f 1 , ... , f j , ... , f n ) , where f j = max k { f k j | k = 1 , 2 , ... , b } ;
The negative ideal solution: f = ( f 1 , ... , f j , ... , f n ) , where f j = min k { f k j | k = 1 , 2 , ... , b } . This approach can only be used for the ranking and selection of alternatives and must be used for more than two alternatives, f j = max k f k j and f j = min k f k j when k = 1 , 2 , ... , b .
(2)
The modified approach for replacement by the aspiration level and the worst value is , as follows:
The aspiration level: f a s p i r e d = ( f 1 a s p i r e d , ... , f j a s p i r e d , ... , f n a s p i r e d ) , where f j a s p i r e d is an aspiration level, or called the best value;
The worst values: f w o r s t = ( f 1 w o r s t , ... , f j w o r s t , ... , f n w o r s t ) , where f j w o r s t is a worst value.
In this study, performance scores ranging from 0 to 10 (very bad ← 0, 1, 2, …, 9, 10 very good) are used with natural language in the linguistic/semantic questionnaire; thus, the aspiration level takes the highest score of 10 and the worst value takes the value of 0. Hence, f j a s p i r e d = 10 is defined as the aspiration level and f j w o r s t = 0 as the worst value to avoid choosing the best among inferior choices/options/alternatives. Hence, this approach avoids “picking the best apple from a barrel of rotten apples.” Therefore, the modified VIKOR method can not only be used for the ranking and selection of alternatives but can be also used for addressing performance gap improvement towards realizing a healthy aging society improvement. However, the modified VIKOR method can be used for a limited number of alternatives, that is, only one (single) alternative [75].
Step 2: Determine the mean group utility for the gap and then establish the priority improvement strategy. These values can be calculated using Equation (A17):
s k = j = 1 n w j r k j = j = 1 n w j ( | f j a s p i r e d f k j | ) / ( | f j a s p i r e d f j w o r s t | ) ,
where s k is defined as the normalized ratio (%) of distance to the aspiration level, which implies the synthesized gap of the criteria. Here, w j indicates the IWs for the criteria obtained from DANP.
Overall, the modified VIKOR method can also be used for the ranking and selection of alternatives and for the improvement of performance gaps of criteria [76], based on INRM produced by systematics; “stopgap piecemeal” approachers and “picking the best apple from a barrel of rotten apples” can thereby be avoided. Moreover, this method can even be used to solve any daily or single issue (i.e., a single issue, with no other alternatives) as well as for improving performance gaps when considering all perspectives (dimensions) and criteria [77], such as for solving the problem of this research topic.

Appendix B. Results in Detail

Primarily, the gradual and continuous improvement strategies developed in this study were used to establish an improvement model of POS for a healthy aging society. DANP (DEMATEL-based ANP) was used to develop the structure of influential relationships and analyze the relationship (interaction) and the influential degree of the three dimensions and 16 criteria. As mentioned in Appendix A, we used the results of the nine experts’ questionnaires to measure the total influence matrix T and the degrees of influence. Table A1 shows the initial influence matrix D = [ d i j ] n × n derived from the average value of the nine experts’ questionnaires. The consistency gaps of these nine questionnaires were 4.72% and were smaller than 5%, implying that the confidence level was 95.28%, which is more than 95%, as demonstrated by the following text.
Table A2, Table A3 and Table A4 show the relationship between the total influence matrix T and the degrees of influence. Table A2 illustrates the total relationships among the 16 criteria. Table A3 illustrates the two types of information, namely the relationships among the three dimensions and the degree of influence of each dimension. The degree of influence of each dimension combined with the INRM revealed that, based on experts’ judgment, the dimension of nature enjoyment (D2) had the highest effect among all dimensions and was thus the most influential dimension. The degree of influence of social interaction (D3) was the lowest, and mobility (D1) had intermediate influence. Table A4 presents the sum of influences given or received from the degree of influence of each criterion within its own dimension.
The IWs of criteria were obtained from the ANP process in the DANP model. First, based on Equations (A9)–(A12), the unweighted supermatrix W α was obtained by transposing the normalized influence matrix T C , as shown in Table A5. The weighted supermatrix W based on Equations (A13) and (A14) is shown in Table A6. Then, the IWs of DANP were obtained by limiting the power of the weighted supermatrix, as shown in Table A7. The criterion of high-quality vegetation (C22) exhibited the highest IW value (0.080), whereas waste arrangement (C24) exhibited the lowest value (0.040).
Table A1. Initial influence matrix A.
CriteriaC11C12C13C14C15C21C22C23C24C25C31C32C33C34C35C36
C110.0000.8891.5561.0000.4440.3330.7780.5560.1111.3330.3331.2220.3330.5560.6670.333
C122.0000.0002.3333.1112.0000.7782.1112.2220.4441.1110.6672.4441.5560.8892.7781.000
C132.4443.5560.0002.7782.3332.1112.1112.0000.3332.2222.8893.0002.6671.5562.8890.667
C142.2223.6673.2220.0001.7781.3331.8892.2221.2221.4442.8893.5562.1112.6672.1111.111
C151.8891.8892.0001.2220.0001.0002.5562.7780.3332.1111.7781.4441.5561.8892.8891.444
C211.1111.6671.4441.6672.1110.0002.8892.1111.2222.7782.5561.2223.5563.0002.0001.667
C222.1112.8892.6672.5561.8893.6670.0003.1113.0002.5563.3333.2222.8893.5562.4442.000
C231.8892.4442.3332.5562.0002.6672.8890.0002.6672.5563.5562.4442.1113.1111.6673.111
C240.6670.4441.4440.5561.0001.1112.4442.4440.0001.0002.4441.3331.5561.3331.1110.778
C251.0001.4440.8890.8891.4442.5561.8892.3330.6670.0001.7781.5561.1110.8890.6673.222
C310.6670.2221.3331.0001.7781.3332.0002.2220.7782.2220.0002.8892.1112.2221.7780.667
C321.2221.8891.5561.6672.1110.7781.3331.0000.1110.3332.6670.0002.7782.2222.4441.000
C331.8890.7781.7782.4442.0003.6673.2221.6671.4441.0002.7782.4440.0002.8892.7781.333
C341.1110.3331.1111.5562.2221.3332.5561.7781.2221.5562.1111.1111.3330.0001.5560.444
C351.2222.7782.6672.4442.0002.6672.8891.8892.0000.7782.6672.5561.7782.6670.0001.778
C362.1111.7781.1111.7782.1112.4441.6671.7780.4443.0002.1110.5561.0001.4442.2220.000
Note: A v e r a g e   gap-ratio   i n   c o n s e n s u s ( % ) = 1 n ( n 1 ) i = 1 n j = 1 n ( | d i j H d i j H 1 | / d i j H ) × 100 % = 4.72 % < 5 % , where n is the number of criteria (n = 16), H is the sample of nine experts (H = 9) whose practical experience and significant confidence reach 95.28% (more than 95%).
Table A2. The total influence matrix of criteria TC.
CriteriaC11C12C13C14C15C21C22C23C24C25C31C32C33C34C35C36
C110.029 0.055 0.069 0.057 0.044 0.041 0.056 0.048 0.022 0.061 0.049 0.067 0.043 0.050 0.052 0.033
C120.116 0.083 0.136 0.152 0.125 0.100 0.143 0.136 0.060 0.100 0.117 0.149 0.120 0.113 0.151 0.084
C130.143 0.180 0.103 0.166 0.154 0.150 0.169 0.155 0.069 0.144 0.190 0.186 0.167 0.152 0.177 0.093
C140.136 0.180 0.173 0.102 0.141 0.130 0.162 0.158 0.087 0.125 0.189 0.196 0.153 0.173 0.159 0.099
C150.115 0.126 0.130 0.113 0.083 0.110 0.157 0.153 0.061 0.127 0.145 0.129 0.122 0.138 0.156 0.098
C210.107 0.129 0.128 0.134 0.144 0.100 0.180 0.152 0.088 0.153 0.178 0.138 0.179 0.178 0.150 0.112
C220.153 0.184 0.184 0.182 0.168 0.208 0.150 0.204 0.143 0.174 0.231 0.214 0.197 0.222 0.191 0.139
C230.139 0.164 0.165 0.170 0.158 0.175 0.199 0.123 0.129 0.165 0.221 0.184 0.167 0.198 0.161 0.155
C240.069 0.071 0.096 0.076 0.086 0.092 0.131 0.124 0.040 0.083 0.136 0.103 0.103 0.105 0.094 0.067
C250.083 0.101 0.089 0.090 0.103 0.130 0.126 0.128 0.058 0.068 0.128 0.113 0.099 0.101 0.092 0.127
C310.077 0.076 0.103 0.096 0.114 0.106 0.133 0.129 0.064 0.118 0.093 0.148 0.125 0.135 0.120 0.072
C320.090 0.112 0.108 0.111 0.120 0.091 0.117 0.101 0.047 0.075 0.149 0.083 0.138 0.133 0.135 0.075
C330.126 0.115 0.140 0.153 0.144 0.183 0.191 0.145 0.095 0.117 0.188 0.168 0.106 0.181 0.170 0.104
C340.083 0.074 0.093 0.102 0.117 0.100 0.138 0.115 0.071 0.100 0.133 0.104 0.102 0.078 0.109 0.063
C350.115 0.161 0.161 0.157 0.147 0.161 0.185 0.153 0.107 0.113 0.187 0.174 0.148 0.176 0.111 0.115
C360.114 0.116 0.103 0.117 0.125 0.134 0.131 0.125 0.058 0.142 0.143 0.102 0.104 0.121 0.134 0.061
Table A3. The total influence matrix of criteria TD and sum of influences given/received on dimensions.
DimensionsD1D2D3 o i r i o i + r i o i r i
Mobility (D1)0.116 0.109 0.125 0.350 0.359 0.709 −0.009
Nature enjoyments (D2)0.127 0.133 0.149 0.409 0.360 0.769 0.049
Social interaction (D3)0.116 0.118 0.125 0.358 0.399 0.757 −0.041
Table A4. Sum of influences given/received on criteria.
Criteria o i r i o i + r i o i r i
Legibility (C11)0.252 0.539 0.791 −0.286
Interior to exterior connection (C12)0.612 0.623 1.235 −0.011
Barrier-free sidewalks (C13)0.746 0.610 1.356 0.135
Route pattern (C14)0.733 0.589 1.322 0.143
Sufficient lighting (C15)0.567 0.548 1.114 0.019
High-density vegetation (C21)0.674 0.704 1.378 −0.029
High-quality vegetation (C22)0.879 0.786 1.665 0.093
Water features (C23)0.791 0.732 1.523 0.059
Waste arrangement (C24)0.471 0.459 0.929 0.012
Natural art design (C25)0.510 0.645 1.155 −0.134
Seats on pathways (C31)0.693 0.893 1.586 −0.200
Access to life facilities (C32)0.714 0.778 1.492 −0.064
Co-maintenance spaces (C33)0.917 0.723 1.639 0.194
Intimate seating (C34)0.588 0.824 1.413 −0.236
Multifunctional space (C35)0.910 0.779 1.689 0.131
Historical and cultural heritage (C36)0.664 0.490 1.154 0.174
Table A5. The un-weighted supermatrix W α .
CriteriaC11C12C13C14C15C21C22C23C24C25C31C32C33C34C35C36
C110.114 0.189 0.191 0.186 0.203 0.167 0.176 0.175 0.173 0.178 0.166 0.166 0.186 0.176 0.155 0.198
C120.216 0.135 0.241 0.246 0.222 0.201 0.212 0.206 0.179 0.216 0.164 0.207 0.169 0.158 0.218 0.202
C130.273 0.222 0.138 0.236 0.229 0.200 0.211 0.207 0.240 0.191 0.221 0.200 0.206 0.199 0.218 0.179
C140.225 0.248 0.222 0.139 0.200 0.208 0.209 0.213 0.191 0.194 0.205 0.205 0.226 0.217 0.212 0.204
C150.173 0.205 0.207 0.193 0.147 0.224 0.193 0.199 0.217 0.221 0.244 0.222 0.213 0.250 0.198 0.217
C210.180 0.185 0.218 0.197 0.181 0.149 0.236 0.221 0.195 0.254 0.193 0.212 0.250 0.191 0.224 0.228
C220.246 0.265 0.246 0.244 0.259 0.268 0.170 0.252 0.278 0.246 0.242 0.272 0.261 0.264 0.257 0.221
C230.211 0.253 0.225 0.238 0.252 0.226 0.232 0.156 0.264 0.252 0.234 0.234 0.199 0.219 0.212 0.212
C240.096 0.111 0.101 0.132 0.100 0.131 0.163 0.163 0.086 0.114 0.116 0.108 0.130 0.135 0.149 0.098
C250.266 0.185 0.209 0.189 0.209 0.227 0.198 0.209 0.177 0.134 0.215 0.173 0.160 0.190 0.158 0.241
C310.168 0.159 0.197 0.195 0.184 0.190 0.193 0.203 0.224 0.193 0.134 0.209 0.205 0.227 0.205 0.216
C320.227 0.203 0.193 0.202 0.164 0.147 0.179 0.169 0.170 0.171 0.213 0.117 0.183 0.176 0.191 0.153
C330.146 0.163 0.173 0.158 0.155 0.192 0.165 0.154 0.169 0.150 0.181 0.193 0.116 0.173 0.163 0.156
C340.170 0.154 0.157 0.179 0.176 0.190 0.186 0.183 0.172 0.153 0.195 0.186 0.197 0.133 0.193 0.182
C350.177 0.206 0.184 0.164 0.197 0.160 0.160 0.149 0.155 0.140 0.173 0.190 0.186 0.185 0.122 0.201
C360.113 0.114 0.096 0.102 0.124 0.120 0.117 0.143 0.110 0.193 0.104 0.105 0.114 0.106 0.126 0.091
Table A6. The weighted supermatrix W .
CriteriaC11C12C13C14C15C21C22C23C24C25C31C32C33C34C35C36
C110.038 0.063 0.064 0.062 0.067 0.052 0.055 0.054 0.054 0.055 0.053 0.054 0.060 0.057 0.050 0.064
C120.072 0.045 0.080 0.082 0.074 0.062 0.066 0.064 0.055 0.067 0.053 0.067 0.055 0.051 0.070 0.065
C130.091 0.074 0.046 0.078 0.076 0.062 0.065 0.064 0.075 0.059 0.071 0.064 0.066 0.064 0.070 0.058
C140.075 0.083 0.074 0.046 0.066 0.065 0.065 0.066 0.059 0.060 0.066 0.066 0.073 0.070 0.068 0.066
C150.057 0.068 0.069 0.064 0.049 0.069 0.060 0.062 0.067 0.069 0.079 0.072 0.069 0.081 0.064 0.070
C210.056 0.058 0.068 0.061 0.056 0.048 0.077 0.072 0.063 0.083 0.064 0.070 0.082 0.063 0.074 0.075
C220.077 0.082 0.076 0.076 0.080 0.087 0.055 0.082 0.090 0.080 0.080 0.090 0.086 0.087 0.085 0.073
C230.066 0.079 0.070 0.074 0.078 0.073 0.076 0.051 0.086 0.082 0.077 0.077 0.066 0.072 0.070 0.070
C240.030 0.035 0.031 0.041 0.031 0.043 0.053 0.053 0.028 0.037 0.038 0.036 0.043 0.045 0.049 0.032
C250.083 0.058 0.065 0.059 0.065 0.074 0.064 0.068 0.058 0.044 0.071 0.057 0.053 0.063 0.052 0.079
C310.060 0.057 0.070 0.070 0.066 0.069 0.071 0.074 0.082 0.071 0.047 0.073 0.071 0.079 0.071 0.075
C320.081 0.073 0.069 0.072 0.059 0.054 0.065 0.062 0.062 0.062 0.074 0.041 0.064 0.061 0.066 0.053
C330.052 0.058 0.062 0.056 0.055 0.070 0.060 0.056 0.062 0.055 0.063 0.067 0.040 0.060 0.057 0.054
C340.061 0.055 0.056 0.064 0.063 0.069 0.068 0.067 0.063 0.056 0.068 0.065 0.069 0.046 0.067 0.063
C350.063 0.074 0.066 0.058 0.070 0.058 0.058 0.054 0.057 0.051 0.060 0.066 0.065 0.064 0.043 0.070
C360.040 0.041 0.034 0.037 0.044 0.044 0.043 0.052 0.040 0.070 0.036 0.037 0.040 0.037 0.044 0.032
Table A7. The influential weights of DANP when lim z ( W ) z .
CriteriaC11C12C13C14C15C21C22C23C24C25C31C32C33C34C35C36
IWs0.038 0.063 0.064 0.062 0.067 0.052 0.055 0.054 0.054 0.055 0.053 0.054 0.060 0.057 0.050 0.064

References

  1. Lopez, R.P.; Hynes, H.P. Obesity, physical activity, and the urban environment: Public health research needs. J. Environ. Health 2006, 5, 25. [Google Scholar] [CrossRef] [PubMed] [Green Version]
  2. Velarde, M.D.; Fry, G.; Tveit, M. Health effects of viewing landscapes—Landscape types in environmental psychology. Urban For. Urban Green. 2007, 6, 199–212. [Google Scholar] [CrossRef]
  3. Gesler, W.M. Therapeutic landscapes: Medical issues in light of the new cultural geography. Soc. Sci. Med. 1992, 34, 735–746. [Google Scholar] [CrossRef]
  4. Tzoulas, K.; Korpela, K.; Venn, S.; Yli-Pelkonen, V.; Kazmierczak, A.; Niemela, J.; James, P. Promoting ecosystem and human health in urban areas using Green Infrastructure: A literature review. Landsc. Urban Plan. 2007, 81, 167–178. [Google Scholar] [CrossRef]
  5. Thompson, C.W. Linking landscape and health: The recurring theme. Landsc. Urban Plan. 2011, 99, 187–195. [Google Scholar] [CrossRef]
  6. Thompson, C.W. Urban open space in the 21st century. Landsc. Urban Plan. 2002, 60, 59–72. [Google Scholar] [CrossRef]
  7. Kellet, J.; Rofe, M. Creating Active Communities: How Can Open and Public Spaces in Urban and Suburban Environments Support Active Living?: A Literature Review; Institute for Sustainable Systems and Technologies, University of South Australia: Adelaide, Australia, 2009; pp. 7–11. [Google Scholar]
  8. Yung, E.H.; Conejos, S.; Chan, E.H. Social needs of the elderly and active aging in public open spaces in urban renewal. Cities 2016, 52, 114–122. [Google Scholar] [CrossRef]
  9. World Health Organization. World Report on Ageing and Health; World Health Organization: Geneva, Switzerland, 2015; Available online: Http://apps.who.int/iris/bitstream/10665/186463/1/9789240694811_eng.pdf (accessed on 10 May 2016).
  10. World Health Organization. Multisectoral Action for a Life Course Approach to Healthy Ageing: Draft Global Strategy and Plan of Action on Ageing and Health; World Health Organization: Geneva, Switzerland, 2016; Available online: http://apps.who.int/gb/ebwha/pdf_files/WHA69/A69_17-en.pdf (accessed on 5 October 2016).
  11. Carstens, D.Y. Outdoor spaces in housing for the elderly. In People Places: Design Guidlines for Urban Open Space, 1st ed.; Marcus, C.C., Francis, C., Eds.; John Wiley & Sons: New York, NY, USA, 1997; pp. 209–258. [Google Scholar]
  12. Yung, E.H.; Conejos, S.; Chan, E.H. Public open spaces planning for the elderly: The case of dense urban renewal districts in Hong Kong. Land Use Policy 2016, 59, 1–11. [Google Scholar] [CrossRef]
  13. Aspinall, P.A.; Thompson, C.W.; Alves, S.; Sugiyama, T.; Brice, R.; Vickers, A. Preference and relative importance for environmental attributes of neighbourhood open space in older people. Environ. Plan. B 2010, 37, 1022–1039. [Google Scholar] [CrossRef]
  14. Rodin, J. Aging and health: Effects of the sense of control. Science 1986, 233, 1271–1276. [Google Scholar] [CrossRef] [PubMed]
  15. Bell, P.A.; Greene, T.C.; Fisher, J.D.; Baum, A. Chapter 4: Theories of Environment-Behavior Relationships. In Environmental Psychology, 4nd ed.; Harcourt Brace College Publishers: Fort Worth, TX, USA, 1996; pp. 128–129 and 506–507. [Google Scholar]
  16. Lawton, M.P. Environment and other determinants of well-being in older people. Gerontologist 1986, 23, 349–357. [Google Scholar] [CrossRef]
  17. Wahl, H.W.; Weisman, G.D. Environmental gerontology at the beginning of the new millennium: Reflections on its historical, empirical, and theoretical development. Gerontologist 2003, 43, 616–627. [Google Scholar] [CrossRef] [PubMed]
  18. Milligan, C.; Gatrell, A.; Bingley, A. “Cultivating health”: Therapeutic landscapes and older people in northern England. Soc. Sci. Med. 2004, 58, 1781–1793. [Google Scholar] [CrossRef]
  19. Sugiyama, T.; Thompson, C.W. Outdoor environments, activity and the well-being of older people: Conceptualising environmental support. Environ. Plan. A. 2007, 39, 1943–1960. [Google Scholar] [CrossRef]
  20. Booth, M.L.; Owen, N.; Bauman, A.; Clavisi, O.; Leslie, E. Social–cognitive and perceived environment influences associated with physical activity in older Australians. Prev. Med. 2000, 31, 15–22. [Google Scholar] [CrossRef] [PubMed]
  21. Maas, J.; Verheij, R.A.; Spreeuwenberg, P.; Groenewegen, P.P. Physical activity as a possible mechanism behind the relationship between green space and health: A multilevel analysis. Public Health 2008, 8, 1. [Google Scholar] [CrossRef] [PubMed]
  22. Michael, Y.L.; Green, M.K.; Farquhar, S.A. Neighborhood design and active aging. Health Place 2006, 12, 734–740. [Google Scholar] [CrossRef] [PubMed]
  23. Sugiyama, T.; Thompson, C.W.; Alves, S. Associations between neighborhood open space attributes and quality of life for older people in Britain. Environ. Behav. 2009, 41, 3–21. [Google Scholar] [CrossRef]
  24. Shen, K.Y.; Yan, M.R.; Tzeng, G.H. Combining VIKOR-DANP model for glamor stock selection and stock performance improvement. Knowl. Based Syst. 2014, 58, 86–97. [Google Scholar] [CrossRef]
  25. Clarke, P.; Nieuwenhuijsen, E.R. Environments for healthy ageing: A critical review. Maturitas 2009, 64, 14–19. [Google Scholar] [CrossRef] [PubMed]
  26. Yen, I.H.; Syme, S.L. The social environment and health: A discussion of the epidemiologic literature. Annu. Rev. Publ. Health 1999, 20, 287–308. [Google Scholar] [CrossRef] [PubMed]
  27. Shumway-Cook, A.; Patla, A.; Stewart, A.; Ferrucci, L.; Ciol, M.A.; Guralnik, J.M. Environmental Components of Mobility Disability in Community-Living Older Persons. J. Am. Geriatr. Soc. 2003, 51, 393–398. [Google Scholar] [CrossRef] [PubMed]
  28. Wahl, H.W.; Lang, F.R. Aging in context across the adult life course: Integrating physical and social environmental research perspectives. Annu. Rev. Gerontol. Geriat. 2003, 23, 1–33. [Google Scholar]
  29. Walker, A.; Aspalter, C. Active Ageing In Mainland China. In Active Ageing in Asia, 1st ed.; Routledge: London, UK, 2014; p. 127. [Google Scholar]
  30. Lyndhurst, B. Sustainable Cities and the Ageing Society: The Role of Older People in an Urban Renaissance; Office of the Deputy Prime Minister: London, UK, 2004; pp. 23–30. [Google Scholar]
  31. Sugiyama, T.; Thompson, C.W. Older people’s health, outdoor activity and supportiveness of neighbourhood environments. Landsc. Urban Plan. 2007, 83, 168–175. [Google Scholar] [CrossRef]
  32. Bean, J.F.; Vora, A.; Frontera, W.R. Benefits of exercise for community-dwelling older adults. Arch. Phys. Med. Rehabil. 2004, 85, 31–42. [Google Scholar] [CrossRef]
  33. Singh, M.A.F. Exercise comes of age rationale and recommendations for a geriatric exercise prescription. J. Gerontol. A Biol. 2002, 57, M262–M282. [Google Scholar] [CrossRef]
  34. Thompson, C.W.; Sugiyama, T.; Alves, S.; Southwell, K. Parks and Open Spaces: Design Findings and Recommendations. I’DGO-Inclusive Design for Getting Outdoors. Edinburgh: OPENspace. Last updated 10 June 2007. Available online: Http://www.idgo.ac.uk/design_guidance/open_spaces.htm#landscape (accessed on 17 May 2016).
  35. Turel, H.S.; Yigit, E.M.; Altug, I. Evaluation of elderly people’s requirements in public open spaces: A case study in Bornova District (Izmir, Turkey). Build. Environ. 2007, 42, 2035–2045. [Google Scholar] [CrossRef]
  36. De Vries, S.; Verheij, R.A.; Groenewegen, P.P.; Spreeuwenberg, P. Natural environments—Healthy environments? An exploratory analysis of the relationship between greenspace and health. Environ. Plan. A. 2003, 35, 1717–1731. [Google Scholar] [CrossRef]
  37. Takano, T.; Nakamura, K.; Watanabe, M. Urban residential environments and senior citizens’ longevity in megacity areas: The importance of walkable green spaces. J. Epidemiol. Community Health 2002, 56, 913–918. [Google Scholar] [CrossRef] [PubMed]
  38. Maller, C.; Townsend, M.; Pryor, A.; Brown, P.; St Leger, L. Healthy nature healthy people: ‘Contact with nature’ as an upstream health promotion intervention for populations. Health Promot. Int. 2006, 21, 45–54. [Google Scholar] [CrossRef] [PubMed]
  39. De Vries, S. Nearby nature and human health: Looking at mechanisms and their implications. In Innovative Approaches to Researching Landscape and Health: Open Space: People Space 2, 1st ed.; Thompson, W.C., Aspinall, P., Bell, S., Eds.; Routledge: London, UK, 2010; pp. 77–96. [Google Scholar]
  40. Van den Berg, A.; Joye, Y.; De Vries, S. Chapter5: Health benefits of nature. In Environmental Psychology: An Introduction, 1st ed.; Steg, L., van den Berg, A.E., De Groot, J.I., Eds.; The British Psychological Society: Chichester, UK, 2012; pp. 50–55. [Google Scholar]
  41. Kemperman, A.; Timmermans, H. Green spaces in the direct living environment and social contacts of the aging population. Landsc. Urban Plan. 2014, 129, 44–54. [Google Scholar] [CrossRef]
  42. Finlay, J.; Franke, T.; McKay, H.; Sims-Gould, J. Therapeutic landscapes and wellbeing in later life: Impacts of blue and green spaces for older adults. Health Place 2015, 34, 97–106. [Google Scholar] [CrossRef] [PubMed]
  43. Moran, M.; van Cauwenberg, J.; Hercky-Linnewiel, R.; Cerin, E.; Deforche, B.; Plaut, P. Understanding the relationships between the physical environment and physical activity in older adults: A systematic review of qualitative studies. Int. J. Behav. Nutr. Phys. 2014, 11, 79. [Google Scholar] [CrossRef] [PubMed] [Green Version]
  44. Suter, E.; Baylin, D. Choosing art as a complement to healing. Appl. Nurs. Res. 2007, 20, 32–38. [Google Scholar] [CrossRef] [PubMed]
  45. Steptoe, A.; Shankar, A.; Demakakos, P.; Wardle, J. Social isolation, loneliness, and all-cause mortality in older men and women. Proc. Natl. Acad. Sci. USA 2013, 110, 5797–5801. [Google Scholar] [CrossRef] [PubMed]
  46. Kuo, F.E.; Sullivan, W.C.; Coley, R.L.; Brunson, L. Fertile ground for community: Inner-city neighborhood common spaces. Am. J. Commun. Psychol. 1998, 26, 823–851. [Google Scholar] [CrossRef]
  47. Greenbaum, S.D. Bridging ties at the neighborhood level. Soc. Netw. 1982, 4, 367–384. [Google Scholar] [CrossRef]
  48. Langer, E.J.; Rodin, J. The effects of choice and enhanced personal responsibility for the aged: A field experiment in an institutional setting. J. Pers. Soc. Psychol. 1976, 34, 191. [Google Scholar] [CrossRef] [PubMed]
  49. Van Cauwenberg, J.; van Holle, V.; de Bourdeaudhuij, I.; Clarys, P.; Nasar, J.; Salmon, J.; Deforche, B. Physical environmental factors that invite older adults to walk for transportation. J. Environ. Psychol. 2014, 38, 94–103. [Google Scholar] [CrossRef] [Green Version]
  50. Doughty, K. Walking together: The embodied and mobile production of a therapeutic landscape. Health Place 2013, 24, 140–146. [Google Scholar] [CrossRef] [PubMed]
  51. Karmanov, D.; Hamel, R. Assessing the restorative potential of contemporary urban environment(s): Beyond the nature versus urban dichotomy. Landsc. Urban Plan. 2008, 86, 115–125. [Google Scholar] [CrossRef]
  52. Thompson, C.W. Activity, exercise and the planning and design of outdoor spaces. J. Environ. Psychol. 2013, 34, 79–96. [Google Scholar] [CrossRef]
  53. I’DGO TOO. Behaviour Setting Surveys and Behavioural Observations. Available online: http://www.idgo.ac.uk/theories_and_methods/researchtools.htm (accessed on 10 May 2016).
  54. Kitzinger, J. Qualitative research. Introducing focus groups. Br. Med. J. 1995, 311, 299. [Google Scholar] [CrossRef]
  55. Tzeng, G.H.; Huang, J.J. Multiple Attribute Decision Making—Methods and Applications; CRC Press: New York, NY, USA, 2011; p. 349. [Google Scholar]
  56. Liou, J.H.; Tzeng, G.H. Comments on “Multiple criteria decision making (MCDM) methods in economics: An overview”. Technol. Econ. Dev. Econ. 2012, 18, 672–695. [Google Scholar] [CrossRef]
  57. Liou, J.H. New concepts and trends of MCDM for tomorrow—In honor of Professor Gwo-Hshiung Tzeng on the occasion of his 70th birthday. Technol. Econ. Dev. Econ. 2013, 19, 367–375. [Google Scholar] [CrossRef]
  58. Hu, S.K.; Lu, M.T.; Tzeng, G.H. Exploring smart phone improvements based on a hybrid MCDM model. Expert Syst. Appl. 2014, 41, 4401–4413. [Google Scholar] [CrossRef]
  59. Liou, J.H.; Tamosaitiene, J.; Zavadskas, E.; Tzeng, G.H. A new hybrid COPRAS-G MADM model for improving and selecting suppliers in green supply chain management. Int. J. Prod. Res. 2016, 54, 114–134. [Google Scholar] [CrossRef]
  60. Lu, I.Y.; Kuo, T.; Lin, T.S.; Tzeng, G.H.; Huang, S.L. Multicriteria decision analysis to develop effective sustainable development strategies for enhancing competitive advantages: Case of the TFT-LCD industry in Taiwan. Sustainability 2016, 8, 646. [Google Scholar] [CrossRef]
  61. Liu, C.H.; Tzeng, G.H.; Lee, M.H. Strategies for improving cruise product sales using hybrid “multiple criteria decision making” models. Serv. Ind. J. 2013, 33, 542–563. [Google Scholar] [CrossRef]
  62. Ou Yang, Y.P.; Shieh, H.M.; Tzeng, G.H. A VIKOR technique based on DEMATEL and ANP for information security risk control assessment. Inf. Sci. 2013, 232, 482–500. [Google Scholar] [CrossRef]
  63. Hung, Y.H.; Chou, S.C.T.; Tzeng, G.H. Knowledge management adoption and assessment for SMEs by a novel MCDM approach. Decis. Support Syst. 2011, 51, 270–291. [Google Scholar] [CrossRef]
  64. Saaty, T.L. Decision Making with Dependence and Feedback: The Analytic Network Process; RWS Publications: Pittsburgh, PA, USA, 1996. [Google Scholar]
  65. Opricovic, S.; Tzeng, G.H. Compromise solution by MCDM methods: A comparative analysis of VIKOR and TOPSIS. Eur. J. Oper. Res. 2004, 156, 445–455. [Google Scholar] [CrossRef]
  66. Opricovic, S.; Tzeng, G.H. Extended VIKOR method in comparison with outranking methods. Eur. J. Oper. Res. 2007, 178, 514–529. [Google Scholar] [CrossRef]
  67. Chiu, W.Y.; Tzeng, G.H.; Li, H.L. A new hybrid MCDM model combining DANP with VIKOR to improve e-store business. Knowl. Based Syst. 2013, 37, 48–61. [Google Scholar] [CrossRef]
  68. The Midterm Assessment Report of 12th Five-Year Planning of Harbin Aging Enterprise. Available online: www.hrbllw.gov.cn/attachment/20150511095602498.doc (accessed on 19 May 2016).
  69. 13th Five-Year Planning of Harbin Aging Enterprise. Available online: www.hrbllw.gov.cn/attachment/20160509090849939.doc (accessed on 2 July 2016).
  70. Wilson, J.Q.; Kelling, G.L. Broken windows. In Critical Issues in Policing: Contemporary Readings, 1st ed.; Dunham, R., Alpert, G., Eds.; Waveland Press: Long Grove, IL, USA, 1989; pp. 395–407. [Google Scholar]
  71. Gibson, B.D.; Werner, C. Airport waiting areas as behavior settings: The role of legibility cues in communicating the setting program. J. Pers. Soc. Psychol. 1994, 66, 1049. [Google Scholar] [CrossRef]
  72. Kane, R.A. Accomplishments, problems, trends and future challenges. In Assessing Older Persons: Measures, Meaning, and Practical Applications, 1st ed.; Kane, R.L., Kane, R.A., Eds.; Oxford University Press: Oxford, UK, 2000; p. 526. [Google Scholar]
  73. Ou Yang, Y.P.; Shieh, H.M.; Leu, J.D.; Tzeng, G.H. A novel hybrid MCDM model combined with DEMATEL and ANP with applications. Int. J. Oper. Prod. Manag. 2008, 5, 160–168. [Google Scholar]
  74. Hu, K.H.; Chen, F.H.; Tzeng, G.H. Evaluating the Improvement of Sustainability of Sports Industry Policy Based on MADM. Sustainability 2016, 8, 606. [Google Scholar] [CrossRef]
  75. Huang, K.W.; Huang, J.H.; Tzeng, G.H. New hybrid multiple attribute decision-making model for improving competence sets: Enhancing a company’s core competitiveness. Sustainability 2016, 8, 175. [Google Scholar] [CrossRef]
  76. Lu, M.T.; Lin, S.W.; Tzeng, G.H. Improving RFID adoption in Taiwan’s healthcare industry based on a DEMATEL technique with a hybrid MCDM model. Decis. Support Syst. 2013, 56, 259–269. [Google Scholar] [CrossRef]
  77. Lu, M.T.; Tzeng, G.H.; Cheng, H.; Hsu, C.C. Exploring mobile banking services for user behavior in intention adoption: Using new hybrid MADM model. Serv. Bus. 2015, 9, 541–565. [Google Scholar] [CrossRef]
Figure 1. Constructing environmental attributes.
Sustainability 09 00420 g001
Figure 2. Model procedure for new multiple criteria decision making for creating the best sustainable improvement strategies.
Sustainability 09 00420 g002
Figure 3. The plan of the main campus of HIT.
Sustainability 09 00420 g003
Figure 4. Images of the POS.
Sustainability 09 00420 g004
Figure 5. The INRM (influential network relation map) of total influence relationships.
Sustainability 09 00420 g005
Table 1. The evaluation factors for the pretest.
No.CriteriaDescriptionsAuthors
M1LegibilityIndicators (orientation boards, information-communication panels, or hazard indicators) should provide elderly people with continuous, effective, and adequate service information about their surroundings and be located in visible places at pedestrian decision-making points. They should be optimally designed in combination with other design factors.[8,34,35]
M2Interior to exterior connectionTransitional spaces (those between POS and non-POS, or spaces linking different subareas in POS) that are easily found and lack barriers to the mobility of elderly people.[8,23,34]
M3Barrier-free sidewalksPedestrian-oriented sidewalk designs that account for the needs of elderly people, including appropriate widths for the sidewalk and its security band; appropriate heights and widths for the ramps and stairs; and a sidewalk texture that is matte and easy to walk on.[13,25,35]
M4Route pattern Continuous circulation routes with favorable connectivity and hierarchy, providing choices of physical activity such as brisk walking, slow jogging, or strolling.[8,13,34]
M5Sufficient lightingLighting with suitable luminaire selection, brightness settings, and location, providing suitable transition and uniformity of luminance and high clarity of visual information, ensuring the safety of nighttime activity.[8,25,34]
M6Traffic calming Reasonable installation of deceleration strips, crosswalks, and pedestrian overpasses or underpasses that elderly pedestrians can use to cross roadways.[9,22,34]
N1High-density vegetationLeafy and healthy plants that provide ample visual relief with natural color and adjustment of sunlight.[13,34,41]
N2High-quality vegetationPlants and trees with suitable location, collocation, and seasonal interest; there should be sufficient “net free space” under plantings.[11,23,34,42,43]
N3Water featuresBlue spaces designed with suitable natural forms of water (gaseous, liquid, or solid), visual forms, and facilities with water available. These provide elderly people with positive mood effects, attractiveness, and perceived restorative abilities.[13,42,43]
N4Waste arrangementA sufficient number of trash containers should be set up in crowded places (near the entrances of buildings and activity areas) to collect pedestrian or dog waste.[8,13,23,34,35,38,43]
N5Natural art designPublic art with pleasing appearance that is in harmony with the natural environment and can provide visual relief and topics of discussion.[22,34,44]
N6Micro-climate Natural elements design for wind controlled, light and shadow management[11,23,42]
S1Seats on pathways Comfortable seating with suitable orientation and location for better visual contact, such as seating areas facing busy sidewalks.[11,13,34]
S2Access to life facilitiesClose to life service facilities, such as public toilets, restaurants, shops, cafes and so on, in order to provide more opportunities for social contact.[9,13,22,23,25,34]
S3Co-maintenance spacesCommunal areas for the elderly’s coordinate maintenance, such as a communal garden providing gardening activities.[18,46]
S4Intimate seatingSmall-scale enclosure seating provided for private conversations between elderly people with strong social ties.[8,11,23,34]
S5Multifunctional spacesA flexible space for different groups of people to participate in various activities during the day and night.[8,11,34]
S6Play areas for childrenSpace suitable for children to play and multi-generational enjoyment.[11,23,34]
S7Historical and cultural heritageObjects with cultural and historical information, historic buildings, or cultural elements, which can enhance local identity and sense of belonging. [8,43,49,51]
Table 2. The performance evaluation of the case study using VIKOR.
Dimensions/CriteriaInfluential Weights (IWs)ElderlyExpertIntegration
Local WeightGlobal WeightPerformanceGapPerformanceGapPerformanceGap
Mobility (D1)0.322 6.6580.3345.4440.4566.3970.360
Legibility (C11)0.1750.0566.7470.3254.5250.5486.2690.373
Interior to exterior connection (C12)0.2000.0646.6370.3365.1750.4836.3230.368
Barrier-free sidewalks (C13)0.2100.0686.7260.3275.0750.4936.3710.363
Route pattern (C14)0.2080.0677.1230.2886.4250.3586.9730.303
Sufficient lighting (C15)0.2070.0676.0680.3935.8750.4136.0270.397
Nature enjoyment (D2)0.322 5.7080.4293.6560.6345.2670.473
High-density vegetation (C21)0.2070.0677.1100.2895.6000.4406.7850.322
High-quality vegetation (C22)0.2480.0806.3630.3644.5500.5455.9730.403
Water features (C23)0.2250.0733.8900.6110.9500.9053.2580.674
Waste arrangement (C24)0.1230.0404.2400.5762.5500.7453.8760.612
Natural art design (C25)0.1960.0636.4110.3594.2750.5735.9520.405
Social interaction (D3)0.356 6.5180.3484.7330.5276.1340.387
Seats on pathways (C31)0.1920.0697.1230.2885.6250.4386.8010.320
Access to life facilities (C32)0.1790.0646.9860.3014.9500.5056.5480.345
Co-maintenance spaces (C33)0.1630.0584.3970.5602.2750.7733.9410.606
Intimate seating (C34)0.1760.0637.0070.2994.5500.5456.4780.352
Multifunctional space (C35)0.1710.0616.6440.3364.9000.5106.2690.373
Historical and cultural heritage (C36)0.1180.0426.8490.3156.3750.3636.7470.325
Total Performance 6.302 4.615 5.939
Total Gap (ratio) 0.370 0.539 0.406

