Article

Sustainable Pavement Management System in Urban Areas Considering the Vehicle Operating Costs

Department of Civil, Constructional and Environmental Engineering, Università degli Studi di Roma “La Sapienza”, DICEA—via Eudossiana, 18, Rome 00184, Italy
*
Author to whom correspondence should be addressed.
Sustainability 2017, 9(3), 453; https://doi.org/10.3390/su9030453
Submission received: 17 February 2017 / Revised: 15 March 2017 / Accepted: 16 March 2017 / Published: 19 March 2017
(This article belongs to the Section Sustainable Engineering and Science)

Abstract

:
Urban roads constitute most of the existing roads and they are directly managed by small administrations. Normally, these small administrations do not have sufficient funds or sufficient qualified personnel to carry out this task. This paper deals with an easy-implementation Pavement Management System (PMS) to develop strategies to maintain, preserve and rehabilitate urban roads. The proposed method includes the creation of the road network inventory, the visual surveys of the pavement and the evaluation of its condition by the Pavement Condition Index (PCI). The method intends to give a valid tool to road managers to compare alternative maintenance strategies and perform the priority analysis on the network. With this aim, the procedure assesses the Vehicle Operating Costs (VOC) by a written regression between PCI and International Roughness Index (IRI). The proposed method has several advantages because it can be easily adapted to various situations and it does not require a large amount of time and money for its implementation.

1. Introduction

The maintenance management systems have been applied to roads since the 1970s and they generally are considered a good and useful aid for the road manager. Since that time, these systems have been widely applied to the Pavement Management Systems and the acronym PMS became very popular in many countries in both America and Europe. The developed pavement management process provides a systematic and consistent method for selecting Maintenance, Repair and Rehabilitation (M, R&R) needs and determining priorities and the optimal time for repair by predicting future pavement condition [1,2,3].
A PMS includes several steps: pavement distress survey, pavement evaluation, Life-Cycle Cost Analysis (LCCA) and, finally, the definition of maintenance strategies [4,5,6,7,8,9]. A proper definition of PMS allows the reduction of overall road costs (construction and maintenance) as well as traffic disruptions.
Nevertheless, as time goes by and the benefit of their use has become evident, many studies have been done to adapt these methods to other features of the roads and some systems referring to the whole road asset were defined. For example, global indexes considering pavement, marking and road signs, roadside barriers and road structures [10,11,12,13] were developed. At any rate, most of the maintenance management systems were created to manage large networks and therefore they refer to major road and airport infrastructures. Nowadays, because of the economic crisis, even the small administrations are trying to find an effective tool to allocate their reduced budget on their road property. In particular, municipalities have to face the maintenance of a huge number of roads with a reduced budget. Moreover, urban roads are a large percentage of total roads in most of the countries all over the world. Particularly, in Italy, they amount to 79% (Figure 1).
The applications of PMS to urban areas are few in the world. Some efforts have been performed to calculate the pavement condition of sidewalks [14] adapting the widely used Pavement Condition Index elaborated by Shahin [2] for roads and airports. In Utah (USA), a transportation infrastructure maintenance management system for a small urban city was developed [15] to assist a municipality in allocating its resources to transport maintenance.
Recently, Chamorro and Tighe [16,17] have proposed the development of distress evaluation guidelines gathering the significant distresses present in the urban networks for the manual as well as automated evaluation with the application to these guidelines in different types of urban network to calibrate and validate an overall condition index for urban pavements [18].
Shah et al. [19] suggest a priority ranking of pavement sections for maintenance. This ranking is performed through an index that weighs the condition of the pavement and the level of traffic to determine on which section to perform maintenance treatments.
Many PMSs include both the visual and automatic surveys in their procedures making the connections among the different indexes understandable. One of the most important features of the urban roads is the evenness that is related to the performance of the road such as skid resistance, noise and user comfort. Considering the total length of a road network, generally, the evenness is measured by high performance equipment (road profiling, profilograph, etc.) that can detect a longitudinal profile in a short period of time and the acquired data are analyzed with the well-known IRI.
These techniques have a wide use in highways and airports, but their application is uncommon in urban roads. The main reason for this scarcity of use is the need of an initial high investment and qualified staff to manage the acquired data. Therefore, the municipalities generally prefer to use a simple visual survey. The solution to this problem can be the use of experimental laws that link the index coming from the visual survey (e.g., PCI) to other indexes resulting from an automatic survey. Recently, pavement researchers have considered the IRI to reappraise urban roads management systems [20,21] relating this index to the pavement condition in terms of PCI which proposed to use previously PCI and IRI data of sections of roadways to establish a relationship between the PCI value and IRI.
One of the major problems of pavement unevenness evaluation with IRI is the speed of the road: the IRI may be used to assess pavement in roads with speed limits above 80 km/h. In the case of urban roads, it is necessary to adapt the IRI thresholds, or use other indexes depending on vehicle speed, noise and user comfort [22,23,24].
Another reason for the limited use of the IRI for urban roads is its irrelevance to those surfaces with localized roughness, such as manholes, small patches, and pavement differences at crossings. Conversely, these distresses can be detected by a visual survey and classified by PCI [25].
Another approach of programming models and maintenance planning was proposed by The World Bank [26] by means of the Highway Development and Management Model (HDM). The model is implemented with a software system strategic analysis, which might be able to help decision makers in their strategic planning [27] by including a Life-Cycle Cost Analysis of the recurrent maintenance requirements. The HDM model is not generally used for preventive maintenance; it is otherwise used for planning and programming of capital activities. It proposes an analytical tool to evaluate budgeting allocation from LCCA considerations. Nevertheless, it is a very complex tool with a large number of PMS functions which constitute the global HDM model that would be adapted to every particular network’s condition through a calibration process to the local needs [1,28].
The World Bank’s HDM research has developed some models on Vehicle Operating Costs (VOC). It begins with the study by De Weille [29] and continued by the development of the Highway Cost Model by Becker [30]. In the 1980s, Zaniewski et al. [31] adapted the VOC model to US conditions. Most of the VOC models were derived from other previous models that have been updated and improved over time. The most recent VOC found in the authors’ research review is the HDM-4 [26]. In the National Cooperative Highway Research Program (NCHRP) Report 720 [32], the calibration of the field tests conducted for the calibration HDM-4 VOC model were described. The report studied the effect of roughness on the main components of the VOC such as fuel consumption, tire wear, repair and maintenance costs.
The absence of a road pavement inventory and maintenance planning is the major problem detected in small town road management in Italy. This situation leads to poor maintenance planning. The maintenance and repair works happen to be performed when the level of distress become critical in some network elements. This results in large inhomogeneity in the network. This situation can be avoided with a sustainable PMS flexible enough to adapt the method to the current situation and future demands.

2. Materials and Methods
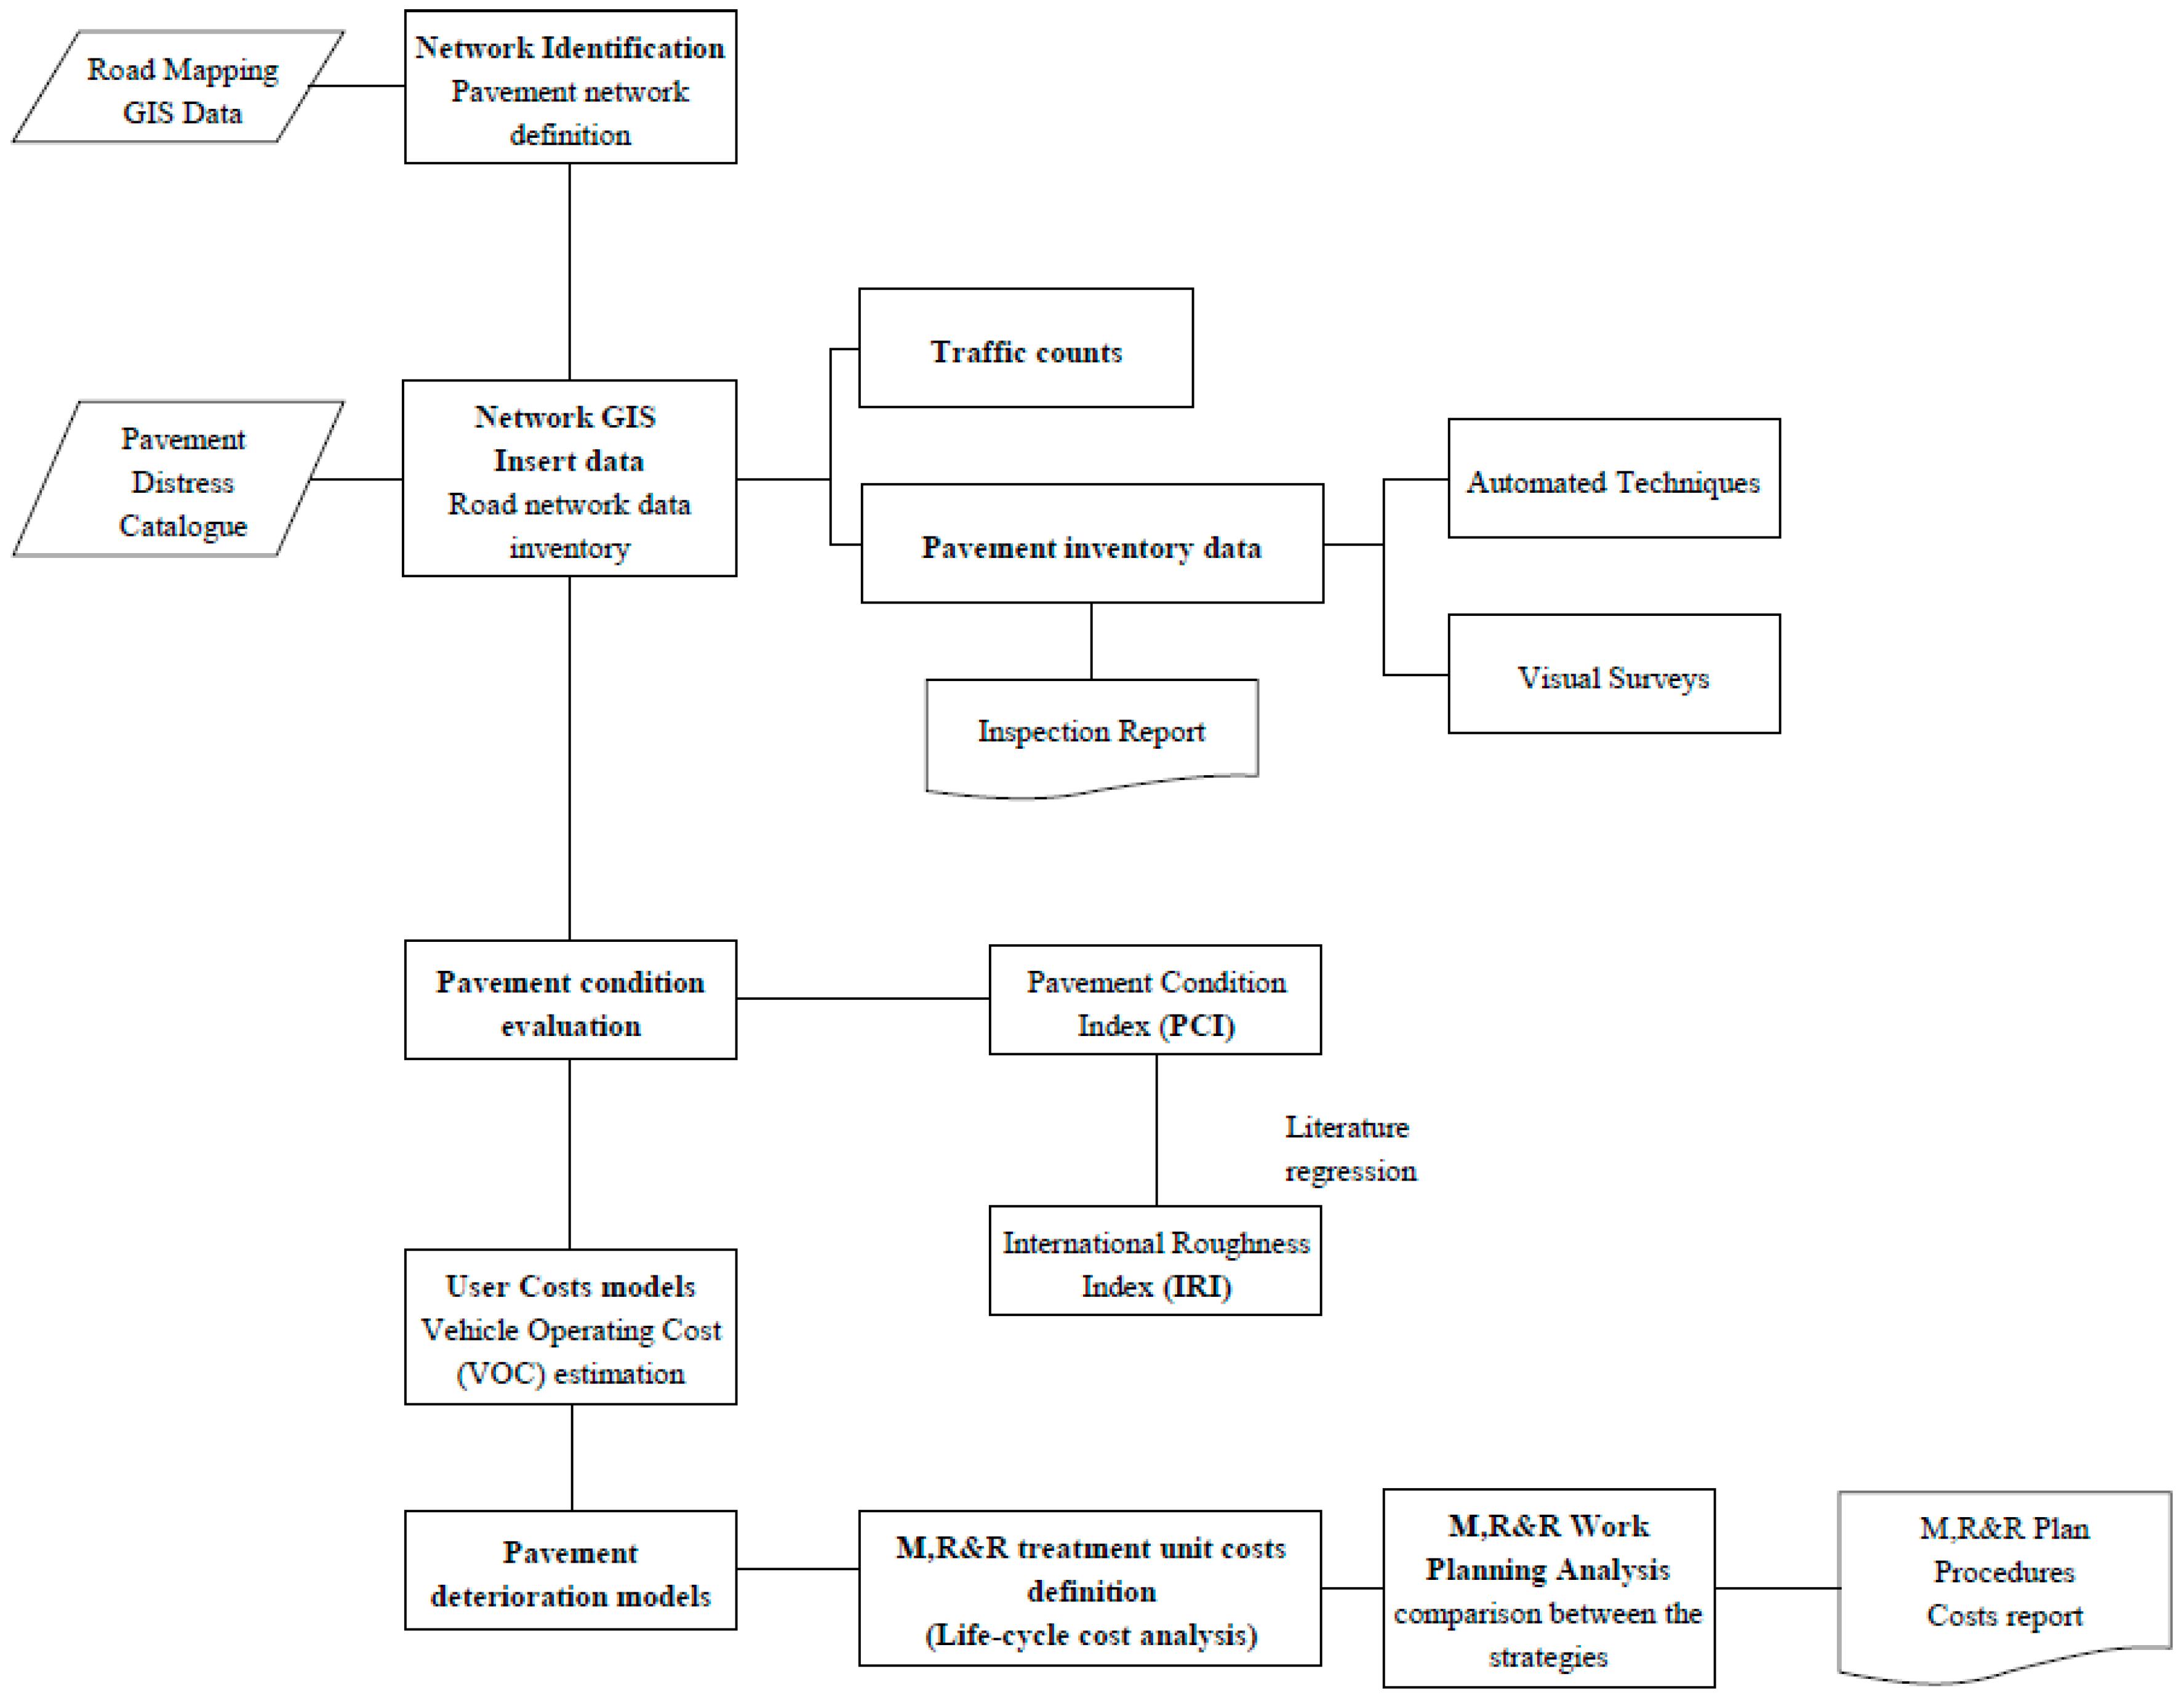
The main objective of this research is the creation of the basis for the implementation of a PMS in urban areas. The proposed PMS aims to develop a new pavement management methodology to include the indirect operating costs induced by the urban vehicles (tire wear costs, repair and maintenance vehicle costs, and fuel consumption) in the network analysis.
The proposed method determines the pavement condition through visual survey as proposed in ASTM D6433 [33]. In regards to the indirect costs, the VOC were considered and calculated to evaluate and prioritize the M, R&R work strategies. Therefore, this method assembles the network pavement condition data with the traffic surveys with the purpose of combining analysis to evaluate the influence of the indirect costs in Maintenance and Repair treatments decision making.
According to the VOC models used, the traffic is directly proportional to the indirect user costs, therefore it can be related to the global pavement distress. Consequently, the user costs play an important role in the decision making process to assess the cost-effectiveness of M, R&R pavement treatments on the urban network.
For example, if the traffic level is the same for two pavement sections A and B (Figure 2), the Repair and maintenance work will be performed in the section with higher rate of deterioration (Section B). However, if the level of traffic in A was much higher than the level of traffic in B, it would be better to perform maintenance works in the section with higher level of traffic (Section A) to mitigate the increase in indirect costs, expressed by VOC. Therefore, the Annual Average Daily Traffic (AADT) and its associated VOC influences the choice of the most suitable M, R&R work strategy.
The described PMS process (Figure 3) has been developed by using visual surveys to assess the distress of pavement. Condition evaluation has been performed by PCI as described in ASTM D6433 American Standard Practice. In the following, the steps of the proposed methodology are listed:
(1)
The method shows the need to create a network pavement inventory, which, in most cases, is non-existent. A Geographical Information System (GIS) is a useful tool to create the network inventory. The network’s elements are divided into sub-units (branches and sections) with homogeneous properties (type of pavement, date of construction, materials, etc.).
(2)
First, the pavement distress catalogue adopted in the ASTM 6433 could be used, but in future phases a specific list of distresses and different levels of severity should be defined.
(3)
The inventory is updated (network GIS insert data) and completed through pavement visual surveys and traffic counts. This step is vital for determining the current state of the network and to include the effect of traffic in the decision making process (VOC).
(4)
The pavement condition evaluation is assessed by the PCI value.
(5)
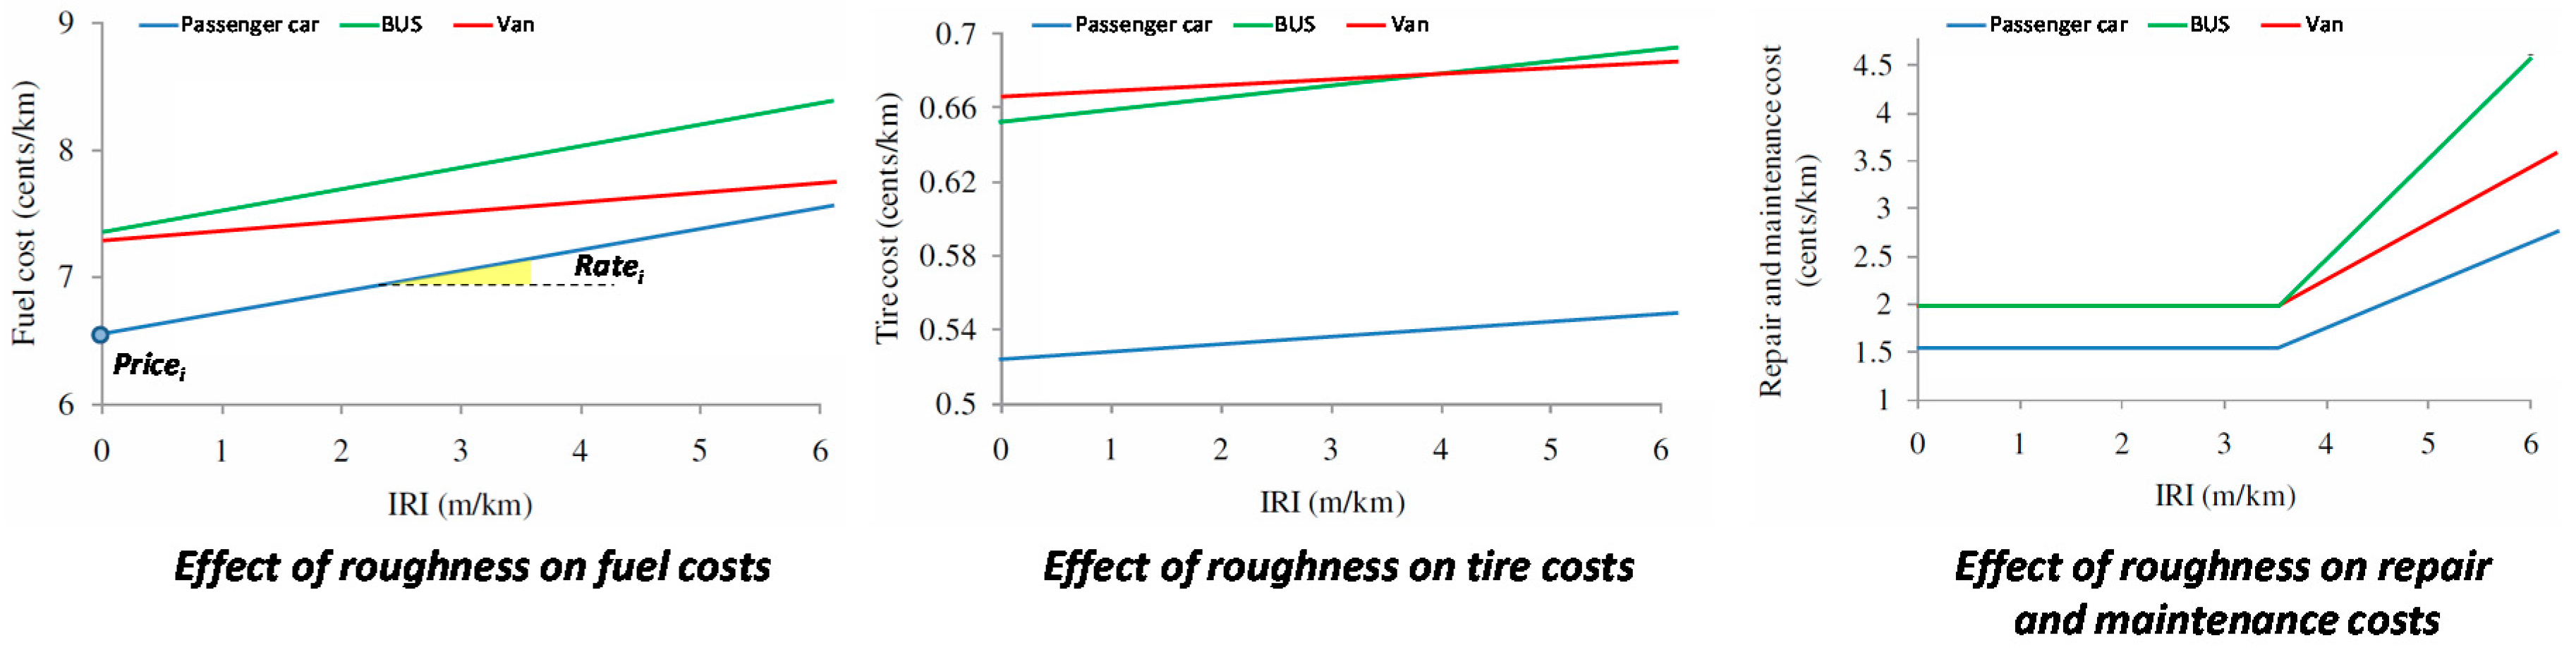
The Vehicle Operating Costs (VOC) is estimated for all the network sections. A written regression between PCI and IRI is used as the relation between IRI and VOC.
(6)
The pavement deterioration models are adopted to predict the pavement condition during pavement life.
(7)
The maintenance and repair treatment unit costs are defined to estimate the total costs of every considered strategy (LCCA) together in comparison to user costs (VOC).
(8)
A comparison among the different strategies is proposed to establish priority in the network sections and to perform the correct choice of M, R&R strategy.

3. Results

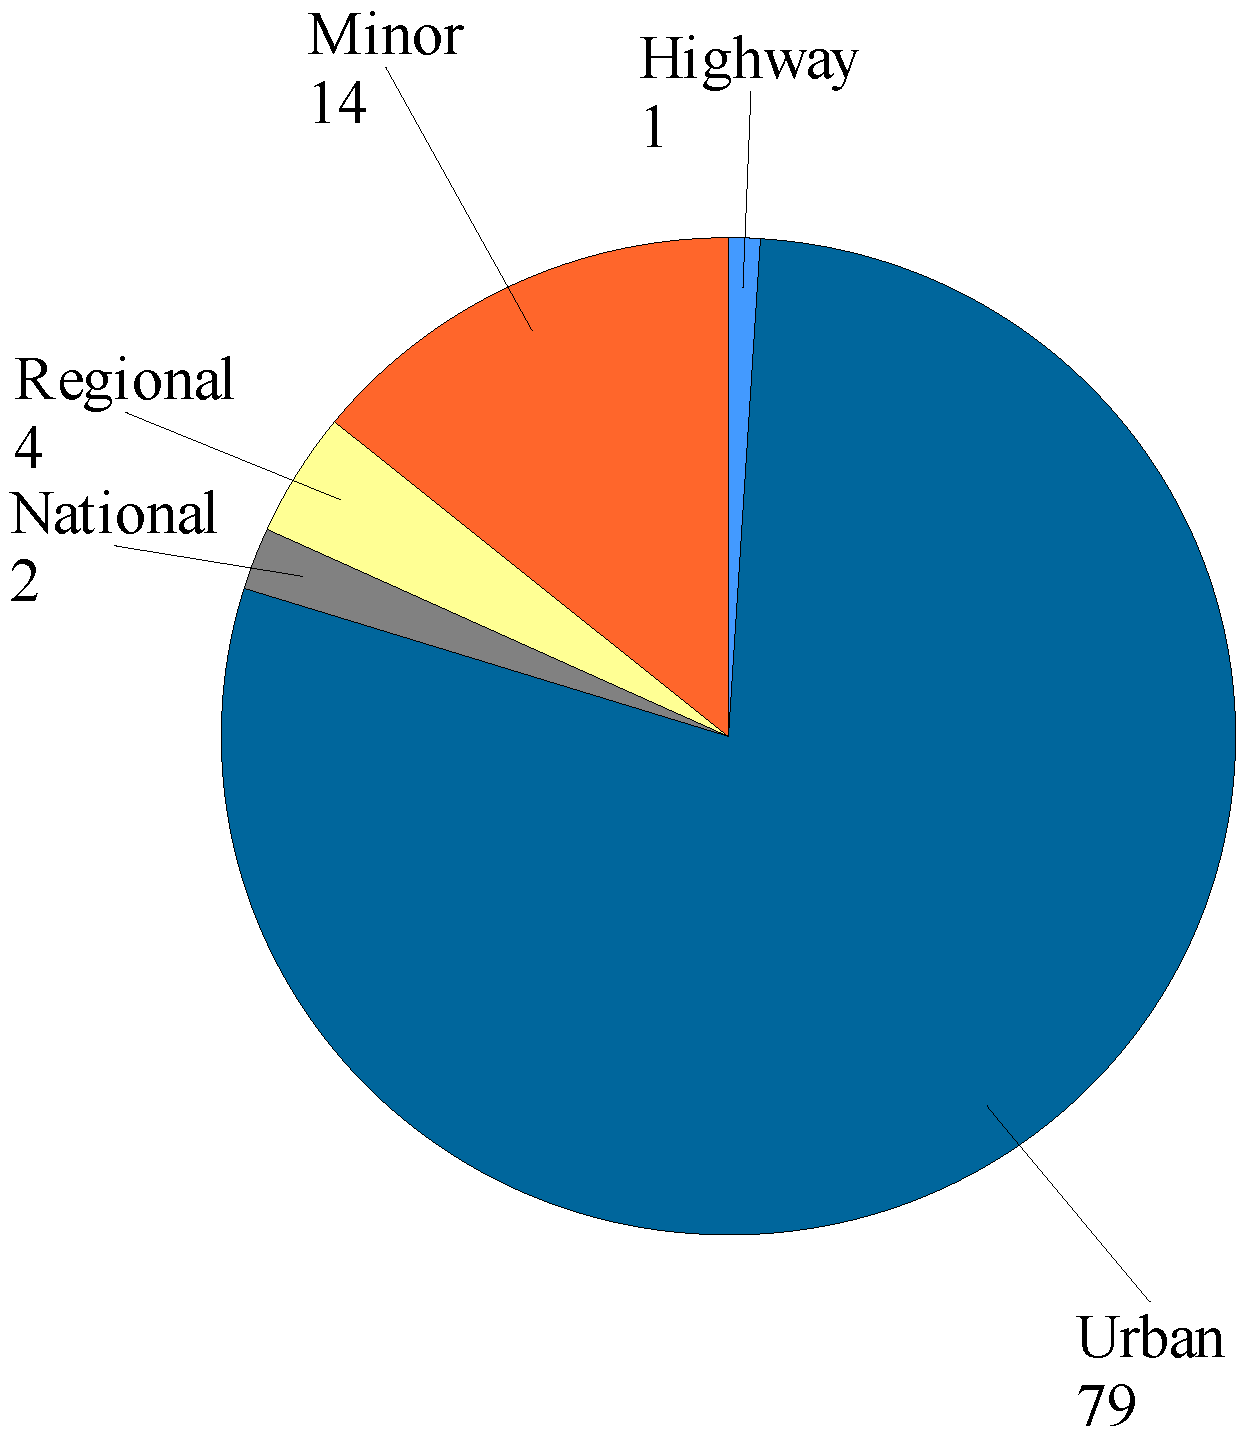
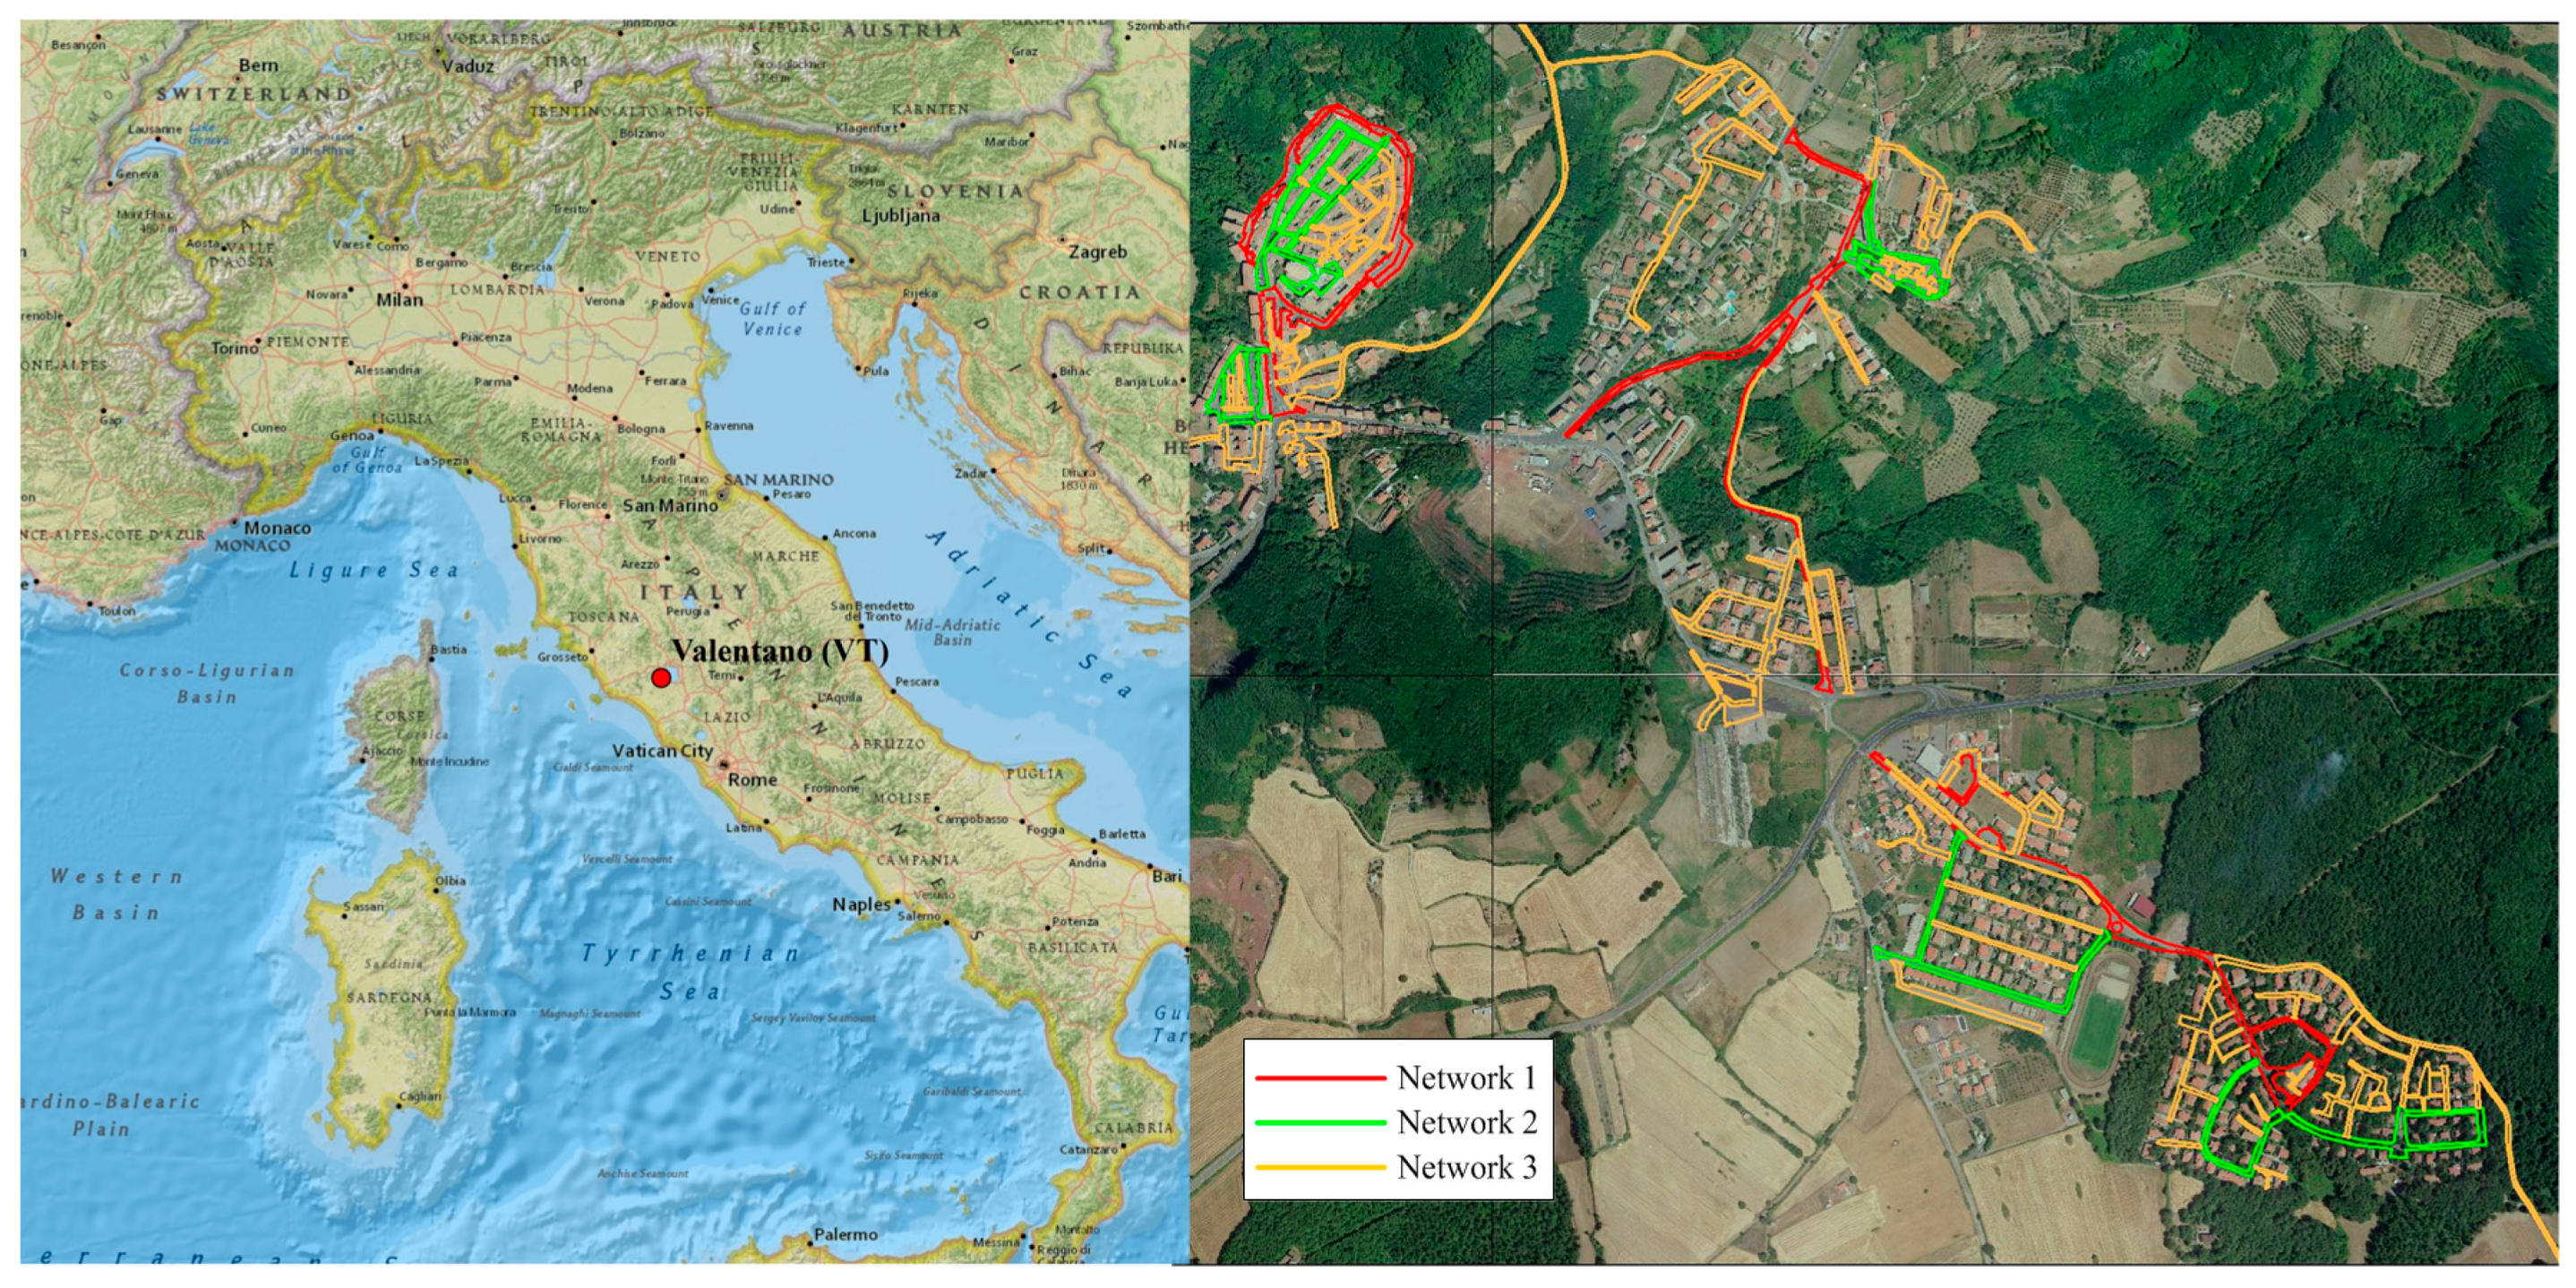
3.1. The Urban Road Network of Valentano, Viterbo (Italy)

The described PMS process has been tested on the road network in the town of Valentano, province of Viterbo, Italy. Valentano’s road pavement network was ranked by pavement type, traffic data and construction data. Three different networks have been identified as shown in Figure 4.
  • Network 1 is the main network of the town. It is 5.47 km long and its function is to connect the provincial road network that connects Valentano with a neighboring town. The type of pavement in this network is flexible.
  • Network 2 is the internal traffic distribution network. Most of the pavement type of this network is paved by cobblestone. It is 3.52 km long. In some areas, the level of traffic is high.
  • Network 3 has the function to guarantee the access to the residential areas and there are some pedestrian areas as well. It is the longest network in town with a length of 12 km. The level of traffic is low and there is different type of pavement: flexible, rigid and cobblestone.
In this paper, only the results of the study performed in network 1 are presented. According to [33], the network has been divided into branches corresponding to the streets. Each branch has been divided into sections. Each section has been divided into sample units. A sample unit is a defined portion of the pavement section with a standard size range of 225 ± 90 m2; only a limited number of sample units have to be inspected for the pavement condition calculation of the section. This permits the reduction of time and personnel to carry out the inspection of the whole network. The type of analysis depends on the maintenance policy approach: at the Network Level or the Project Level.
The Network Level approach is defined by “top-down” logic: it aims to optimize the budget allocation for the network maintenance in medium and long terms.
The Project Level approach continues the decision-making process focusing on the improvement of the network condition by implementing M, R&R works in certain sections of the networks.
Both at network and project levels, the components of a PMS should provide all elements to planning any kind of action on road surfaces; that is, to be able to choose “how”, “where” and “when” to intervene on the pavements.

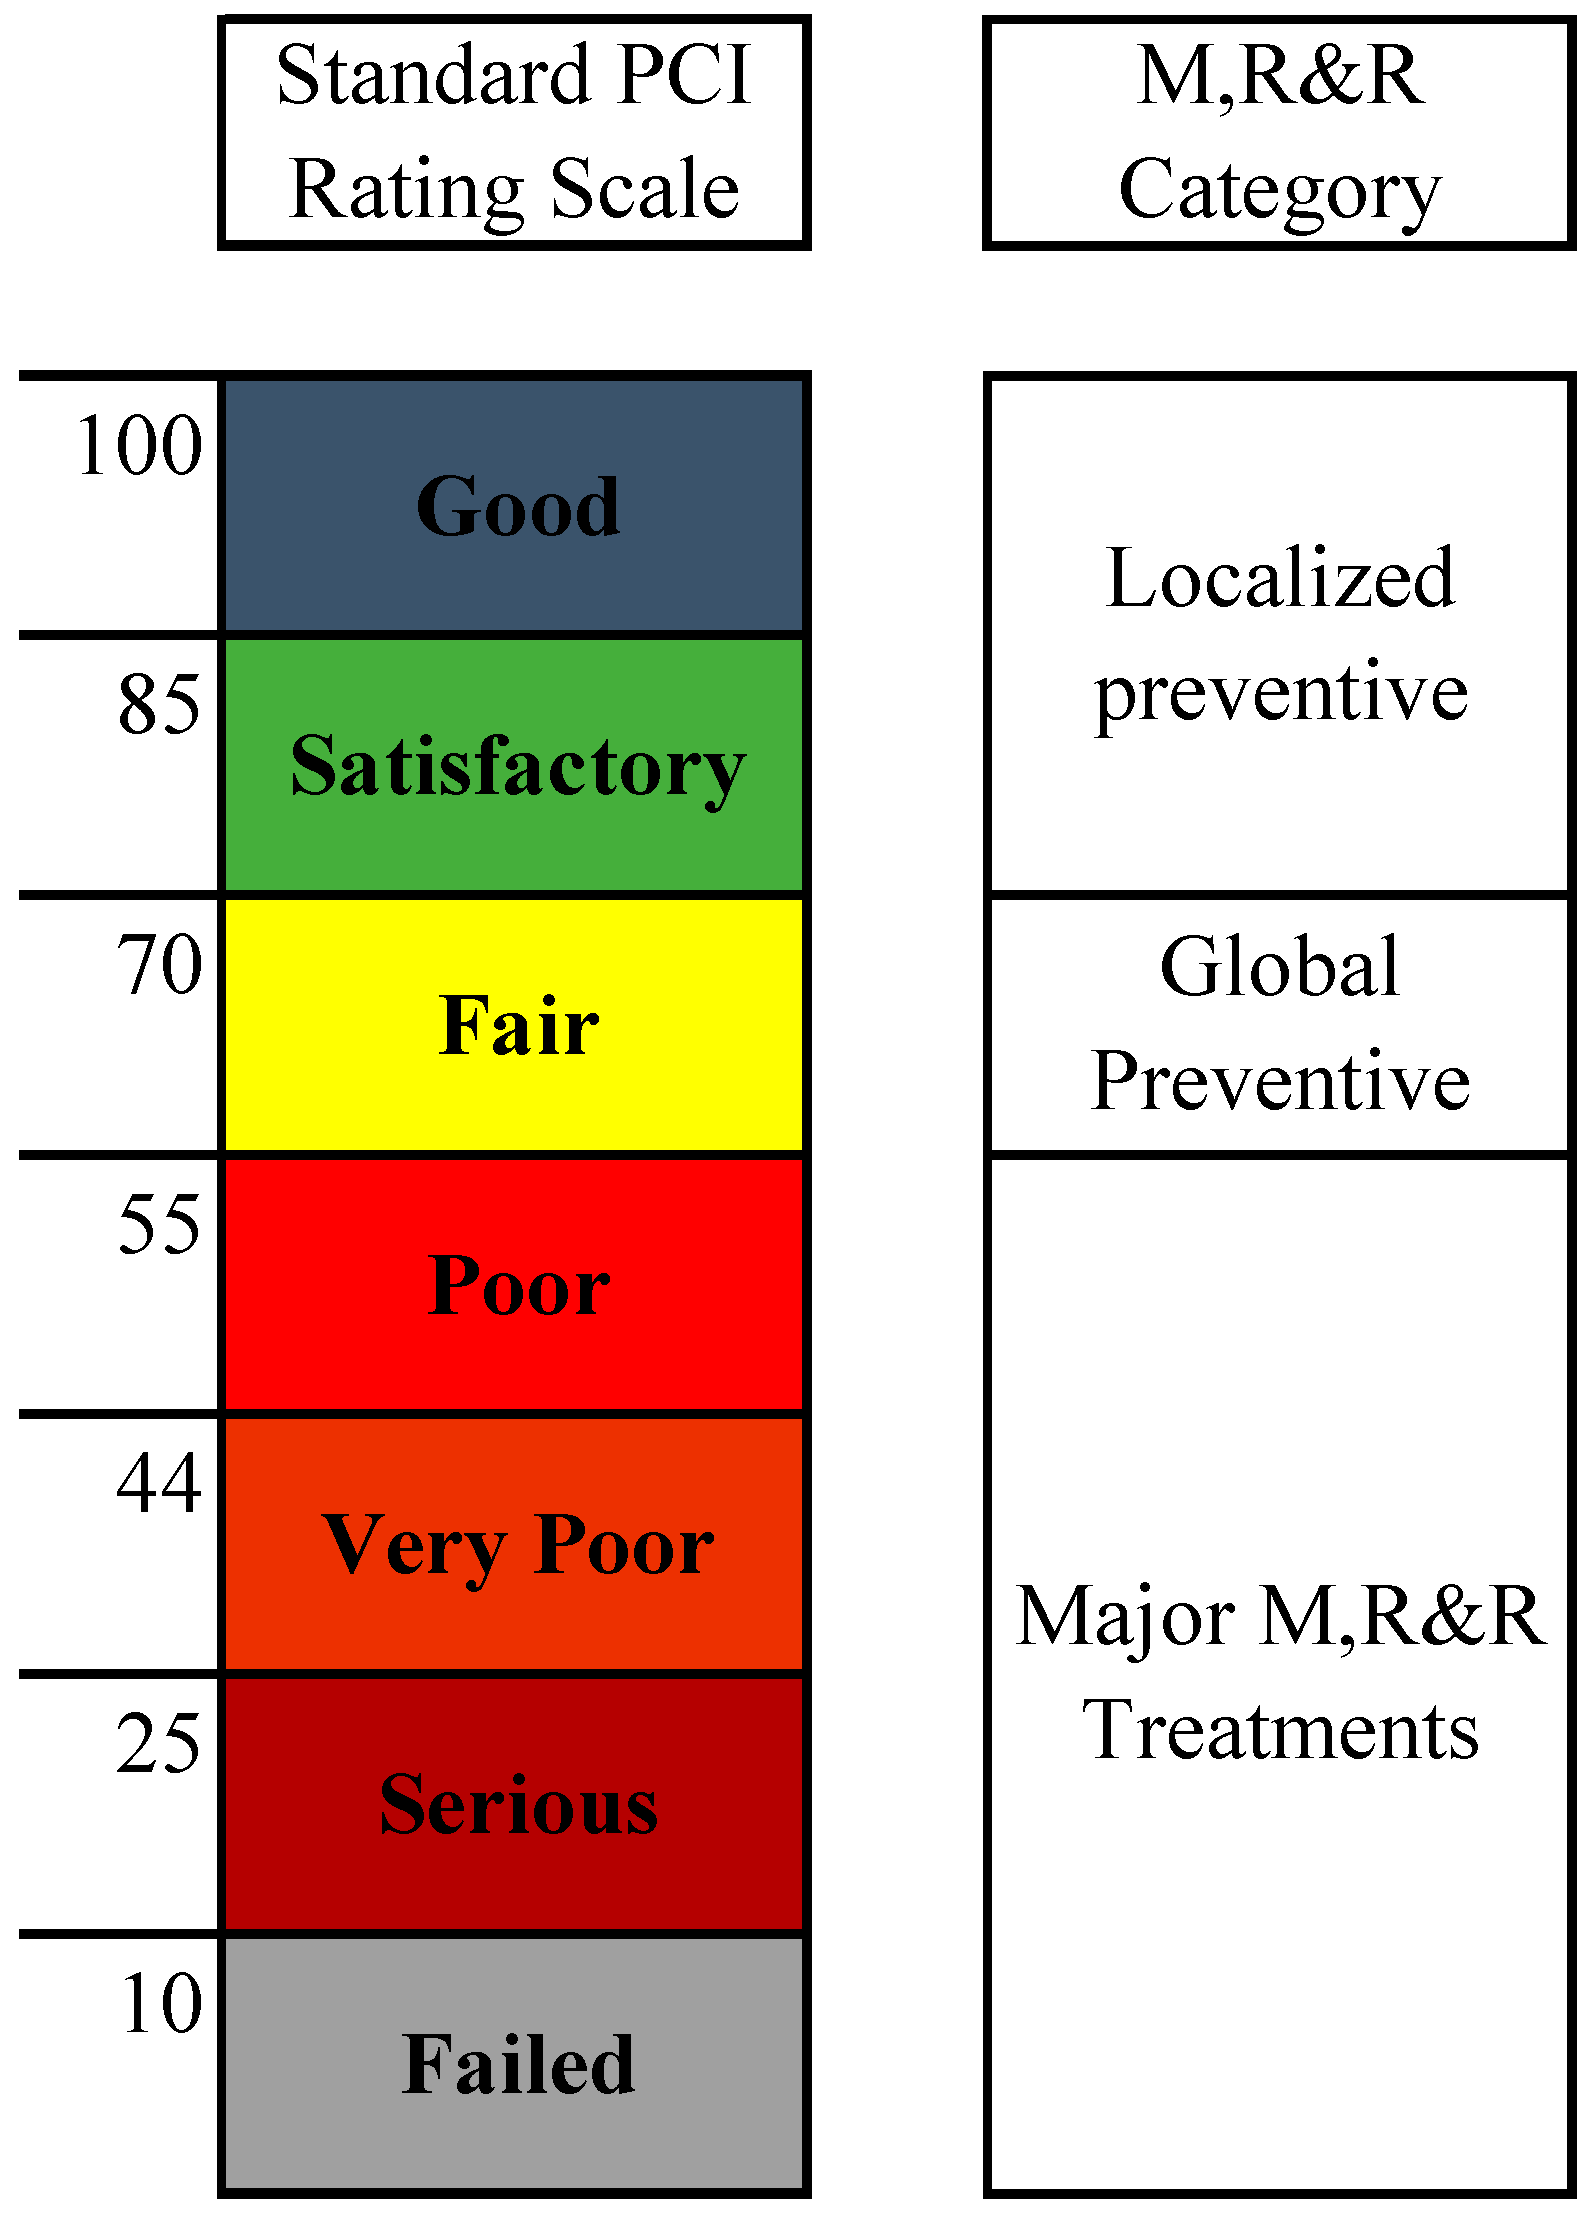
3.2. Visual Survey: Distress Identification—The PCI Method

The PCI is a numerical indicator, from 0 (failed pavement) to 100 (perfect condition). It is an index of the pavement structural integrity and surface operational condition. The calculation of the PCI is based on the result of a visual condition survey in which distress type, severity, and quantity are identified. In this case study, the quantity of distress is measured as described in the Appendix of ASTM D6433 [33].
The PCI methodology is a valuable tool for small municipalities: it provides a systematic and rational basis for determining maintenance and repair needs and priorities. It is used to establish the rate of pavement deterioration and early identification of major rehabilitation needs to reduce or defer costly, time-consuming rehabilitation and reconstruction projects.
In the same way the small and medium size towns, the pavement managers do not have an inventory of their road network. The pavement inventory may be created through GIS data and road data mapping.
In the case study of the town of Valentano, the first survey has been performed by two inspectors with simple tools (a hand odometer wheel and a straightedge). The inspectors monitored the whole of network 1 without high economical commitments, in a short period of time (a total of two weeks) and with minimal road interruptions.
A total number of 58 sample units at the network level and 127 at the project level were inspected. The average PCI of the network is 54 (poor condition, as seen in Figure 5). The network is very deteriorated: 34% of the pavement area is under the PCI critical threshold (PCI < 55).
After that, it has estimated the budget to improve the condition of all sections of the network to bring them above poor condition (PCI > 55). The necessary budget for that purpose is 1,195,720 €; this budget is oversize for a small municipality.
However, the municipality of Valentano has a limited budget of about 100,000 € every five years. Therefore, different alternative strategic repair and maintenance programs have been studied.
Then, priorities and improvement conditions of pavements have been established in order to meet the needs of the network by optimizing their results. This process is especially important in limited funding scenarios as the pavement management of municipal networks.

3.3. Repair and Maintenance Planning

The strategic aspect of M, R&R requires a planned approach to determine the maintenance policy by setting rules and guidelines the different strategies as well as to examine the impact of alternative funding scenarios.
In this section, the M, R&R alternative strategies are described and the maintenance policies are set. For this purpose, five repair and maintenance strategies were designed and their effects on the network condition were studied. All of these were based on the current limited budget available by the municipality (100,000 € for a five-year period) and on the network traffic.
For each strategy, the type of M, R&R work, its unit costs, and its effects on traffic and prolonging the life of the pavement were defined, so one strategy can be compared to another.
These strategies combine minor and major treatments on certain sections of the network, defined as critical. Then, the repair and maintenance costs were considered together as to the user costs through the estimation of the VOC.
In the following, some possible M, R&R strategies are presented:
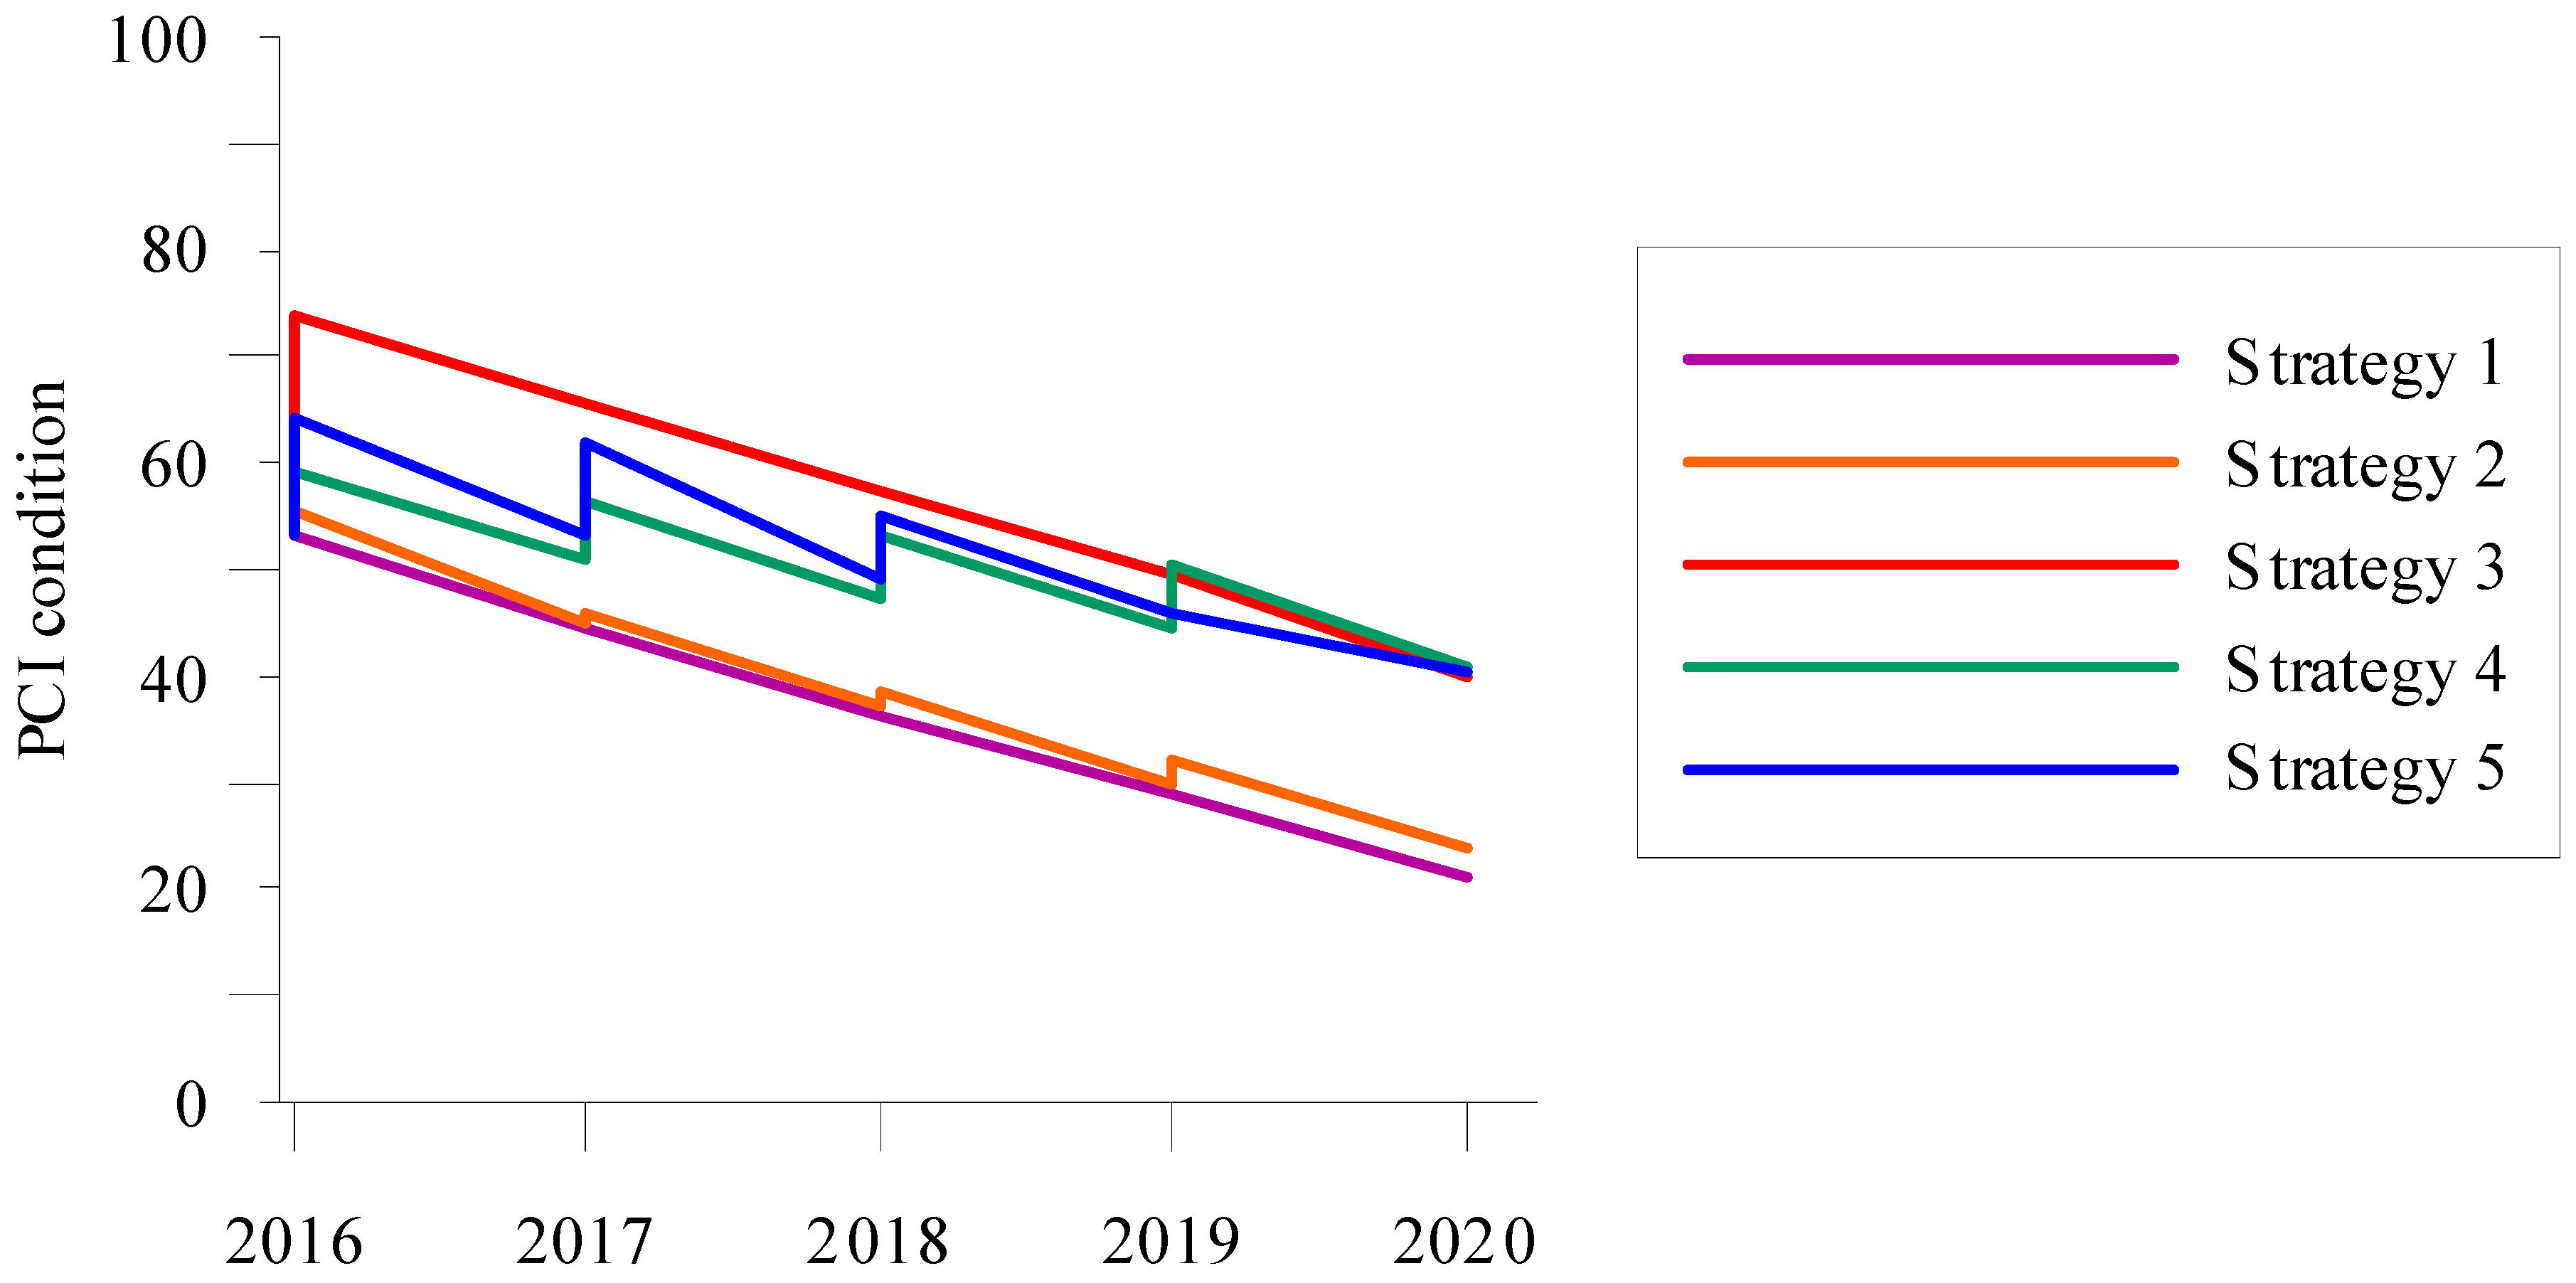
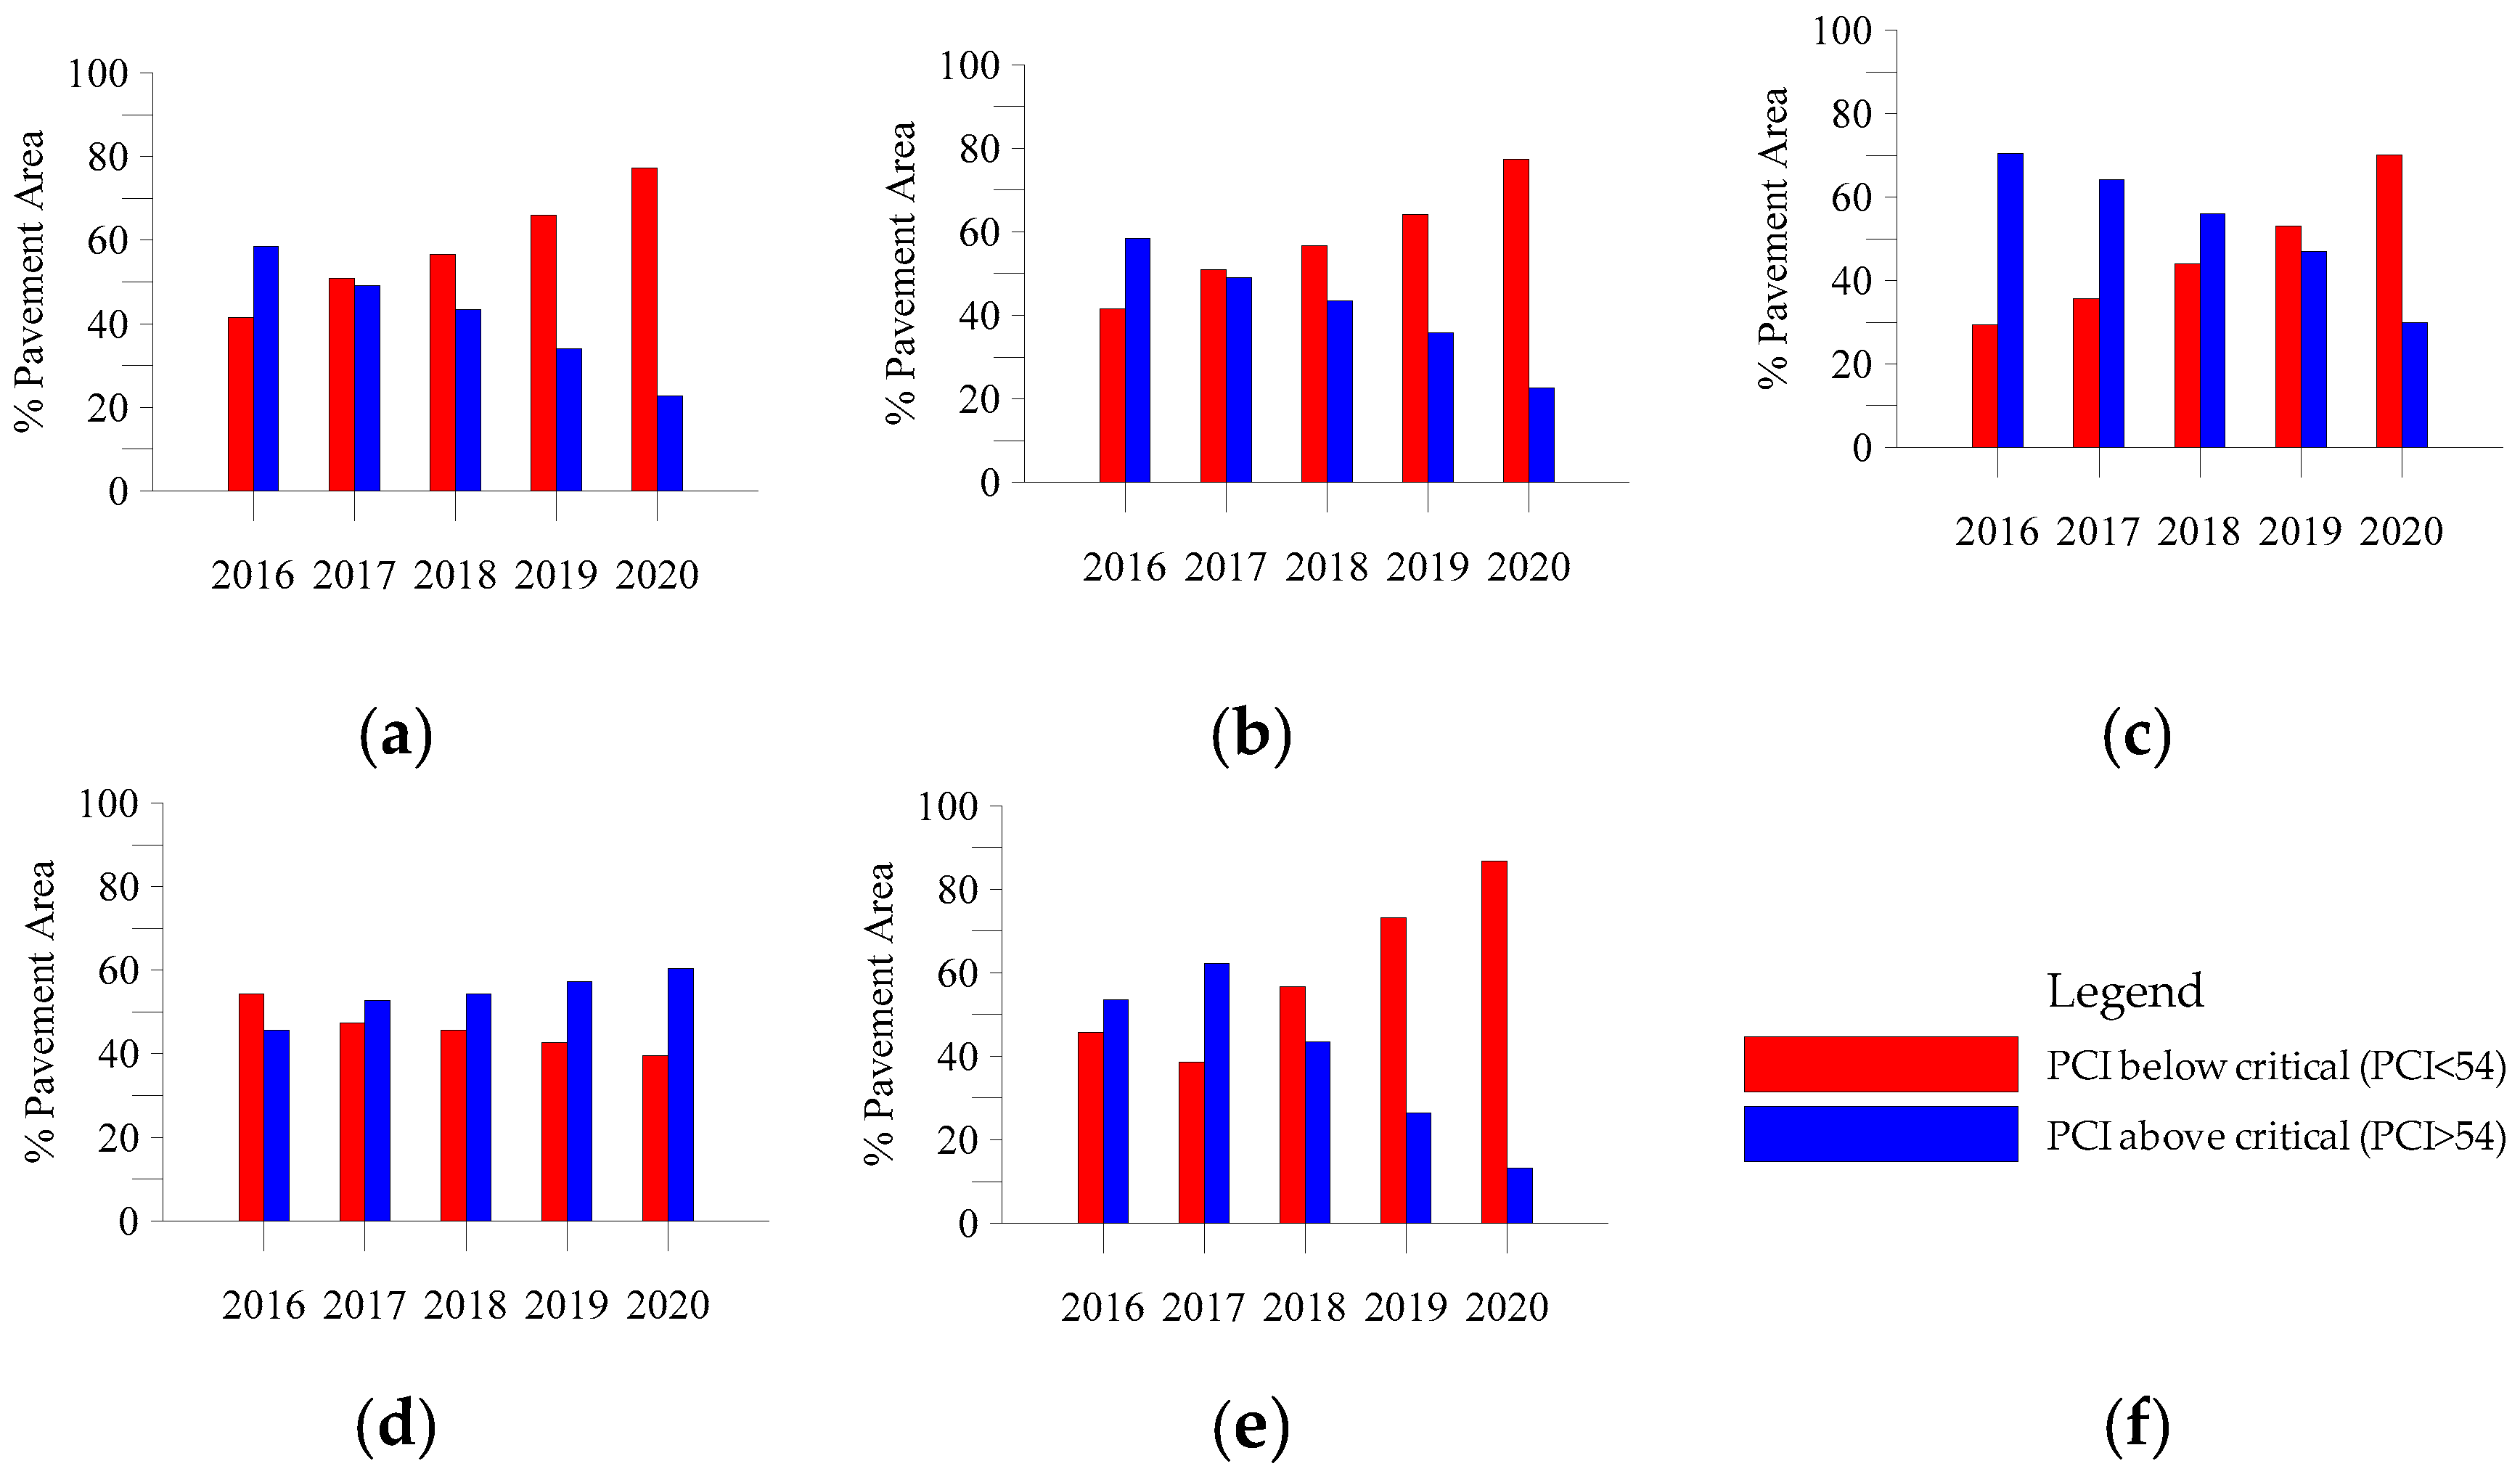
  • Strategy 1. Do Nothing. Aims to show how the network pavement condition evolves by time if no treatment is performed. It is used in this study to compare the differences with the other strategies.
  • Strategy 2. Run to failure maintenance. Run to failure maintenance (sometimes known as reactive maintenance) means doing zero prevention or planned maintenance; only repair treatments in the most critical distress areas during the time. Strategy 2 simulates the current maintenance policy of the municipality which consists in making minor treatments (Table 1) when the failure of the pavement has occurred. These repair treatments are performed when some quantities of distress are detected above certain values without any planning. The repair and maintenance works are distributed in the five years of the analysis period, and its influence and cost-effectiveness were analyzed (Table 2). The results of this analysis suggest that a reactive maintenance policy would not be cost-effective if the overall pavement network condition is below the PCI critical threshold.
  • Strategy 3. Corrective Maintenance (single investment in the first year). Strategy 3 proposes making major treatments in the first year of the period of analysis with a single investment of 100,000 € to improve the overall PCI of the network into satisfactory condition, from PCI 54 to 74. This strategy includes some major treatments in the 15 most critical sections of the network that are in very poor and serious condition with the highest level of traffic. All the available funds are invested for reconstruction and rehabilitation treatments to bring each of these sections into a satisfactory condition in the first year of the period of study. There is no available budget for minor repairs and maintenance treatments (preventive maintenance) to maintain the overall pavement condition the next four years. Therefore, the average PCI of the network falls to 40 at the end of the five-year period.
  • Strategy 4. Corrective Maintenance (investments equally distributed in the period of study). Following the same approach of the previous strategy, Strategy 4 proposes making major treatments in sections with very poor and serious condition but, in this case, the investment is equally distributed in the five years. The repair and maintenance treatments are performed in the most deteriorated sections similarly with Strategy 3, so the sections are the same for both strategies. In this strategy, 20,000 €/year for major treatment is allocated and the overall PCI deterioration rate has a slight decrease from 59 PCI value after the first year to 40 value at the fifth year. The critical state of the network influenced this type of policy (corrective maintenance) to involve immediate action to avoid imminent failures and preserve the condition and service level of the critical pavement sections. The funds were made equally distributed in the period of study because it is difficult for the municipality to address the entire budget in the first year.
  • Strategy 5. Corrective maintenance (treatments on low traffic sections). Strategy 5 proposes making major treatments in some sections of the network concentrating the M, R&R works in the first, second and third year of the period of study. These sections are different from those chosen for Strategy 3 and Strategy 4. The objective of Strategy 5 is evaluating the effect of the performance of the M, R&R treatments in those sections with different levels of traffic (traffic level lower than those of the selected sections of the other strategies) in order to compare the results with the aforementioned. The PCI trend (Figure 6) over time of Strategy 5 is similar to that of Strategy 4, so the treatments carried out in these sections are able to maintain the overall pavement condition of the network with an overall PCI value of 40 at the fifth year.
Strategy 3 concentrates the M, R&R works in the first year of the period of study and succeeds in improving pavement condition of the worst sections of the network and reducing the percentage of pavement area in critical condition. Nevertheless, the absence of preventive maintenance treatments in the following years leads to a rapid deterioration of pavement area below the critical PCI threshold.
Strategy 4 maintenance policy could maintain the pavement condition of the network sections with higher traffic levels and in the worst pavement condition.
Figure 7 shows a graphic chart with the percentage of pavement area rated by the PCI scale (below and above critical PCI) of each strategy for every year of the period of study. It is important to highlight that the Strategy 3 and Strategy 4Figure 7c,d—are those that keep the network in a better condition with the highest percentage of pavement area above the critical PCI.

3.4. Life-Cycle Cost Analysis—Vehicle Operating Costs Estimation

An innovative approach is used in this paper to verify the traffic influence in the M, R&R works planning; a Life-Cycle Cost tool was proposed to evaluate the benefits of the strategies. As advanced in the description of the proposed PMS, an inventory was created that includes the traffic count for each section. Therefore, the Vehicle Operating Costs may be calculated and all the strategies compared between them.
The VOC are the costs associated with owning, operating, and maintaining a vehicle, including the fuel consumption, tire wear, repair and maintenance costs, as the main components of VOC. The proposed method calculates the VOC focusing on its three main components. They depend on the pavement condition and traffic of each section (type and number of vehicles).
In the proposed VOC model, the effects of pavement condition in VOC are expressed in terms of roughness [32] using the IRI. However, the PMS presented in this article assesses the pavement condition in terms of PCI. Therefore, the calculation of VOC requests the estimation of roughness measure through the PCI. For this, a regression between PCI and IRI (Equation (1)), which was developed by Arhin et al. [21] with a study of pavement condition in the District of Columbia (USA), was used. Arhin et al. proposed different regression models changing the functional classification of road (freeways, arterials, collectors and locals) and the pavement type (asphalt, composite and concrete), and they obtained R2 values between 0.56 (for freeways road) and 0.82 (for asphalt pavement). In our study, the regression model between PCI and IRI obtained for asphalt pavement was used:
P C I = 0.224 × ( I R I ) + 120.02
with R2 = 0.82. The results of the ANOVA tests showed statistically significant F-statistic: the p-value for this regression model was determined to be less than 0.05, indicating that the regression model is adequate.
Therefore, IRI can be calculated as a function of the PCI by means of Equation (2):
IRI = PCI 120.02 ( 0.224 ) × 63.4
where IRI = International Roughness Index, in m/km units, considering 1 m/km = 63.4 in/mi; and PCI = Pavement Condition Index.
Consequently, as expressed in Equation (3), the annual VOC in the network was calculated as the sum of the VOC in all sections. The VOC in a section was calculated multiplying the number of days in a year (365), the AADT (see Table 3) of the IRI, the length of the section and the unit VOC. The unit VOC is the summation of the products of the consumption rates (named Rate and depending on IRI) and the theoretical VOC when the IRI = 0 (named Price) of the main components of VOC.
The Rate and Price of each component (such as fuel consumption, tire wear costs and repair and maintenance costs) was calculated using the diagrams from Chatti and Zaabar [32] of the HDM-4 VOC calibrated to US conditions. Each of these costs are calculated separately and summed up to obtain the annual VOC.
V O C = j = 1 N [ 365 × A A D T j × L e n g t h j × I R I j × i = 1 9 ( R a t e i × P r i c e i ) ]
where VOC = annual Vehicle Operating Costs of the entire network; N = total number of sections; AADT = Annual Average Daily Traffic in section j; Rate = consumption rate of each component of VOC (tire wear costs, fuel consumption, repair and maintenance costs) (% m/km); Price = theoretical VOC of the main components of VOC (cents €/km) when the IRI = 0; Length = length of section j (km); IRI = IRI value of the section j; i = index of summation of the three VOC components per three different vehicles (nine in total); and j = index of summation of the total number of sections of the network.
Figure 8 shows some examples of the diagram used to determine the VOC for each strategy in the study period.
In the present study, the effect of pavement surface texture (MPD) on VOC was not considered.
The results of the calculation of the VOC for each strategy in the study period are shown in Table 4 and Figure 9.

4. Discussion

Although Strategy 3 and Strategy 4 provide similar results, Strategy 4 is preferred because it plans the budget allocation gradually. Indeed, it is scarcely plausible that the municipality can have the total resources available for five years all together during the first year. The results of this study highlight that Strategy 4 best fits the needs of the pavement network and achieves the optimization of M, R&R treatments. Actually, it obtains a high reduction of indirect costs and lower deterioration of the network, keeping more sections above the PCI critical threshold. Other findings of this study are the following:
  • The analysis carried out is influenced by the agency’s initial target budget to maintain pavements because the proposed method is based on the distribution of the available resources; a change in the initial economic conditions will change the management analysis.
  • The lack of planned M, R&R treatments and minor treatments without established priorities to allocate funds (Strategy 2) is equivalent to doing nothing (Strategy 1).
  • This case study shows that the budget allocated by the administration is not enough to keep the global network pavement above the critical PCI’s threshold, and it would be necessary to study strategies involved in only a few sections and prioritize actions to achieve the maximum improvement of the global network within the constraints of actual budget (€100,000 every five years).
  • If the initial status of the network is very poor or serious, it will be very difficult to achieve an acceptable level of PCI of the global network. It would be advisable to invest in the most critical sections of the network (corrective maintenance) to raise the average PCI to a fair level and then invest in preventive maintenance to maintain the achieved network status (see Strategy 3).
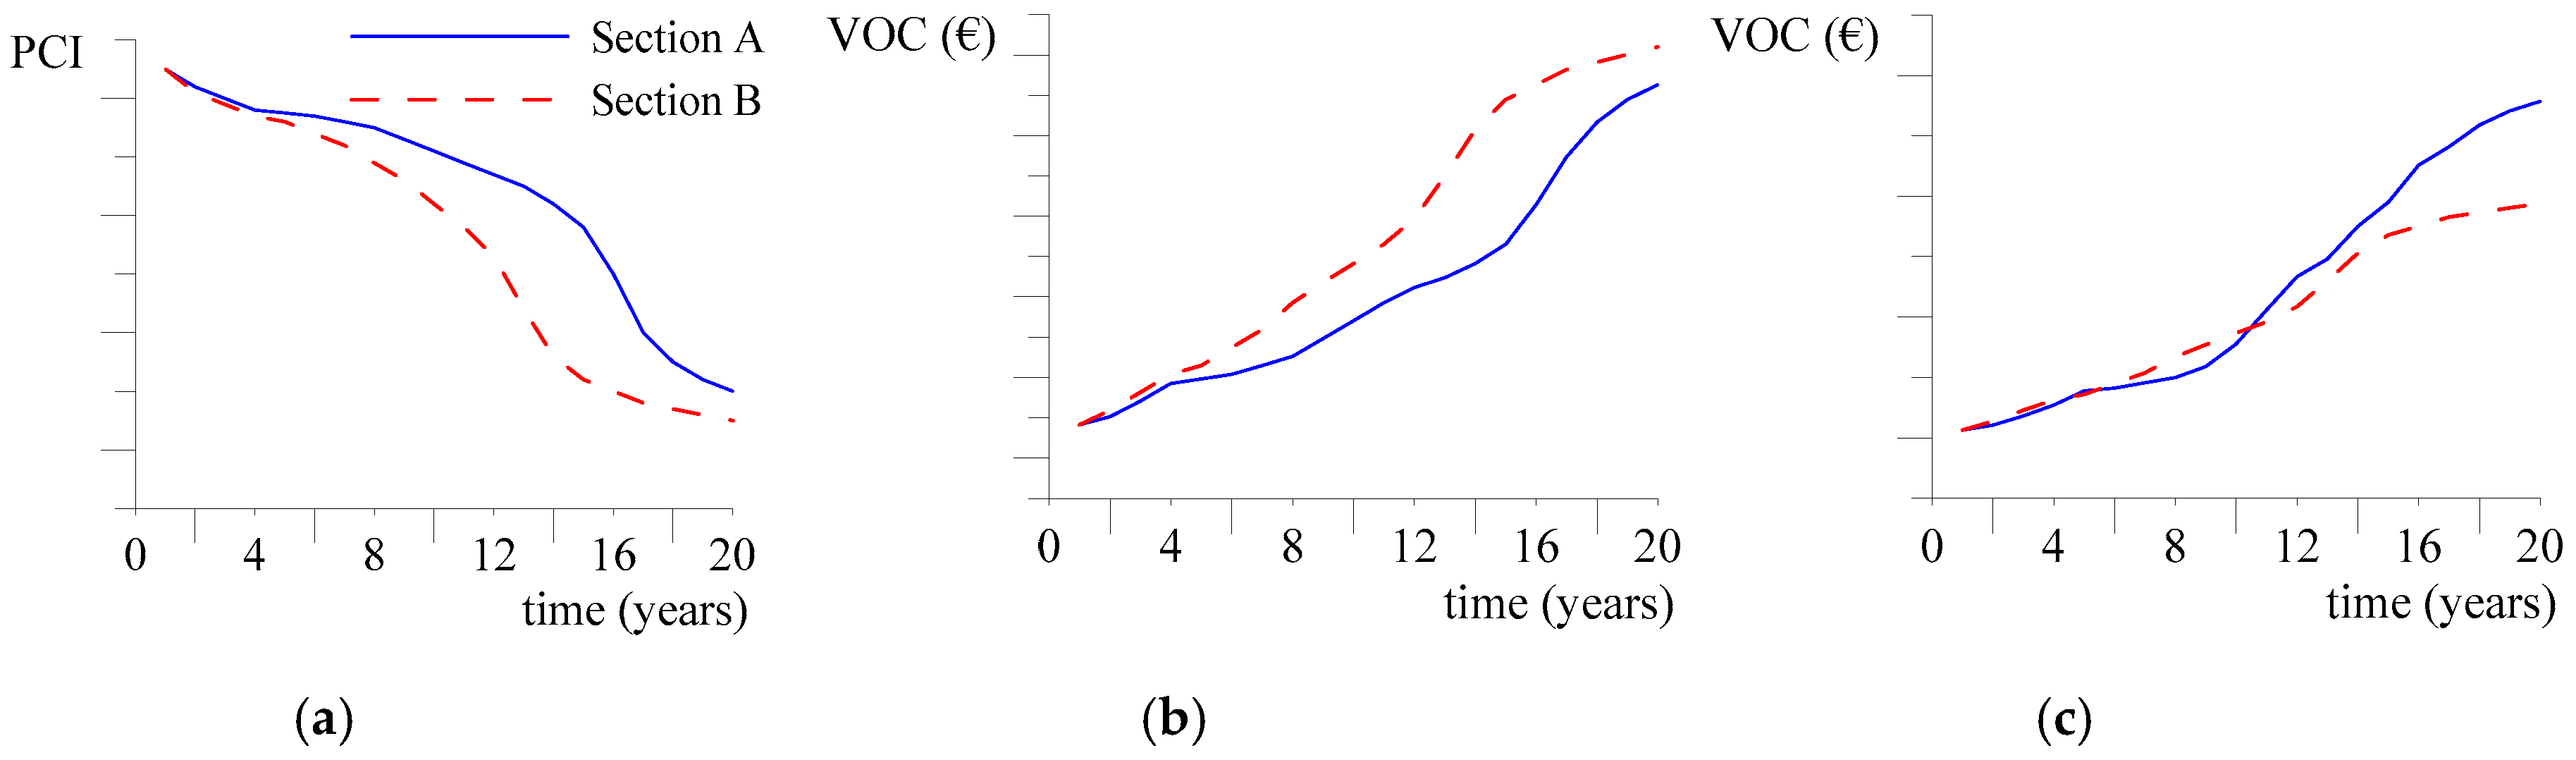
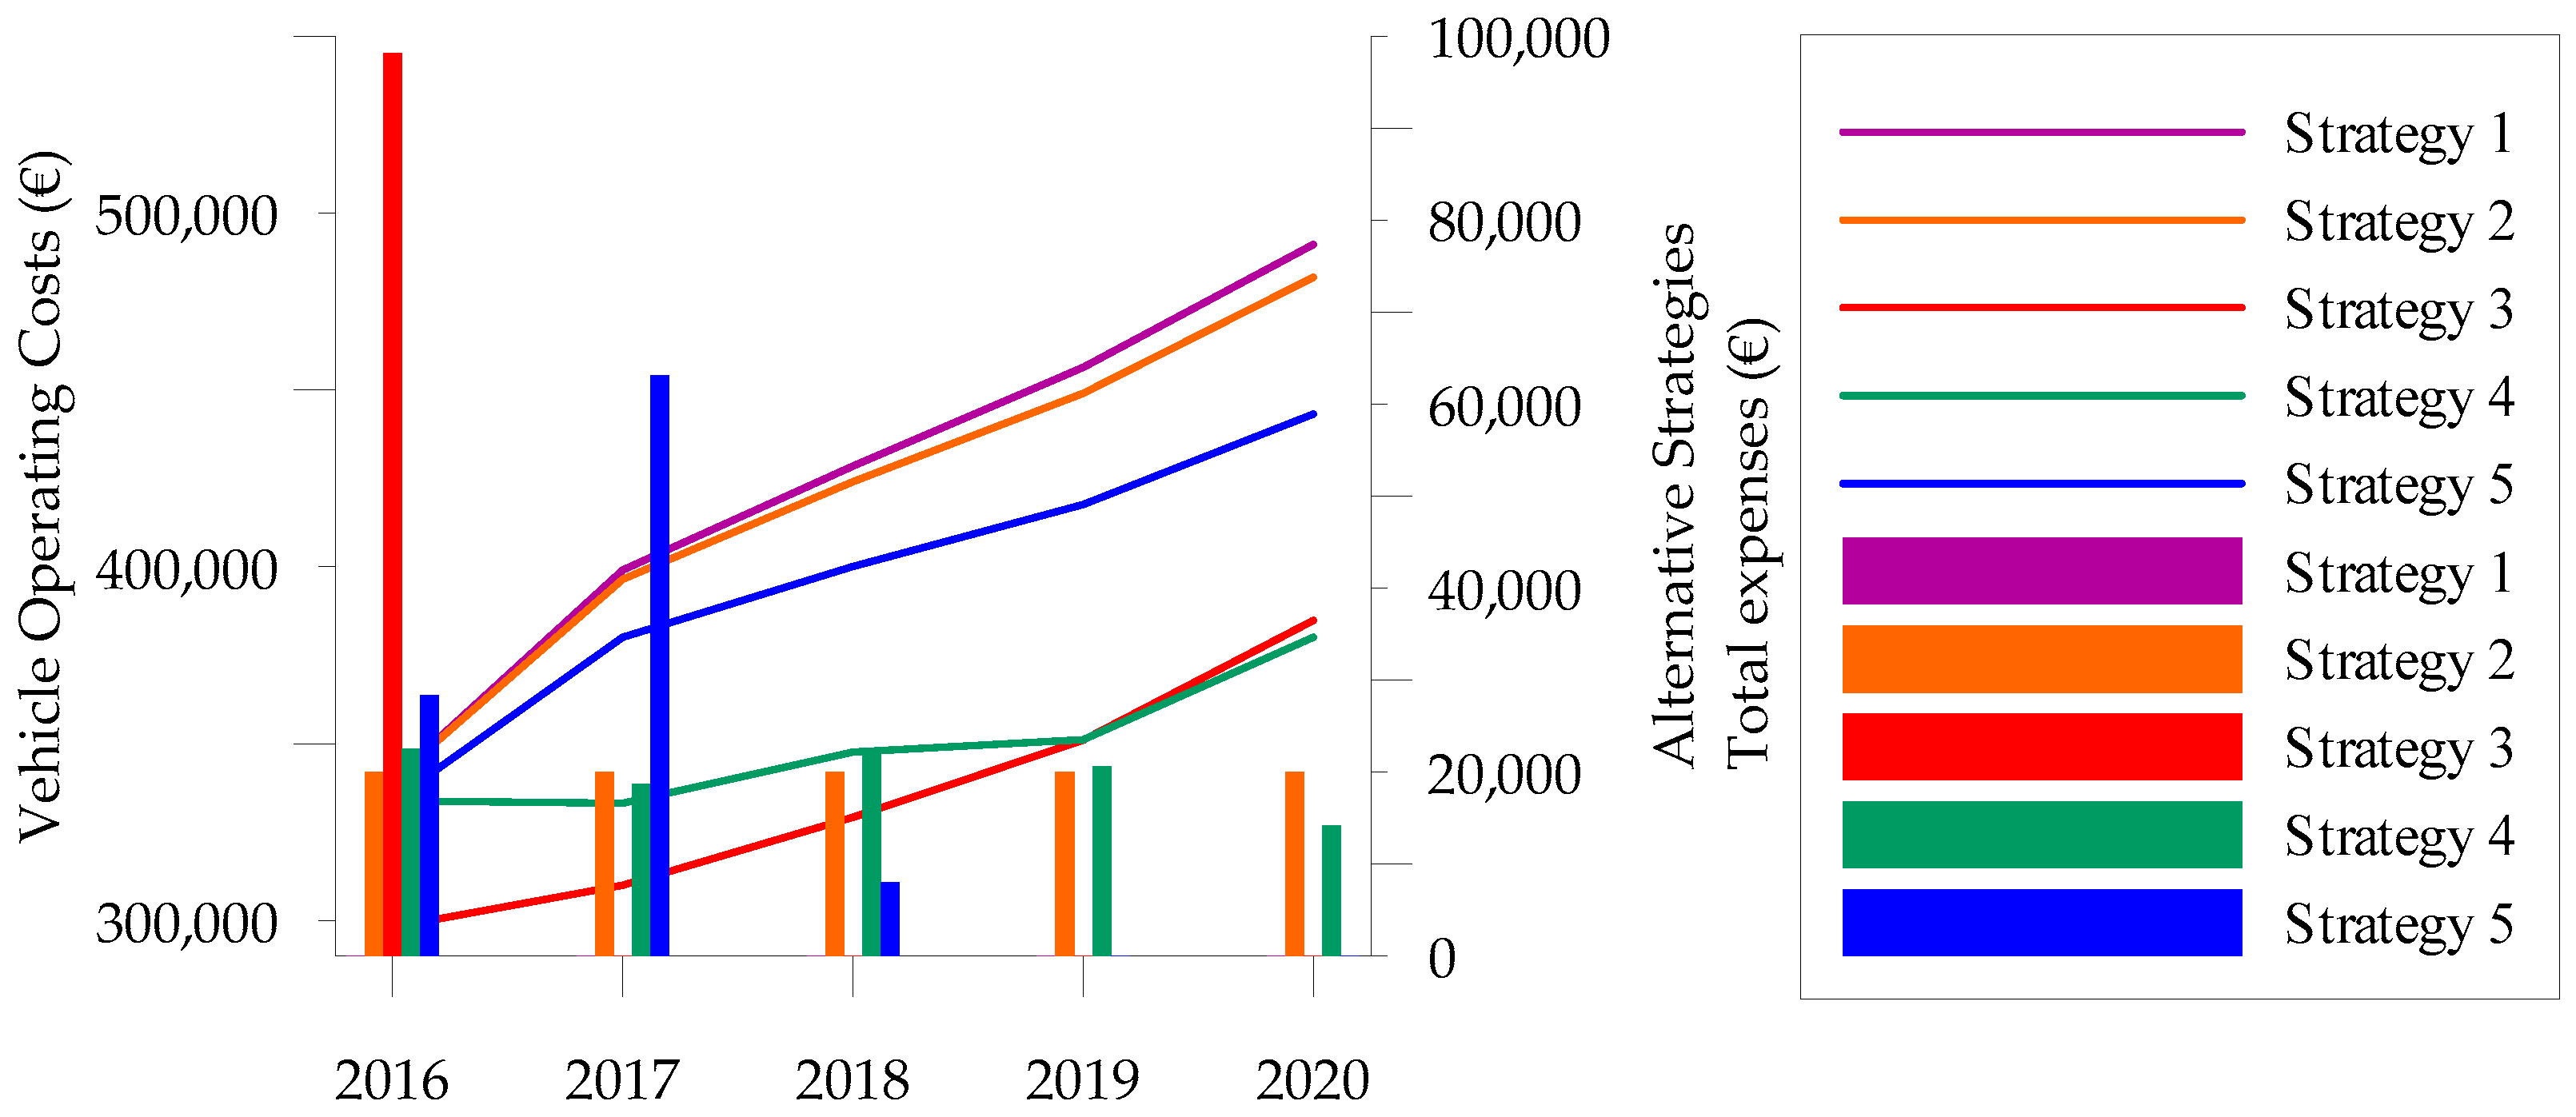
  • Although the PCI trend is similar to Strategy 4 and Strategy 5 as shown in Figure 6, Strategy 5 does not reduce the VOC in the same way that Strategy 4 does (Figure 9) because Strategy 4 maintenance policy could maintain the overall conditions in the network sections with higher traffic levels and in worse conditions and, therefore, significantly reduce the indirect costs estimated by the VOC.
  • Evidence has been shown that VOC is a valuable tool to include the influence of the level of traffic in the proposed PMS. Indeed, if the repair and maintenance works has been carried out in the sections with higher level of traffic, the indirect costs would be reduced considerably.

5. Conclusions

This paper proposes the implementation of a PMS in small- and mid-sized municipalities as an analytical tool to help the pavement managers in the decision making process.
Based on the results of this case study, it has been demonstrated that the proposed PMS establishes a new approach to the management of the urban network looking at the development of a rational and justified allocation of the resources with a reduced cost of implementation. The proposed method can be readily used in practice because it is a very flexible method that can easily adapt to the needs of a municipality road network.
The results have shown that it is essential to make an initial estimation of the available budget at the network level and, immediately afterwards, determine what kind of repair and maintenance policy must be adopted (preventive or corrective maintenance). As mentioned before, it is strongly influenced by the initial state of the pavement network because the proposed method is based on the distribution of available resources.
The traffic distributions in urban networks influences the maintenance planning prioritization and may be used to allocate the limited available budget of the municipalities by making comparisons of cost-effectiveness between different M, R&R work strategies.

Acknowledgments

The authors would like to acknowledge Eng. David Rosati for assistance with the pavement inspections at the Valentano's town as part of his Master’s degree Thesis. We would also like to show our gratitude to the Mayor of Valentano Dr. Francesco Pacchiarelli.

Author Contributions

Giuseppe Loprencipe and Paola Di Mascio had the original idea for the study and developed the economic evaluations and carried out maintenance policies. Antonio Pantuso organized the data, performed data analysis and conducted the traffic counts and the statistical analyses. Antonio Pantuso wrote sections for the first draft of the manuscript. All authors contributed to further drafts and had full access to all of the data.

Conflicts of Interest

The authors declare no conflict of interest.

References

  1. Han, D.; Kobayashi, K. Criteria for the development and improvement of PMS models. KSCE J. Civ. Eng. 2013, 17, 1302–1316. [Google Scholar] [CrossRef]
  2. Shahin, M.Y. Pavement Management for Airports, Roads, and Parking Lots, 2nd ed.; Springer: New York, NY, USA, 2005. [Google Scholar]
  3. Tavakoli, A.; Lapin, M.; Figueroa, J. PMSC: Pavement Management System for Small Communities. J. Transp. Eng. 1992, 118, 270–280. [Google Scholar] [CrossRef]
  4. Cantisani, G.; Di Mascio, P.; Moretti, L. Management of road tunnels: Construction, maintenance and lighting costs. Tunn. Undergr. Sp. Tech. 2016, 51, 84–89. [Google Scholar]
  5. Moretti, L.; Cantisani, G.; Di Mascio, P.; Caro, S. Technical and economic evaluation of lighting and pavement in Italian road tunnels. Tunn. Undergr. Space Technol. 2017, 65, 42–52. [Google Scholar] [CrossRef]
  6. Moretti, L. Technical and economic sustainability of concrete pavements. MAS 2014, 8, 1–9. [Google Scholar] [CrossRef]
  7. D’Andrea, A.; Moretti, L.; Di Mascio, P. Environmental impact assessment of road asphalt pavements. MAS 2013, 3, 203–214. [Google Scholar]
  8. Moretti, L.; Mandrone, V.; D’Andrea, A.; Caro, S. Comparative “from Cradle to Gate” Life Cycle Assessments of Hot Mix Asphalt (HMA) Materials. Sustainability 2017, 9, 400. [Google Scholar] [CrossRef]
  9. Bonin, G.; Folino, N.; Loprencipe, G.; Oliverio Rossi, G.; Polizzotti, S.; Teltayev, B. Development of a Road Asset Management System in Kazakhstan. In Proceedings of the TIS 2017 International Congress on Transport Infrastructure and Systems, Rome, Italy, 10–12 April 2017; CRC Press/Balkema: Leiden, The Netherlands, 2017; Available online: https://www.crcpress.com/Transport-Infrastructure-and-Systems-Proceedings-of-the-AIIT-International/DellAcqua-Wegman/p/book/9781138030091 (accessed on 19 March 2017).
  10. Loprencipe, G.; Cantisani, G.; Di Mascio, P. Global assessment method of road distresses. In Proceedings of the 4th International Symposium on Life-Cycle Civil Engineering, IALCCE 2014, Tokyo, Japan, 16 November 2014; CRC Press/Balkema: Leiden, The Netherlands, 2015; pp. 1113–1120. Available online: https://www.crcpress.com/Life-Cycle-of-Structural-Systems-Design-Assessment-Maintenance-and-Management/Furuta-Frangopol-Akiyama/p/book/9781138001206 (accessed on 19 March 2017). [Google Scholar]
  11. Petschacher, M.; Gragger, K. Asset Management by Means of BAUT. In Proceedings of the 2nd European Pavement and Asset Management Conference, Berlin, Germany, 21–23 March 2004.
  12. Mannisto, V.; Inkala, M. Road Asset Management Research Program in Finland. Available online: http://alk.tiehallinto.fi/voh/Julkaisut_kon_sem/kon_sem_road_asset_management_reasearch_program_in_finland.pdf (accessed on 30 July 2016).
  13. Ruotoistenmäki, A.; Seppälä, T. Road condition rating based on factor analysis of road condition measurements. Transp. Policy 2007, 8, 1–9. [Google Scholar] [CrossRef]
  14. Corazza, M.V.; Di Mascio, P.; Moretti, L. Managing sidewalk pavement maintenance: A case study to increase pedestrian safety. JTTE 2016, 3, 203–214. [Google Scholar] [CrossRef]
  15. Cottrell, W.; Bryan, S.; Chilukuri, B.; Kalyani, V.; Stevanovic, A.; Wu, J. Transportation Infrastructure Maintenance Management: Case Study of a Small Urban City. J. Infrastruct. Syst. 2009, 15, 120–132. [Google Scholar] [CrossRef]
  16. Chamorro, A.; Tighe, S.; Li, N.; Kazmierowski, T. Development of Distress Guidelines and Condition Rating to Improve Network Management in Ontario, Canada. Transp. Res. Rec. 2009, 2093, 128–135. [Google Scholar] [CrossRef]
  17. Chamorro, A.; Tighe, S.; Li, N.; Kazmierowski, T. Validation and Implementation of Ontario, Canada, Network-Level Distress Guidelines and Condition Rating. Transp. Res. Rec. 2010, 2153, 49–57. [Google Scholar] [CrossRef]
  18. Osorio, A.; Chamorro, A.; Tighe, S.; Videla, C. Calibration and validation of condition indicator for managing urban pavement networks. Transp. Res. Rec. 2014, 2455, 28–36. [Google Scholar] [CrossRef]
  19. Shah, Y.; Jain, S.; Parida, M. Evaluation of prioritization methods for effective pavement maintenance of urban roads. Int. J. Pavement Eng. 2012, 15, 238–250. [Google Scholar] [CrossRef]
  20. Rens, K.; Gragger, K. Rating City and County of Denver Urban Pavement Constructability Using a Profiler. Pract. Period. Struct. Des. Constr. 2010, 15, 44–49. [Google Scholar] [CrossRef]
  21. Arhin, S.A.; Williams, L.N.; Ribbiso, A.; Anderson, M.F. Predicting Pavement Condition Index using International Roughness Index in a Dense Urban Area. J. Civ. Eng. Res. 2015, 5, 10–17. [Google Scholar]
  22. Cantisani, G.; Loprencipe, G. Road Roughness and Whole Body Vibration: Evaluation Tools and Comfort Limits. J. Transp. Eng. 2010, 136, 818–826. [Google Scholar] [CrossRef]
  23. Cantisani, G.; Fascinelli, G.; Loprencipe, G. Urban road noise: The contribution of pavement discontinuities. In ICSDEC 2012: Developing the Frontier of Sustainable Design, Engineering, and Construction, Proceedings of the 2012 International Conference on Sustainable Design and Construction, Fort Worth, TX, USA, 7–9 November 2012; American Society of Civil Engineers: Reston, VA, USA, 2012; pp. 327–334. Available online: http://dx.doi.org/10.1061/9780784412688 (accessed on 18 March 2017).
  24. Loprencipe, G.; Zoccali, P. Use of generated artificial road profiles in road roughness evaluation. J. Mod. Transp. 2017. [Google Scholar] [CrossRef]
  25. Loprencipe, G.; Pantuso, A. A Specified Procedure for Distress Identification and Assessment for Urban Road Surfaces based on PCI. Coatings 2017. in review. [Google Scholar]
  26. Bennett, C.R.; Greenwood, I.D. Volume 7: Modeling Road User and Environmental Effects in HDM-4, Version 3.0; International Study of Highway Development and Management Tools (ISOHDM); La Défense Cédex World Road Association (PIARC), Paris/The World Bank: Washington, DC, USA, 2001; Available online: www.lpcb.org (accessed on 5 May 2016).
  27. Archondo-Callao, R. Applying the HDM-4 Model to Strategic Planning of Road Works; The World Bank: Washington, DC, USA, 2008. [Google Scholar]
  28. Bennett, C.; Paterson, W. Volume 5: HDM-4 Calibration Reference Manual, International Study of Highway Development and Management Tools (ISOHDM); La Défense Cédex World Road Association (PIARC), Paris/The World Bank: Washington, DC, USA, 2003; Available online: www.lpcb.org (accessed on 5 May 2016).
  29. De Weille, J. Quantification of Road User Savings; World Bank Staff Occasional Paper No. 2; The World Bank: Washington, DC, USA, 1966. [Google Scholar]
  30. Becker, M.A. Selection of Optimal Investment Strategies for Low Volume Roads. Ph.D. Thesis, Massachusetts Institute of Technology, Cambridge, MA, USA, 1972. [Google Scholar]
  31. Zaniewski, J.P.; Butler, B.C.; Cunningham, G.; Elkins, G.E.; Paggi, M.S.; Machemehl, R. Vehicle Operating Costs, Fuel Consumption, and Pavement Type and Condition Factors; Report FHWA/PL/82/001; U.S. Department of Commerce National Technical Information Service: Springfield, VA, USA, 1982. Available online: https://ntl.bts.gov/lib/42000/42200/42239/FHWA-PL-82-001.pdf (accessed on 18 March 2017).
  32. Chatti, K.; Zaabar, I. Estimating the Effects of Pavement Condition on Vehicle Operating Costs. Available online: https://www.nap.edu/read/22808/chapter/1 (accessed on 19 May 2016).
  33. American Society of Testing and Materials (ASTM). D6433-16, Standard Practice for Roads and Parking Lots Pavement Condition Index Surveys. Available online: www.astm.org (accessed on 19 May 2016).
Figure 1. Pie chart distribution of the type of the Italian roads.
Sustainability 09 00453 g001
Figure 2. Comparative of traffic influence on VOC: (a) pavement condition performance of sections A and B; (b) VOC section A and section B, where traffic at section A is equal to traffic at section B; and (c) VOC section A and section B, where traffic at section A is higher than traffic at section B.
Sustainability 09 00453 g002
Figure 3. Framework of the proposed PMS.
Sustainability 09 00453 g003
Figure 4. Valentano’s Network characterization.
Sustainability 09 00453 g004
Figure 5. PCI rating scale.
Sustainability 09 00453 g005
Figure 6. PCI condition calculated for each strategy.
Sustainability 09 00453 g006
Figure 7. PCI section rating for each strategy at the considered period of study: (a) Strategy 1; (b) Strategy 2; (c) Strategy 3; (d) Strategy 4; and (e) Strategy 5; and (f) the legend.
Sustainability 09 00453 g007
Figure 8. Diagrams to evaluate the effect of roughness on VOC.
Sustainability 09 00453 g008
Figure 9. Vehicle Operating Costs calculated for each strategy.
Sustainability 09 00453 g009
Table 1. Type of M, R & R minor and major treatments.
Treatment Description (Code)Unit Cost
Minor M, R & R treatmentNo Localized M&R (NONE)-
Crack-Sealing (CR-SEAL)2.31 (€/m)
Slurry-Seal (SR-SL)4.06 (€/m2)
Manhole-Reconstruction (RC_MH)82.99 (€/piece)
Grinding-Localized (GR-LOC)4.38 (€/m2)
Patching-Leveling (PAT-LV)11.06 (€/m2)
Patching-Deep (PAT-DP)22.12 (€/m2)
Major M, R &R treatmentOverlay-Thin-AC (OL-AC)10.62 (€/m2)
Surface-Reconstruction (SR-RC)21.85(€/m2)
Complete-Reconstruction (CPL-RC)37.77 (€/m2)
Table 2. M, R&R strategies at the Project Level for Strategies 3, 4 and 5.
StrategyBranch Id.Section No.YearSection AreaPCI beforeM, R&R treatments costs (€)
Strategy 3B1S12016175241858.50
B3S22016431294577.22
B4S22016810358602.20
B4S6201623362474.46
B4S72016241692559.42
B5S220162127822,588.74
B5S32016512195437.44
B5S52016410284354.20
B5S72016438154651.56
B6S8201610211410,843.02
B9S42016647316871.14
B10S42016428654545.36
B10S52016438274651.56
B10S62016233582474.46
B11S220161,0976211,650.14
Strategy 4B5S220162127822,588.74
B4S6201723362474.46
B5S32017512195437.44
B6S8201710211410,843.02
B1S12018175241858.50
B3S22018431294577.22
B4S22018810358602.20
B9S42018647316871.14
B5S52019410284354.20
B5S72019438154651.56
B10S42019428654545.36
B10S52019438274651.56
B10S62019233582474.46
B4S72020241692559.42
B11S2202010976211,650.14
Strategy 5B2S12016952719919.84
B4S22016809358429.78
B11S22016733777637.86
B4S6201623662430.80
B1S12017175181823.50
B11S120177337212,993.74
B4S1201720093820,933.78
B4S4201718946219,735.48
B3S120171247717637.86
B8S12018321613344.82
B7S12018448614668.16
Table 3. Traffic distribution in network’s sections.
Branch Id.Section No.Passenger CarsVanBus
B1S1800100
B1S2800100
B2S1800200
B3S11000300
B3S21000300
B4S18002020
B4S28002020
B4S413003020
B4S613003020
B4S713003020
B5S130007050
B5S230007050
B5S32000401
B5S42000401
B5S52000401
B5S62000401
B5S72000401
B6S12000400
B6S72000400
B6S82000400
B6S92000400
B7S1800100
B8S1150100
B9S137001000
B9S337001000
B9S4370010080
B10S410003050
B10S510003050
B10S610003050
B10S31000300
B11S1500100
B11S2500100
Table 4. Vehicle Operating Costs calculated for each strategy.
StrategyVOC Total [€]VOC Reduction [€]Medium PCI beforeMedium PCI afterNo. Sections below Critical PCI after
Strategy 12,114,9870532141
Strategy 22,091,39523,593532341
Strategy 31,673,448441,539534037
Strategy 41,746,079368,909534032
Strategy 51,975,060139,927534046

