1. Introduction
Over the last two decades, Vietnam textile and apparel industry has shown great growth. The industry has penetrated into the world market, and as an industry has for many consecutive years ranked very high in terms of major export products. This sector is outperforming its regional rivals, and many foreign organizations have invested into Vietnam to benefit from this potential market. The industry has made a significant contribution to the national economy and long-term sustainable development in Vietnam.
The industry includes about 6000 companies, with nearly 2.5 million people involved, accounting for about 25% of labor in the industrial sectors, and contributes around 10–15% of the national GDP per year [
1]. Compound Annual Growth Rate (CAGR) of the industry has increased 21.6% per year in the period 2010–2016, which has made Vietnam the fourth largest textile and garment exporters in the world [
2,
3]. Vietnamese textile and apparel products have been exported to 180 countries and territories around the world; the largest markets are the United States, Japan, Korea, United Kingdom and Germany [
4]. The industry includes the following types of companies: sewing (70%), spinning (6%), weaving/knitting (17%), dying (4%), and ancillary industries (3%) [
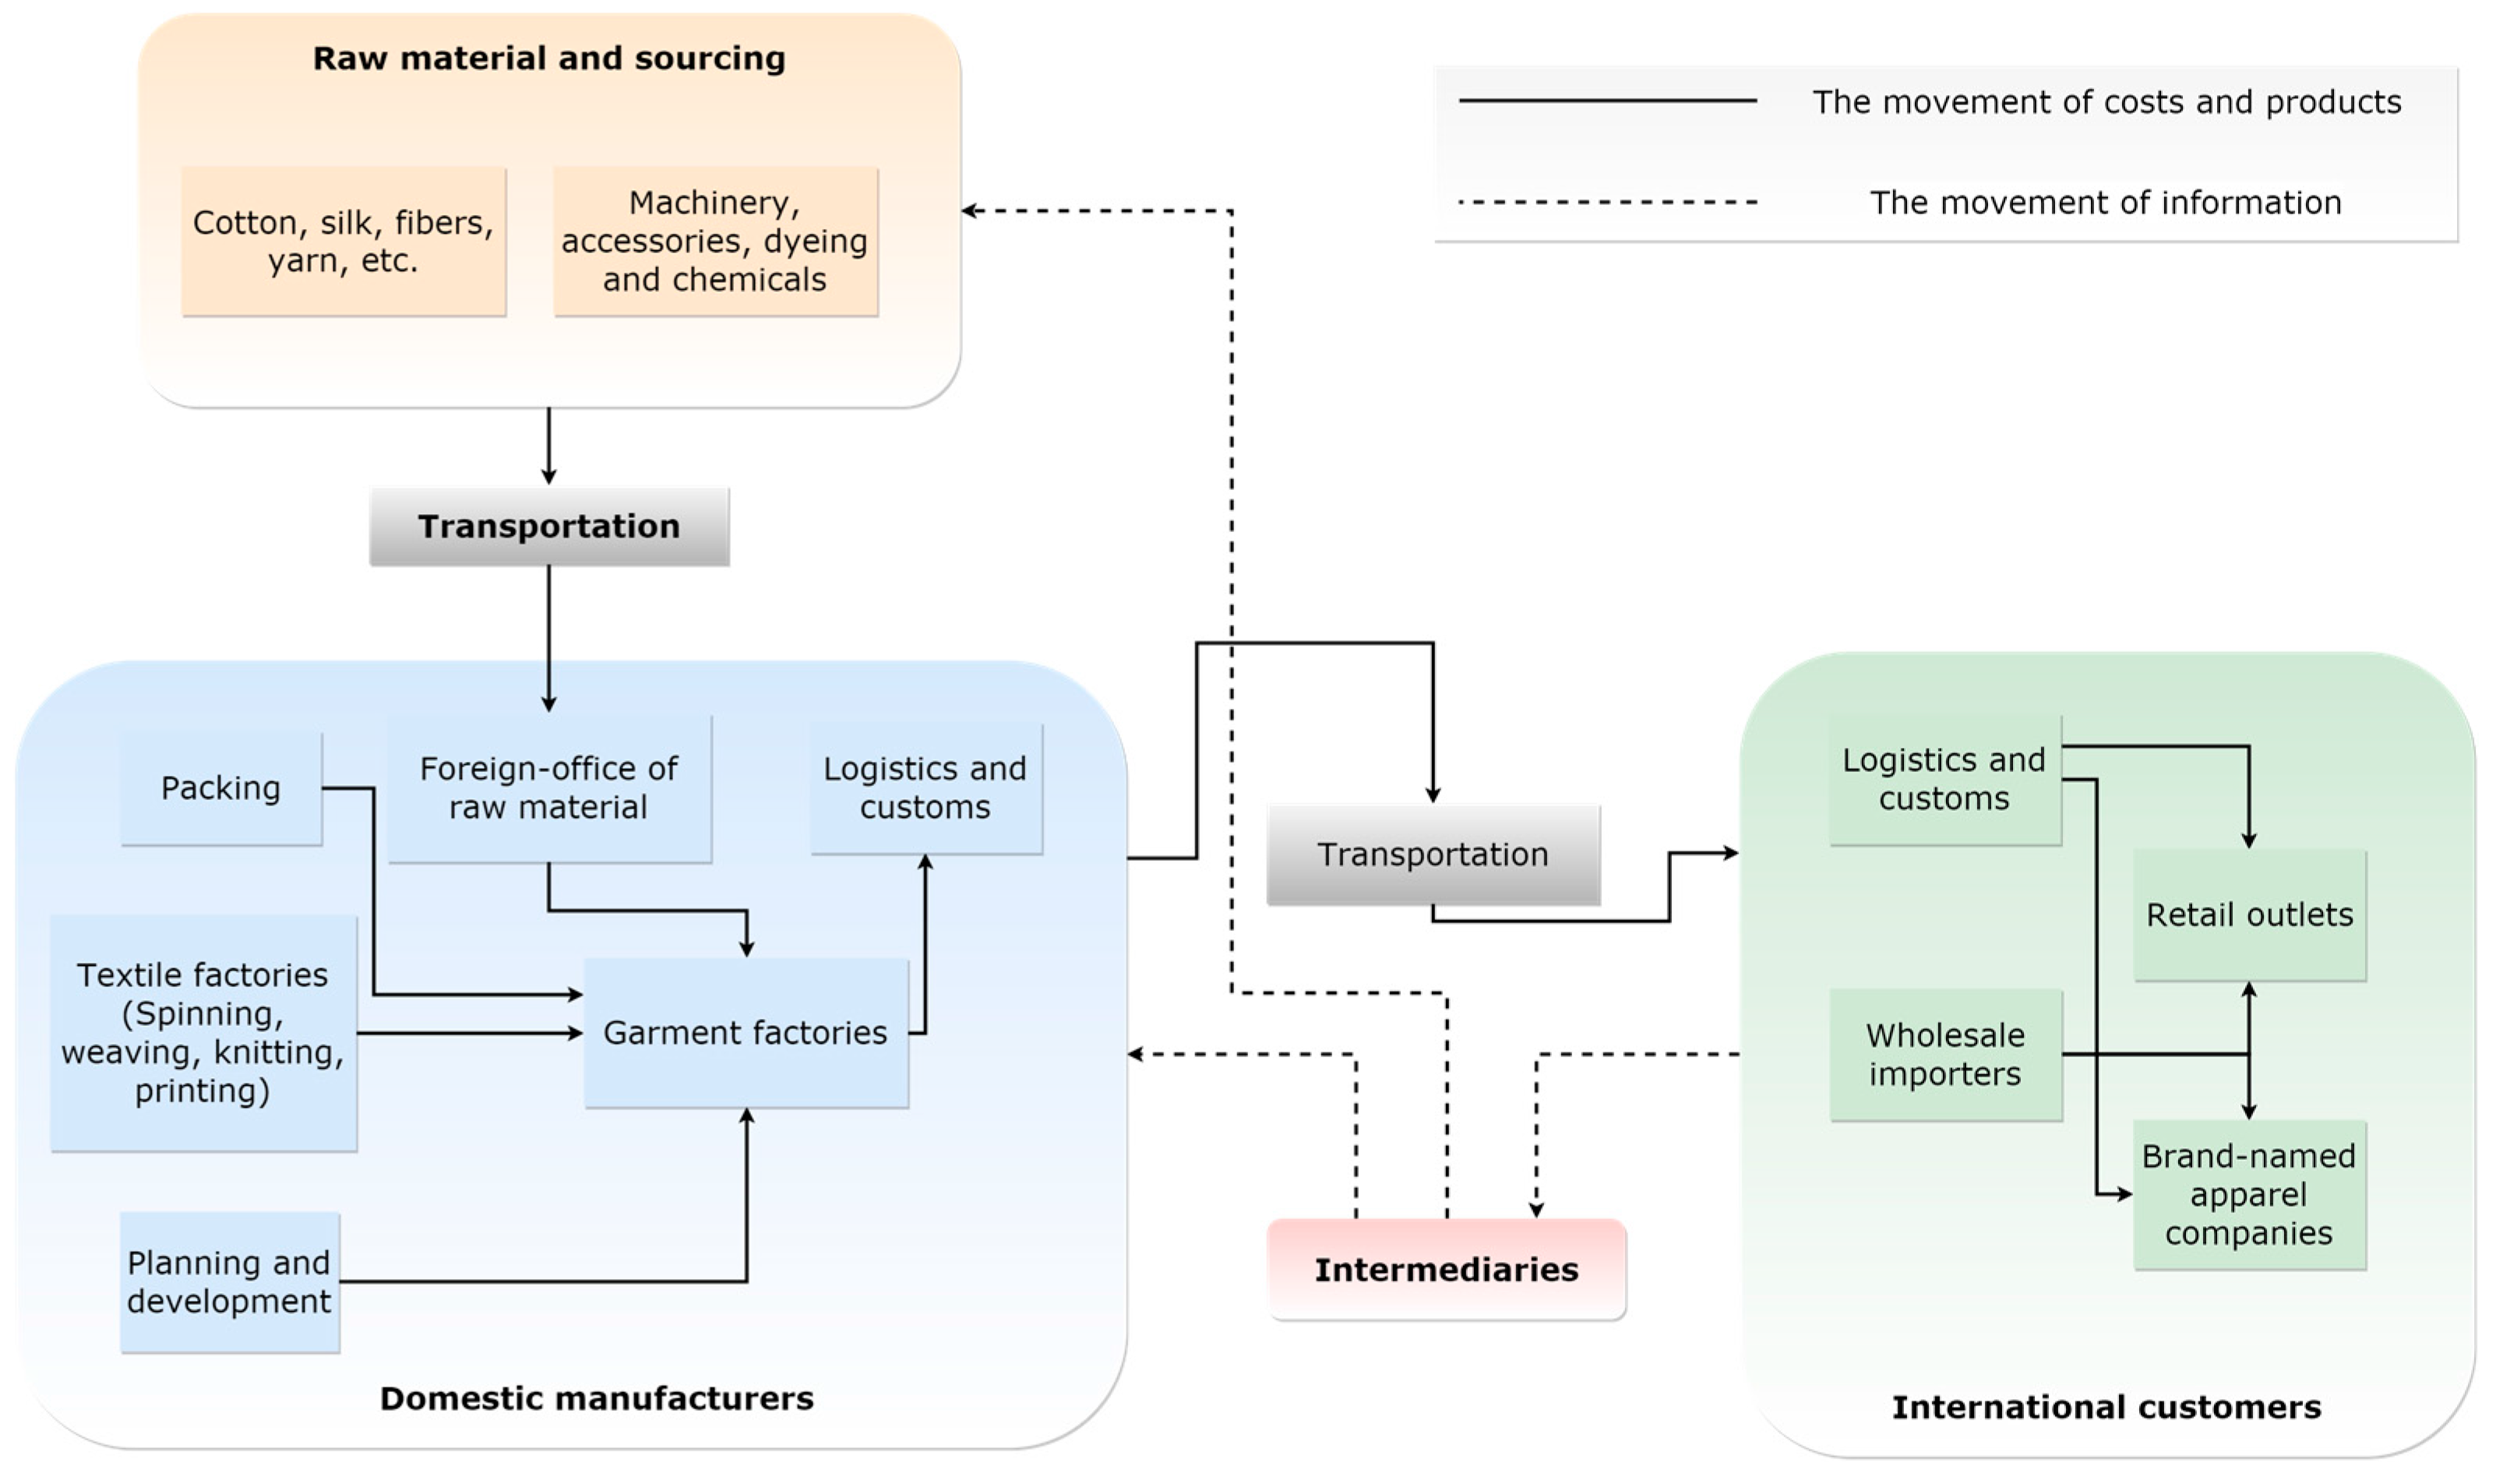
1]. According to Vietnam Textile and Apparel Association (VITAS), the main components of its value chain include tight connection among raw material suppliers, domestic manufacturers, intermediaries and international customers, as shown in
Figure 1 [
1].
In the value chain of Vietnam’s apparel industry, the linking role between textile and garment companies is fundamental nature of product life-cycle from material suppliers to end users. To reduce defects, inventories, and production time, Product Lifecycle Management (PLM) is very important to meet the fierce competition in today’s markets [
5]. Textile firms with the application of PLM and lean principles could provide intangible benefits with key technology for every stage of companies, in terms of design, scheduling, development, and production. The raw material supply plays an important role in New Product Development (NPD); proper suppliers are a direct channel to reach market’s need at the right time [
6]. Therefore, similar to every other industry, PLM and lean production are applied as useful methods in the Vietnamese textile domain and further improve the entire performance of its supply chain [
7].
Despite the general advantages of low labor cost in Vietnam, there are only about 10 thousand hectares of cotton planted, with annual production satisfying 2% of domestic production needs [
3]. The industry depends on more than 70% imported materials and accessories from foreign countries, including China, Korea and Taiwan, which increases the trade deficit and reduces the strength of the industry [
2]. The imbalanced linkage between textile and garment sector causes the rise in cost and decline in quality, which is the largest challenge and barrier for Vietnam’s textile and apparel industry in the long term [
8]. Production modality with 85% CMT (Cut, Make and Trim) is considered low profit by Vietnamese garment companies [
1]. Most companies are small to medium sized and have low ability to adapt high technology and new equipment [
9]. Although workforce demand is high, the fierce rivalry is still contained within industry on attracting and retaining high quality employees. Therefore, in this study, the integrated approach of prediction model and performance evaluation is required to provide the performance improvement and foresee factors that can influence the outcome of Vietnamese textiles and garment companies.
Sustainability management is addressed the linkage between strategic information and systematic approach to provide insights into business strategy and efficiency of processes (Schaltegger and Wagner 2006) [
10]. Sustainability performance can be defined as the evaluation of all indicators and determinants that are most appropriate for the business (Artiach et al., 2010) [
11]. This concept has extended optimization beyond the boundaries of single firm to further obtained sustainable performance from both suppliers and customers in the value chain (Epstein and Roy 2003) [
12]. By understanding sustainability performance, this paper intends to provide both qualitative and quantitative measurement of business activities, contributing to sustainable development goals. In this study, the performance evaluation of individual companies and the entire industry are crucial information for researchers and managers to understand the overall movements of a value chain from material suppliers to customers, and how textile and garment companies could support each other.
In this paper, some findings are provided after obtaining results from hybrid model of grey prediction—Malmquist Productivity Index (MPI)—window analysis. Grey prediction is used to generate future financial indicators, which are considered key performance factors contributing to measurable values that demonstrate how effectively a company is achieving their objectives and they are necessary data for enterprises to make strategic plans for production and be prepared for various difficult situations. MPI and its decomposition into technical change and efficiency change clearly illustrate the context of companies and explore the linkage within Vietnamese garment and textile sector over the period 2010–2015. This paper aims to provide feasible solutions to improve overall performance of the industry in the long term. However, MPI is only useful to estimate changes in the overall productivity growth of each two-year period. The efficiency change reported in MPI, where all companies in the entire industry are treated and measured against each other, might be unfair comparisons because production size and technology are different in each sector. Therefore, to deal with problems of unfair measurement during the 12-year analysis (2010–2021), it is further examined by window analysis, which is used to detect performance trends in a sector over years.
2. Literature Review
Javier et al. (2015) found a road map about how PLM is used to support the development of textile products and a set of reliable tools has been specified to understand significant benefits for the new product introduction (NPI) [
13]. Enrico et al. (2016) provided a sophisticated approach to measure how and where a Collaborative Product Development/Definition and Management solution can be applied to make important improvements for enterprises, and also present useful techniques to be employed in textile and garment industry [
14]. George et al. (2011) proved that lean manufacturing principles are crucial for textile factories to eliminate waste, production cost and non-value-added activities at every stage of production and finally enhance customer satisfaction [
15].
Many studies have been focused on global textile and apparel industry over the past many years [
16,
17,
18,
19,
20]. Federick and Gereffi (2011) proved that China has been a winner, while other Asian suppliers are still struggling to expand the linkage into textile manufacturing, garment design and branding strategy [
21]. Teng and Jaramillo (2005) have developed five main clusters to reflect the performance of a global supplier in the supply chain of textile and apparel industry based on evaluation method to decrease costs and increase competitiveness for companies [
22]. Shen and Li (2015) provided several significant findings regarding the impacts of returning unsold products in retail outsourcing fashion supply chain to improve the value of its industry [
23].
Grey system theory was originally developed by Deng (1982) [
24]; it requires only the limited amount of data to analyze the behavior of unknown variables. The theory is well known, with its power to deal with systems of unclear factors. Among grey models (GM), GM (1, 1) model is the most useful one based on generating operation of the time series data; its major benefit is that it only needs a mathematical formulation [
25]. Grey prediction is used to predict future values based on realistic data [
26]. Tang et al. applied the grey model GM (1, 1) to forecast carbon emissions, and the results showed that carbon emissions will rise in Jiangsu Province over the period 2015–2020; therefore, a prompt improvement plan is considered carefully to minimize future carbon emissions [
27]. Grey forecasting model was employed to forecast future indicators in logistic companies by Yu et al. and the empirical results found problems and suggested solutions to enhance competitiveness relative to rivals in global economic uncertainty [
28].
Data Envelopment Analysis (DEA) is an approach to evaluate efficiencies of Decision Making Units (DMUs); it has the function to convert multiple inputs into multiple outputs [
29]. Charnes, Cooper, and Rhodes (1978) defined DEA as a mathematical program employed to measure observation objectives [
30,
31]. DEA was first used for non-profit organizations; however, DEA methodology has been discussed in many papers and applied in various types of industries over the last decade. For example, Tsai (2016) adopted DEA method to clarify the relationship among labor forces, energy consumption, government expenditures, GDP, and CO
2 emissions, and the result provided some useful recommendations for both European and Asian countries [
32]. DEA was used to improve patent strategies in Korea; the purposes of this research was to find which patent applications are strong or weak in South Korea and some solutions are recommended to make weak industries become strong [
33]. Zeng et al. employed a three-stage data envelopment analysis (DEA) to estimate the efficiency of investments made in the Chinese culture industry in 2011, and the results indicate that the overall efficiency of its industry will remain low; therefore, some suggestions for improvement where made [
34].
3. Methods
3.1. Grey Prediction
Grey prediction is based on grey model (GM) and it has three basic operations: accumulated generating operation (AGO), inverse accumulated generating operation (IAGO) and grey modeling. Among the different types of grey prediction models, the GM (1, 1) model is the most frequently used. In GM (1, 1), the first 1 means that there is only one variable, and the next 1 means that the first order grey differential equation is used to construct the model. The grey prediction formulation based on GM (1, 1) model is here described in details [
24,
25,
26]:
Consider non-negative data:
Then, the GM (1, 1) is:
where “
a” is called “develop parameter” and “
b” is called “grey input”. Next, perform the following procedures:
Step 1: Take AGO on
:
Step 3: Using Least Squares Method, find matrix
B and vector
Step 4: Estimate the parameters
a and
b by the following set of equations:
Step 5: Find the response equation:
Step 6: The predicted value is described as:
Errors are always present in forecasting calculations. Therefore, Mean absolute percent error (MAPE) is used to measure the predictive errors; they are essentially about prediction the future with incomplete data [
35]. Stevenson (2009) pointed out clearly that MAPE is the average absolute percent error, which measures the accuracy in statistics of time series data [
36].
The parameters of
MAPE originally start from the forecasting ability; the details of interpretation are described below [
35,
36]:
<10% Excellent forecasting ability
10%~20% Good forecasting ability
20%~50% Reasonable forecasting ability
>50% Poor forecasting
3.2. Malmquist Productivity Index
Malmquist Productivity Index (MPI), and its sub-components, one of the powerful models of DEA approach, was originally proposed by Caves et al. in 1982 [
37]. MPI is used to estimate changes in the overall productivity growth of each DMU over a two-year period by calculating efficiency score.
Färe et al. (1994) defined the operating performance of each DMU in time period
s and
t as (
,
) and (
,
), respectively, where
(
,
) is a distance function measuring the conversion of efficient inputs
to outputs
in the period s; and
(
,
) is a distance function measuring the efficiency of conversion of inputs
to outputs
in the period
t [
38]. MPI performance reflects the efficiency score by converting inputs to outputs.
The formulation is as follow:
MPI is decomposed into the efficiency change and technical change. MPI > 1 indicates productivity improvement; MPI = 1 means no productivity change; and MPI < 1 demonstrates productivity reduction. Efficiency change is called “catch-up effect”; the efficiency change in the term related to the degree of a DMU improves or worsens its efficiency. Efficiency change > 1 indicates a progress from period s to t, while efficiency change = 1 and efficiency change < 1, respectively, indicate no change and regress in efficiency. Technical change is called “frontier-shift effect”. The technical change reflects the change in the efficient frontiers between the two time periods. Technical change > 1 stands for technical progress; technical change = 1 illustrates that there are no changes in technical indices; and technical change < 1 means technical regress.
3.3. Window Analysis
Window analysis, proposed by Charnes et al. (1985) [
30,
31], is one of the useful models of DEA methodology. It is adopted to detect the tendency of DMUs over long-period with large inputs and outputs, which is a benefit to deal with small sample size. It is a moving-average analysis and the performance of each unit individually in window multiple times (Yue 1992) [
39]. The use of window analysis provides opportunities to understand how performance goes through sequences of overlapping window [
40]. A brief window analysis is presented here. Consider
n DMUs (
m = 1, …,
n) that are observed in
P periods and all require
r inputs to produce
s outputs. The sample thus has
n × P observations and an observation
m in period
t,
DMUs has an
r-dimensional input vector
and an
s-dimensional output vector
. The window starting at time
k, 1 ≤
k ≤
P and with the width
w, 1 ≤
w ≤
P-k, is denoted by
kw and has
n ×
w observations. The matrix of inputs for this window analysis is given by [
39,
40]:
It is suggested to incorporate multiple constraints in window analysis model and to have in-depth knowledge of relative information of inputs and outputs to achieve more realistic efficiency estimates. The formulation is shown as follow:
3.4. Reasons to Choose Grey Model, MPI, and Window Analysis
In this paper, applying grey prediction helps enterprises deal with many unpredictable issues, and deeper understanding towards difficult problems in the term related to the future values can be solved. In fact, outcomes of a business in Vietnam have uncertainly due to many complicated issues, such as trade barriers, financial crisis and global economic downturn, fierce competition and internal factors. Grey prediction only requires at least four consecutive years of data, which is matched with collective data in this study. It is useful to estimate the behavior of problems that might occur in Vietnamese textile and apparel industry, which has not been discussed yet. Thus, this method is suitable for variable trends, and finds solutions for future works of general management, production planning, and control activity with higher accuracy based on the predicted numbers in the following years.
Most DEA models can be used for evaluating efficiencies of decision-making units by enabling conversion of multiple inputs into multiple outputs. However, they only can analyze a single time period in short-term. Among a set of DEA models, this paper chose Malmquist productivity index and window analysis model with the aim of sustainable performance evaluation due to its advantages compared to conventional DEA techniques. MPI is more general, efficient, can be applied to measure productivity changes between two periods, and it provides separately information on the changes of efficiency and technology for the entire industry. In many studies, observations for decision-makers are frequently available over multiple periods, and efficiency often changes over time. In such a circumstance, window analysis can be adopted to detect trends over time. DEA window analysis aims to provide clear results, even with a small set of comparable companies and a large number of inputs and outputs for many years.
Therefore, this study employs hybrid models of grey prediction–MPI–window analysis to analyze performance of industries and their sub-groups. This integrated approach aims to help companies in decision-making by combining simultaneous models with qualitative and quantitative data in order to convert multiple inputs into multiple outputs, and deal with unknown system . These features match with the major purpose of this study for value chain of textile and apparel industry.
3.5. Research Design
This study consists of grey prediction, MPI and window analysis models as the foundation for forecasting and measuring the performance of Vietnam textile and apparel companies.
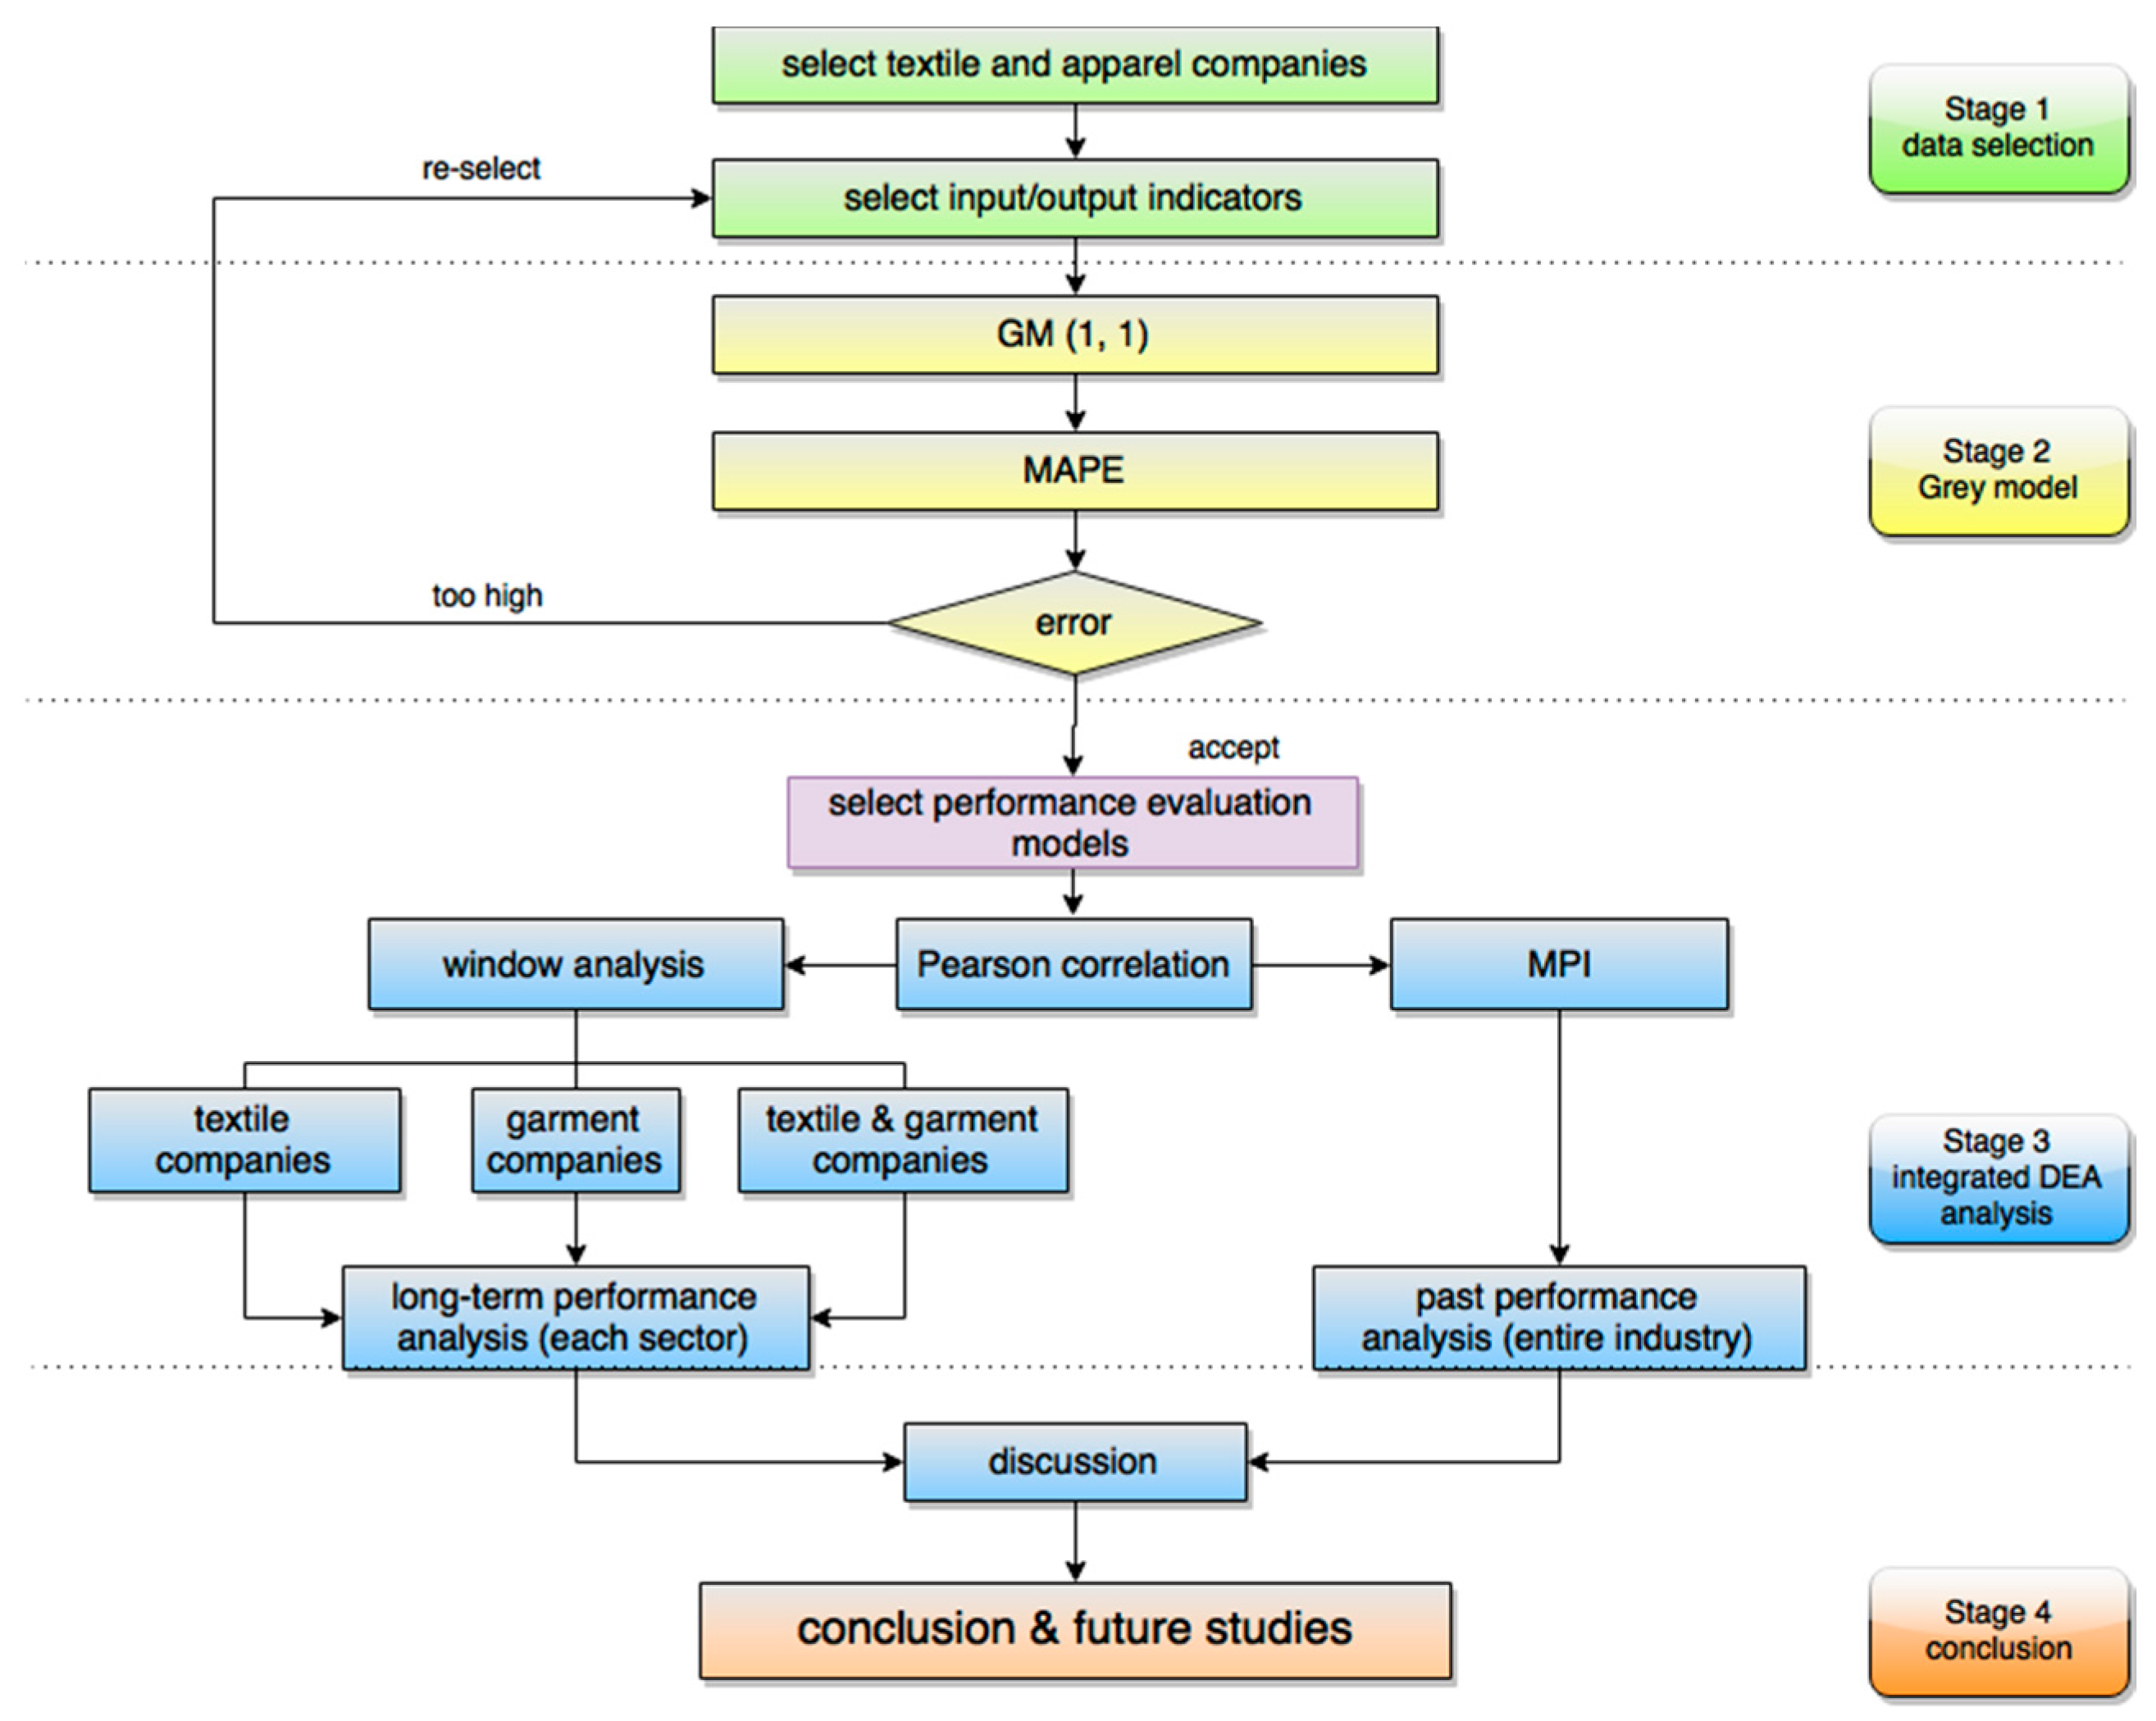
Figure 2 describes four main stages of research design.
| Stage 1. | Data selection includes two steps: First step is to collect Vietnamese textile and apparel companies in which firms published their financial statement in Vietnam’s stock market during the period 2010 to 2015. Second step is to select input and output indicators. The choice of input and output factors will influence the evaluation of efficiency value; therefore, it is important to consider thoroughly beforehand and choose the most important ones as key factors to the performance of companies and the value chain of Vietnam’s apparel industry. |
| Stage 2. | Grey prediction based on GM (1, 1) model is used to forecast values from 2016 to 2021. However, forecast calculations always have errors. Therefore, MAPE is applied to measure the accuracy of prediction model. If the forecasting error is too high, then new input and output factors will be selected before proceeding to the next steps. |
| Stage 3. | The integrated DEA analysis consists of five main steps. Firstly, the choices of performance evaluation models are considered carefully to provide in-depth analysis of companies and its value chain. Among the set of DEA models, this paper chose Malmquist Productivity Index (MPI) and window analysis based on their advantages over other DEA methods. Secondly, it is important to test if there is a positive correlation between the selected inputs and outputs. In this study, the Pearson Correlation Coefficient test is employed to measure the efficiency of each decision-making unit. Thirdly, MPI and its decomposition into efficiency and technical change are used to analyze the productivity growth of the entire industry from 2010 to 2015. Fourthly, window analysis is applied to detect performance trends of each sub-industry over the past years (2010–2015) and forecasted years (2016–2021). Finally, discussion is crucial step to combine the analysis of all models and some suggestions are recommended in this paper. |
| Stage 4. | The conclusions provides some valuable insights for value chain of Vietnam’s textile and apparel industry based on empirical results found from previous sections. Future studies are also suggested in this stage. |
4. Results and Discussions
4.1. Data Collection
In 2016, the entire industry obtained a total export turnover of $28.3 billion. There are about 6000 textile and apparel companies; however, less than 1% are large businesses, and few are listed on the Viet-stock market [
41]. In this study consideration, companies for which financial data have not been found on the Vietnam stock market website are not included. Therefore, 20 of the largest companies that published consolidated financial statements on Viet-stock market for the six consecutive years 2010 to 2015 are adopted to represent the entire industry. According to Vietnam Textile and Apparel Association, these enterprises are considered to have the largest scale reflected by revenue in 2015. Companies’ stock stickers are used for naming scheme throughout this study while applying the integrated methods.
Table 1 shows the details of the financial indicators of Thanh Cong Company named by stock sticker TCM as example.
In Vietnam textile and apparel industry, the garment sector is predominantly export-oriented, whereas Vietnamese textiles are mainly sold in the domestic market. Some sizeable companies are involved in both textile and garment production to actively supply material for its garment products; however, many firms only focus on either textiles or garments. Therefore, to provide clear picture of each sector, the entire industry is classified into three sub-industries: eight garment factories named No. 1 to No. 8; four textile companies named No. 9 to No. 12; and the remaining named No. 13 to No. 20 represent those companies involved in both sectors (
Table 2 and
Table 3).
The selection of proper inputs (I) and outputs (O) will affect significantly the decision-making. The number of companies is at least twice the total number of input and output factors considered for the integrated approach. In this research, all inputs and outputs are considered carefully so that conclusion drawn may not be misleading. This study aims to evaluate the performance of entire textile and apparel industry. Therefore, the selections of financial indicators are highly correlated to standard and enterprises’ operating performance.
Among the key financial ratios, three inputs, total assets, owners’ equity, and sales expense, are considered key performance indicators of input sources. This paper chooses net revenue and earnings per share (EPS) as output indicators because they are important indexes for measuring company performance.
4.2. Grey Prediction
Stage 2 covers two parts: grey prediction to provide forecasted values and MAPE to test whether the selection of inputs and outputs are accurate. For two decades, many scholars have achieved expected results based on grey prediction model. It is required to have at least four consecutive periods.
In this study, the values of six consecutive years (2010–2015) are used to forecast financial indicators for the following six years from 2016 to 2021 based on GM (1, 1) model. The study takes the company Thanh Cong, specialized in manufacturing both textile and sewing products, with stock sticker TCM, as an example to understand how to compute the prediction model in period 2010–2015.
Table 1 shows the original data of TCM Company from 2010 to 2015.
In this paper, a total asset of TCM is taken as example to explain the calculation procedure, and other variables are calculated in the same way.
First, the researcher uses the prediction model to forecast the variance of primitive series.
1st: Create the primitive series it means the original values of total assets of TCM from 2010 to 2015.
2nd: Perform the accumulated generating operation (AGO)
3rd: Create the different equations of grey prediction GM (1, 1) to find
series, and the following mean obtained by the mean equation is:
4th: Solve equations:
To find
a and
b, the primitive series values are substituted into the Grey differential equation to obtain:
Convert the linear equations into the form of a matrix:
Then, use the least square method to find
a and
bUse the two coefficients
a and
b to generate the whitening equation of the differential equation:
Find the prediction model from Equation:
Substitute different values of
k into the equation:
Derive the predicted value of the original series according to the accumulated generating operation and obtain as follows:
By the same calculation and procedures, all forecasted values of all companies from 2016 to 2021 are found for the purpose of the performance evaluation shown in next stages.
To make sure there is no space for errors the occurred during forecasting calculation, MAPE is employed to measure the accuracy of prediction model. When MAPE values are small, it means the predicted values are close to actual ones. The results of MAPE are shown in
Table 2.
Table 2 indicates that the average of MAPE for the 20 companies is 8.85%, which is considered excellent and confirms that the prediction model used in this paper and the selected input/output indicators of the 20 companies are highly accurate. Therefore, the study moves forward to next the stages.
4.3. Pearson Correlation
The purpose of DEA is to measure the efficiency of each decision-making unit by constructing a relative efficiency score. DEA confirms that inputs and outputs must obtain “Isotonicity”, meaning that, if the input quantity increases, the output quantity cannot decrease under the same condition. Therefore, Pearson correlation test is used to make sure data match with the assumption of DEA. In this research, by running the software of the DEA approach, the correlation range between 0.4 and 1, with many DEA correlations higher than 0.8, indicating that these factors have strong positive correlations. Therefore, these positive correlations also demonstrate clearly that the selected of input and output variables are correct. Obviously, no variable removal is necessary. It confirms that inputs and outputs of all required year are appreciated.
4.4. Malmquist Productivity Index
In this research, Malmquist productivity index (MPI) is used to analyze and summarize the productivity growth of the entire industry over the past period from 2010 to 2015. This study also makes comparisons across periods to understand situation of each company compared to the others. The MPI and its decomposition into efficiency and technical change clearly show the context of textile and apparel companies.
Table 3 shows the changes of indices in cross-period (2010–2015); the bold figures indicate the improved variables.
4.4.1. Efficiency Change
Considering the average score of the historic period (2010–2015), the industry experienced an improvement, with average score of 1.23 in efficiency change. Fourteen companies showed clear growth with indices greater than 1; TTG and HTG had no efficiency change; and four companies failed to improve their efficiency, MNB, May Song Hong, Det Viet Thang, and HDM.
Among the three sub-groups, an average score of textile and garment companies had the highest point of 1.51 compared to other groups; textile companies came in second with score of 1.05; and the final ranking is the garment sector with score of 1.03. It is interpreted that these textile and garment companies can actively supply textile materials for their own production networks; therefore, they gain more benefits compared to other companies in the same industry.
Among 20 companies, the top four companies with the highest progression were Maynhatrang, PPH, TCM, and TET with catch-up scores of 2.96, 1.76, 1.65, and 1.45, respectively, defined as higher than the average score of the entire industry (1.23). This indicates that the productivity growth is implemented with great efficiency and speed within group of textile and garment companies who are focused on manufacturing both textile and sewing products.
The efficiency changes of 20 companies for the period 2010–2015 are illustrated in
Figure 3. It is found that scores of efficiency changes fluctuated over the period, especially Maynhatrang, TCM, TET and PPH. In general, the industry experienced the best improvement during 2010–2011 but showed negative efficiency during 2012–2013.
4.4.2. Technical Change
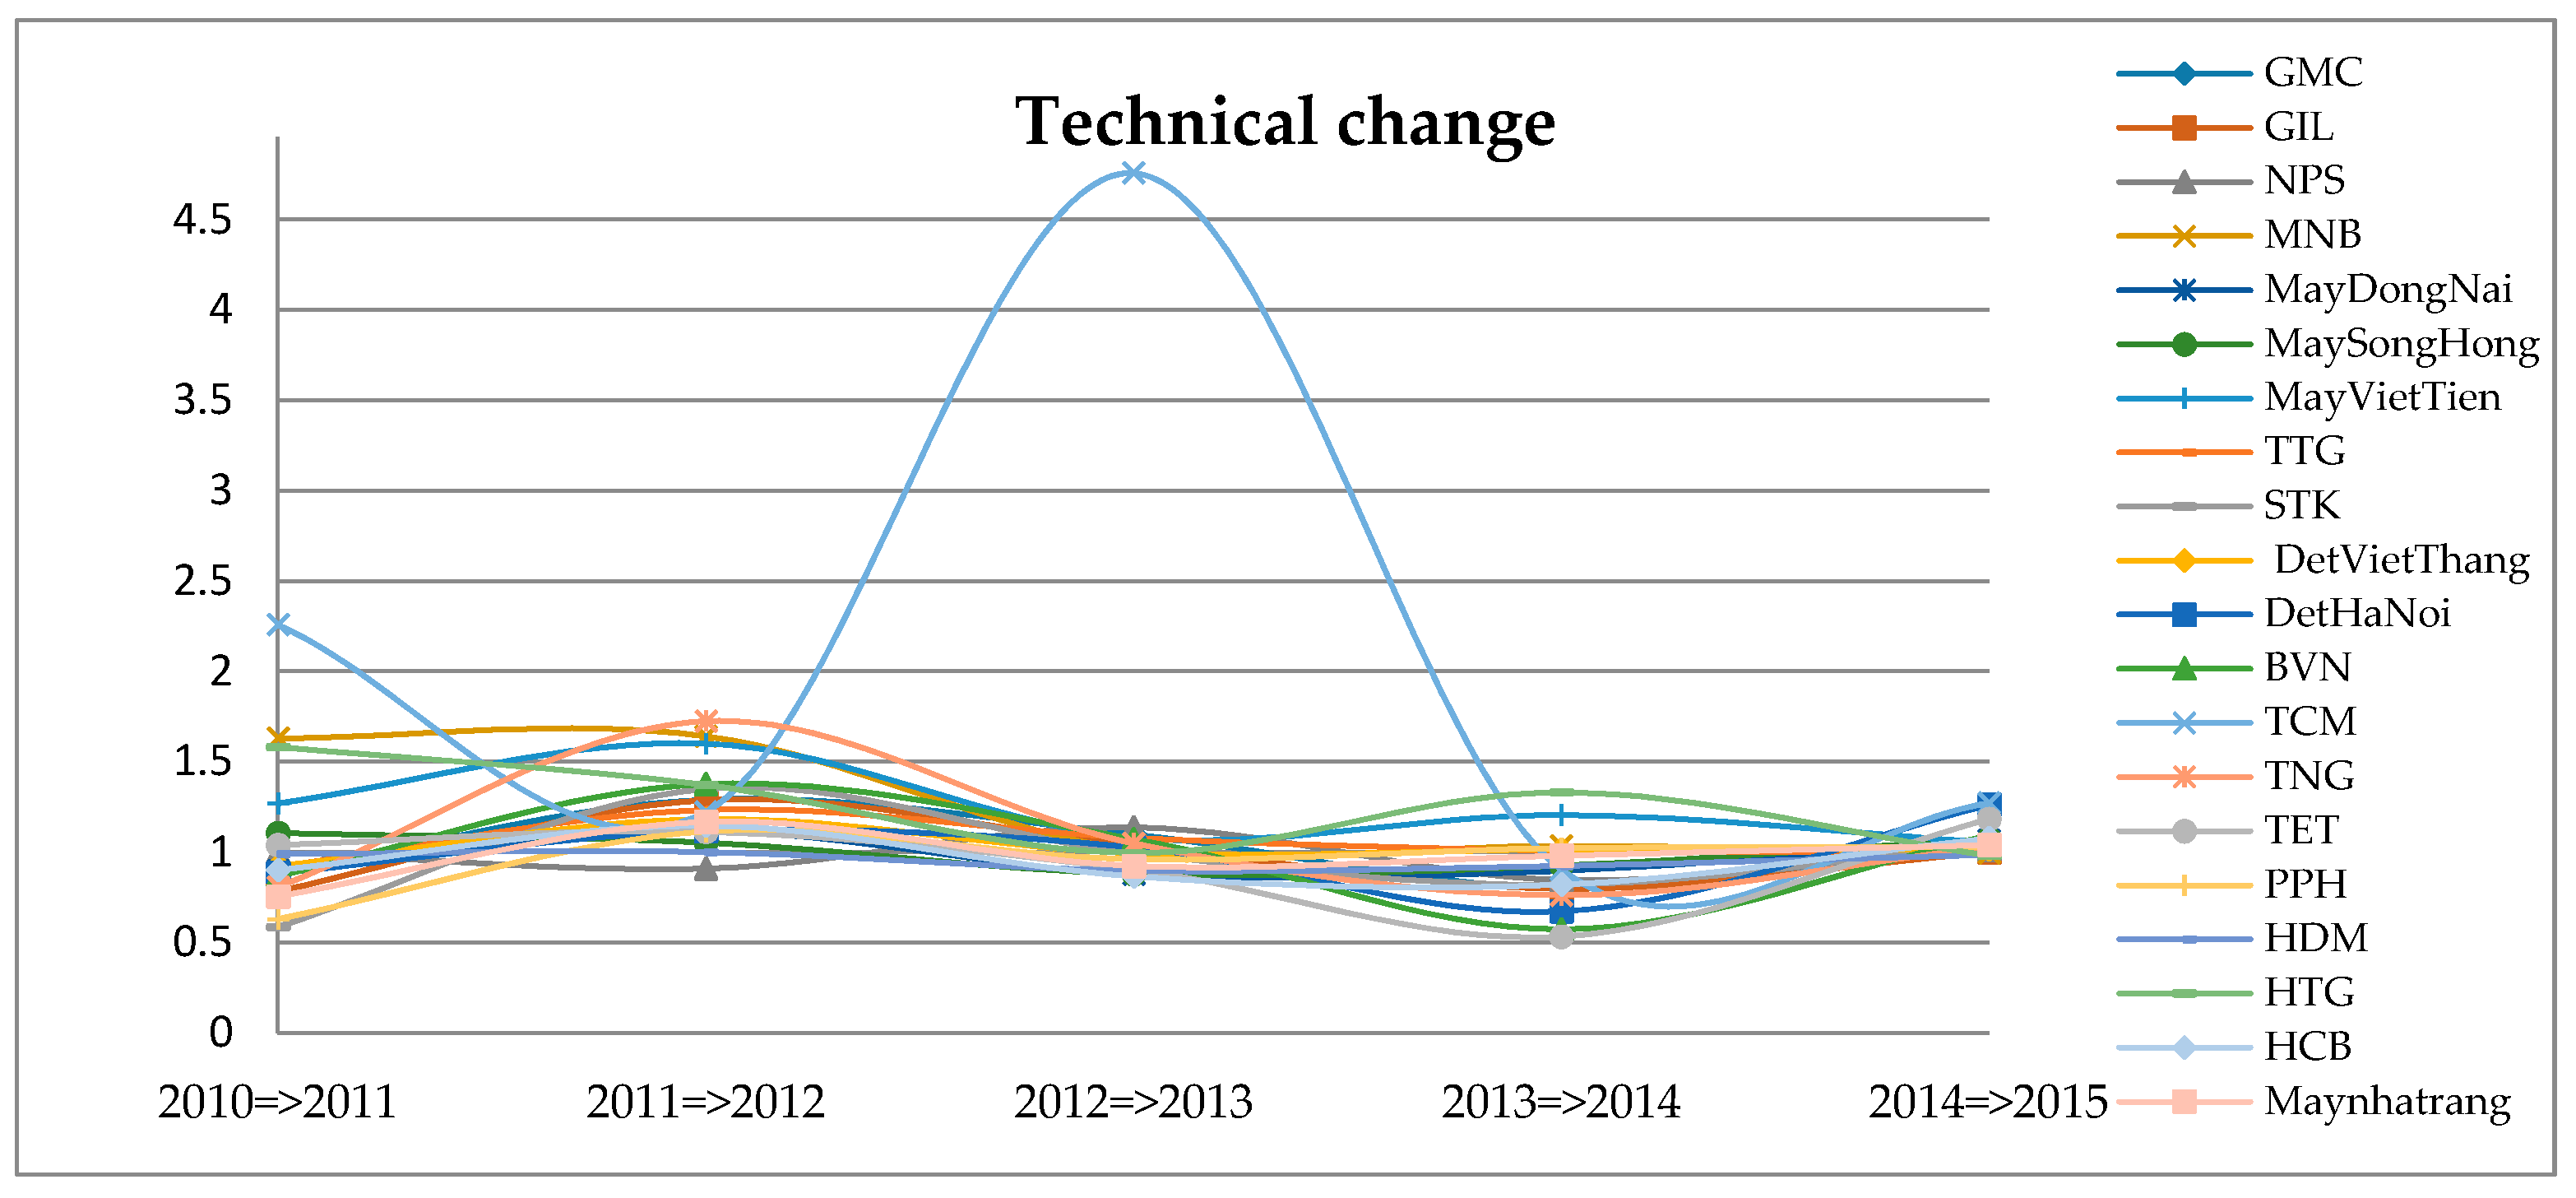
The entire industry experienced an average increase in technical change with score of 1.09 in historic period (2010–2015). TCM, MNB, HTG, May Viet Tien, TNG, GMC, Det VietThang, TTG, and MaySongHong demonstrated positive growth. BVN did not make any change in technology, whereas 10 companies had technical change indices less than 1, which, under this assumption, means they decreased their technological utilization in the past period.
TCM proved that they were the leading company in terms of innovation and technology by obtaining a peak efficiency of 2.08, whereas TET and PPH recorded poor performance on renewable technology with average frontier at lowest point of 0.95.
In general, the group of textile and garment companies ranked first, garment companies followed in second and textile companies came in third. The average score of textile companies was 0.99 with only one in four companies having a technical change greater than 1, considered as very poor technical performance. It is interpreted that the industry is using obsolete technology, and the general development of textile sector has not occurred as expected.
The indices of technical change of 20 companies in period 2010–2015 are presented in
Figure 4. The entire industry witnessed better innovation during 2012–2013. However, they were worsened during 2013–2014. Except TCM, which reached an amazing peak of technical change during 2012–2013, the rest of companies had similar performance and technical fluctuation over the timespan.
4.4.3. Productivity Growth
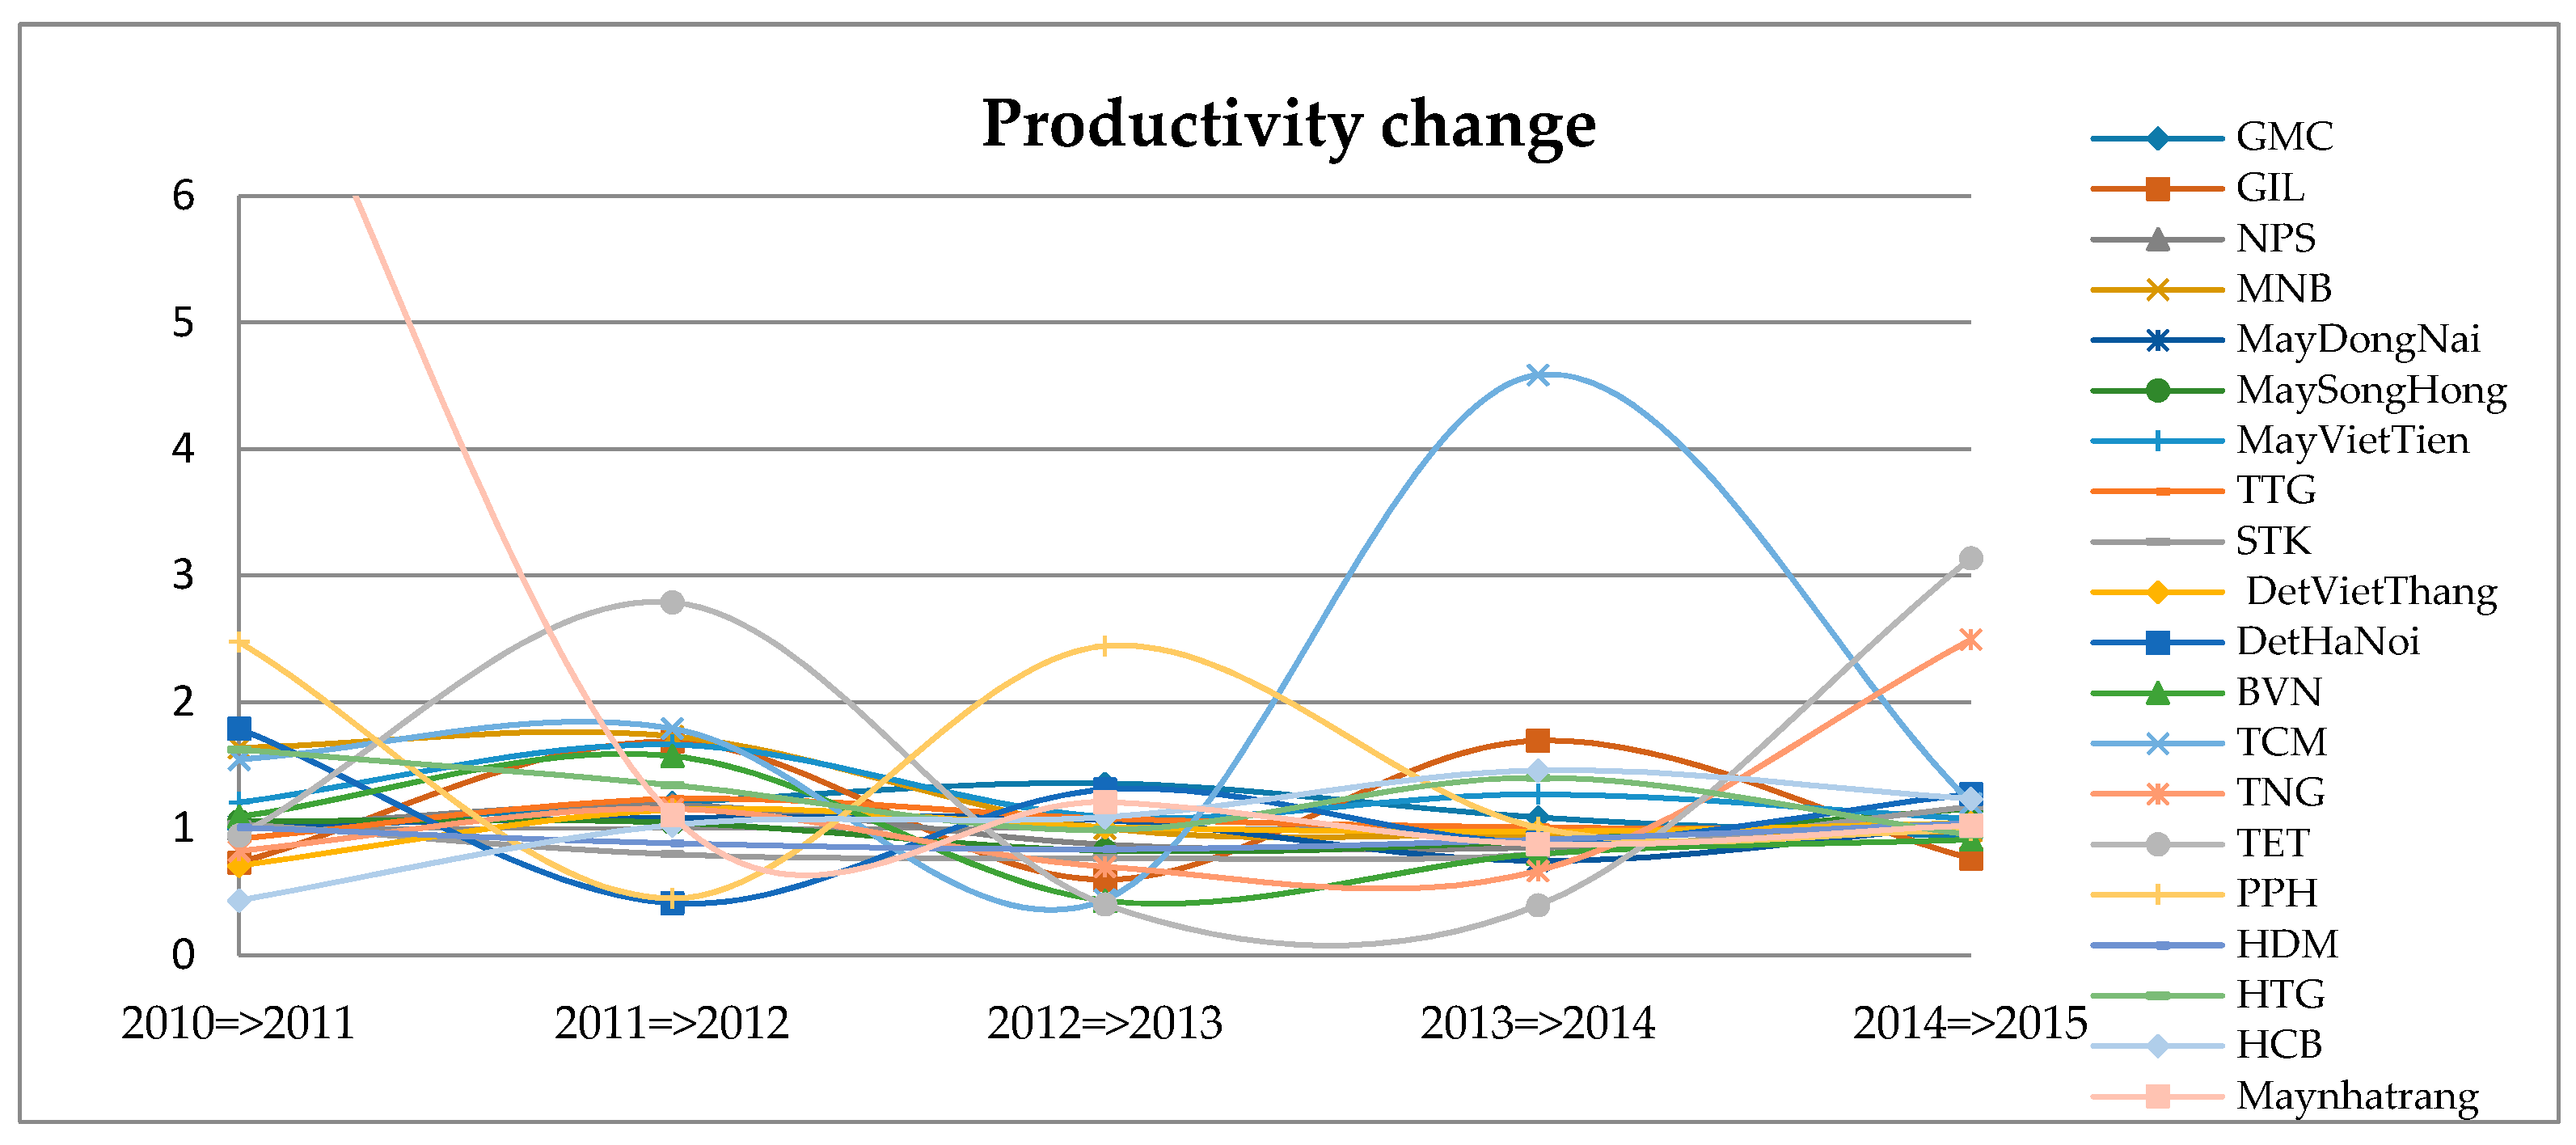
The results of productivity growth are presented in
Table 3 and
Figure 5. The entire industry obtained a positive change in productivity growth with a score of 1.23 over the past six years; it experienced a recession during 2010–2013; and then recovered afterward within period 2013–2015.
Overall, the group of textile and garment companies ranked first place compared to the entire industry, with all of their average MPI indices larger than 1 and strongly stayed positive throughout adjacent years. The garment sector followed, with an average score of 1.09. The average MPI scores for companies in textile sector were 1.00, indicating there is no productivity growth in the last years, which means that the textile companies had difficulties in keeping pace with technological improvements, and they still struggle to increase machinery to support the growing technical textile sector. Underdeveloped technology is the main reason that Vietnam’s textile and apparel industry still largely depends on imported materials (70%). It also caused tremendous challenges and barriers to textile export.
4.5. Window Analysis
Based on characteristics of the value chain of Vietnamese textile and apparel industry, in this paper, the entire industry is divided into three main sub-groups based on the scope of production and operation management with the aim of providing discriminant analysis. In this paper, to avoid misleading measurements, which might be generated under long period analyses, DEA window analysis is applied to detect performance trends of each sector over 12 years; it covers the real values (2010–2015) and forecasted values (2016–2021). The results of inter-temporal analysis are discussed and interpreted where window of 12 years are included. Panel data analysis is used to show how efficient scores changed over time and how each company is performing relative to others in each sector individually.
4.5.1. Garment Companies
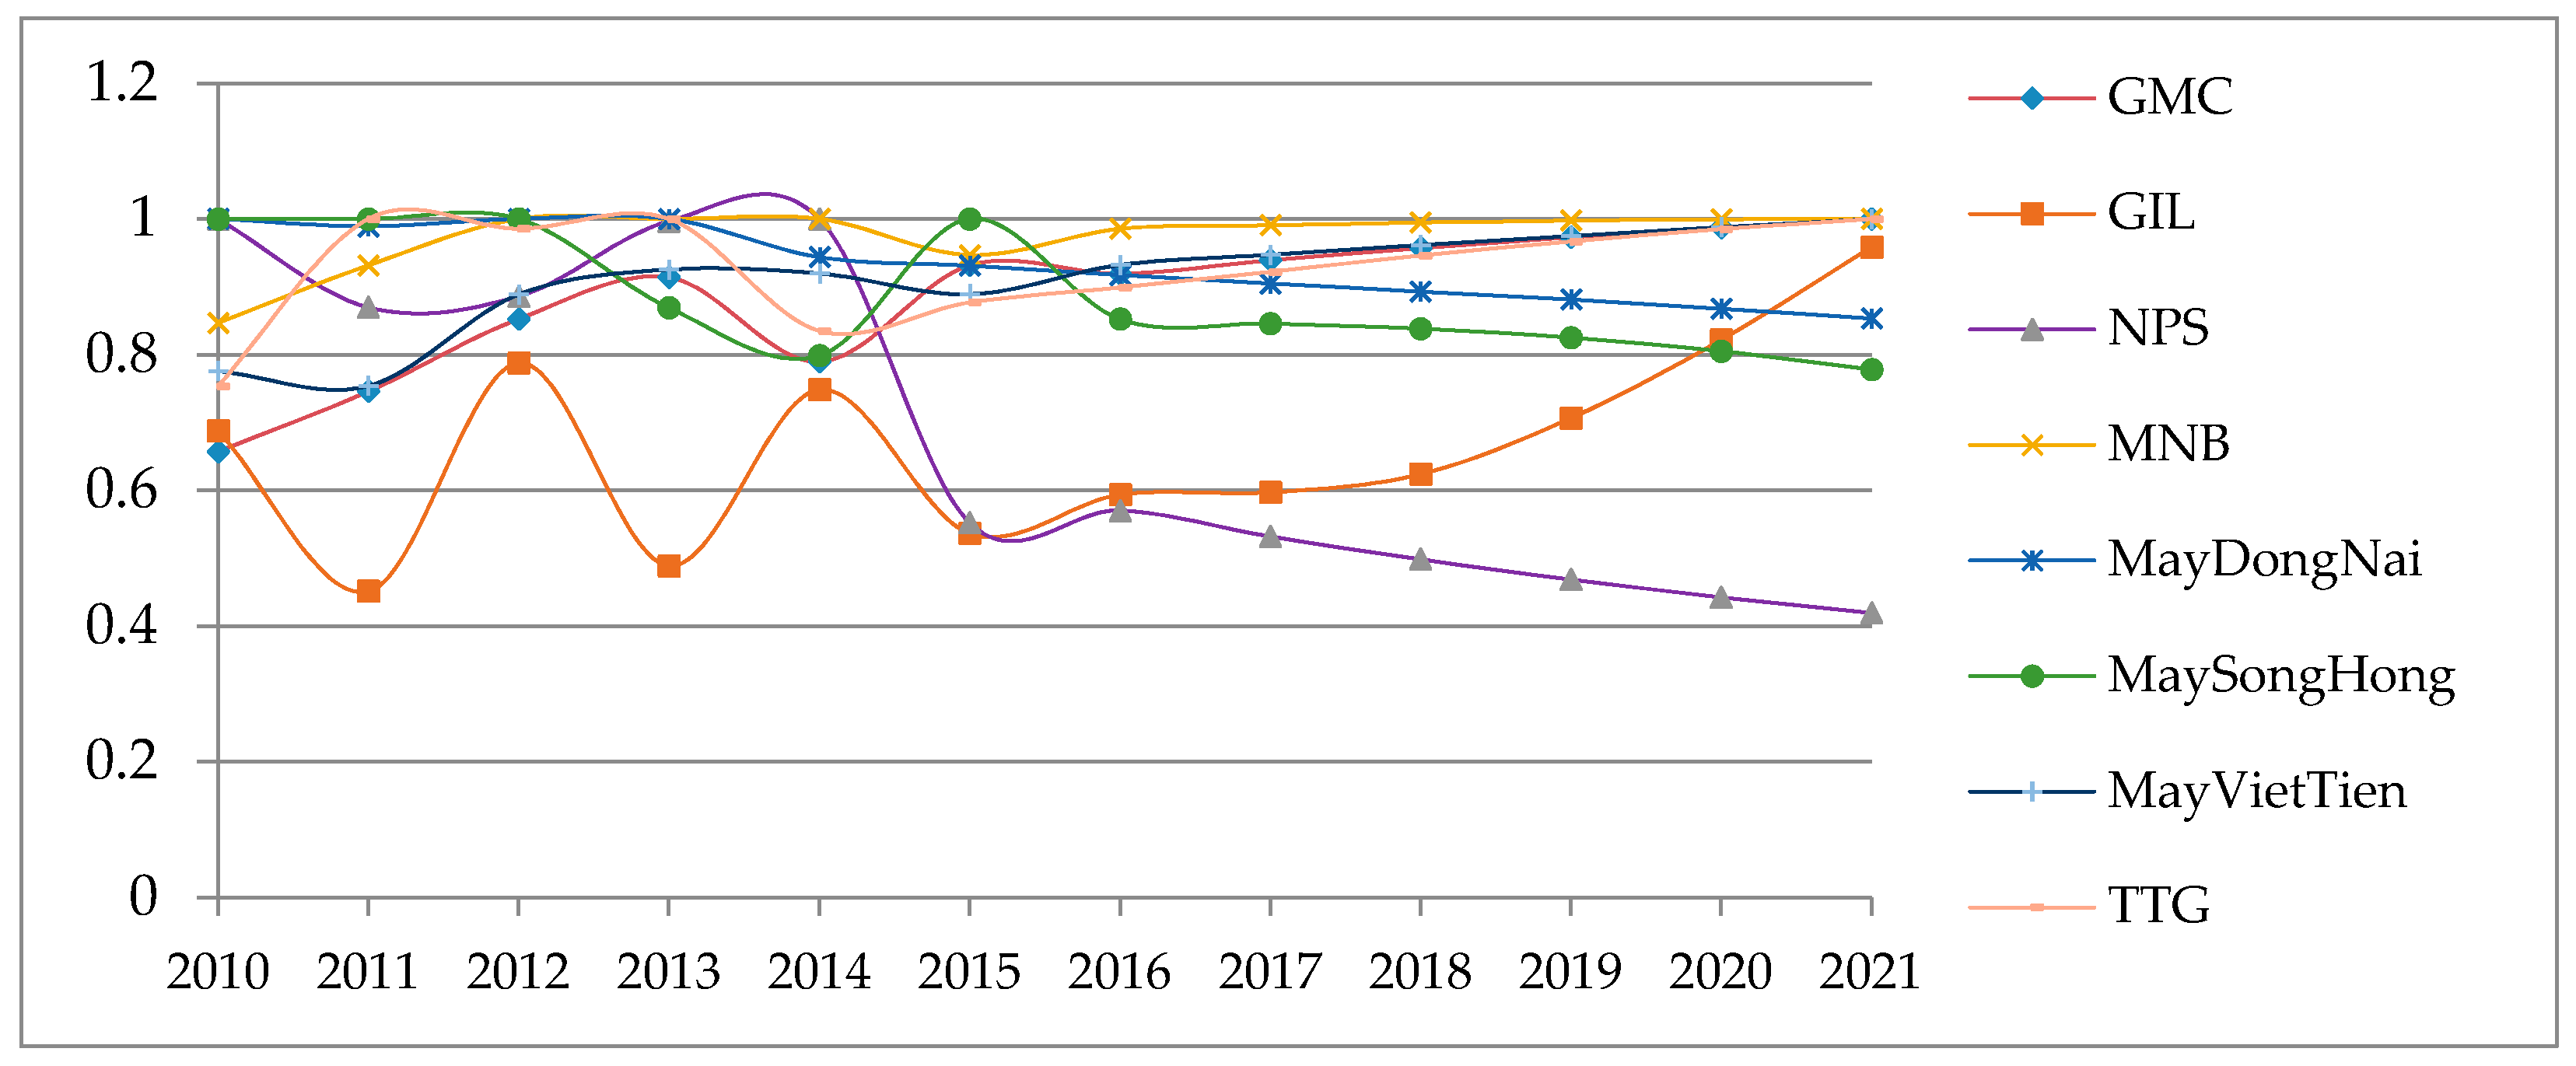
Table 4 shows an average efficiency score of 86% with a minimum of 42%, and 20 out of 96 observations are fully efficient. In general, the sector achieved the highest effectiveness in the year of 2012; however, the industry is predicted to decline in efficiency in forecasted years, with average observation of 84.8%. It seems that companies have difficulties undertaking technological improvements.
The results from this analysis are illustrated in
Figure 6. In detail, a slight decrease in efficiency during 2012–2015, followed by a slow steady increase from 2017 to 2021 is reported. Two periods of consecutive years with unchanged variations in efficiency are 2010–2011 and 2015–2017.
Table 4 and
Figure 6 indicate that there are large variations between companies. MNB, MayDongNai, TTG, and May VietTien prove to be the best performers in garment manufacturing sector, sequentially. MaySongHong, MayDongNai and NPS seem to have difficulty keeping pace in the forecasted years (2016–2021); especially, NPS heavily lost around 50% of its efficiency after 2014. GMC was revalued after deep fall in 2010; since then, they have improved through 2015, and will finally gain fully efficient performance in 2021. GIL is the worst company in this sector and had an extremely negative fluctuation in efficiency during 2010–2015, but hopefully will be better in future years.
4.5.2. Textile Companies
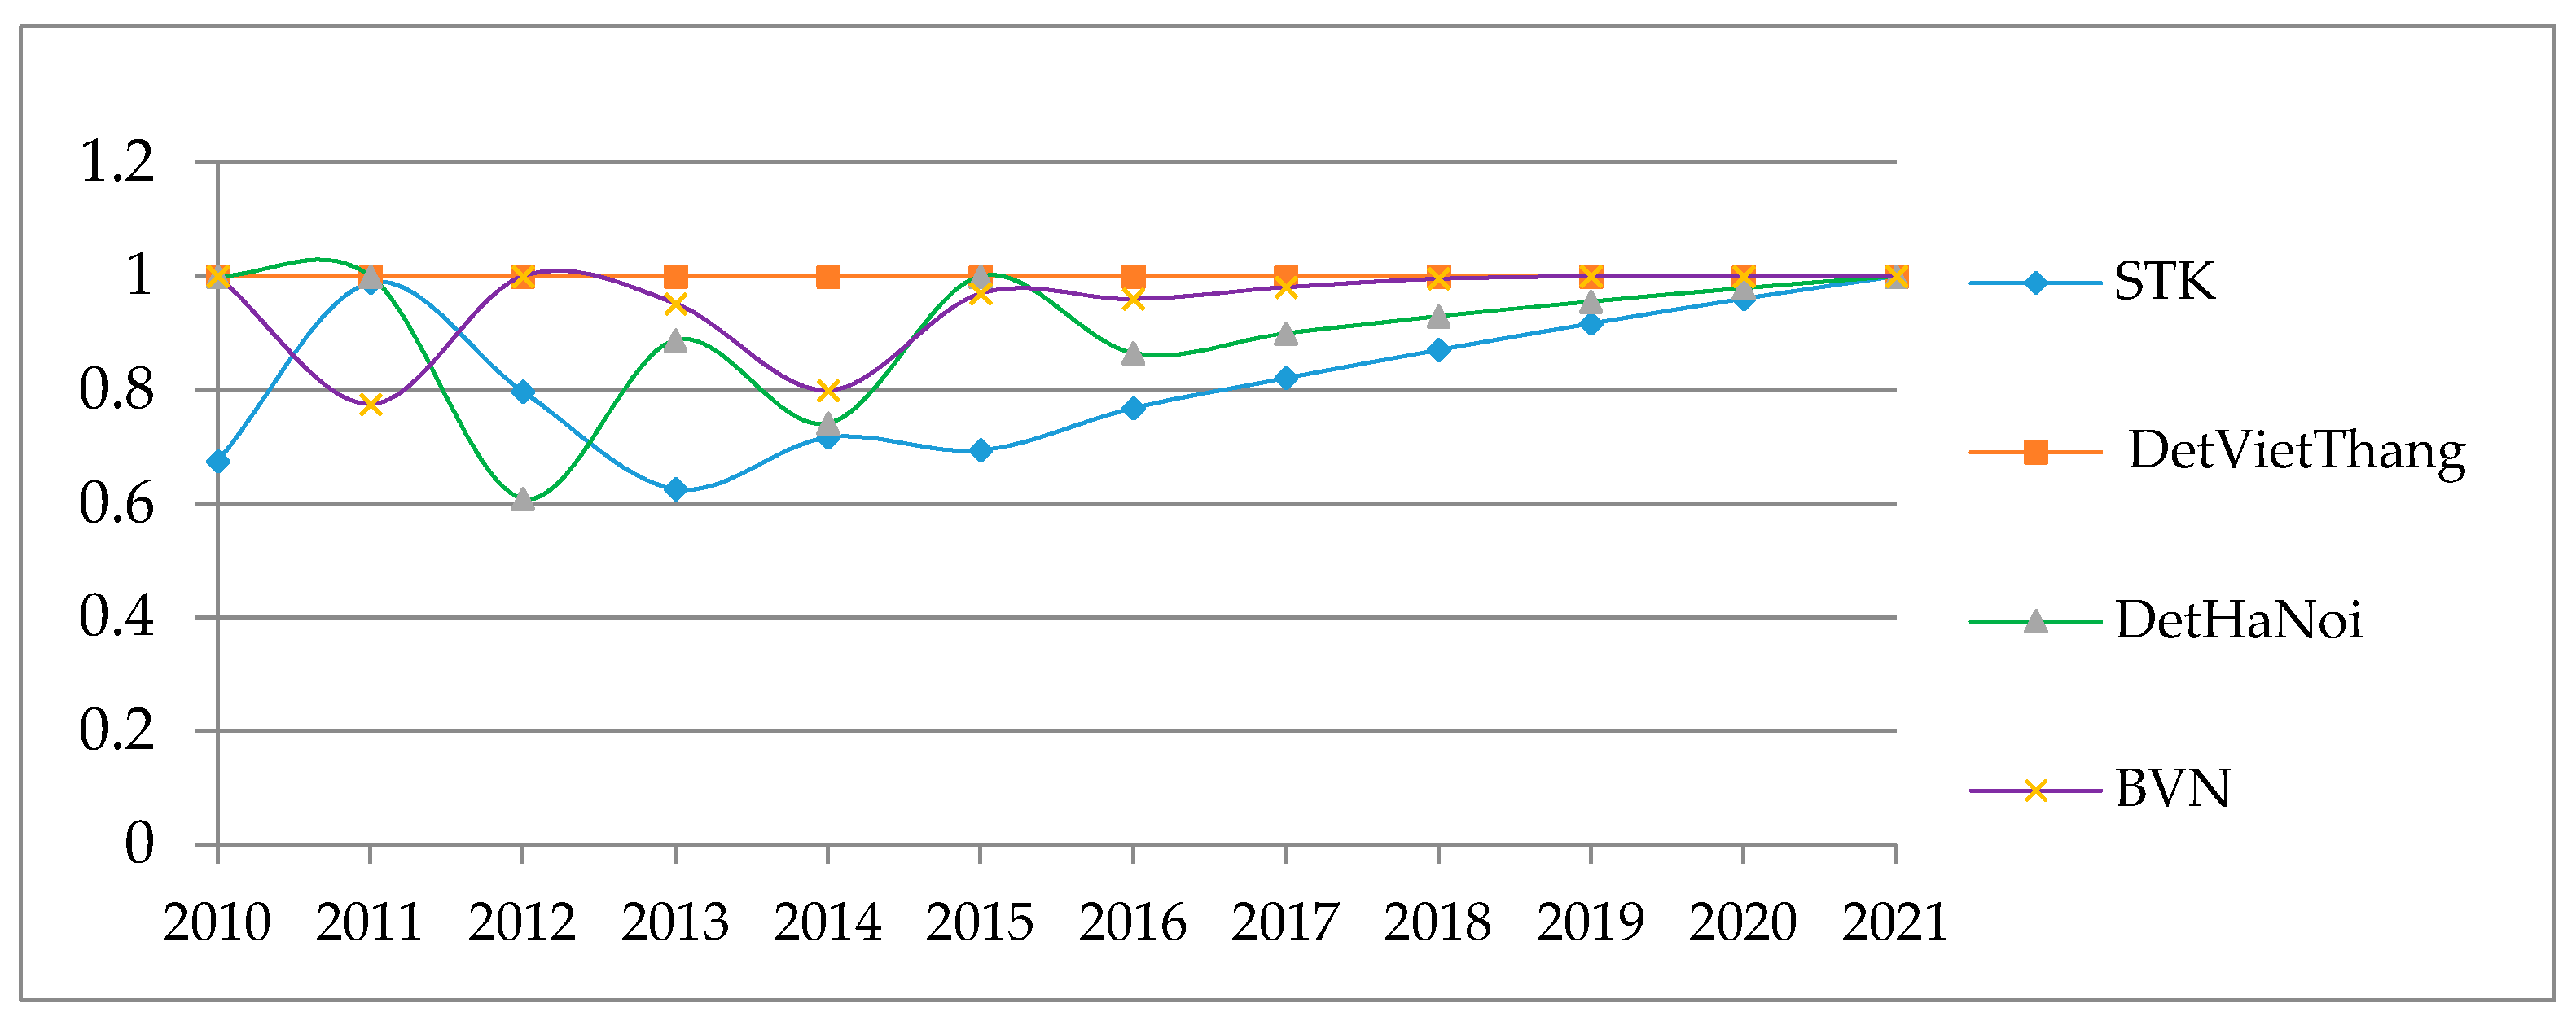
Similar panel data analysis is applied to measure the efficiency of textile companies. The average efficiency score is 92% with a minimum of 61%, and 23 out of 48 observations are fully efficient. The results in
Table 5 show that in general the industry increases efficiency 7% in the forecasted period in compared to the past period.
Figure 7 illustrates that DetVietThang has demonstrated a stable growth over 12 years, with excellent observation at 100%, and is considered the winner. BVN and DetHaNoi have impressive efficiency scores of technical change were greater than 1 in the period 2010–2015, which is helpful to create future growth platforms; these two companies faced with unstable historical performance quickly speed up the efficiency in forecasted years 2016–2021. STK is the loser in this group with efficiency score of 0.82.
On average, the textile sector experienced fluctuating efficiency from 2010 to 2015 with a clear decreases around 2011–2014. The period of 2016–2021 is predicted have steadily increasing efficiency, and may obtain peak effectiveness in 2021. These results reveal that Vietnam is going to make significant progress in eliminating technical barriers for textile manufacturing sector.
4.5.3. Textile and Garment Companies
Textile and garment companies generally performed better than others in the same industry due to their sizeable investments in different supply chain production processes including spinning, weaving, knitting, dyeing, finishing, and garment making. The sector has an average efficiency score of 75% in period 2010–2021 with a minimum of 31% and 15 out of 96 observations being fully efficient. In general, the sector is expected be more efficient with a progress from 69.5% in the past period to 80.8% in forecasted period. The results are summarized in
Table 6.
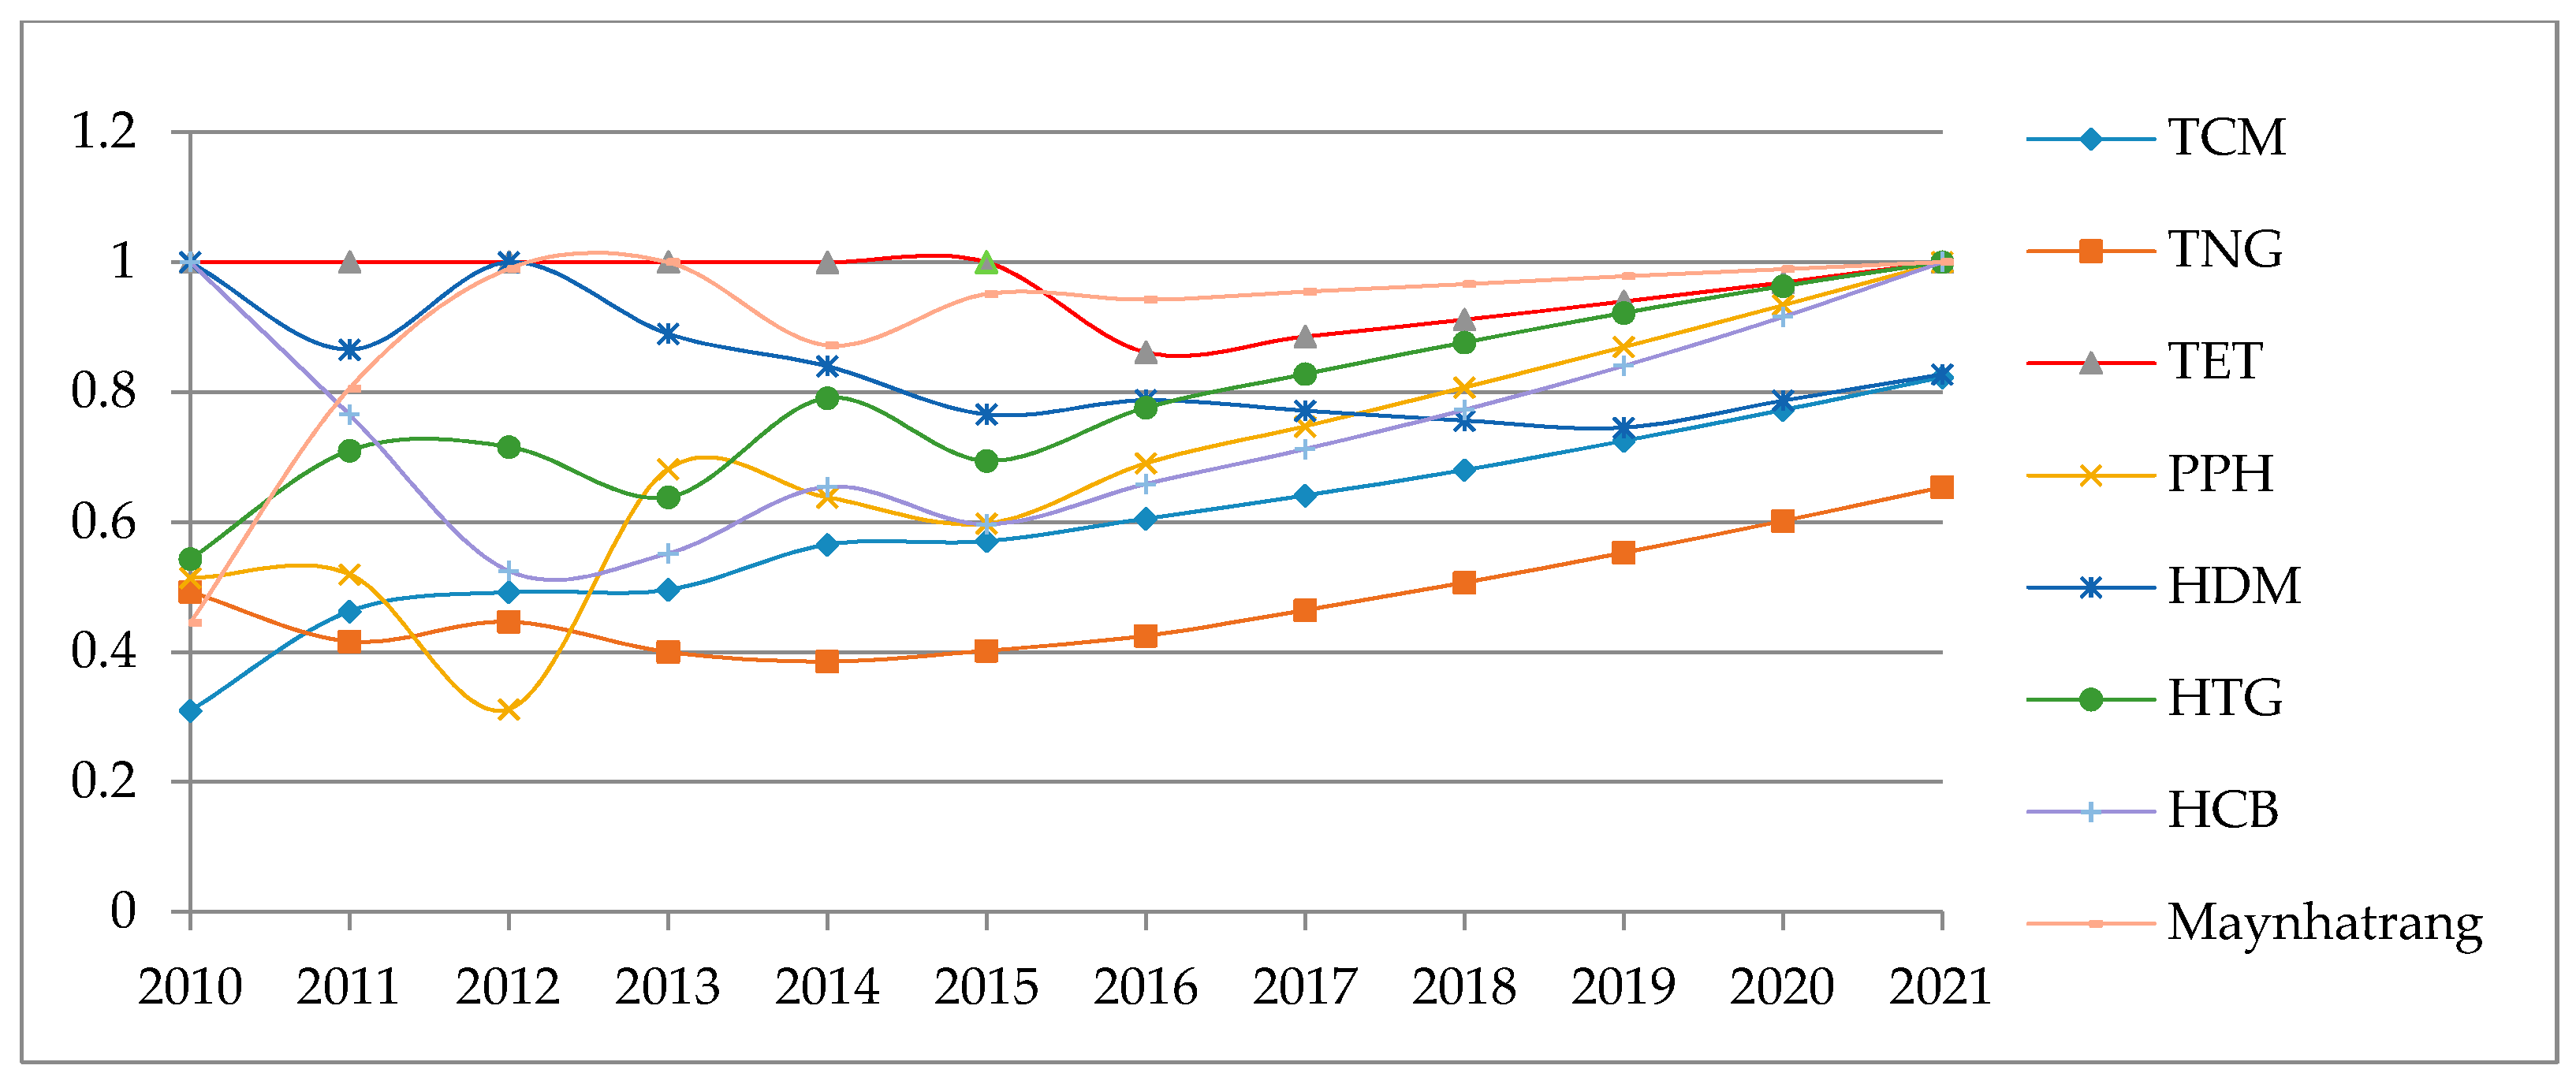
Table 6 and
Figure 8 show that this sector estimates to substantially increase performance from 2016 to 2021 after a light fluctuation in efficiency during 2010–2015. Only one in eight companies will have downward trends in the forecasted years (Hue textile garment JSC (HDM)).
TCM and PPH went down the lowest point with the efficiency of 31% in 2010 and 2012 accordingly. TET obtained seven remarkable years out of 12 observations including six consecutive years (2010–2015) then slowly regaining its fully efficient position in 2021 after a decline in period 2015–2016 (from 100% to 86%). Maynhatrang was measured as the best company regarding productivity growth due to its dramatic progress from 44% to 81% in 2010–2011; they are estimated as the second biggest company in this group. Even though much effort has been made to enhance TNG’s performance, they humbly reach 48% efficiency on average; it seems that they still struggle to create great variability in development. HTG and HCB had progress in productivity growth in 2010–2015; therefore, they also expect to be fully efficient in the coming years.
4.6. Discussions
The results shown in previous sections can be interpreted in the context of Vietnam textile and apparel industry overall as well as its sub-industries in details, as discussed for years and periods. Firstly, 20 qualified companies are selected, named by their stock stickers, decomposing entire industry into three sub-groups based on their production scopes. Prediction model is used to foresee future values (2016–2021) based on historical data (2010–2015), and the MAPE value of 8.85% highly confirmed the accurate prediction.
Based on realistic indicators, MPI is employed to measure productivity growth over the past period, which enables separation into efficiency change and technical change. Productivity change can be determined by comparing the values of efficiency and technical change, and means that the productivity growth decreases can be the result of either efficiency losses or technical regresses, or both, and in contrast to this assumption.
The MPI of garment sector for period 2010–2015 is 1.09, decomposing the indices into an average efficiency change of 1.03 and technical change of 1.07, which indicates the garment industry performed well in terms of both technology and efficiency.
Group of textile and garment companies, as analyzed earlier, are ranked first with average score of 1.47, with impressive increases of Malmquist and indices of efficiency change across a period due to their sizable production in both textile and sewing products. However, frontier shifts of each company individually have revealed technical issues occurred in their supply chains, reflecting the low technique of textile production.
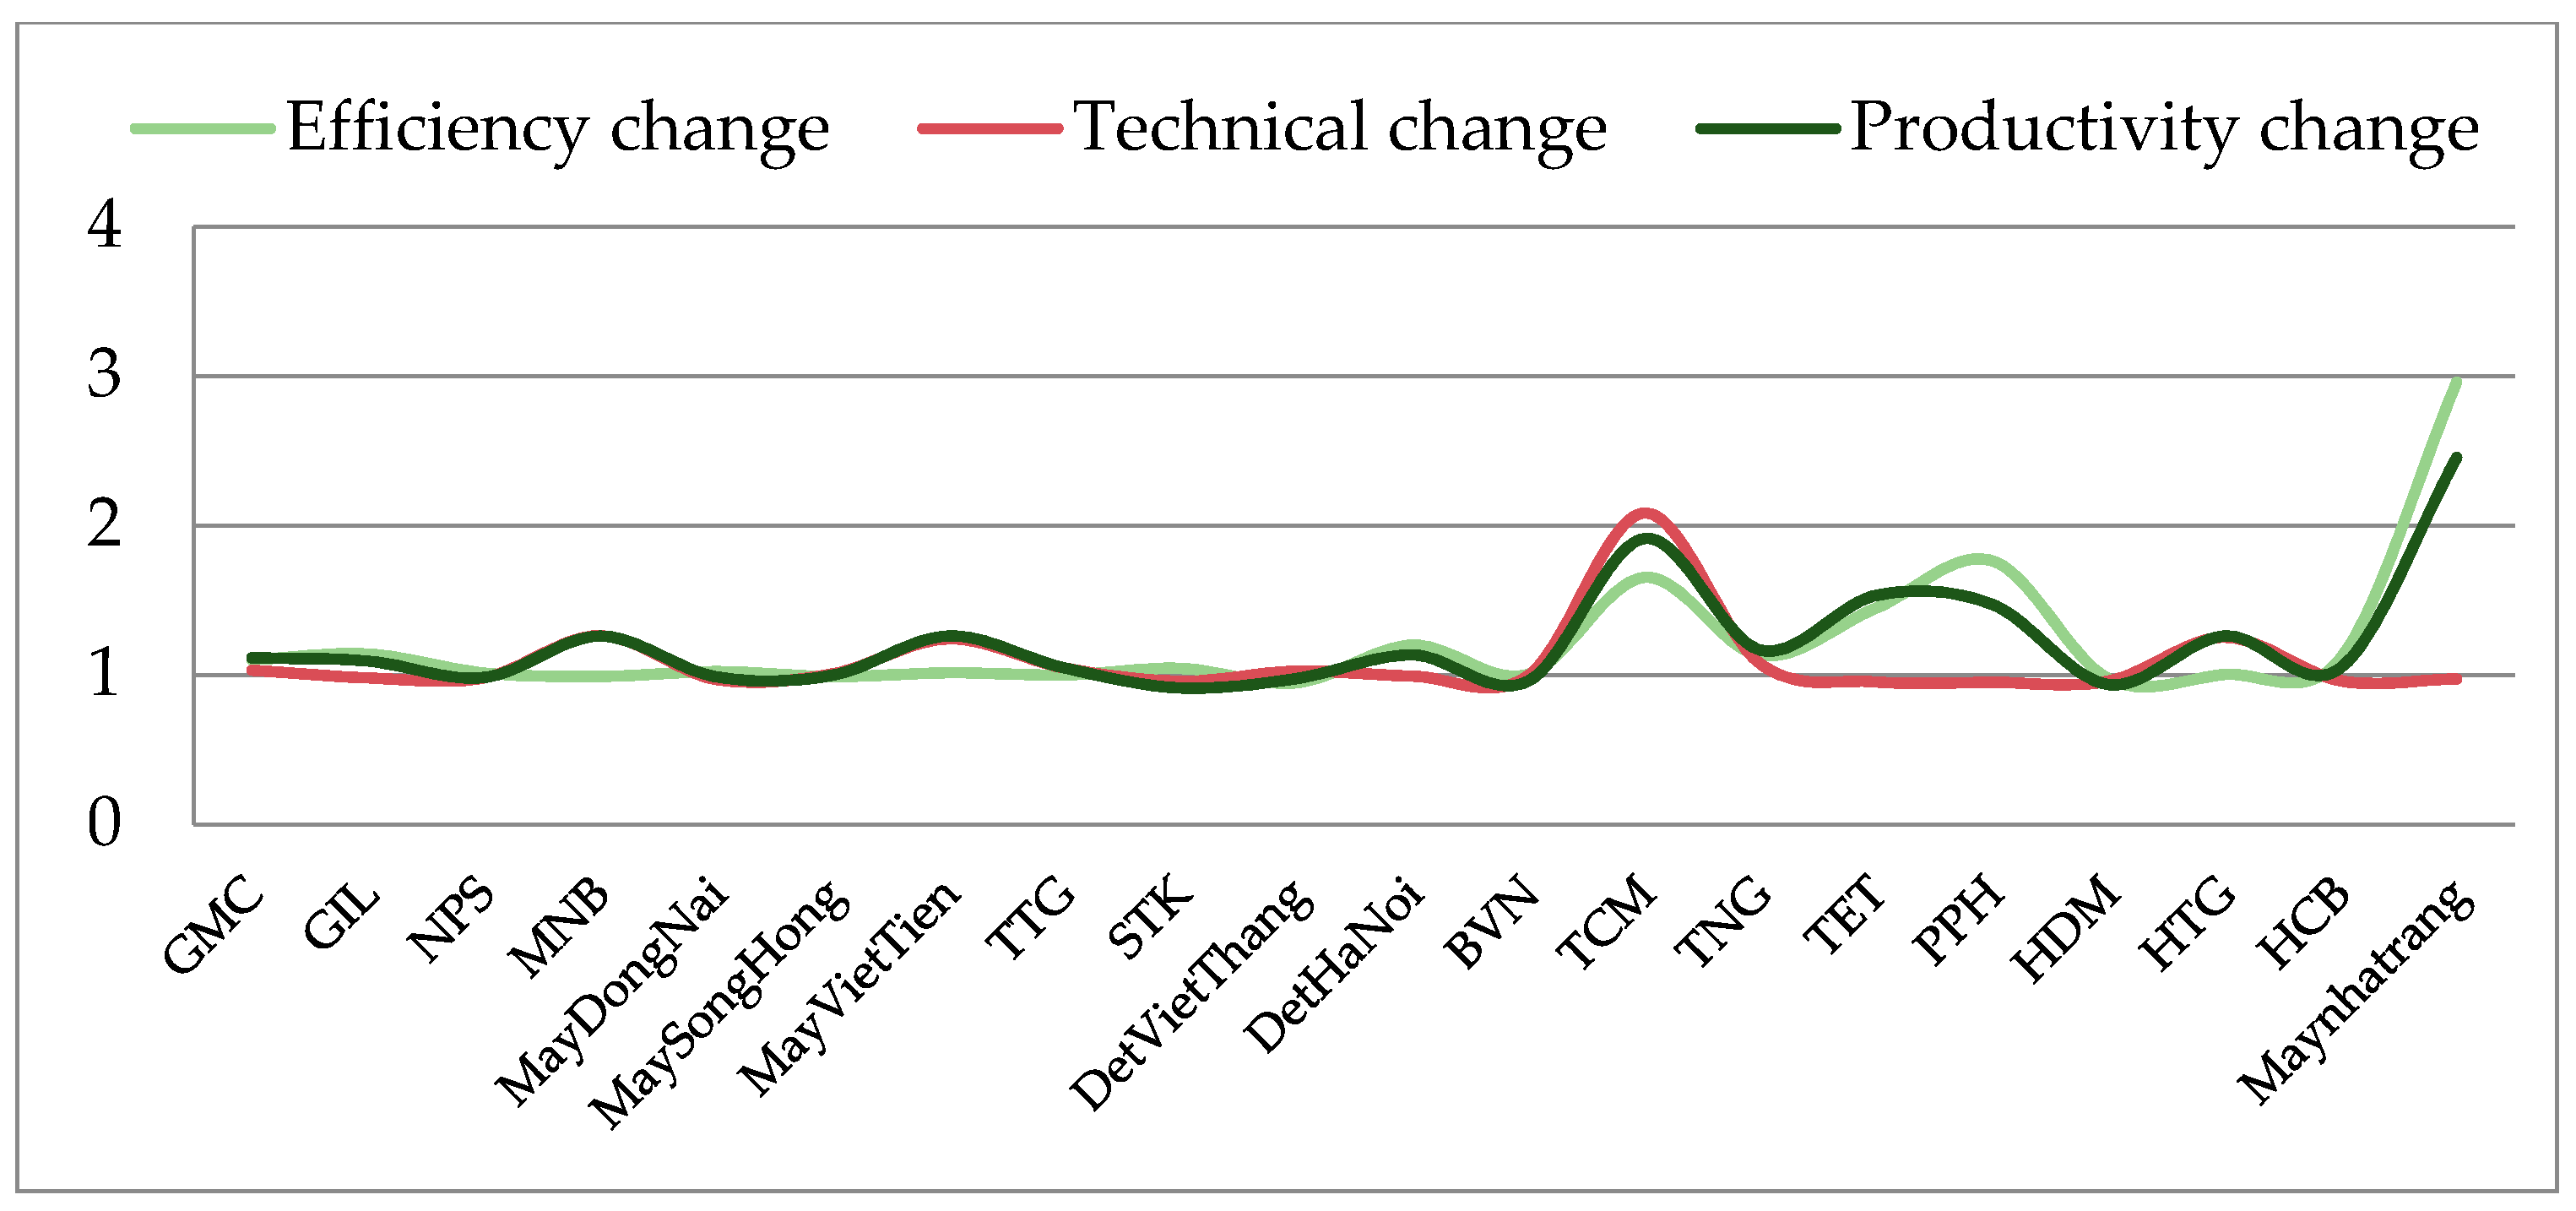
The MPI of textile industry is 1.00 as a mean of constant productivity growth, separating the values into an average efficient change of 1.05 and technical change of 0.99, which indicates that this sector experienced technological decrease. Note that all averages of efficiency change indices are larger than 1, thus there are no negative in efficiencies. Therefore, the determinants for productivity growth are the technical change, which means that productivity decreases are caused by technological reduction. The correlation relationship among MPI, efficiency change and technical change are illustrated in
Figure 9.
Paradi et al. (2004) applied the combined approach of DEA window analysis and Malmquist index to estimate performance of the five largest Canadian banks over 20 years (1981–2000) [
42]. The results proved that separation of the efficiency change from technical change, and it was clearly observed how the technical change is the determinant for productivity growth, with the efficiency change being neutral or negative. Similarly, the results in this paper show that productivity growth is decided by technical change. This means that the trend of different industry is referred to each other under same assumption. Moreover, scope of this study is to focus on performance evaluation by combining with prediction model to provide overall circumstances and efficient tendency for the 20 largest companies, sub-sectors and entire industry over a long period. It is based on past–future financial indicators. It is considered as new finding in value chain of Vietnam’s textile and apparel industry and for the global researches. Therefore, in this research, the empirical results based on Malmquist and window analysis are summarized based on indices of technical change and efficient tendency.
Vietnamese garments are mainly produced by method of processing, while design is an undeveloped stage. Thus, the machinery and technology are also directly affected on negative or positive outcomes. MNB, May Viet Tien, TTG and GMC measured as the best companies by outperforming the competition in both efficiency and technology over the period. May Song Hong and May Dong Nai had unstable technical change in the past, but still gain better efficiency in the long term by focusing on core competencies of apparel activities and gradually shifting to ODM (Original Design Manufacturer) method with higher added value than FOB (Free On Board) method. GIL and NPS are worsened companies in both indicators; the paper suggests these two companies should focus on enhancing technical production and efficiency hereafter.
Technique is the most critical factor underlying a successful contribution for textile companies. Therefore, the results of window analysis provide the similar tendency of efficient companies based on technical change indicators and predicted to be more stable tendency due to its importance in supplying materials for entire industry. Det Viet Thang was the only company with positive technical change in the past; it is no doubt why they continue to be forerunner in efficiency. Vietnam cotton JSC (BVN) came in second place by changing cotton planting techniques. Det Hanoi and STK follow, sequentially.
The group of textile and garment companies represents a value chain of Vietnam textile and apparel industry, and the linkage within garment and textile sector. The limitation in supplying of high quality fabric and accessories has weakened remarkably the competitiveness of garment products. TET, May Nha Trang and HDM are predicted to be winners in efficiency trend but losers in technical change; it is important for their strategic managers to address difficulties and further improve technology. TCM, HTG, and TNG face worse efficiency but an enhanced change in technology; the enterprises should maximize the required outputs with minimal inputs. PPH and HCB are worse in both efficiency and technical change indices; the paper suggests that their managers should propose medium- and long-term planning to speed up efficiency trends and technical change.
5. Conclusions and Future Studies
Vietnamese textile and apparel industry are expected to continue experiencing robust growth rate in short to long term. However, insufficient value chain has led to some limitations and concerns. To meet strong demand for this expanding industry and optimize company performance, this paper proposes an integrated approach using grey prediction–MPI–window analysis. The main purposes of this study are to provide the empirical analysis for enterprises by foreseeing future values, measuring productivity growth of industrial sectors and further detecting performance trends of companies. Based on empirical results and discussion of previous sector, the main contributions of this study are found.
The GM (1, 1) model is employed to foresee the values in 2016–2021 based on the historical data for 2010–2015. Seven financial indicators are used in this paper, including total assets, owners’ equity, sales expense, net revenue, and EPS, which are key performance indicators directly contributing to the success of businesses. These predictive factors are useful information for the enterprises to reduce future risks and improve their ability to quickly react to some crisis situations.
The empirical results of MPI and its sub-components are powerful to estimate productivity growth; hence, it shows how technical change is the determinant for productivity growth. The paper suggests that Vietnam government and enterprises should strongly pay attention to upgrading textile machinery in Vietnam. The results from MPI analysis are further examined using window analysis, which is used to detect the performance trends of companies over time. The empirical results also found that textile companies are predicted to have more stability by increasing their technical change. Garment companies and group of textile and garment companies with higher technical change are not guaranteed to have better efficiency trends. Furthermore, according to the combined analysis of MPI and window analysis, companies with a decline in both technical change and efficiency trends (less than 1) need to be more positive by changing and improving their production size, focusing on core competencies of apparel activities and enhancing the entire value chain of Vietnam textile and apparel industry.
In limitations of this study, the study would like to contribute to the overview of Vietnam textile and apparel industry and its value chain. The integrated approach provides empirically meaningful and helpful results to the sustainable development of the industry. However, the information of some non-listed companies is difficult to obtain. The selection of inputs and outputs does not completely reflect the overall performance of the industry. Therefore, there are still some restrictions and difficulties in combining these methods that require further studies with different assumptions.
In further studies, more input and output variables can be discussed and assessed by this proposed model. Furthermore, different DEA models could also be used to evaluate the performance of different industries.
