Article

Integrating Analytic Hierarchy Process (AHP) and Balanced Scorecard (BSC) Framework for Sustainable Business in a Software Factory in the Financial Sector

by
César Álvarez Pérez
,
Vicente Rodríguez Montequín
*,
Francisco Ortega Fernández
and
Joaquín Villanueva Balsera
Department of Project Engineering, University of Oviedo, C/Independencia 3, 33004 Oviedo, Spain
*
Author to whom correspondence should be addressed.
Sustainability 2017, 9(4), 486; https://doi.org/10.3390/su9040486
Submission received: 5 January 2017 / Revised: 21 March 2017 / Accepted: 22 March 2017 / Published: 24 March 2017
(This article belongs to the Section Economic and Business Aspects of Sustainability)

Abstract

:
A balanced scorecard (BSC) framework for a factory that develops software for banking was proposed by us at the end of 2015 to ensure its sustainability, and was focused on improving its productivity and cost. Based on this framework, the aim of this study is to construct an approach using the analytic hierarchy process (AHP) and BSC for evaluating a factory’s performance in order for it to become a sustainable business. In this study, AHP is proposed to prioritise and determine weights for the perspectives and indicators included in the BSC for a financial software factory (FSF). The combination of these weights with different indicator measures produces a model that provides an effective assessment tool for FSF managers. The results of the study, which are shown both globally and disaggregated according to the different roles of FSF stakeholders, show that user satisfaction is the main pillar for making decisions. In addition, the result considering roles shows differences according to the relationship of each stakeholder with the software factory. The current study has been validated in a Spanish factory that develops software for several financial entities.

1. Introduction

Since the advent of the internet, and especially since the emergence of smartphones, which coincided with the last financial crisis that significantly hit the banking sector, banks are trying to reposition in order to retain their dominant position in the financial sector. However, it seems that traditional banking is not well adapted to keeping up with the constantly changing technological landscape, according to SAP and IBM [1]. Banks are facing challenges in several areas, but there are four that stand out which affect banking information technology (IT). These are:
  • Not making enough money. Despite all of the headlines about banking profitability, banks and financial institutions are still not making enough return on investment, or return on equity, that shareholders require.
  • Consumer expectations. These days, it’s all about the customer experience, and many banks are feeling pressure because they are not delivering the level of service that consumers are demanding, especially in regards to technology.
  • Increasing competition from financial technology companies. Financial technology (FinTech) companies are usually start-up companies based on using software to provide financial services. The increasing popularity of FinTech companies is disrupting the way in which traditional banking is being run. This creates a big challenge for traditional banks because they are not able to adjust quickly to the changes—not just in technology, but also in operations, culture, and other facets of the industry.
  • Regulatory pressure. Regulatory and legal requirements continue to increase, and banks need to spend a large part of their discretionary budget on being compliant, and on building systems and processes, in order to keep up with the escalating requirements.
These challenges continue to grow, so traditional banks need to constantly evaluate and improve their operations and systems in order to keep up with the fast pace of change in the current banking and financial industry. Tackling these challenges requires new software developments, since much of the existing software dates from the beginning of the century, and is therefore not able to deal with present day issues and, of course, the future of the sector. That is why financial entities need to act in different critical aspects, and the companies that develop their software are possibly the main pillar of this action. The banking sector is one of the sectors requiring the most amount of software for its operation [2]. This is why the financial software industry needs to transform itself into an industrialised software manufacturer, able to provide software projects related to the efficiency, fast delivery, and quality that the financial markets expect today [3]. This industry not only needs to increase production capabilities, but also needs to produce more with the resources available for production, in order to increase productivity [4].
Our paper [5] published at the end of 2015 describes a case in which an FSF in Spain decided to review the concept of industrialisation of the software, to implement the principles and elements of the software factory approach [6], suggesting a strategic management approach using the BSC [7,8] that would increase the productivity of the different teams. This initial paper proposes a specific model for FSF as a way to improve sustainability and validates the model in a Spanish firm specialising in financial software. These FSF have special features that make them different from other software factories: they work almost exclusively for one financial group, which is both the owner and the principal customer, although revenue to a non-corporate group is increasingly important to financial groups; they have a greater demand for software development; and they have secured the payment of deliveries. These features make it necessary to include specific indicators to assess the financial perspective of the BSC, because the typical indicators for this perspective (Return on investment (ROI), Return on equity (ROE), or Economic value added (EVA)) are not suitable for these software companies in which shareholders and customers are both part of the same financial group. One problem with this initial proposal of a BSC framework is that it does not establish the importance of the perspectives and indicators in the BSC. The integration of BSC with multi-criteria decision-making techniques (MCDM), as AHP, has been adopted in this current paper as a useful method for calculating weights, and can help to establish an evaluation performance system [9]. In this study, AHP is proposed for determining the weights for the selected key performance indicators (KPIs) included in each of the four hierarchical perspectives of the BSC for an FSF, with the aim of ensuring business sustainability. This is related to achieving a viable business over time in terms of productivity and profitability, through appropriate decision-making. In addition, the results will be shown not only globally, but also by stakeholder roles, which represents a novel approach compared to other studies that apply a similar methodology to the one used in this paper.
The remainder of this paper is organised as follows. Section 2 reviews the literature and introduces the concepts of BSC, BSC for an FSF, and the AHP method as an integrated performance evaluation framework. Section 3 describes the research methodology. Section 4 shows the results of the study. Section 5 presents the analysis and discussion of the results and Section 6 presents the conclusions, implications, limitations, and future research directions related to this paper.

2. Performance Evaluation Framework for an FSF Based on BSC and AHP

In today’s competitive world, only the companies that observe the needs of their customers and provide them with satisfaction can compete with others and gain benefits. Every organisation needs a complete management system that includes all or nearly all of the elements or aspects of the company and permits an awareness of the productivity with which it is working, in order to protect its competitive advantages. However, the productivity measure in software development is more difficult than in other industries, due to the intangible nature of software and the difficulty in measuring the output [10]. Nevertheless, it is necessary for a management system to be able to monitor production. A framework that integrates BSC, a multiple perspective framework for performance assessment, and AHP, a decision-making tool used to prioritise multiple performance perspectives, can generate a metric [11] that helps achieve this objective.

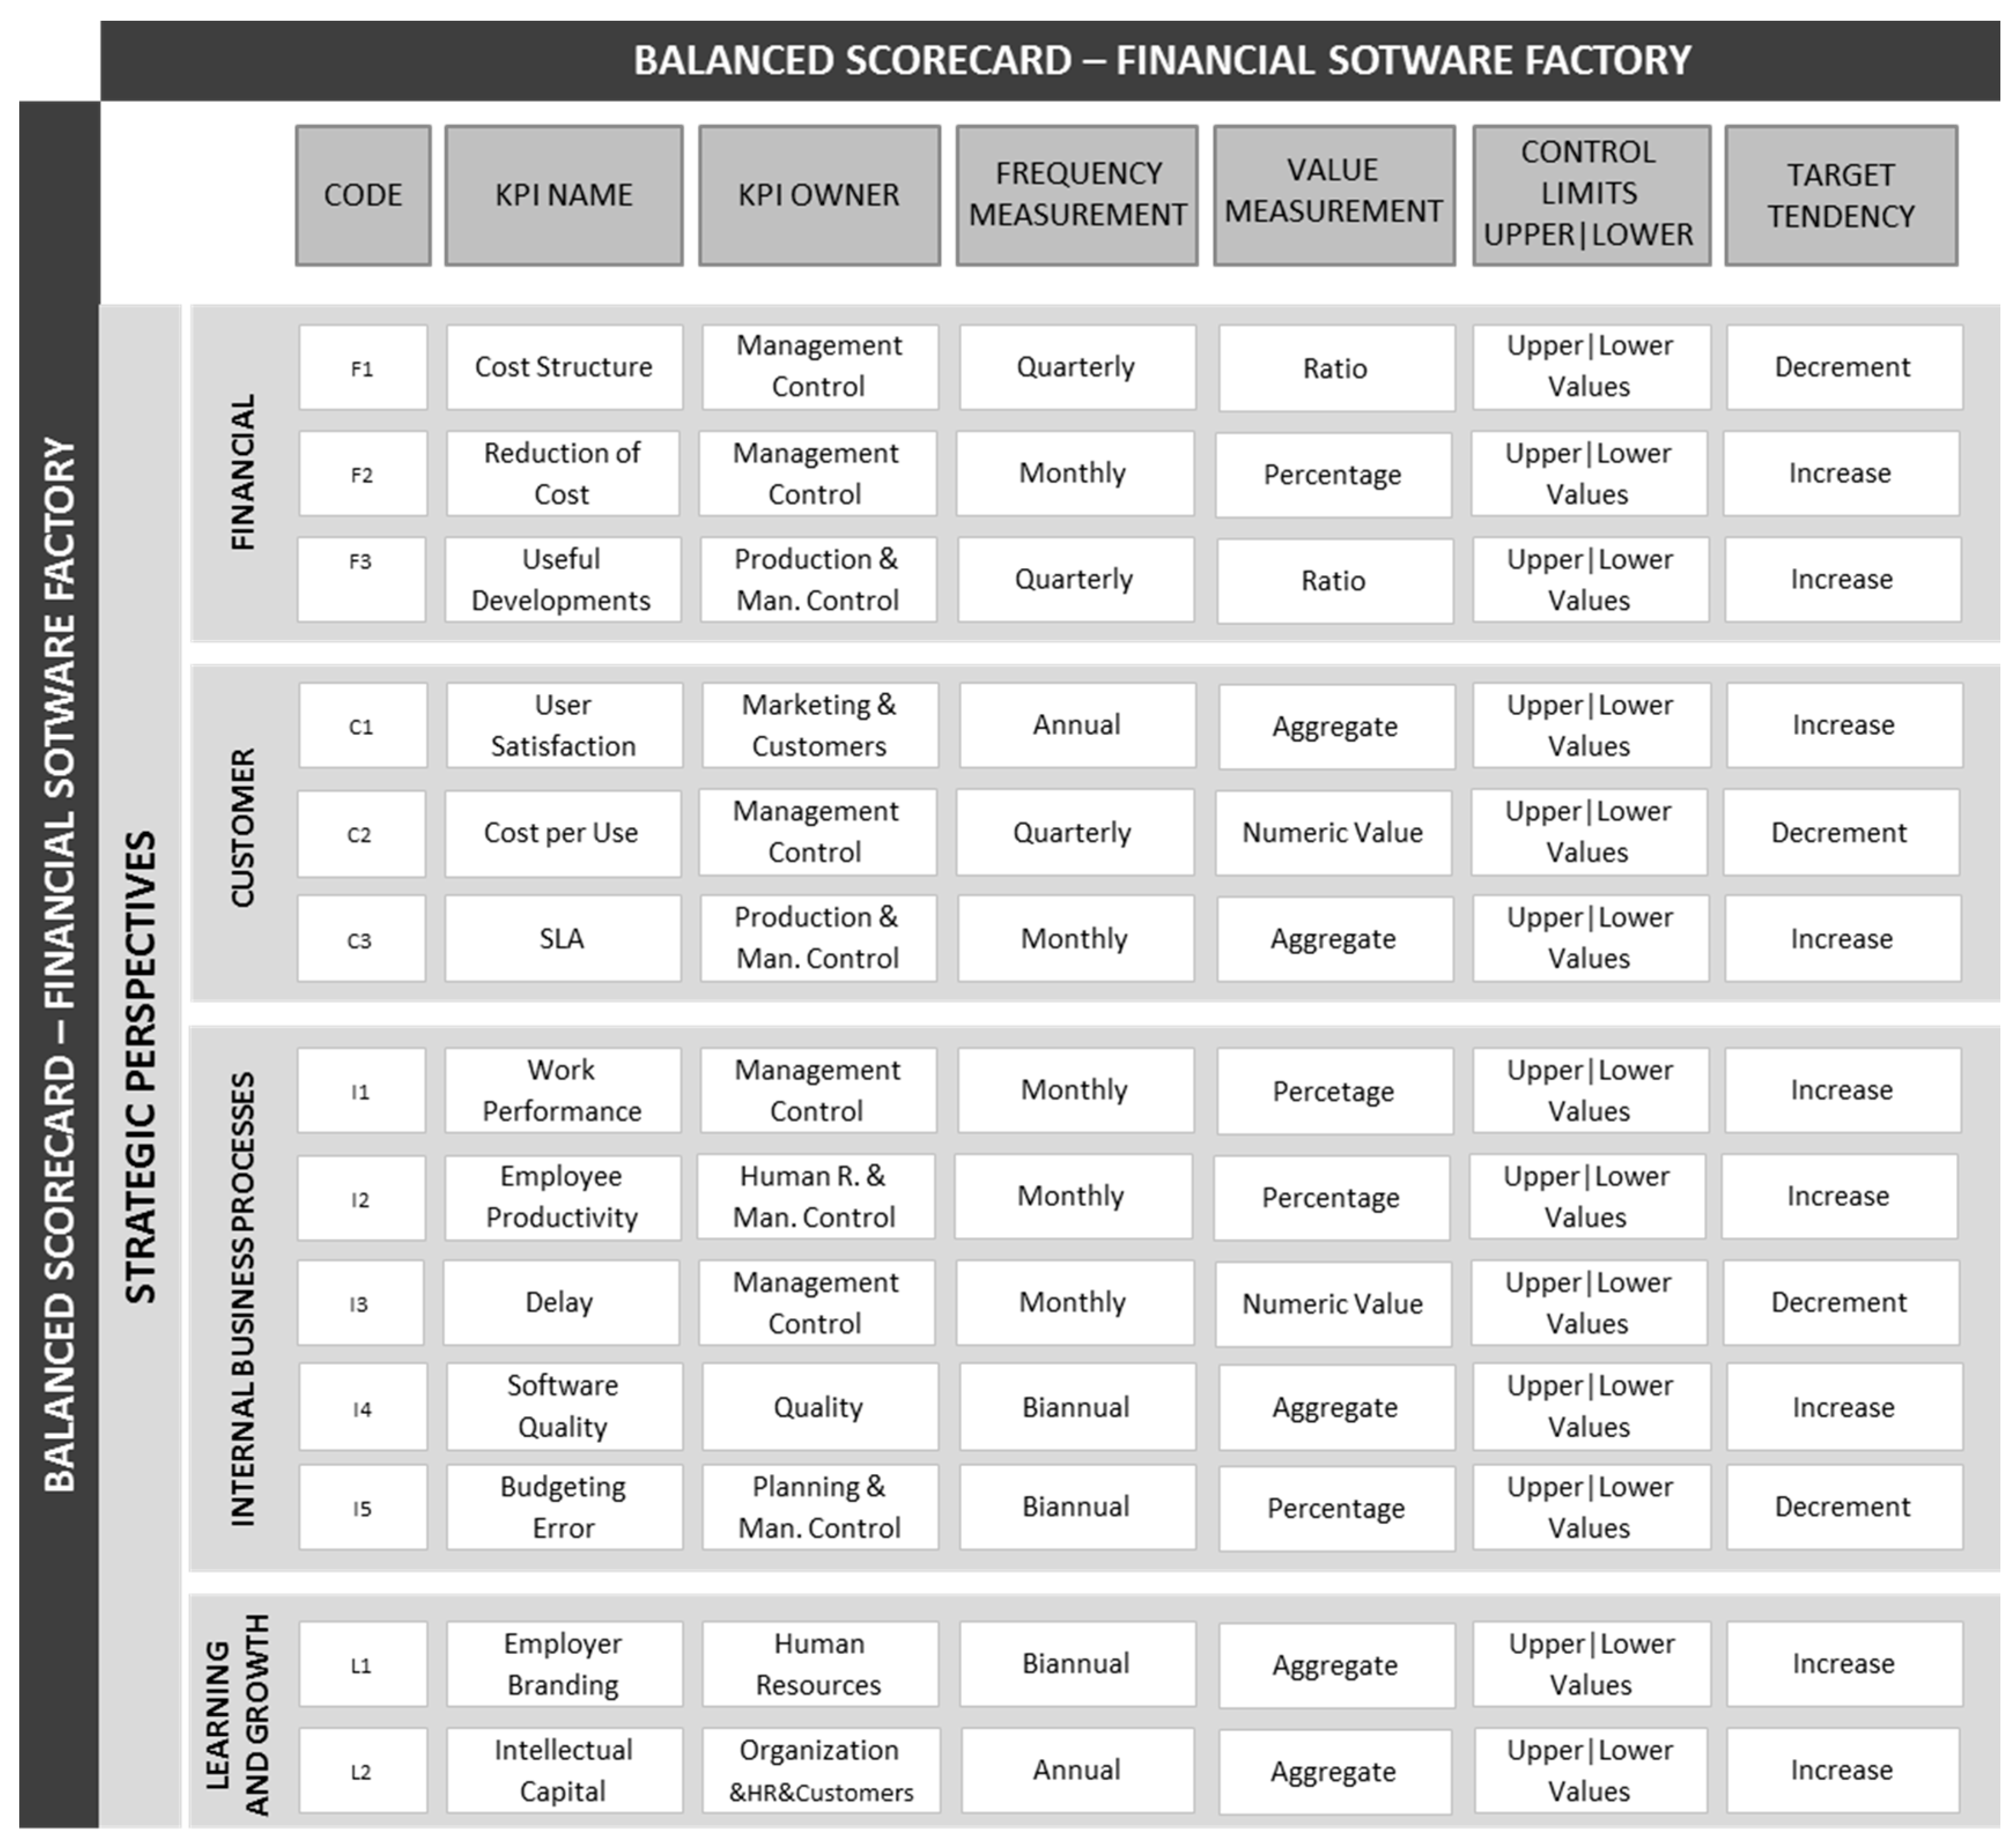
2.1. The BSC Framework

In general, performance can be defined as the output or operating result at the end of a given period. This output is an indicator measuring the extent to which the companies reach their goals and, consequently, performance can be described as the general evaluation of all the efforts to accomplish their goals. Business performance is the degree of fulfilment of managerial goals in business practices and the realized outputs of these goals by the end of a certain period [12]. A performance measurement system can be defined as a system by which a company monitors its daily operations and evaluates whether the company is attaining its objectives [13]. To fully utilise the function of performance measurement, it is suggested that businesses set up a series of indexes, which properly reflect the performance of a company.
The BSC approach is probably the best-known management tool for a company. In 1992 and the years that followed, Kaplan and Norton, of Harvard University, presented The Balanced Scorecard [7] as a corporate performance tool that allows managers to look at the business from four important perspectives: financial, customer, internal business process, and learning and growth. In the following years, Kaplan and Norton presented new views and ways to improve the initial BSC approach, and linked it with measures, objectives, and business strategy [8,14]. The BSC is applied by many businesses to assess their performance in diverse aspects of their organisation, but the BSC is only a template and must be customised for the specific elements of an organisation. In addition, studies such as Bourguignon et al. [15] suggest that local ideology and culture should be taken into consideration, especially when the system has been born and developed in another culture. Since the BSC was introduced, many authors have proposed modifications for adapting the initial BSC to other scorecards that are specific to different areas or industrial environments. The studies about the IT BSC [16,17] in the information technologies sector, the Sustainability BSC (SBSC) [18,19] for a sustainable business and [20] for sustainable competitive strategies, those such as [21,22] that expose the benefits of using the BSC in the financial sector, and finally, the specific BSC for an FSF [5,23], are some previously published examples in relation to this study.
Figure 1 shows the BSC for an FSF [5] and includes the chosen KPIs with various fields assigned to each: Code, KPI Name, KPI Owner, Frequency Measurement, Value Measurement, Target Tendency, and the Upper and Lower Control Limits to manage the stability of processes. This BSC was established by the FSF as a control tool for the top management of the organization, according to the strategic objectives and the Mission and Vision of the FSF defined in its strategy map [5]. The indicators were derived from the strategic goals of the FSF through four different strategic lines:
  • Improve the performance and productivity of the FSF.
  • Delivery of software development must be of a good quality and the level of use of the delivered software by the customers should be increased.
  • Optimize and decrease the cost and expense of the software factory.
  • Sell the developments and services to companies outside of the owning financial group, to recover the development cost with external revenue.
The KPIs were defined during several work sessions with the participation of different roles of employees. Some of the KPIs were simple to create and easy to obtain, but others were difficult to obtain because they were a compendium of different indicators and measures. The top management and consultants annually review the validity of the KPIs, and KPIs are modified or adjusted if necessary. Table 1 shows a short description and explanation of the KPIs included in the BSC for an FSF, which are extensively explained in our prior paper [5].

2.2. AHP

The AHP was initially developed by Saaty in the 1970’s [24,25], to solve the allocation of scarce resources and the planning needs of the military. Since its introduction, the AHP has become one of the most widely used MCDM methods, and has been used to solve unstructured problems in different areas of human needs and interests, such as political, economic, social, and management sciences [26]. The AHP is a useful approach for solving complex problems. In this approach, selected stakeholders prioritise the relative importance of criteria by making pairwise comparisons of the factors using a nine-point scale.
The most creative part of decision-making is modelling the problem. The identification of the decision hierarchy is the key to success in using AHP. The process of building a hierarchy structure is to more accurately identify all of the elements of the decision and recognise the interrelationships between them [27]. This hierarchical structure has at least three levels: the overall goal of the problem is located at the top, the multiple criteria that define the alternatives is found in the middle, and the competing alternatives (decision alternatives) are situated at the bottom [28]. In particular, AHP is useful for prioritising decision alternatives [29] and is effective in addressing many types of problems that involve multiple criteria [30], including the analysis of performance in business [31], which is the main objective of the present study.
Saaty [32] argues that five options (equal, weak, strong, very strong, and absolute) represent a manager’s ability to make qualitative distinctions. The deployment of AHP in real-life decision-making involves successive comparisons between each alternative, criterion by criterion, according to the fundamental scale of Saaty [33], as presented in Table 2.
Different studies based on Saaty’s AHP theory, such as [9,34], explain that, if an alternative A i is preferable to an alternative A j , then the value of the comparison scale P c ( A i , A j ) = a i j indicates the intensity of relative importance of A i over A j , assigned by the decision maker. The scale allows, in a pairwise comparison, the investigator to establish which alternative is better. Higher values of a i j indicate a stronger preference of alternative A i over A j . Finally, the matrix A is the result of all of the comparisons, and represents the relative importance a i j of each element. Given that an element is as important as itself, and taking into account the theorem of reciprocity, then a i j = 1 if i = j and a i j = 1/ a j i if ij. The calculation of weights relies on an iterative process in which matrix A is successively multiplied by itself, resulting in normalised weights, w i , and these weights represent the importance of alternative A i relative to all other alternatives. The judgment of decision makers in pairwise comparisons may present inconsistencies when all of the alternatives are taken into consideration simultaneously. The consistency index (CI) and the consistency ratio (CR) measure the degree to which judgments are not coherent [35]. If CR < 0.10, then the degree of consistency is satisfactory [36].

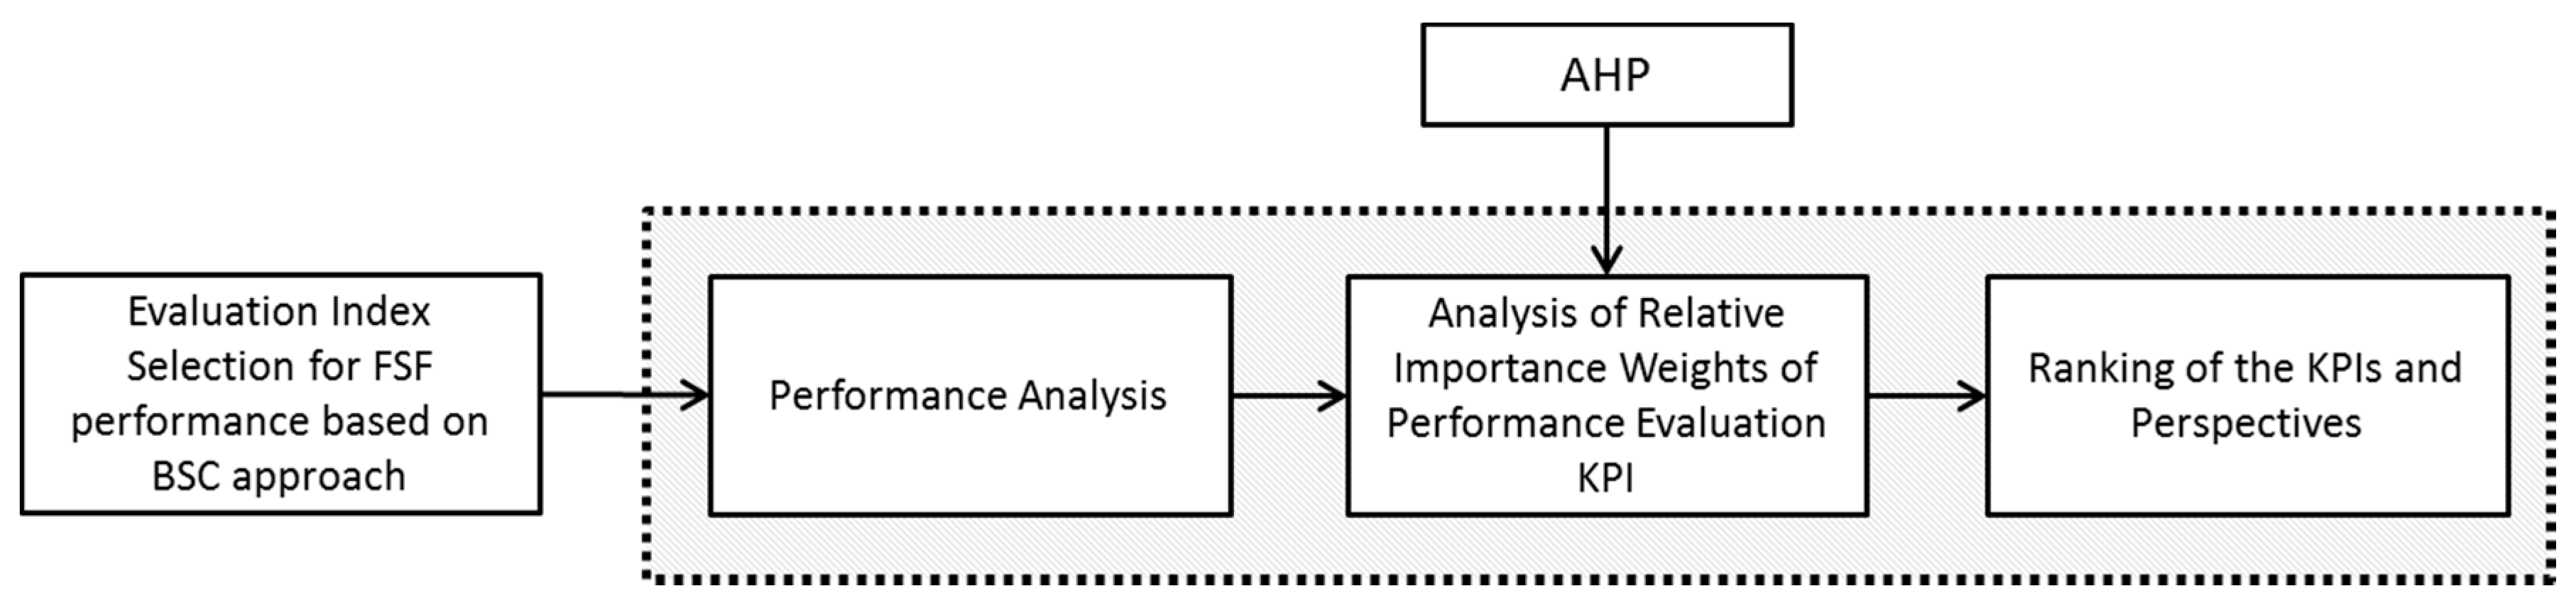
2.3. Integration of BSC Framework and AHP to Evaluate Performance

Several studies have proven that the BSC framework (see Section 2.1) is effective in helping organisations to evaluate performance [37]. However, the BSC, a tool which describes the perspectives of performance, does not determine perspective and indicator weights [38]. AHP is useful in a BSC analysis because it can explain several relevant dimensions of organisational performance [9] and their weight of importance in a comprehensive framework. In practice, however, perspectives and indicators seldom have equal importance. As a valuable tool for prioritising and consolidating performance metrics based on multiple criteria, AHP is a promising mechanism to help overcome the limitations of BSC. It has been adopted in several cases as a method for calculating weights in an evaluation performance system [9,39].
Although there are many studies that use the BSC to improve and control organisation performance, there are far fewer cases in the software industry that have also chosen to study the relative weight of each indicator included in the BSC, with the intention to establish a metric to assess performance. In the IT sector, there are several studies [9,39] that propose these methods to create performance evaluations systems. In the financial sector, some studies [40,41] present different proposals using the BSC and AHP in order to evaluate performance for banking. Other studies combine BSC with AHP with the purpose of achieving the sustainability of companies [42,43]. Other variants of the AHP, such as the analytical network process (ANP), have also been used with the BSC for sustainable management [44]. This study proposes a combination between AHP and BSC for an FSF to evaluate performance in a factory that develops software for banking, with the aim of maintaining the sustainability of this business.

3. Methodology

This paper lies in the area of applied research because it focuses on a methodology used to solve a problem in the real-world and the results can be applied in real decision-making situations. In this research, the four perspectives of the BSC were taken as the framework for establishing the performance evaluation indexes. The analytical structure of this research is explained in Figure 2. We first used the BSC model for an FSF to study the different KPIs proposed. Next, we interviewed several managers in a Spanish financial software factory. We then ascertained the views of software factory experts and designed a pairwise comparisons questionnaire based on the hierarchical structure of the BSC. Finally, AHP was applied to obtain the weights of the KPIs included in the specific BSC for an FSF.
The steps taken to achieve this purpose are:
  • Analyse the BSC of the FSF (the studied organization).
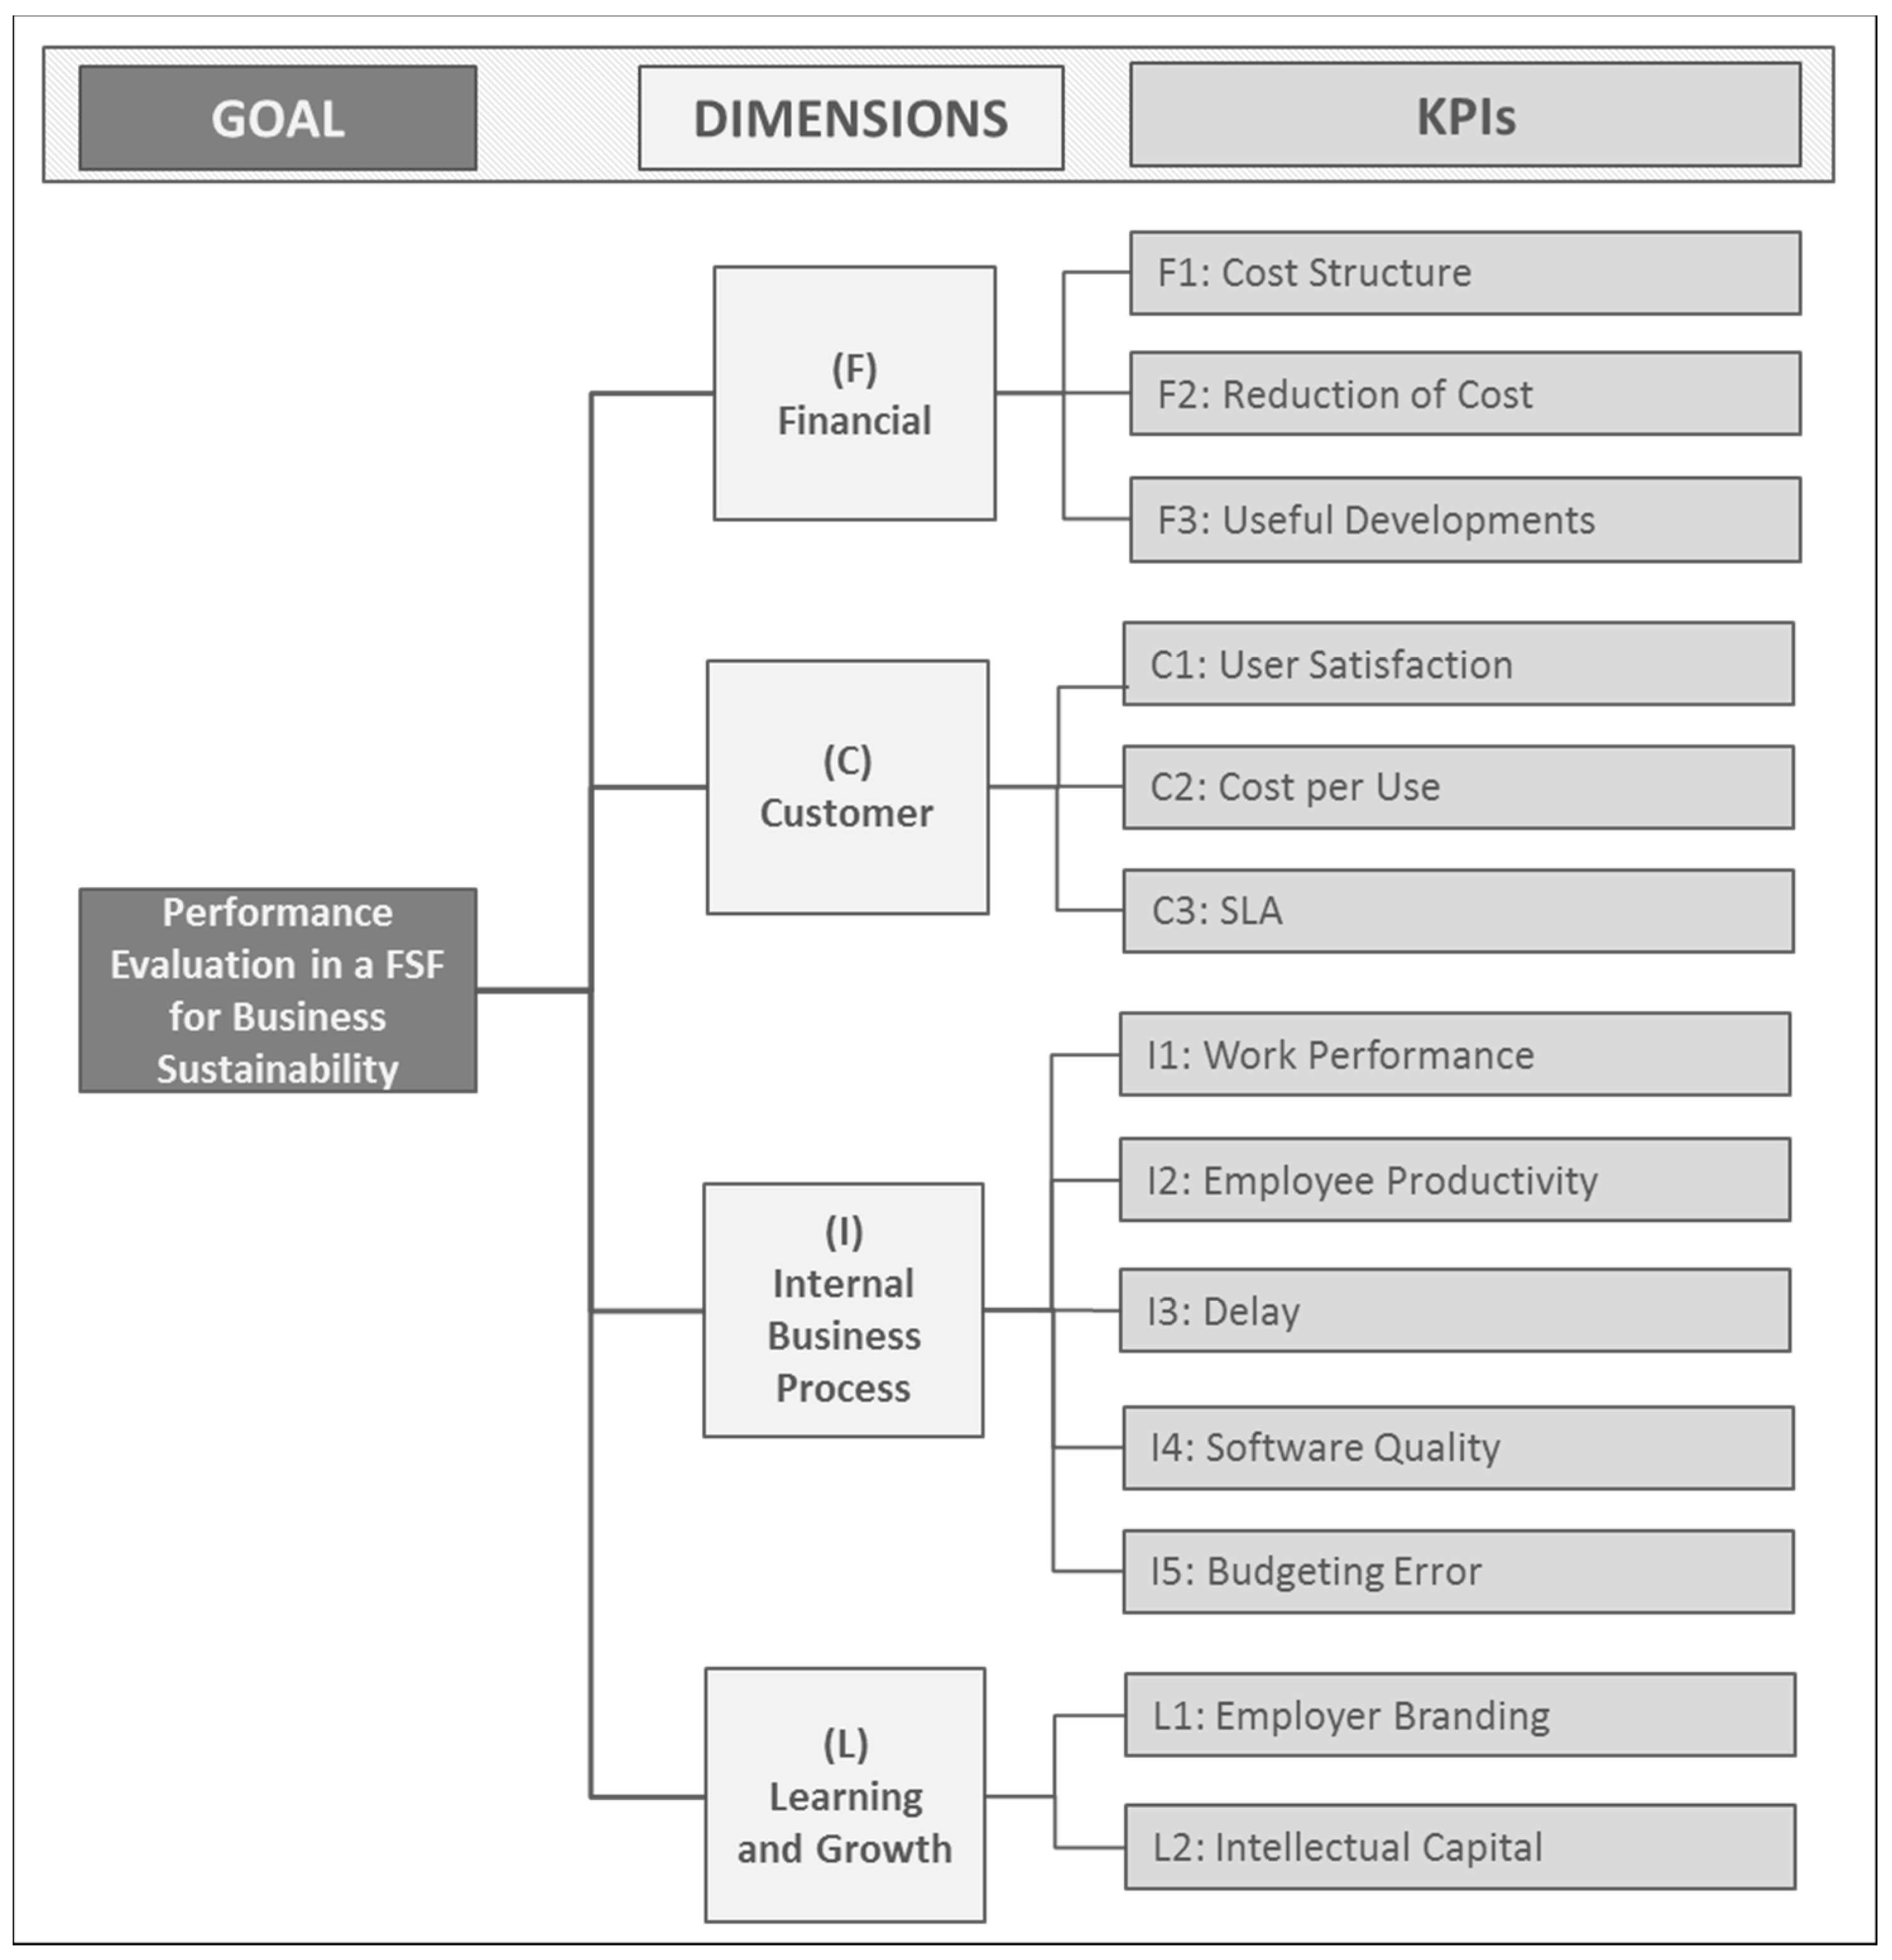
  • Define the hierarchical framework related to this BSC.
  • Prepare a questionnaire in AHP format based on this hierarchy to obtain the opinion of experts regarding the indicators and perspectives of the BSC, with the aim of business sustainability.
  • Prepare the answers obtained from the experts and give them the necessary format for computer treatment with AHP software.
  • Calculate the weights of the global and different stakeholder roles of all the indicators and perspectives included in the BSC, according to the performance aim of the FSF.
  • Show the results and analyse them to discuss the result and obtain conclusions.

3.1. Hierarchical Framework of the BSC Performance Evaluation Criteria in an FSF

Based on the concept of the BSC for an FSF [5] and the literature review, this BSC is now adopted as a hierarchical research model of the BSC performance evaluation criteria (i.e., four perspectives and 13 KPIs) for this study, which is shown in Figure 3. To construct the hierarchy, we have used the four perspectives of the BSC for FSF and the KPIs included in each one of them. The 13 KPIs are grouped into the four BSC dimensions: “F: Financial (F1–F3)”, “C: Customer (C1–C3)”, “I: Internal Business Process (I1–I5)”, and “L: Learning and Growth (L1–L2)”. The four perspectives of the BSC provide a robust structure expressing the organisation’s needs and its strategic objectives [45]. Each KPI and its value directly support the achievement of the mission and vision of the organisation [19].

3.2. Data Collection

Based on the BSC for an FSF hierarchy, a questionnaire was designed to ascertain the judgements of the participants with a conventional AHP questionnaire format, five-point scale, and pairwise comparison. The questionnaire included the definition and meaning of each criteria or sub-criteria included in every question. After the questionnaire was designed, it was given to experts, shareholders, and managers of an FSF, to test its reliability and validity. Their corrective views were taken into consideration in the final design and examples about the use of every KPI were included, to facilitate understanding and to avoid potential interpretation errors when the different stakeholders answered the questionnaire. An instruction sheet for completing the questionnaire was created to assist respondents and an example of how the questionnaire is filled in was given to the respondents. A total of 83 questionnaires were distributed (by email and an online form) to different stakeholder roles related to FSF. These were grouped, according to the proposal of roles made by the top management of the FSF and with the purpose of considering different types of points of view, into shareholders, top management, middle managers, other employees, customers, and experts in the field of software factories. The latter were included to seek their professional opinions and the purpose of weighting criteria under the FSF sustainability aim. Table 3 shows the different stakeholder roles and their relation with an FSF.
Finally, 61 questionnaires were received (73.5% of questionnaires sent); three more were received late but were discarded for this reason (3.6% of questionnaires sent). Of the remaining 19 (22.9%) sent questionnaires for which we did not receive a response, the time required to answer the questionnaire (between 25 and 30 min), the deadline for filling in the questionnaire (one week), or the lack of interest in this study (as in the case of Other Employees role, only with 46.1% of received questionnaires), represent the three possible reasons why no response was received. The questionnaire responses were revised and adapted to the necessary format, in order to enter this information into the AHP system (the software used in this study was the FuzzyAHP package of R [46]), generating the pairwise comparison matrixes. The questionnaires that did not pass the consistency test (used to directly estimate the consistency of pairwise comparisons [47]), were revised and the values of the comparison matrix were considered and checked. In the cases in which the adjustments were minor or not significant, the procedure was repeated [48]. The definitive number of valid questionnaires was 44 (72.1% of questionnaires received and 53.0% of questionnaires sent). Table 4 shows the number and percentage of questionnaires sent, received, and validated, by stakeholder role. Finally, the AHP system calculated the comparison weights of KPIs and BSC perspectives, and generated the result with the weights of the perspectives and the KPIs.

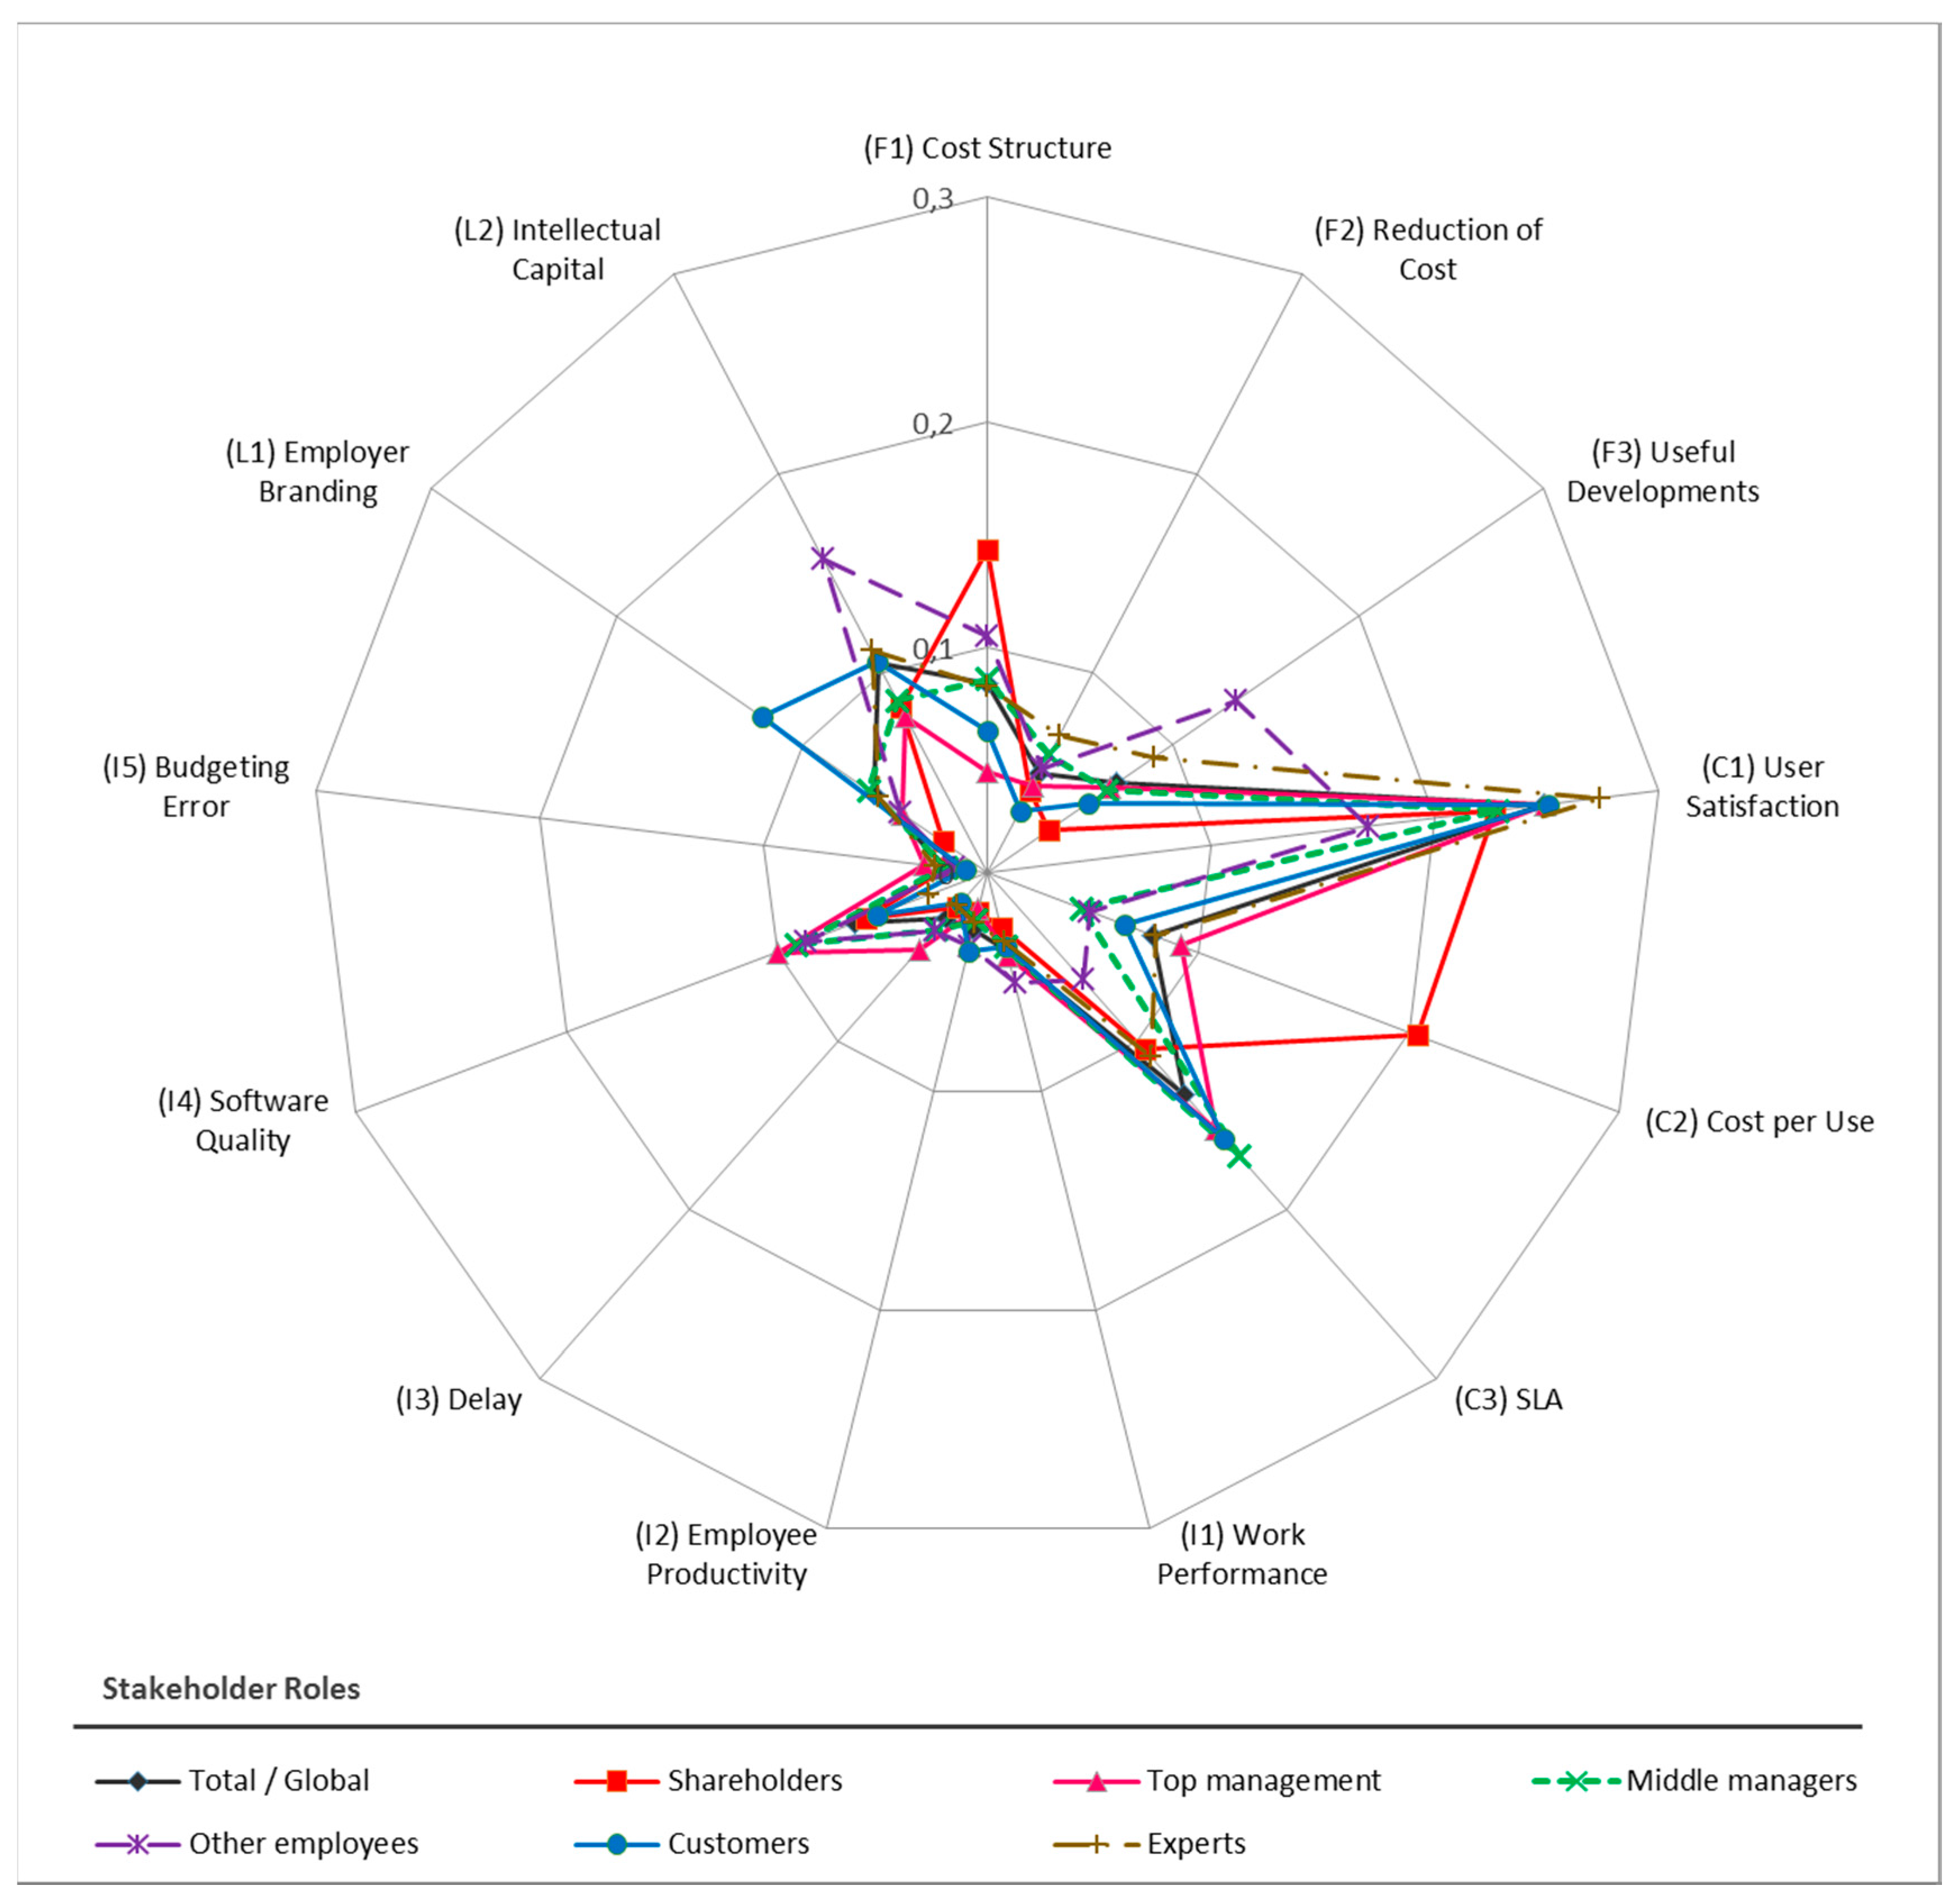
4. Results: A Case Study for FSF

The results of the four BSC dimensions for an FSF performance evaluation show that the Customer Perspective, with a priority weight of 0.4586, is the most important perspective. This is followed by the Finance Perspective, with a priority weight of 0.2035. The priority weight of the Internal Business Process Perspective is 0.1712, and the Learning and Growth Perspective has the lowest priority weight, of 0.1667.
The priority order of the 13 KPIs shows that User Satisfaction, with a priority weight of 0.2482, and SLA, with a value of 0.1319 (both included in the Customer Perspective), are the most important KPIs among all of those included in the BSC for an FSF. The third most important indicator is Intellectual Capital, with a weight of 0.1049 (included in the Learning and Growth Perspective), followed by Cost Structure, with a weight of 0.0841 (included in the Financial Perspective). The seventh indicator is Software Quality, with a weight of 0.0633 (included in the Internal Business Process Perspective). Finally, Figure 4 shows the initial hierarchy based on the BSC for an FSF (see Figure 3) and the global results ranked by weights.

5. Discussion

As shown in Table 5 and Figure 5 and Figure 6, the results by role in the AHP analysis reveal that the Customer Perspective is the primary focus of the BSC, and that User Satisfaction is the most important evaluation KPI. The Customer Perspective is the most important by role (Other Employees being the only exception), but User Satisfaction is the best ranking KPI in all cases. The SLA indicator (also included in the Customer Perspective) is globally the second most important KPI, and is, in most cases, one of the four most important KPIs for the different roles (Other Employees is again the only exception). This means that the importance given to the Customer Perspective, which is twice as important as the Financial Perspective, which is the next important perspective, clearly demonstrates the relationship and mutual dependence between the FSF and its customers. All of this implies that the main objective of the FSF should be focused on the continuous improvement of the services offered to their customers, to cover their needs in the most efficient way.
The third most important KPI is Intellectual Capital. Intellectual Capital is a compendium of human, structural, and relational capital indicators relating to the value of the organisation. The importance given to this indicator (included in the Learning and Growth Perspective) is that it provides evidence about the meaning of human factors in software development [49], where human capital plays a very important role [50]. The very nature of this kind of industry, when absolutely linked to the banking sector, means that one of the most important indicators for banks today is the Cost Structure (included in the Financial Perspective), which is the fourth most important KPI in this study. This indicator, like the Financial Perspective, holds a special meaning for shareholders and is the second most important indicator for them. The Software Quality KPI is the most important factor in the Internal Business Process Perspective. This indicator has a special relationship with the User Satisfaction KPI, because the degree to which customer needs are satisfied is part of Software Quality KPI, according to ISO/IEC 25010:2011 [51]. The relation between Software Quality with User Satisfaction, the most important KPI, is probably one of the causes that gives this indicator a much greater weight than the other indicators included in the Internal Business Processes Perspective.
On the other hand, and although it is not the main objective of this study, it can be concluded from the analysis of the results obtained for the different roles of participants, that each role places more importance to those indicators or perspectives that, in theory, have a greater relation to its own role. In this way, it can be observed that the shareholders give greater weight to the Financial Perspective. The employees (Top Management, Middle Managers and Other Employees) of the software factory place a greater value on the Internal Business Process Perspective. Customers are those that give less importance to the Financial Perspective, but instead, they attribute great importance to the assets and image of the company that offers them services. Although, to confirm this appreciation, User Satisfaction and SLA are the two main indicators for Customers. Furthermore, the role of Other Employees substantially differs from the rest of the employees, which could indicate the lack of organizational communication, related to the importance of customers for the FSF and satisfying their needs, from a higher level of employees to lower levels. The importance given to Intellectual Capital, an indicator that includes human capital value, by the Other Employees, is the highest of all the stakeholders.

6. Conclusions

The banking sector requires huge amounts of new software developments to satisfy its needs, which makes it necessary to increase both the production and the productivity of their developments. With the intention of achieving this aim, this study proposes a framework based on the BSC of an FSF and AHP incorporating the weights of each KPI, which allows a more efficient evaluation of the decisions that must be taken, depending on the different needs. To achieve this purpose, we have analysed the BSC of an FSF and then used its hierarchical structure to design the performance evaluation framework. According to this hierarchical structure of the BSC, we have designed a pairwise comparisons questionnaire in an AHP format to obtain the opinion of different stakeholder roles. Finally, we have treated their responses with AHP software to calculate the weights of all indicators and perspectives of the BSC of an FSF for business sustainability analysis of the results. In view of the results obtained, this study confirms that the combination of BSC with AHP provides a valid methodology for obtaining the necessary criteria and indicator weights to evaluate the performance of an FSF, in order to achieve a sustainable business. The results of this study are potentially useful to software factory managers. This is because, when viewed through the limits and characteristics of their own financial software factories, it can assist them in quantifying the magnitude of the changes required to increase the performance of the organisation. Knowing the ranking of importance of the perspectives and KPIs could be very useful for strategic plans and establishing priorities. This could be even more remarkable if the priorities of the different stakeholders are known. It could also be useful for reinforcing the organizational communication in order to avoid the gaps detected, for example, the different priorities identified for the employees. Although each organization will still have its own idiosyncrasy, the results achieved here (for example the different view that employees have on some aspects) can be taken as illustrative of what can happen in many organizations.
The results presented in this paper clearly demonstrate the preponderant role of the Customer Perspective, and that satisfying customer needs should be the primary reference for decision-making in an FSF. User Satisfaction and SLA are the two most important indicators for an FSF, which is why the managers of the software factory must strive for continuous improvement in these indicators. Improving the Intellectual Capital (which is the main asset of a software development company), and achieving a viable cost structure for the organisation, are the two most important internal challenges facing the managers of an FSF. In practice, the results discussed here, and shown in Figure 4, will allow managers to justify their decisions and will allow an assessment of the impact of measures on FSF performance, focused on the organisation’s sustainability.
It is also necessary to highlight the different behaviours observed according to the different stakeholder roles (see Table 5), which places a greater importance on those indicators or perspectives that have a closer relation to their role or function in the software factory. According to Figure 5, we can conclude that, regarding the perspectives, all of the different profiles are quite well aligned, except for the employees, and to a lesser extent, but as expected, the customers. Regarding the indicators, the differences are more remarkable. The profiles exhibiting the greatest differences are those of the employees and customers, but also the shareholders, who place more importance on the cost structure and cost per use. This fact implies that, in order to have a global vision that improves the performance and achieves the sustainability of this kind of organisation, it is necessary to take into account the perspectives of all the roles related to the FSF.
Future research will aim to improve the proposed framework in this study, integrating the strategy map and the BSC of an FSF with Fuzzy AHP. This integration will allow us to assess the impact that each indicator included in the BSC has on the different objectives defined in the strategy map of the organization. This knowledge should be the basis for making decisions based on the Mission and Vision of the organization. Furthermore, the use of methods such as fuzzy AHP, avoids the uncertainty and the ambiguity associated with human preferences. Fuzzy AHP, which could be incorporated with the pairwise comparison as an extension on AHP, allows for a more accurate description of the decision making process.

Acknowledgments

This work has been subsidized through the Plan of Science, Technology and Innovation of the Principality of Asturias (Ref: FC-15-GRUPIN14-132). The authors also thank anonymous referees who reviewed and gave important comments to this paper.

Author Contributions

Vicente Rodríguez Montequín and Francisco Ortega Fernández contributed in developing the conception of the research design; data interpretation; and writing. César Álvarez Pérez contributed in the development and execution of the research approach; literature review; data collection and integration; validation and writing. Joaquín Villanueva Balsera contributed in enhancing the research approach and data processing.

Conflicts of Interest

The authors declare no conflicts of interest.

References

  1. Schubert, J. Top Challenges Facing the Banking Industry Right Now. Available online: https://goo.gl/b5NMD0 (accessed on 27 November 2016).
  2. De la Fuente Asprón, R. Medir la Productividad del Desarrollo de Software en Banca. Available online: http://www.financialtech-mag.com (accessed on 22 June 2013). (In Spanish).
  3. Emaldi Abasolo, M. The Software Factories. Dyna Bilbao 2007, 82, 330–333. (In Spanish) [Google Scholar]
  4. Murphy, G.C. What is software development productivity, anyway? (Keynote). In Proceedings of the 2013 10th IEEE Working Conference on Mining Software Repositories (MSR), San Francisco, CA, USA, 18–26 May 2013. [Google Scholar]
  5. Álvarez, C.; Rodríguez, V.; Ortega, F.; Villanueva, J. A Scorecard Framework Proposal for Improving Software Factories’ Sustainability: A Case Study of a Spanish Firm in the Financial Sector. Sustainability 2015, 7, 15999–16021. [Google Scholar] [CrossRef]
  6. Brown, A.; Lopez, A.; Reyes, L. Practical Experiences with Software Factory Approaches in Enterprise Software Delivery. In Proceedings of the 6th International Conference on Software Engineering Advances (ICSEA), Barcelona, Spain, 23–29 October 2011; IARIA: Barcelona, Spain, 2011; Volume 2011, pp. 465–470. [Google Scholar]
  7. Kaplan, R.S.; Norton, D.P. The balanced scorecard—Measures that drive performance. Harv. Bus. Rev. 1992, 70, 71–79. [Google Scholar] [PubMed]
  8. Kaplan, R.S.; Norton, D.P. The Balanced Scorecard: Translating Strategy into Action; Harvard Business Press: Boston, MA, USA, 1996. [Google Scholar]
  9. Bentes, A.V.; Carneiro, J.; da Silva, J.F.; Kimura, H. Multidimensional assessment of organizational performance: Integrating BSC and AHP. J. Bus. Res. 2012, 65, 1790–1799. [Google Scholar] [CrossRef]
  10. Netherlands Software Metrics Users Association Challenges in Productivity Measurement. Why Is It Hard to Measure Productivity in the Software Industry? Available online: https://goo.gl/GfkkAr (accessed on 4 February 2017).
  11. De Felice, F.; Petrillo, A.; Autorino, C. Development of a framework for sustainable outsourcing: Analytic Balanced Scorecard Method (A-BSC). Sustainability 2015, 7, 8399–8419. [Google Scholar] [CrossRef]
  12. Bulut, C.; Can, O. Business Performance. In Encyclopedia of Corporate Social Responsibility; Idowu, S.O., Capaldi, N., Zu, L., Gupta, A.D., Eds.; Springer: Berlin/Heidelberg, Germany, 2013; pp. 273–279. [Google Scholar]
  13. Wu, H.-Y.; Tzeng, G.-H.; Chen, Y.-H. A fuzzy MCDM approach for evaluating banking performance based on Balanced Scorecard. Expert Syst. Appl. 2009, 36, 10135–10147. [Google Scholar] [CrossRef]
  14. Kaplan, R.S.; Norton, D.P. Using the balanced scorecard as a strategic management system. Harv. Bus. Rev. 2007, 85, 150–161. [Google Scholar]
  15. Bourguignon, A.; Malleret, V.; Nørreklit, H. Balanced Scorecard versus French Tableau de Bord: Beyond Dispute, a Cultural and Ideological Perspective; Groupe HEC: Cergy-Pontoise, France, 2001. [Google Scholar]
  16. Van Grembergen, W. The Balanced Scorecard and IT Governance. Inf. Syst. Control J. 2000, 2, 40–43. [Google Scholar]
  17. Keyes, J. Implementing the IT Balanced Scorecard: Aligning IT with Corporate Strategy; CRC Press: Boca Raton, FL, USA, 2016. [Google Scholar]
  18. Figge, F.; Hahn, T.; Schaltegger, S.; Wagner, M. The Sustainability BSC—Theory and Applicantion of a Tool for Value-Based Sustainability Management. In Corporate Social Responsability—Governance for Sustainability, Proceedings of the Greening of Industry Network Conference, Gothenburg, Sweden, June 23–26 2002; Emerald Publishing Limited: Bingley, UK, 2002. [Google Scholar]
  19. Rohm, H.; Montgomery, D. Link Sustainability to Corporate Strategy Using the Balanced Scorecard; The Balanced Scorecard Institute: Cary, NC, USA, 2011. [Google Scholar]
  20. Lu, I.-Y.; Kuo, T.; Lin, T.-S.; Tzeng, G.-H.; Huang, S.-L. Multicriteria decision analysis to develop effective sustainable development strategies for enhancing competitive advantages: Case of the TFT-LCD industry in Taiwan. Sustainability 2016, 8, 646. [Google Scholar] [CrossRef]
  21. Davis, S.; Albright, T. An investigation of the effect of balanced scorecard implementation on financial performance. Manag. Account. Res. 2004, 15, 135–153. [Google Scholar] [CrossRef]
  22. Al-Najjar, S.M.; Kalaf, K.H. Designing a balanced scorecard to measure a bank’s performance: A case study. Int. J. Bus. Adm. 2012, 3, 44. [Google Scholar] [CrossRef]
  23. Montequín, V.R.; Fernández, F.O.; Pérez, C.Á.; Balsera, J.V. Scorecard and KPIs for monitoring software factories effectiveness in the financial sector. Int. J. Inf. Syst. Proj. Manag. 2013, 1, 29–43. [Google Scholar]
  24. Saaty, T.L. A scaling method for priorities in hierarchical structures. J. Math. Psychol. 1977, 15, 234–281. [Google Scholar] [CrossRef]
  25. Saaty, T.L. The Analytic Hierarchy Process: Planning, Priority Setting, Resource Allocation; McGraw-Hill International Book Company: New York, NY, USA, 1980. [Google Scholar]
  26. Wang, Y.; Xia, Q. A fuzzy AHP and BSC approach for evaluating performance of a software company based on knowledge management. In Proceedings of the IEEE 2009 First International Conference on Information Science and Engineering, Nanjing, China, 26–28 December 2009; pp. 2242–2245. [Google Scholar]
  27. Dyer, J.S. Remarks on the analytic hierarchy process. Manag. Sci. 1990, 36, 249–258. [Google Scholar] [CrossRef]
  28. Liu, D.; Bishu, R.R.; Najjar, L. Using the analytical hierarchy process as a tool for assessing service quality. Ind. Eng. Manag. Syst. 2005, 4, 129–135. [Google Scholar]
  29. Hua Lu, M.; Madu, C.N.; Kuei, C.; Winokur, D. Integrating QFD, AHP and benchmarking in strategic marketing. J. Bus. Ind. Mark. 1994, 9, 41–50. [Google Scholar] [CrossRef]
  30. Liberatore, M.J.; Monahan, T.F.; Stout, D.E. A framework for integrating capital budgeting analysis with strategy. Eng. Econ. 1992, 38, 31–43. [Google Scholar] [CrossRef]
  31. Chan, Y.L.; Lynn, B.E. Performance evaluation and the analytic hierarchy process. J. Manag. Account. Res. 1991, 3, 57–87. [Google Scholar]
  32. Thomas, S. The Analytic Hierarchy Process: Planning, Priority Setting, Resource Allocation; Pittsburgh PA Univ.: Pittsburgh, PA, USA, 1980. [Google Scholar]
  33. Saaty, T.L. How to make a decision: The analytic hierarchy process. Eur. J. Oper. Res. 1990, 48, 9–26. [Google Scholar] [CrossRef]
  34. Voronin, A.N. A method of multicriteria evaluation and optimization of hierarchical systems. Cybern. Syst. Anal. 2007, 43, 384–390. [Google Scholar] [CrossRef]
  35. Sharma, M.K.; Bhagwat, R. An integrated BSC-AHP approach for supply chain management evaluation. Meas. Bus. Excell. 2007, 11, 57–68. [Google Scholar] [CrossRef]
  36. Saaty, T.L. An exposition of the AHP in reply to the paper “remarks on the analytic hierarchy process”. Manag. Sci. 1990, 36, 259–268. [Google Scholar] [CrossRef]
  37. Hosein, Z.Z.; Yousefie, A.; Mehrizi, S.M.T. Evaluating and Ranking Performance by Combination Model of Balanced Scorecard and Ariadne Uncertain Estimate. Asian Soc. Sci. 2014, 10, 70. [Google Scholar]
  38. Noori, B. Prioritizing strategic business units in the face of innovation performance: Combining fuzzy AHP and BSC. Int. J. Bus. Manag. 2015, 3, 36–56. [Google Scholar] [CrossRef]
  39. Yaghoobi, T.; Haddadi, F. Organizational performance measurement by a framework integrating BSC and AHP. Int. J. Product. Perform. Manag. 2016, 65, 959–976. [Google Scholar] [CrossRef]
  40. Castrogiovanni, G.; Ribeiro-Soriano, D.; Mas-Tur, A.; Roig-Tierno, N. Where to acquire knowledge: Adapting knowledge management to financial institutions. J. Bus. Res. 2016, 69, 1812–1816. [Google Scholar] [CrossRef]
  41. Chang, S.-C.; Tsai, P.-H. A hybrid financial performance evaluation model for wealth management banks following the global financial crisis. Technol. Econ. Dev. Econ. 2016, 22, 21–46. [Google Scholar] [CrossRef]
  42. Rabbani, A.; Zamani, M.; Yazdani-Chamzini, A.; Zavadskas, E.K. Proposing a new integrated model based on sustainability balanced scorecard (SBSC) and MCDM approaches by using linguistic variables for the performance evaluation of oil producing companies. Expert Syst. Appl. 2014, 41, 7316–7327. [Google Scholar] [CrossRef]
  43. Sundharam, V.N.; Sharma, V.; Stephan Thangaiah, I.S. An integration of BSC and AHP for sustainable growth of manufacturing industries. Int. J. Bus. Excell. 2013, 6, 77–92. [Google Scholar] [CrossRef]
  44. Chung, C.-C.; Chao, L.-C.; Chen, C.-H.; Lou, S.-J. A Balanced Scorecard of Sustainable Management in the Taiwanese Bicycle Industry: Development of Performance Indicators and Importance Analysis. Sustainability 2016, 8, 518. [Google Scholar] [CrossRef]
  45. Kaplan, R.S. Conceptual foundations of the balanced scorecard. Handb. Manag. Account. Res. 2008, 3, 1253–1269. [Google Scholar]
  46. Caha, J.; Drážná, A. Information about Fuzzy AHP Package for R (Version 0.8.0). Available online: https://goo.gl/DXlLm8 (accessed on 20 March 2017).
  47. Saaty, R.W. The analytic hierarchy process—What it is and how it is used. Math. Model. 1987, 9, 161–176. [Google Scholar] [CrossRef]
  48. Malczewski, J. GIS and Multicriteria Decision Analysis; John Wiley & Sons: New York, NY, USA, 1999. [Google Scholar]
  49. Amrit, C.; Daneva, M.; Damian, D. Human factors in software development: On its underlying theories and the value of learning from related disciplines. A guest editorial introduction to the special issue. Spec. Issue Hum. Factors Softw. Dev. 2014, 56, 1537–1542. [Google Scholar] [CrossRef]
  50. Curtis, B.; Krasner, H.; Iscoe, N. A field study of the software design process for large systems. Commun. ACM 1988, 31, 1268–1287. [Google Scholar] [CrossRef]
  51. Joint Technical Committee ISO/IEC JTC 1/SC7 ISO/IEC 25010:2011 Systems and Software Engineering—Systems and software Quality Requirements and Evaluation (SQuaRE)—System and Software Quality Models. Available online: https://www.iso.org/standard/35733.html (accessed on 20 March 2017).
Figure 1. The BSC for an FSF. Adapted from [5].
Sustainability 09 00486 g001
Figure 2. Performance evaluation framework of the research.
Sustainability 09 00486 g002
Figure 3. Hierarchical framework of BSC performance evaluation criteria for FSF.
Sustainability 09 00486 g003
Figure 4. Weights and Ranking of the BSC for an FSF performance evaluation index by AHP.
Sustainability 09 00486 g004
Figure 5. Criteria (Perspectives) weights radar graph for different stakeholder roles.
Sustainability 09 00486 g005
Figure 6. Sub-criteria (KPIs) weights radar graph for different stakeholder roles.
Sustainability 09 00486 g006
Table 1. Descriptions and explanations of the selection of KPIs for FSF performance.
No.KPIsDescription and Explanation
1(F1) Cost StructureCost evolution according to financial entity size. The costs of the software factory and the size of the financial entity are compared in such way that when the size of the matrix financial group decreases, the costs of the software factory should also decrease in a similar proportion. This indicator is in connexion with the third strategic line (optimization of cost).
2(F2) Reduction of CostThe ratio of cost that is covered by sales to companies outside the group. The purpose of this indicator is to assess the percentage of the structural cost of the software factory that is covered by income over the last year, whose source is the sale of software developments and services to companies outside the corporate group. Because of the huge cost of software development, sales revenue outside the financial group owner is generally seen as a reduction of costs. The indicator is derived from the fourth strategic line (sell the developments and services to other companies different from the owning financial group).
3(F3) Useful DevelopmentsDegree of use of the delivered software by the customers. In this particular case, the degree of use of the developments is indicated by the number of software executions and the indicator is calculated as the cumulative number of these executions in relation to the size of the financial institution over the last year. In this framework is understood that the greater use of the developments, the higher income should be achieved. The indicator is derived from the second strategic line (the level of use of the delivered software by the customers should be increased).
4(C1) User SatisfactionDegree of customer satisfaction concerning software developments and services given by the software factory. Customers are the users of these software developments and services. The indicator is connected to the second strategic line.
5(C2) Cost per UseThe proportion between the cost paid by the customer and the degree of use of the delivered software, measured by means of the cumulative number of executions as in (F3). The indicator is connected to the third strategic line.
6(C3) SLALevel of service expected from the software factory as a service provider. The proposed SLA indicator to use in the BSC is a multi-indicator that joins and unifies all the agreements reached with the financial group, and more specifically between the financial institution and the FSF. The indicator is connected to the first and second strategic lines.
7(I1) Work PerformanceEfficiency level in terms of improving rates of software built. The indicator is calculated as ratio between budgeted hours and the performed hours and it is derived from the strategic line of improve the performance and productivity of the FSF.
8(I2) Employee ProductivityAmount of software that an employee produces for each hour on the job. The ratio is connected with the improvement of performance and productivity of the FSF.
9(I3) DelayAverage waiting time for delivery of software. This indicator shows the delay in hours when the software factory is delivering software developments. The indicator is connected with the improvement of performance and productivity of the FSF.
10(I4) Software QualityAggregated indicator that assess the software quality, in connection with the second strategic line (delivery of software development must be good quality).
11(I5) Budgeting ErrorAccuracy of the estimates linked to software development. The indicator shows how good the estimations are over the last year and it is related with the third strategic line.
12(L1) Employer BrandingReputation of the software factory as an employer. Employees, and especially high-quality employees as a very important part of intellectual capital, must be attracted and retained by firms, and employer branding can help them to address the different needs and expectations of potential and existing employees. This indicator contributes to support all the strategic lines.
13(L2) Intellectual CapitalAggregated indicator that assess the intellectual capital as a compendium of human, structural and relational capital. This indicator contributes to support all the strategic lines.
Table 2. Scale to use in making expert judgments [33].
Intensity of Importance on an Absolute ScaleDefinitionExplanation
1Equally importantTwo activities contribute equally to the objective
3Weakly importantExperience and judgment strongly favour one activity over another
5Essentially importantExperience and judgment strongly favour one activity over another
7Very strongly importantAn activity is strongly favoured and its dominance demonstrated in practice
9Absolutely importantThe evidence favouring one activity over another is of the highest possible order of affirmation
2, 4, 6, 8Intermediate value between two adjacent judgmentsWhen compromise is needed
ReciprocalsIf activity i has one of the above numbers assigned to it when compared with activity j, then j has the reciprocal value when compared with i
Table 3. Different stakeholder roles and their relation with an FSF.
Stakeholder RolesRelation with the FSF
ShareholdersThe shareholders are the owners of the company. They are usually top management of the financial entities involved in the same financial group.
Top ManagementTop management are the highest ranking executives responsible for the entire FSF. They translate policy into goals and strategies for the future. Top management make decisions affecting everyone in the software factory.
Middle ManagersThe middle managers are the employees of the FSF who manage at least one subordinate level of managers, and report to the top management in the organisation to ensure smooth functioning of the software factory.
Other EmployeesOther employees are the lowest level of managers and the rest of the employees of the software factory, including analysts and developers.
CustomersCustomers are the financial entities for which the software factory develops software and offers services to them.
Experts in Software FactoriesExperts are a group of managers of other software factories from different sectors, professors and researchers in relation to software factories.
Table 4. Number and percentage of sent, received, and valid questionnaires, by role.
Stakeholder RolesNumber of Sent QuestionnairesNumber of Received QuestionnairesNumber of Valid Received Questionnaires (Received/Sent)
Shareholders13969.2%666.7%/46.2%
Top Management12866.7%675.0%/50.0%
Middle Managers151386.7%861.5%/53.3%
Other Employees13646.1%583.3%/38.5%
Customers151493.3%1071.4%/66.7%
Experts in Software Factories151173.3%981.8%/60.0%
Total836173.5%4472.1%/53.0%
Table 5. Weights of perspectives and KPIs of BSC for an FSF performance evaluation index by AHP, according to the roles of different stakeholders of FSF.
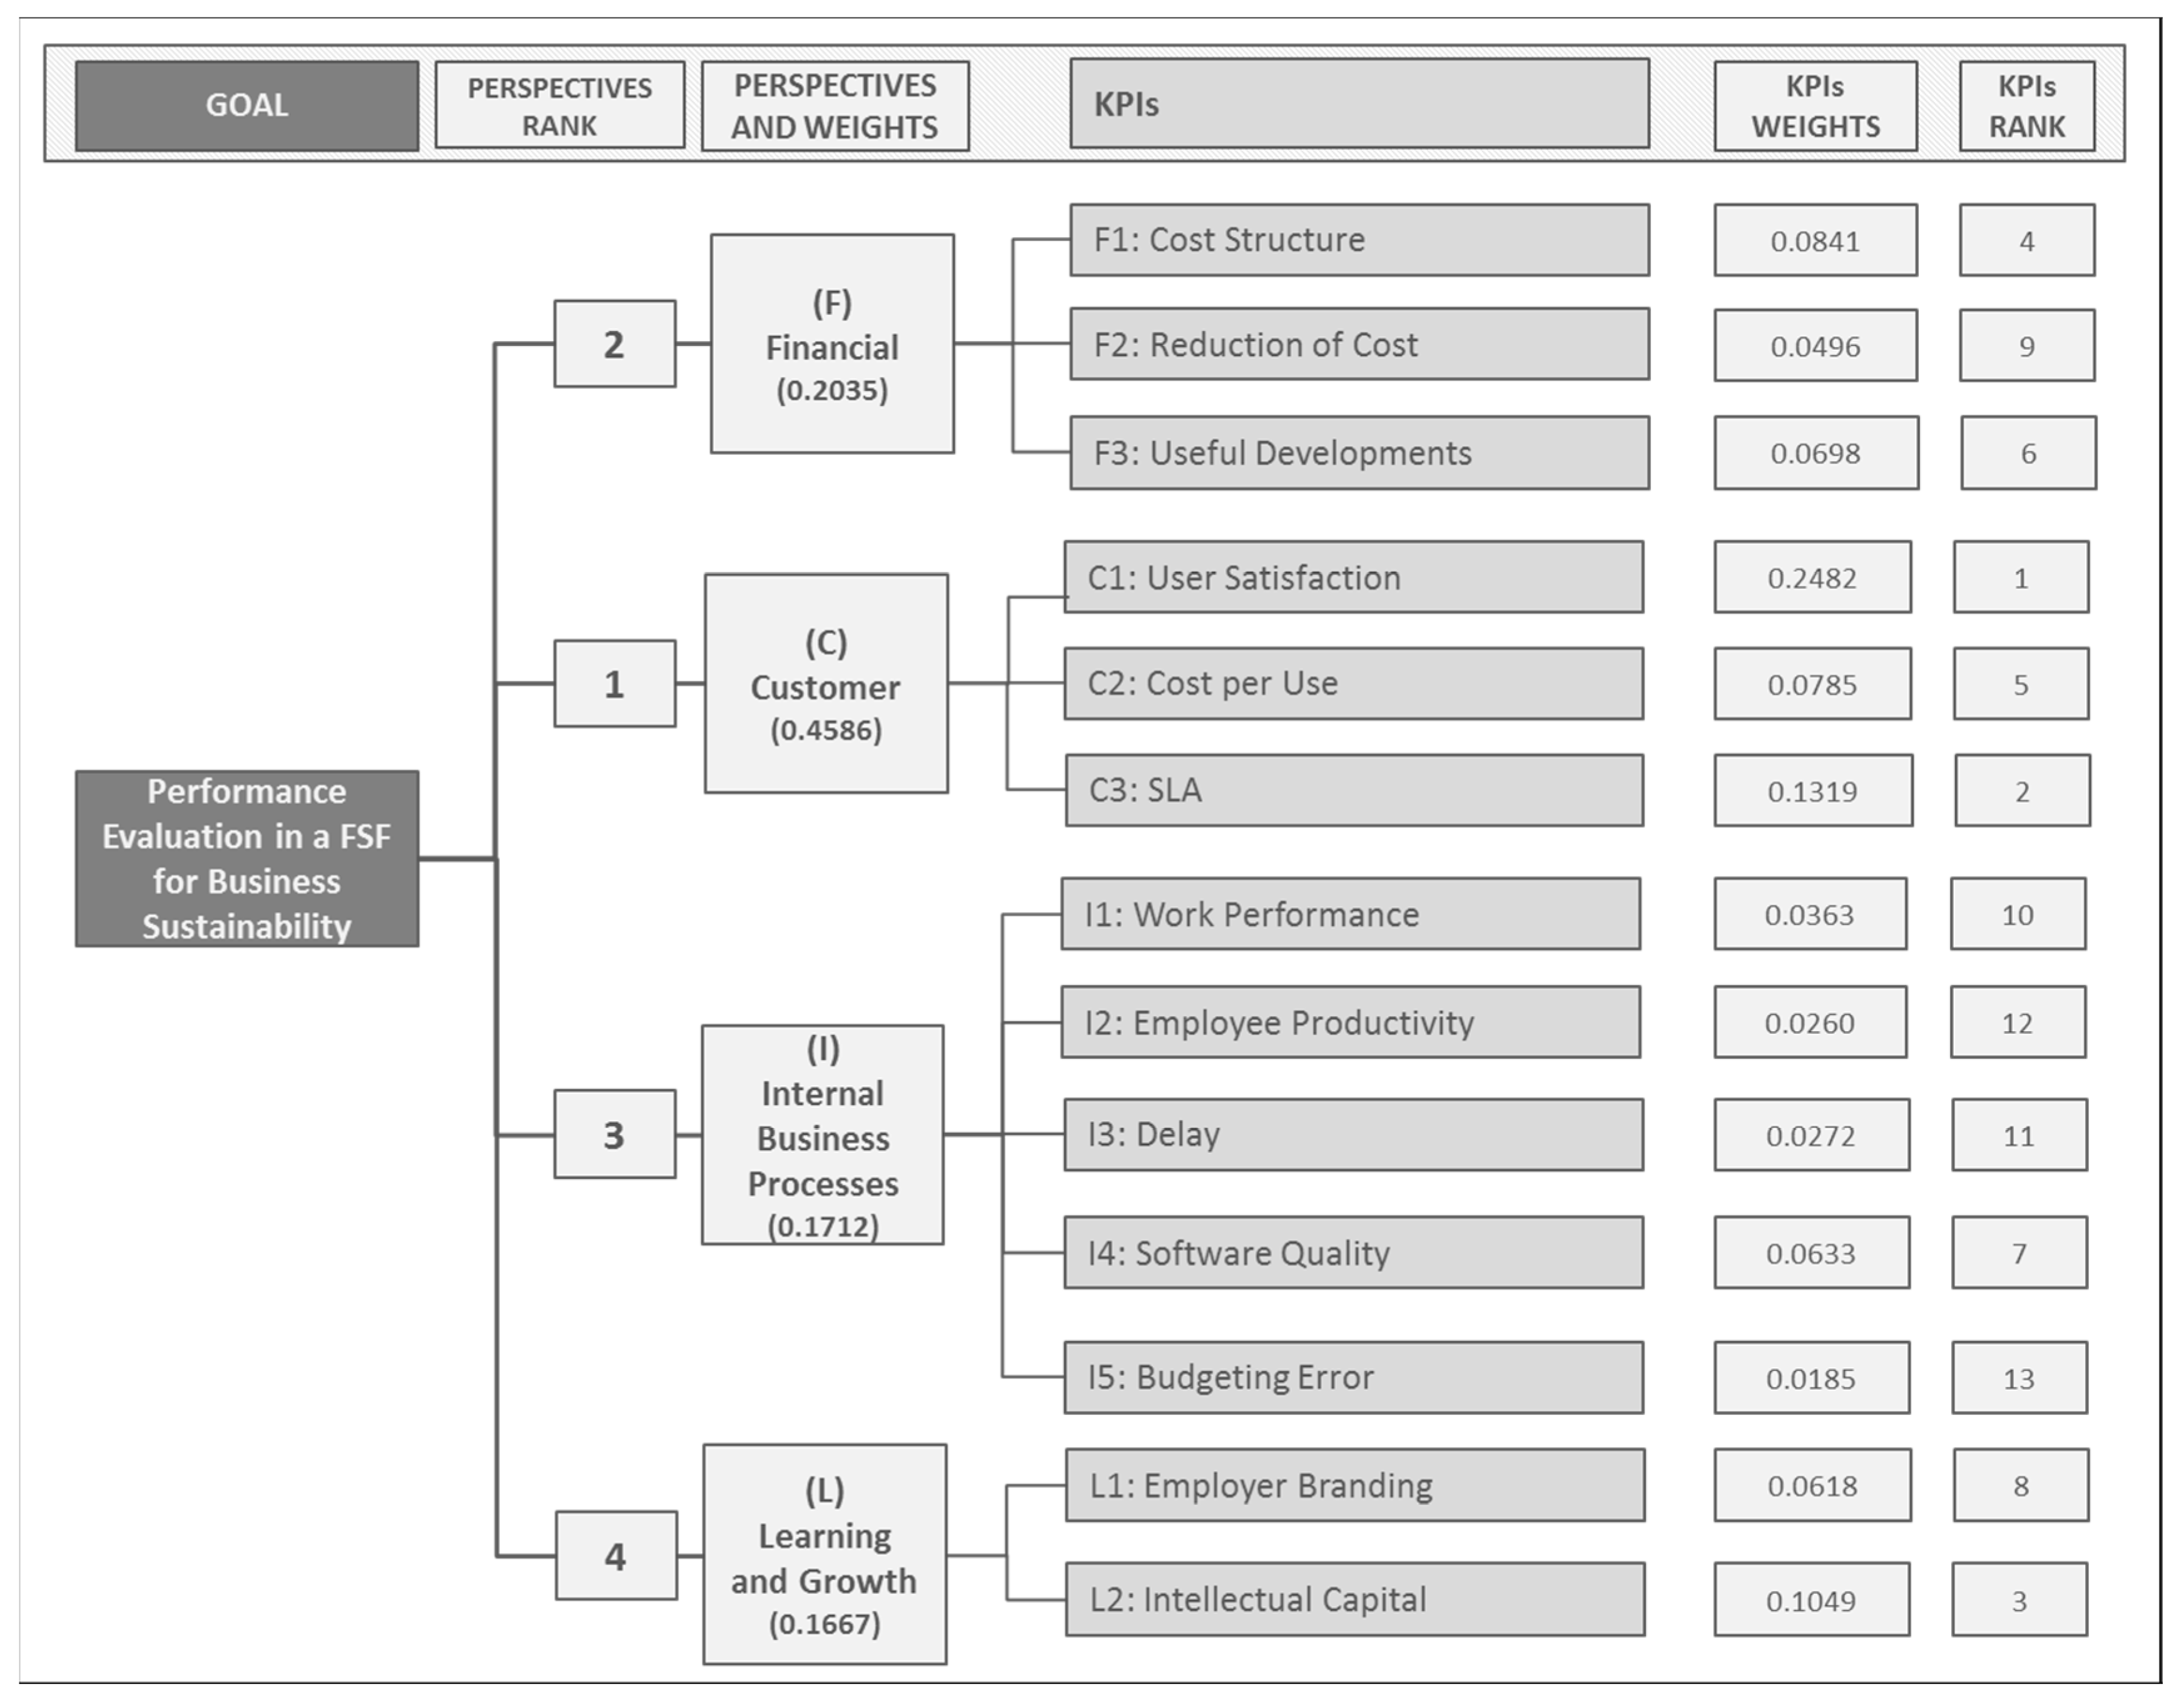
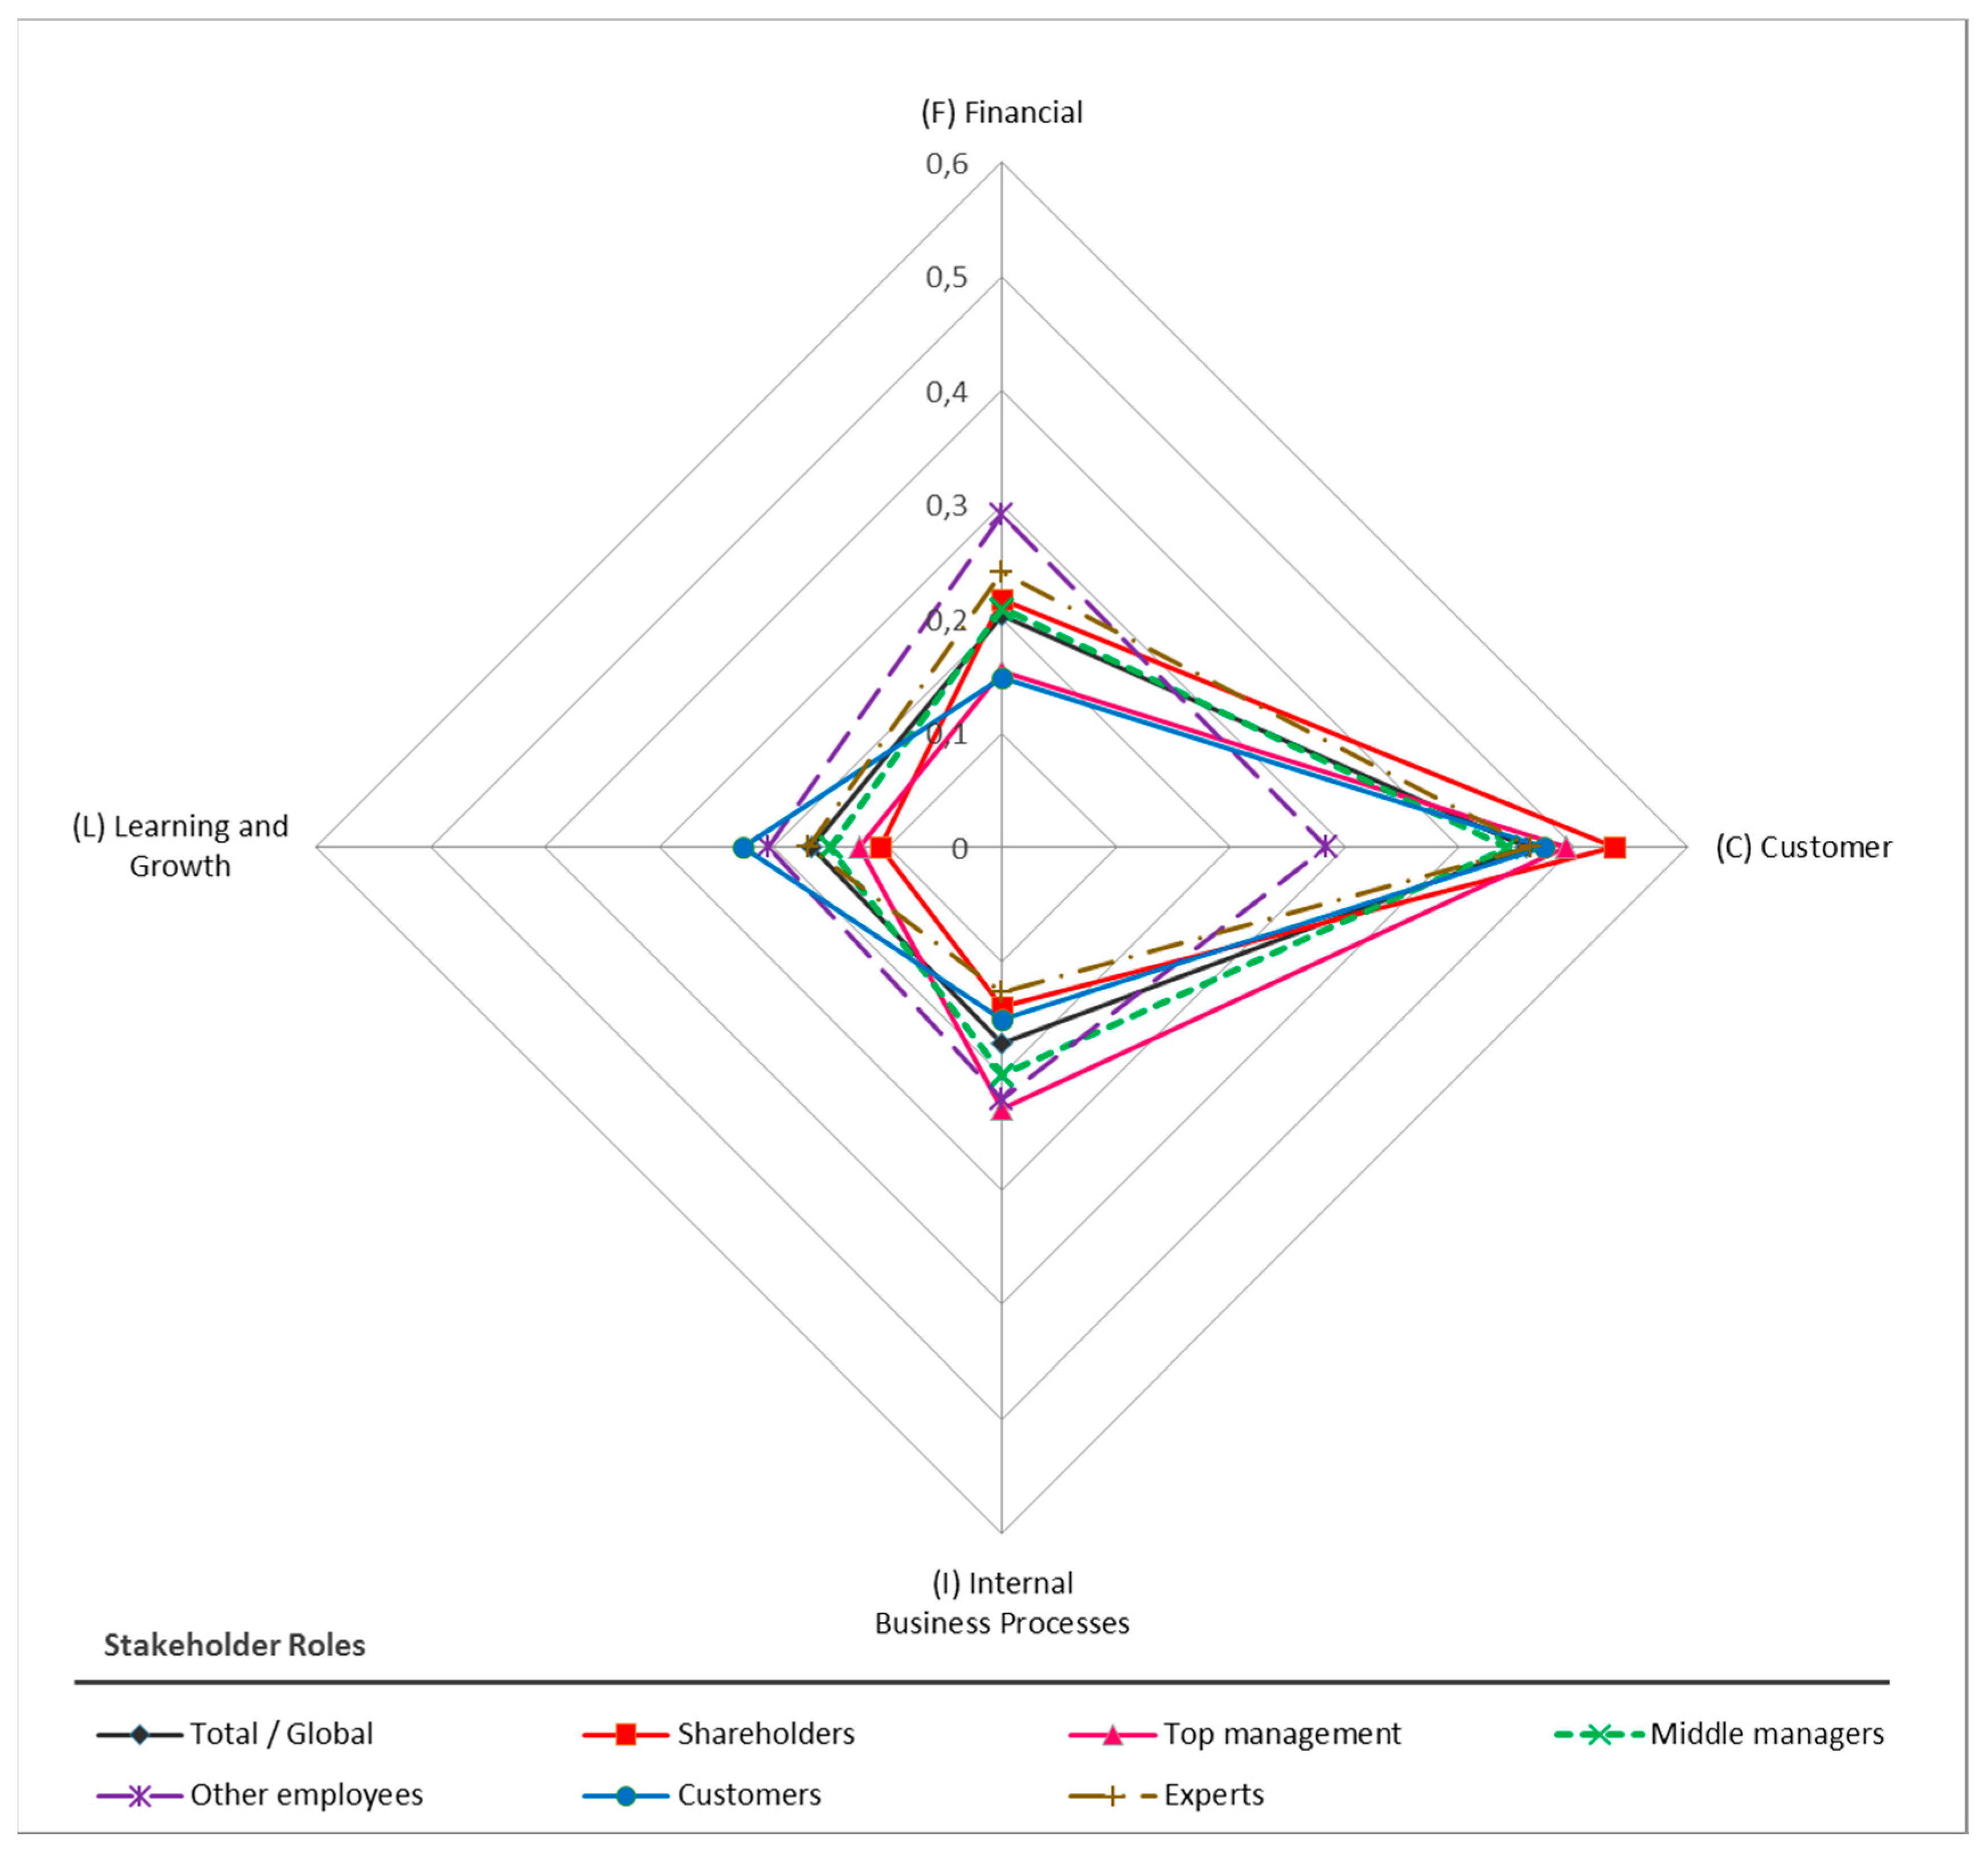
Criteria and Sub-Criteria/Roles of StakeholdersTotal/GlobalShare-HoldersTop ManagementMiddle ManagersOther EmployeesCustomersExperts
(F) Finance0.20350.21720.15360.20900.29140.14820.2407
 (F1) Cost Structure0.08410.14300.04460.08590.10510.06320.0825
 (F2) Reduction of Cost0.04960.04090.04300.05880.05220.03050.0684
 (F3) Useful Developments0.06980.03330.06590.06430.13400.05450.0898
(C) Customer0.45860.53520.49330.44170.28290.47350.4628
 (C1) User Satisfaction0.24820.22630.24950.22840.17040.25080.2739
 (C2) Cost per Use0.07850.20410.09170.04460.04870.06460.0797
 (C3) SLA0.13190.10480.15220.16860.06380.15810.1093
(I) Internal Business Processes0.17120.14030.22870.19920.22140.15100.1264
 (I1) Work Performance0.03630.02520.03810.03410.05080.03390.0320
 (I2) Employee Productivity0.02600.01780.01690.02190.03420.03640.0230
 (I3) Delay0.02720.02050.04550.03400.03480.01810.0198
 (I4) Software Quality0.06330.05800.09980.09060.08650.05270.0282
 (I5) Budgeting Error0.01850.01870.02850.01850.01510.00990.0234
(L) Learning and Growth0.16670.10730.12440.15020.20430.22720.1700
 (L1) Employer Branding0.06180.02410.04590.06400.04730.12180.0591
 (L2) Intellectual Capital0.10490.08320.07850.08610.15700.10540.1110

