
Estimates of Economic Loss of Materials Caused by Acid Deposition in China

1
Institute of Geographic Sciences and Natural Resources Research, Chinese Academy of Sciences, Beijing 100101, China
2
China National Environmental Monitoring Center, Beijing 100012, China
3
University of Chinese Academy of Sciences, Beijing 100049, China
*
Author to whom correspondence should be addressed.
Sustainability 2017, 9(4), 488; https://doi.org/10.3390/su9040488
Submission received: 19 December 2016
/
Revised: 19 March 2017
/
Accepted: 21 March 2017
/
Published: 24 March 2017
(This article belongs to the Special Issue Challenges and responses to population health and urbanization in the 21st century)
Abstract
:China is facing severe acid deposition. Acid deposition can cause economic loss, corrosion, and damage to materials, and the reduction of material life span. In this study, the administrative areas (including municipalities, prefecture-level cities, regions, autonomous prefectures, and leagues—hereinafter referred to the cities) at and above the prefecture level were selected as research areas. Monitoring results of acid precipitation and ambient air sulfur dioxide (SO2) from the China National Environmental Monitoring Network were used, research findings available domestically and abroad were summarized, and a set of material exposure inventory per capita was established, based on urban and rural areas in Eastern, Central, and Western China regions. Losses of construction materials caused by acid deposition in the cities were assessed by using the said materials’ acid rain exposure response functions available. The results showed that, material loss caused by acid deposition in China was 32.165 billion yuan (RMB, similarly hereinafter) in 2013, accounting for 0.057% of GDP (Gross Domestic Product) and 3.4% of the total investment for environmental pollution governance this year.
1. Introduction
The concept of acid rain was first proposed by Smith [1], who surveyed the rivers in the suburbs of Manchester, and found them to contain high SO42− concentrations. Unfortunately, this finding did not attract enough attention at the time [2]. In 1972, the Swedish Government submitted a report to the United Nations Conference on the Human Environment (UNCHE), and acid rain was treated as an international environmental issue in the report [3]. In 1975, the first International Seminar on Acid Rain and Forest Ecosystem was held in the United States, where serious dangers of acid rain on the surface, soil, forests, and vegetation were discussed, attracting universal attention to the issue of acid rain damage. Extensive research was then carried out on the acid rain issue [4,5].
Studies on acid rain in China began around the late 1970s [6,7,8,9,10], when monitoring and research on precipitation pH were conducted locally in cities such as Beijing, Shanghai, Nanjing, Chongqing, and Guiyang. To fully grasp the distribution of acid rain in China, the State Environmental Protection Administration (former name for the Ministry of Environmental Protection, MEP) set up a national acid rain monitoring network in 1982 [11,12]. By the end of 2011, about 500 cities (including districts and counties) conducted routine monitoring on acid precipitation in China, with a total of 1000 monitoring sites involved. Acid deposition remained a grave issue in China, with acid rain still dominated by sulfuric acid rain [13]. The acid deposition situation remained unchanged and serious in 2011. According to MEP, acid rain mainly spread along the mainstream of Yangtze River and to the south of the river’s middle and lower reaches in 2013. The acid deposition areas included most parts of Jiangxi Province, Fujian Province, Hunan Province, and Chongqing Municipality, as well as Yangtze River delta, Pearl River delta, and southeast Sichuan Province. The total area was equivalent to around 10.6% of the national territory [14].
When exposed to acid rain, outdoor materials will suffer different degrees of corrosion and damage, affecting materials’ life span and resulting in huge economic losses. Therefore, it is an important research task to evaluate economic loss on corrosion and damage of materials due to acid deposition. Research has been launched to analyze economic losses from damage of materials exposed owing to atmospheric pollution since the 1960s in other countries. Some studies yielded evaluations on the loss of construction materials in limited areas or individual countries in Europe and North America [15,16,17,18]. Kucera et al. [19] created an air pollution corrosion loss measurement model and calculated corrosion loss imposed by air pollution in three cities, namely, Stockholm, Prague, and Sarpsborg. Cowell et al. [20] assessed losses of buildings and materials due to European acid gas pollution relying on the model and loss function. Using residents’ income and expenditure data and the national tax data, in combination with data collected from surveys on the building cleaning market, Rabl et al. [21] converted economic gain and loss of building materials due to changes to air pollution levels in Paris.
Researchers also carried out studies on economic loss from corroded materials due to acid rain on a regional or urban scale in China. According to preliminary estimates by Yin [22], economic loss from corroded materials due to acid rain in two southwestern provinces (Sichuan and Guizhou) amounted to approximately 0.23% (371 million yuan) of their GDP in 1987. Economic loss from materials corroded by acid deposition in Guangdong and Guangxi Provinces was estimated to occupy 1.0% (1065.08 million yuan) and 0.9% (256.26 million yuan) of GDP respectively of the same period [23]. Economic loss in Guangzhou from materials corroded by acid deposition amounted to 120 million yuan in 2001 [24]. Through empirical estimation and Uhlig method calculations [25], about 3 billion yuan of direct economic losses in materials incurred in China due to acid rain damage in 1999 [26]. Atmospheric corrosion on zinc caused annual economic loss to hit 40.61 million yuan in Chongqing, accounting for around 0.1% of GDP of the same period [27].
To learn about the extent of material loss imposed by acid rain currently in 2013, prefecture-level administrative areas are selected as basic units, and estimates on material loss caused by acid deposition are calculated in this study. Furthermore, spatial distribution of economic losses was also analyzed, making it possible to obtain spatial difference and distribution law in various regions, and to offer scientific support for environmental protection departments to strengthen their management of acid rain as well as their control of the emissions of acid-causing air contaminants. Meanwhile, estimation models, methods concerned, and basic data can also provide basic information and reference for the estimates on other losses caused by acid deposition.
2. Methodology
2.1. Material Loss Calculation
The methods to estimate economic loss are derived from Cowell’s [20] estimation and the computational models employed in the China-Norway cooperation program in the 1990s [28]. The main steps are: (1) surveying the material exposure inventory; (2) determining material damage function and the acid rain exposure–material losses response relationship; (3) identifying the critical damage level (CDL) and assessing changes in service life at current pollution levels; and (4) evaluating economic losses based on cost for maintenance or replacement.
Material loss caused by acid deposition on the city level is specifically calculated by the formula below:
where
- is economic losses of material caused by acid rain, unit: yuan.
- is economic losses of material i caused by acid rain, unit: yuan.
- is the unit price of maintenance or replacement of material i at a time, unit: yuan/m2, details could refer to Section 2.4.
- is exposure inventory of material i, unit: m2; The calculation method will be introduced in Section 2.2.
- is service life of material i under contaminated conditions, unit: a. “a” means annum.
- is service life of material i under non-contamination conditions, unit: a.
- is CDL of material i, unit: μm, details on CDL, and are in Section 2.3.
- is corrosion rate of material i under conditions of pollution, unit: μm/a.
- is corrosion rate of material i under conditions of non-pollution, unit: μm/a.
2.2. Survey on Material Exposure Inventory
Material exposure inventory is an important factor for calculating material economic losses caused by acid rain. Workload on the material exposure inventory survey is tremendous, and the pan-exposure–response relationship is not always available for all the outdoor materials. For this reason, in this study, we only consider building materials, which have larger inventories, and are widely used.
Using aerial photos of aircrafts, Stankunas [29] conducted a grid-plot survey in Boston and derived the building material inventory throughout the Boston area. In the 1980s, material inventory parameters surveys were performed in Guangdong and Guangxi provinces [30,31]. In the 1990s, through the grid method, building materials surveys were conducted in Guangzhou by Guangzhou and Norway researchers [32,33]. In 2004, relevant surveys were also conducted in Taiyuan, Shanxi Province under the Sino-Norwegian cooperation project [34].
Currently, the efficiency for building material exposure inventory surveys is largely improved by using remote sensing combined with spot research and verification [35,36]. In Chongqing, research was conducted on differences in per capita material exposure inventory between population in urban areas and population in suburban areas (counties and districts); after determining the material exposure inventory per capita of municipal districts by combining remote sensing images and field surveys, adjustments were made on the material exposure inventory through field sampling and surveying.
This study is conducted in the cities at or above prefecture level. Generally, there are two methods when estimating building materials exposure inventory. One is to use material exposure per unit floor area [24], which is high in accuracy however difficult to estimate due to the lack of existing data on city scale floor area nationwide. The other is to employ building material exposure per capita. In this study, we use building material exposure per capita since the urban population data is relatively easier to obtain.
The material exposure inventory for the cities is calculated as follows:
wherein, is exposure inventory of material i, is per capita building material exposure area of municipal districts, is population of municipal district in city j, is per capita building material exposure area of non-municipal district, and is population of non-municipal district in city j.
In this study, China is divided into the following three regions (Figure 1), the Eastern region (11 provinces and municipalities, including Beijing, Tianjin, Hebei, Liaoning, Shanghai, Jiangsu, Zhejiang, Fujian, Shandong, Guangdong, and Hainan), the Central region (8 provinces, including Shanxi, Jilin, Heilongjiang, Anhui, Jiangxi, Henan, Hubei, and Hunan) and the Western region (12 provinces, autonomous regions, and municipalities: Sichuan, Chongqing, Guizhou, Yunnan, Tibet, Shaanxi, Gansu, Qinghai, Ningxia, Xinjiang, Guangxi, and Inner Mongolia). By making reference to relevant research findings, Guangzhou and Jinan, Shanxi, and Chongqing are selected as building material exposures per capita of the Eastern, Central, and Western regions respectively. In the meantime, results from Li’s research [36] on Chongqing are adopted, and different material exposures per capita for population in urban municipal district and rural areas are considered accordingly. Building material exposures per capita of the three regions are listed in Table 1 (for those without direct statistics, the material exposure inventories per capita are estimated with the proportion of total regional material amount).
Population data for counting up material exposure inventories of urban buildings was obtained from the China City Statistical Yearbook 2014 [37]. Population is acquired by querying the 2013 statistical bulletins on economic and social developments of the areas. For certain autonomous prefectures, leagues, and other prefecture-level administrative, units were not contained in the yearbook.
2.3. Exposure–Response Relationship (Dose–Response Relationship) and CDL
Acid rain accelerates the corrosion of materials, making its protective coating ineffective and reducing its useful life or service life. Since the early 20th century, researchers have successively carried out experiments on materials exposed to a variety of atmospheric environments, accumulating a good deal of corrosion data [38,39,40]. International collaborative research is also quite active in this aspect, including the Europe–North America Test Station project initiated by the UNECE and the exposure testing program in East Asia [41,42,43]. Domestic and foreign researchers have made significant achievements in their research on the impacts of acid rain on building materials [44,45,46], metal materials [47,48], and organic coating [49,50]. Chinese researchers have also undertaken laboratory simulation tests and field exposure experiments on various materials to analyze impacts imposed by acid rain and to obtain the corrosion dose–response relationship of representative building materials, which is more suitable for Chinese actualities [51,52,53,54,55].
In the Guideline for Chinese Environmental and Economic Accounting, researchers represented by Yu et al. [56] established a set of feasible material exposure–response relationship and estimated CDL of materials according to material service life in relevant research., These accomplishments were built on the results of key scientific research projects on acid rain during the 7th Five-Year-Plan period, and are better suited to Chinese reality and taking into account the dose–response relationship recommended by the ECON report [28,57] based on European studies, Table 2 lists the set of exposure–response relationship and CDL, which were also employed in the article. In this study, to calculate, SO2 concentration and pH value are set 0 and 5.6 under non-pollution conditions, respectively. is calculated according to Equation (4), and is estimated by precipitation pH and SO2 concentration in various cities in 2013 respectively (see Section 2.5).
2.4. Estimates on Material Price
For the price of materials used herein, refer to the price of the materials employed by Guo et al. [58] in his estimation of the loss of materials due to acid deposition in Guangdong Province in 2002. Table 3 lists the reference price of all kinds of materials in 2013 which have been obtained after price correction (retail price index by category of commodities).
2.5. Data Sources
Data of precipitation pH value and SO2 concentration come from the China National Environmental Monitoring Network. The data on acid rain takes annual average precipitation pH value and SO2 concentration takes annual concentration of urban sulfur dioxide. The data of precipitation pH value SO2 concentration covers 338 Chinese municipalities and prefecture-level cities, as well as 1436 air quality monitoring stations. Nearest urban annual averages are used for cities with no acid rain or sulfur dioxide monitoring data.
3. Results
3.1. Pollution of Acid Rain and Sulfur Dioxide
According to monitoring results on precipitation pH value and annual average, SO2 concentration from the China National Environmental Monitoring Network in 2013, spatial characterization of acid deposition and SO2 is presented in Figure 2 and Figure 3 separately. Both spatial analysis and characterization are completed in the ArcGIS 10.0 software (similarly hereafter). With a precipitation pH value lower than 5.6 as basis of determination, a lower than 5.0 pH value marks relatively serious acid rain and a value of less than 4.5 indicates serious acid rain [13].
The results show that acid deposition in China is mainly distributed along the middle and lower reaches of the Yangtze River and its southern areas, including most parts of Jiangxi, Fujian, Hunan, and Chongqing, as well as the Yangtze River delta, the Pearl River delta, and southeastern Sichuan. In addition, Beijing, Dalian, and Dandong were hit by acid deposition in 2013. The lowest pH value of 4.01 appeared in Zhuzhou, and precipitation acidity in eight cities—namely, Zhuzhou, Changsha, Panzhihua, Quzhou, Pingxiang, Luzhou, Jinhua, Ji’an, and Taizhou—were less than 4.5, indicating the presence of serious acid rain in these cities.
According to the SO2 Grade II limits of National Ambient Air Quality Standard (no more than 0.060 mg/m3), SO2 polluted areas are mostly concentrated in the Beijing–Tianjin–Hebei region, adjacent to the mid-west areas of Shandong Province, Eastern Shanxi Province, Northern Henan Province, and southern Inner Mongolia. SO2 concentrations of Panzhihua, Anshun, Jinchang, Yinchuan, Huangshi, Tongling, and Shenyang also exceeded the required level. Zibo has the highest annual average SO2 concentration of about 0.133 mg/m3. Annual average SO2 concentrations are more than 0.1 mg/m3 in six cities, named Zibo, Tangshan, Xingtai, Jinzhong, Laiwu, and Shijiazhuang.
3.2. Estimations on Material Inventory
According to statistics on the number of populations in urban municipal districts and rural areas, calculations are performed on material exposure inventories per capita in municipal districts and rural areas in the Eastern, Central, and Western regions. Calculations are also made to derive material exposure inventories for all sorts of materials and total materials exposed (Figure 4), which was introduced in 2.2. The results revealed that the total building material exposure inventory in China is 109.07 billion m2, which is equivalent to approximately 81 m2 in per capita terms. The exposure inventories of various materials are shown in Table 4.
Overall, material exposure inventories in China show gradually decreasing trends from the east to the west, spatially.
3.3. Estimates on Losses Incurred by Acid Deposition
Estimation is conducted on the loss of materials incurred by acid deposition in the cities and the total loss of materials nationwide (Figure 5).
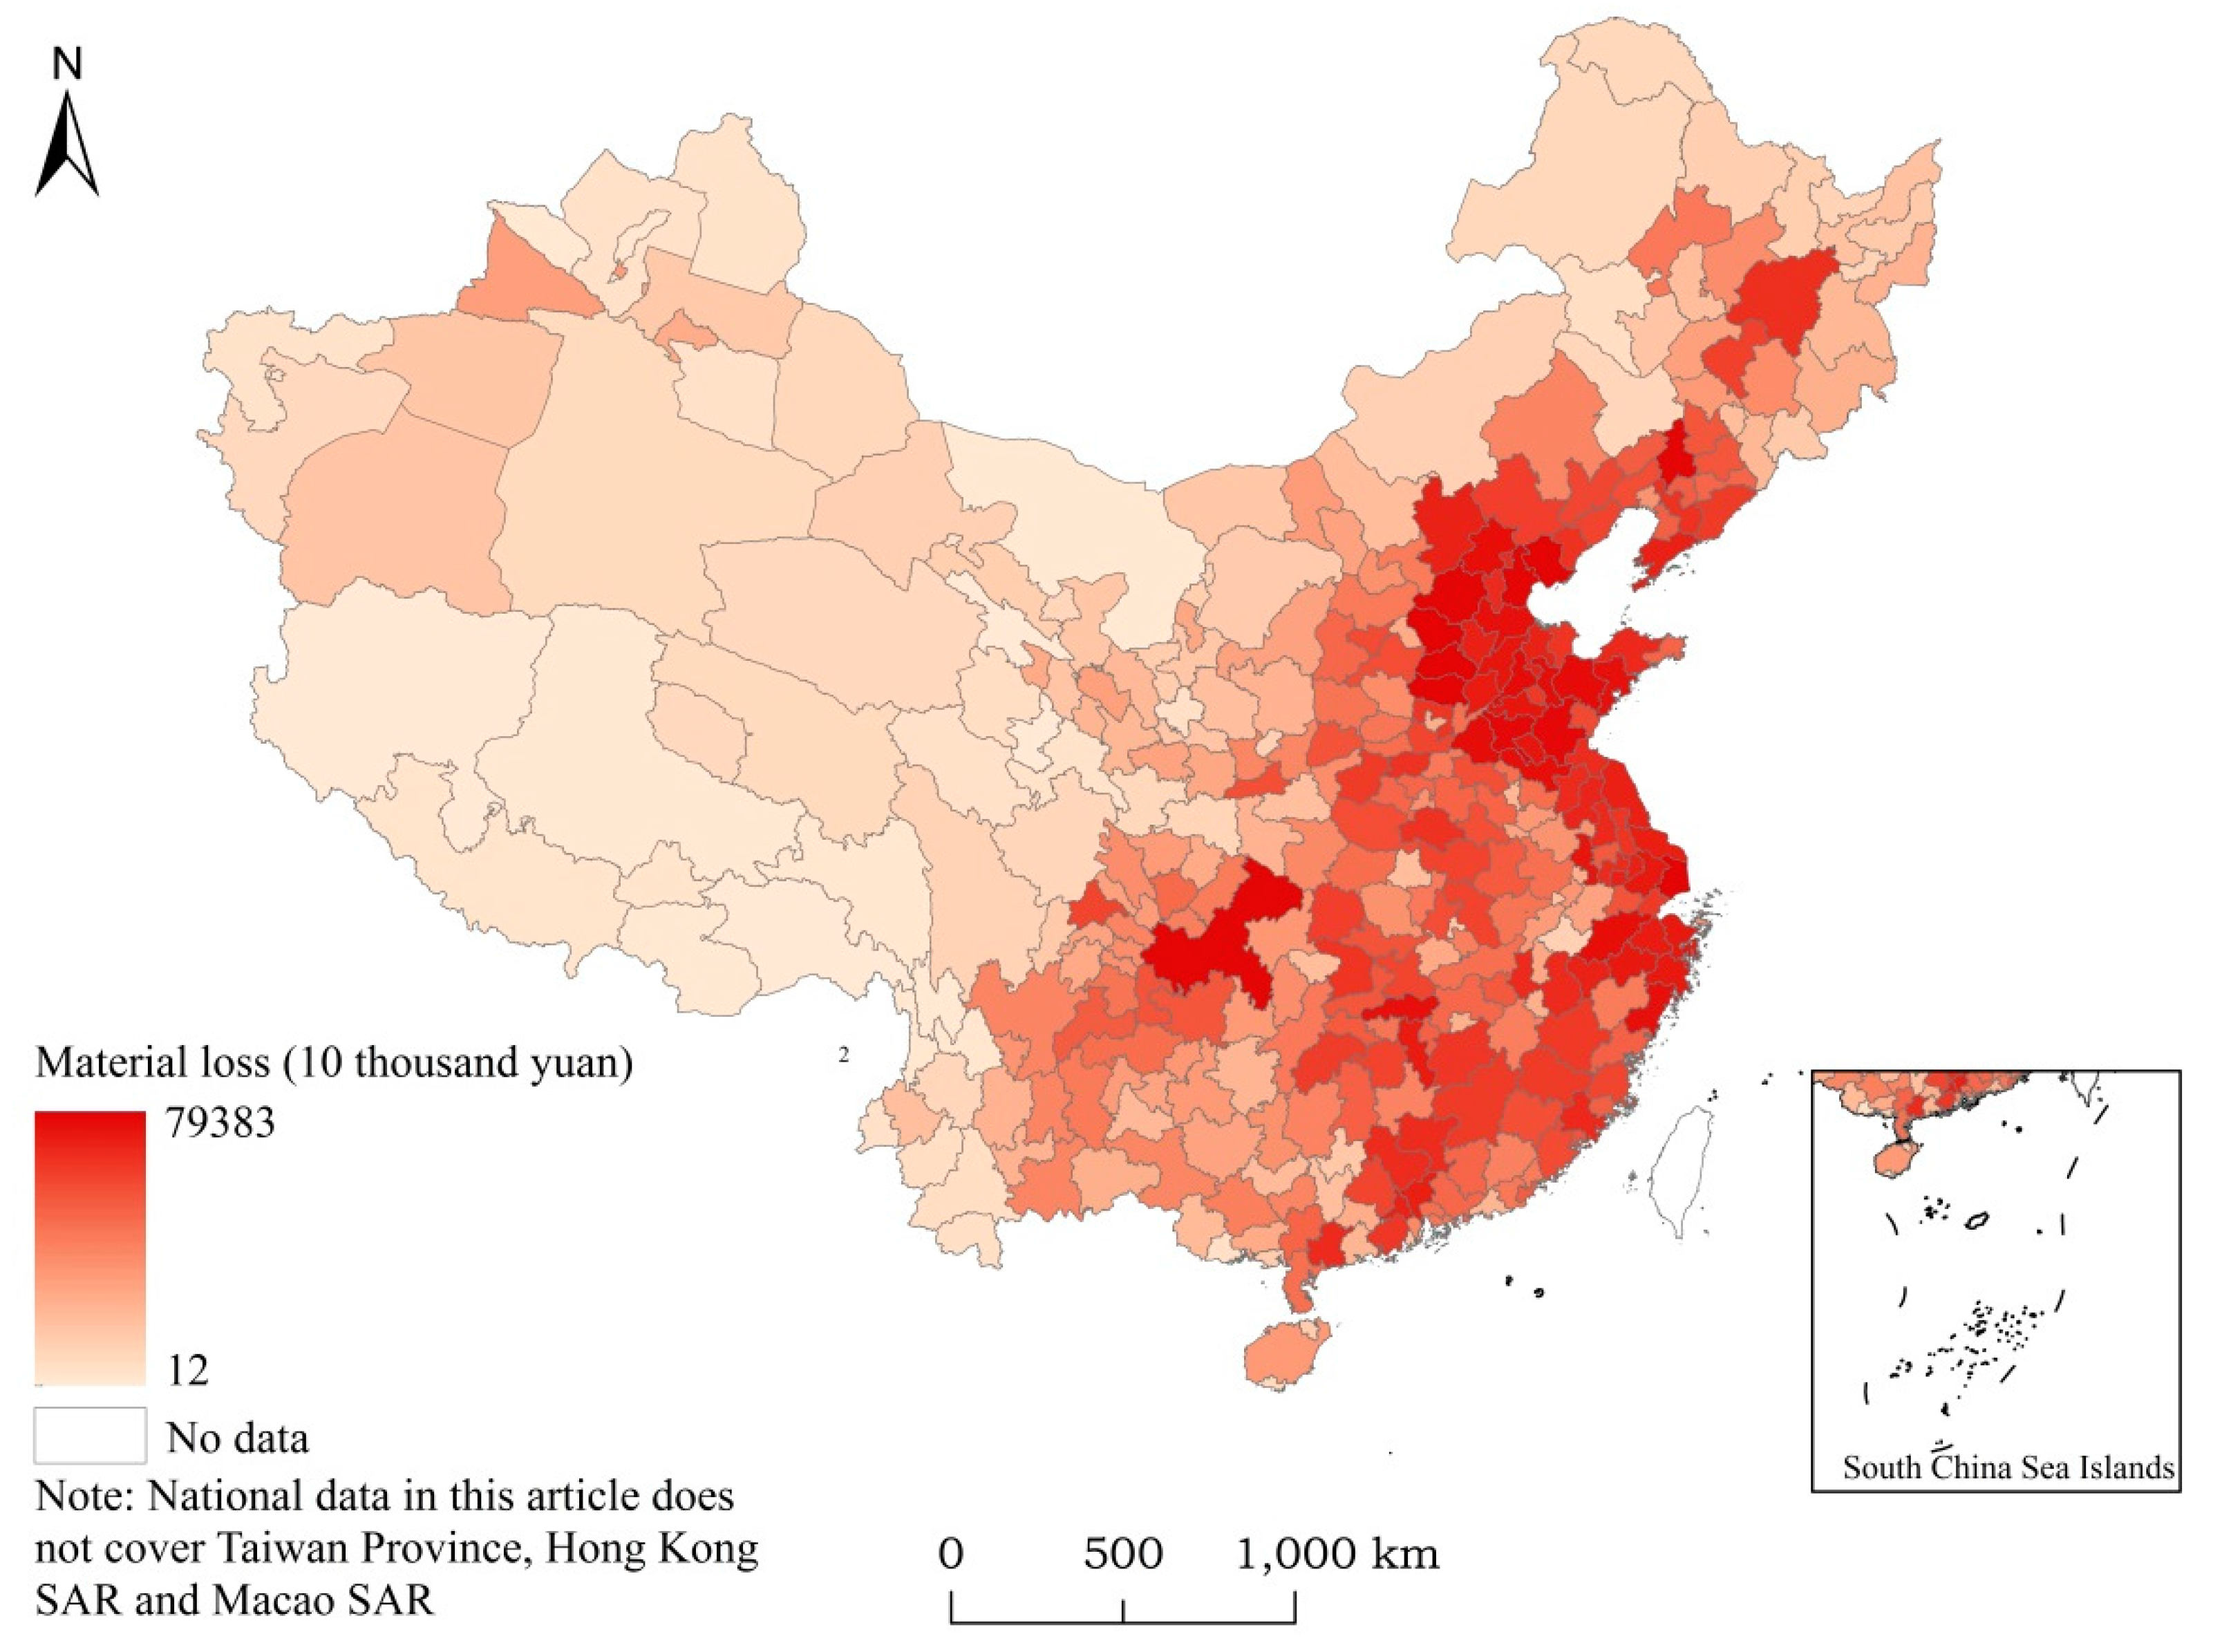
In 2013, material loss caused by acid deposition in China totaled about 32.165 billion yuan, accounting for 0.057% of China’s GDP [59] that year and 3.4% of the total investment in environmental pollution control. As the materials accounted for in this study are relatively representative, yet not all of the materials, the results should be a little lower than the actual values. In other words, material loss caused by acid deposition in China cannot be ignored and more attention should be paid.
The loss value shows a decrease from east to west in its distribution patterns. Geographically, major areas with larger material loss caused by acid deposition are distributed in the Beijing–Tianjin–Hebei region with more severe SO2 pollution and its surrounding areas, and the south of the Yangtze River, east of Qinghai–Tibet Plateau area with more serious acid deposition.
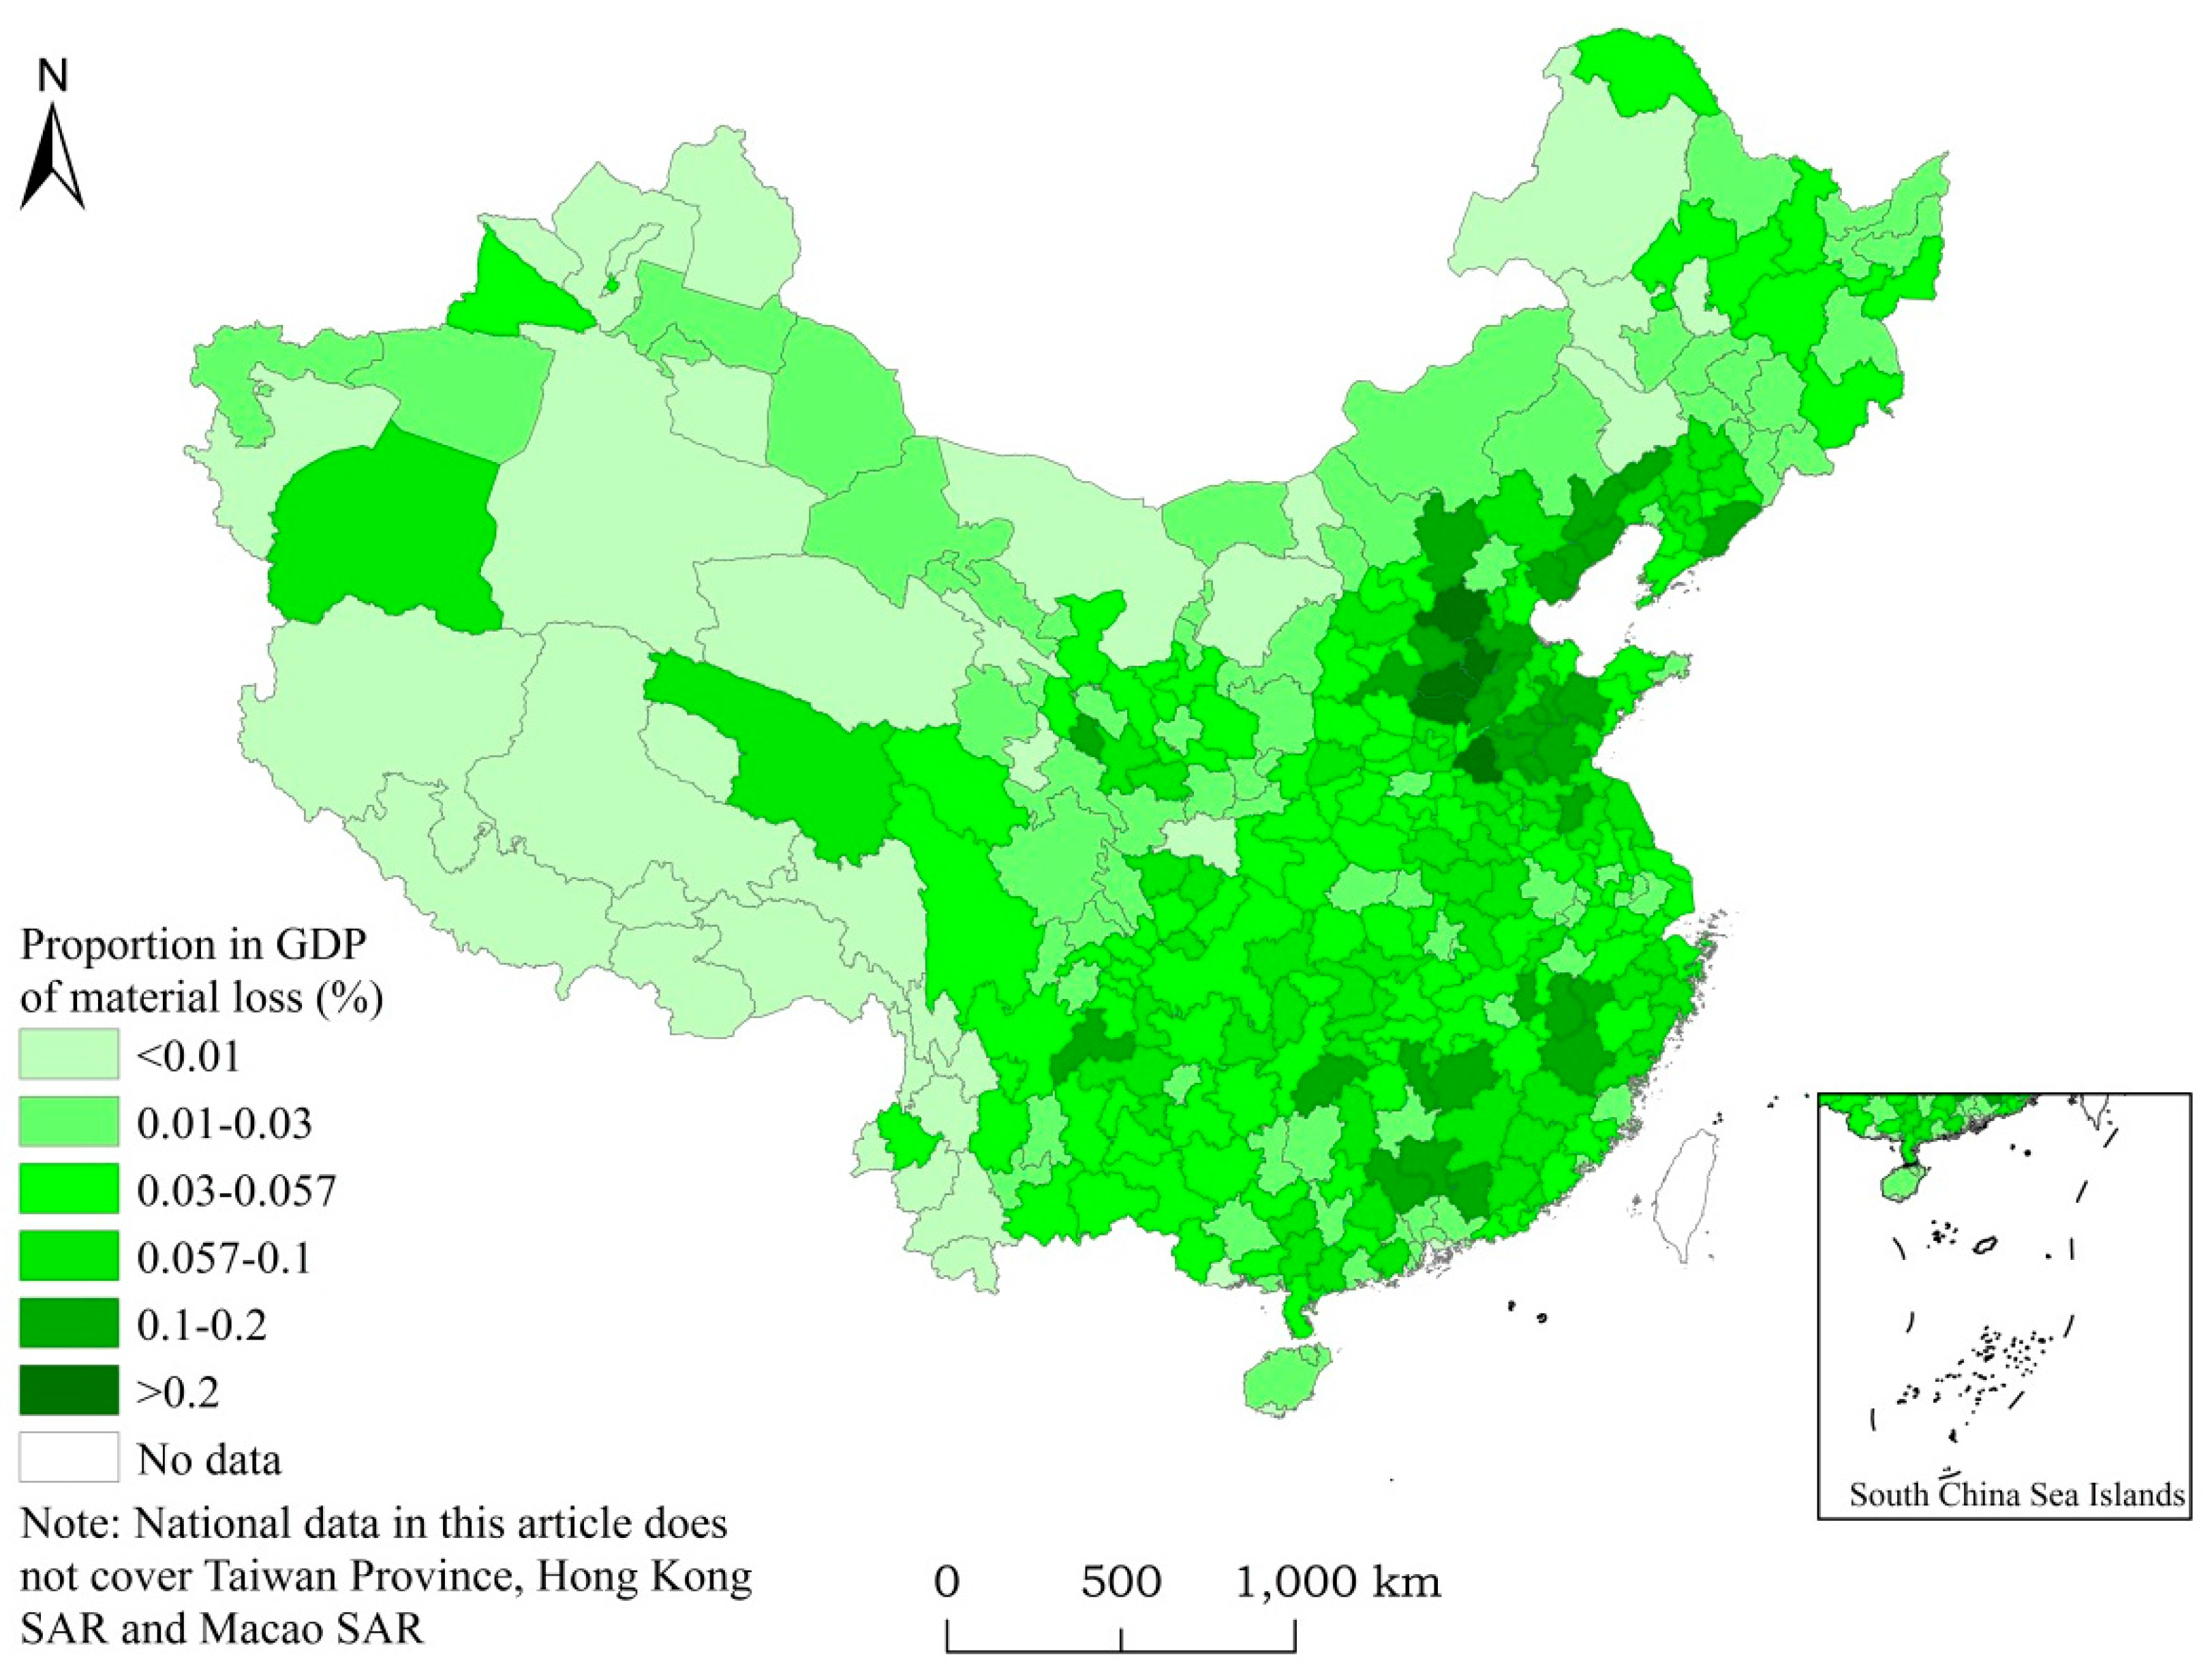
Regarding the spatial distribution of proportions in GDP of material loss incurred by acid deposition in Chinese cities (Figure 6), the areas with higher proportions of material loss basically coincide with regions of SO2 and acid deposition. Loss ratios are lower than national average (0.057%) in 70.6% of the cities, and the lowest proportion appeared in Karamay, with less than 1/100,000. Among the cities with a loss ratio higher than the national average (accounting for 29.4%), Xingtai, Handan, Heze, Hengshui, and Baoding are higher than 0.2% and Xingtai City even reached 0.38%.
4. Discussion and Conclusions
In this study, based on the monitoring results of precipitation and ambient air pollutant (SO2) from the National Environmental Monitoring Network and references to previous studies, a set of assessment models, which is appropriate to China’s material loss incurred by acid deposition as well as functions of the dose–response relationship, is selected. On the basis of existing limited research findings, parameters for building material exposure inventory per capita are derived and are distinguished from those of the Eastern, Central, and Western regions—as well as those of urban and rural areas—and yet can be applied to cities across China. Then, using the unit price of material maintenance or replacement corrected by prices of commodities, overall estimation is performed on material loss resulting from acid deposition in China.
The results show that material loss caused by acid deposition in China reached approximately 32,165 billion yuan in 2013, constituting 0.057% of the Chinese GDP and 3.4% of the total investment in environmental pollution control in the same year. Earlier studies have shown that economic loss from corroded materials due to acid rain in two southwestern provinces (Sichuan and Guizhou) approximately took 0.23% of their GDP in 1987, economic loss from materials corroded by acid deposition in Guangdong and Guangxi Provinces was estimated to occupy 1.0% and 0.9% of GDP respectively, and atmospheric corrosion on zinc caused annual economic loss to hit 0.1% of GDP in Chongqing. Considering the degrees of acid rain pollution in these areas are higher than others, the results from this study—material loss caused by acid deposition in China constituting 0.057% of the Chinese GDP—exhibits a lower value than the previously mentioned results. However, the conclusions are still acceptable.
It should be noted that the proportion of material loss incurred by acid deposition among the GNP (Gross National Product) for a city can be used to measure how green the city’s GDP is. A larger proportion indicates that such GDP is gained at the expense of environmental loss to some extent. Moreover, material loss caused by acid deposition is merely one aspect among which environmental pollution leads to economic loss of the ecosystem.
This paper evaluates material loss caused by acid deposition in China at the city level for the first time, obtaining data and core ideas based on demographic, economic, and acid-deposition values of the evaluated cities. The results are significant for further research on other losses caused by acid deposition. Meanwhile, the methods of estimation, patterns, functions, and associated parameters used in the article can also provide references for studies on material loss caused by acid deposition at a national scale. Furthermore, with the support of longtime monitoring data, it is also possible to analyze spatiotemporal trends and changes on pollution-caused losses.
Although the article tries its utmost best to give an overall and objective assessment on the economic loss of materials caused by acid deposition, the present study still has room for improvement. On the one hand, the limited number of cases pertaining to current surveys of city-level material exposure inventory and are not representative enough. Though continued development of remote sensing technology helped in the surveys of building material exposure inventory to a great extent, a lack of research still exists concerning the relevant cases that could serve as underlying data, and the types of materials are also difficult to fully cover. As a consequence, the estimated results are lower in value than the actual ones. On the other hand, in terms of price of material maintenance or replacement, due to the lack of sufficiently authoritative price data, human subjectivity is largely involved, making it difficult to enhance the accuracy of the research method.
Acknowledgments
The present study is supported by the National Science and Technology Support Program (No. 2013BAC03B05) and the National Natural Science Foundation of China (No. 41401101 & No. 41371118).
Author Contributions
Conceived and designed the paper: Gaodi Xie, Yinjun Zhang. Collected, analyzed data, wrote the paper: Yinjun Zhang. Improved language: Fengying Zhang. Partial data collection and processing: Qian Li.
Conflicts of Interest
The authors declare that they have no competing interests.
References and Notes
- Smith, A.R. Air and Rain: The Beginnings of a Chemical Climatology; Longmans, Green, and Co.: London, UK, 1872. [Google Scholar]
- Zhang, X.M.; Chai, F.H.; Wang, S.L.; Sun, X.Z.; Han, M. Research progress of acid precipitation in China. Res. Environ. Sci. 2010, 23, 527–532. (In Chinese) [Google Scholar]
- Ottar, B. Organization of long range transport of air pollution monitoring in Europe. In Proceedings of the First International Symposium on Acid Precipitation and the Forest Ecosystem, Columbus, OH, USA, 12–15 May 1975; Dochinger, L.S., Seliga, T.A., Eds.; Springer: Philadelphia, PA, USA, 1976; pp. 105–117. [Google Scholar]
- Burns, D.A.; Aherne, J.; Gay, D.A.; Lehmann, C.M.B. Acid Rain and its Environmental Effects: Recent Scientific Advances. Atmos. Environ. 2016, 146, 1–4. [Google Scholar] [CrossRef]
- Vet, R.; Artz, R.S.; Carou, S.; Shaw, M.; Ro, C.U.; Aas, W.; Baker, A.; Bowersox, V.C.; Dentener, F.; Galy-Lacaux, C.; et al. A global assessment of precipitation chemistry and deposition of sulfur, nitrogen, sea salt, base cations, organic acids, acidity and pH, and phosphorus. Atmos. Environ. 2014, 93, 3–100. [Google Scholar] [CrossRef]
- Tang, X.Y.; Zhang, Y.H.; Shao, M. Atmospheric Environmental Chemistry; Higher Education Press: Beijing, China, 2006; p. 67. (In Chinese) [Google Scholar]
- Zhao, D.W.; Xiong, J.L.; Xu, Y.; Chan, W.H. Acid rain in southwestern China. Atmos. Environ. 1988, 22, 349–358. [Google Scholar]
- Li, Z.J.; Song, L.L.; Ma, J.Z.; Li, Y.G. The characteristics changes of pH and EC of atmospheric precipitation and analysis on the source of acid rain in the source area of the Yangtze River from 2010 to 2015. Atmos. Environ. 2017. [Google Scholar] [CrossRef]
- Wang, T.J.; Jin, L.S.; Li, Z.K.; Lam, K.S. A modeling study on acid rain and recommended emission control strategies in China. Atmos. Environ. 2000, 34, 4467–4477. [Google Scholar] [CrossRef]
- Luo, X.S.; Pan, Y.P.; Goulding, K.; Zhang, L.; Liu, X.J.; Zhang, F.S. Spatial and seasonal variations of atmospheric sulfur concentrations and dry deposition at 16 rural and suburban sites in China. Atmos. Environ. 2016, 146, 79–89. [Google Scholar] [CrossRef]
- Chen, F.; Chai, F.H. Control strategy of acid deposition in China. Res. Environ. Sci. 1997, 10, 27–31. (In Chinese) [Google Scholar]
- He, J.L.; Chen, H.W.; Hu, X.H.; Chen, K. On the influent factors for the formation of severe acid rain band in Jiangxi Province. China Environ. Sci. 2000, 20, 477–480. (In Chinese) [Google Scholar]
- Xie, S.Y.; Wang, R.B.; Zheng, H.H. Analysis on the acid rain from 2005 to 2011 in China. Environ. Monit. Forewarn. 2012, 4, 33–37. (In Chinese) [Google Scholar]
- Ministry of Environmental Protection, The People’s Republic of China. 2013 Report on the State of the Environment in China; Ministry of Environmental Protection: Beijing, China, 2014; p. 24.
- Fink, F.W.; Buttner, F.H.; Boyd, W.K. Technical-Economic Evaluation of Air Pollution Corrosion Costs on Metals in the U.S.; Batelle Memorial Institute: Columbus, OH, USA, 1971. [Google Scholar]
- OCED. Managing the Sulphur Problem—Control Costs and Benefits; OECD Environment Directorate: Paris, OH, USA, 1981. [Google Scholar]
- Lipfert, F.W. Effects of acidic deposition on the atmospheric deterioration of materials. Mater. Perform. 1987, 26, 12–19. [Google Scholar]
- ECOTEC. Identification and Assessment of Materials Damage to Buildings and Monuments by Air Pollution; ECOTEC Research and Consulting Ltd.: Birmingham, UK, 1990. [Google Scholar]
- Kucera, V.; Henriksen, J.; Knotkova, D.; Sjöström, Ch. Model for calculations of corrosion cost caused by air pollution and its application in three cities. In Progress in the Understanding and Prevention of Corrosion; Institute of Materials: London, UK, 1993; Volume 1, pp. 24–32. [Google Scholar]
- Cowell, D.; Apsimon, H. Estimating the cost of damage to buildings by acidifying atmospheric pollution in Europe. Atmos. Environ. 1996, 30, 2959–2968. [Google Scholar] [CrossRef]
- Rabl, A. Air pollution and buildings: An estimation of damage costs in France. Environ. Impact Assess. Rev. 1999, 19, 361–385. [Google Scholar] [CrossRef]
- Yin, Y.D. The estimation on the corrosion loss due to the acidic rain in the two provinces of southwestern China. Corros. Sci. Prot. Technol. 1991, 3, 37–43. (In Chinese) [Google Scholar]
- Yang, Z.M.; Wang, W.X.; Zhang, W.H. Study on economic estimates of acid deposition damage to materials. Shanghai Environ. Sci. 1996, 15, 14–17. (In Chinese) [Google Scholar]
- Guo, J.; Wang, W.X.; Haireti, T. Economic estimates of acid deposition damage on materials in Guangzhou. Urban Environ. Urban Ecol. 2004, 17, 15–17. (In Chinese) [Google Scholar]
- Corrosion and Protection Committee of Japan. Corrosion loss in the chemical plants of Chugoku Shikoku District of Japan. Mater. Environ. 2000, 49, 394–403. [Google Scholar]
- Zhang, X.Y.; Han, E.H.; Li, H.X. Estimation of corrosion losses by the acidic rain in China. J. Chin. Soc. Corros. Prot. 2002, 22, 316–319. (In Chinese) [Google Scholar]
- Ye, T. Study on Effects of Air Pollution on Corrosion of Materials in Chongqing; Chongqing University: Chongqing, China, 2005. (In Chinese) [Google Scholar]
- Henriksen, J.F.; Tian, K. Mapping Air Pollution Effects on Materials Including Stock at Risk in Guangzhou, China; Norwegian Institute for Air Research: Kjeller, Norway, 1999. [Google Scholar]
- Stankunas, A.R.; Unites, D.F.; McCarthy, E.F. Air-Pollution Damage to Man-Made Materials: Physical and Economic Estimates. Final Report; TRC Environmental Consultants, Inc.: East Hartford, CT, USA, 1983; pp. 2–84. [Google Scholar]
- Institute of Atmospheric Environment, Chinese Research Academy of Environmental Sciences. The study of the acid rain damage on materials in South China. The 7th Five Years Programs for Science and Technology Development of China, (75)58-05-02-05, Research Report. 1990; unpublished. (In Chinese) [Google Scholar]
- Guangzhou Environmental Monitoring Center. The study of the acid rain damage on materials in Guangzhou. The 7th Five Years Programs for Science and Technology Development of China, (75)58-05-02-05, Research Report. 1990; unpublished. (In Chinese) [Google Scholar]
- Tian, K.; He, L.W.; Krigsvoll, G. Building Materials Pollution Cost in Guangzhou; NORAD Project CHN 013, Technical Report B3; Norwegian Institute for Air Research(NILU): Kjeller, Norway, 1999. [Google Scholar]
- He, L.W. Study on Building Materials Damage Caused by Air Pollution & Its Estimation of Economic Loss in Guangzhou; Zhongshan University: Guangzhou, China, 2000. (In Chinese) [Google Scholar]
- Shanxi Environmental Information Center/Norwegian Institute for Air Pollution. Master Plan against Air Pollution in Shanxi Province; Norwegian Institute for Air Pollution: Kjeller, Norway, 2004. [Google Scholar]
- Liu, X.H.; Wang, C.; Zhu, H.M.; Gong, Y.L.; Yin, J.F. The study of the RS investigation method of urban exposure Materials inventory. In China Society for Environmental Sciences Academic Annual Conference Proceedings; China Environmental Science Press: Chongqing, China, 2008; pp. 1236–1239. (In Chinese) [Google Scholar]
- Li, X.Y. Study on Economic Loss Accounting of Chongqing’s Building Material Caused by Air Pollution; Chongqing University: Chongqing, China, 2007. (In Chinese) [Google Scholar]
- National Bureau of Rural Social and Economic Investigation Division. China City Statistical Yearbook; China Statistics Press: Beijing, China, 2014.
- Larrabee, C.P.; Coburn, S.K. The atmospheric corrosion of steels as influenced by changes in chemical composition. In Proceedings of the First International Congress on Metallic Corrosion, London, UK, 10–15 April 1961; Butterworths: London, UK, 1962. [Google Scholar]
- Chandler, K.A.; Kilculen, M.B. Atmospheric Corrosion of carbon steel. Br. Corros. J. 1974, 5, 24–28. [Google Scholar] [CrossRef]
- Ailor, W.H. Atmospheric Corrosion; John Wiley and Sons: New York, NY, USA, 1982. [Google Scholar]
- Roberge, P.R.; Klassen, R.D.; Haberecht, P.W. Atmospheric corrosivity modeling-a review. Mater. Des. 2002, 23, 321–330. [Google Scholar] [CrossRef]
- Kitase, M.; Hatakeyama, S.; Mizoguchi, T.; Maeda, Y. Regional characteristics of copper corrosion components in East Asia. Water Air Soil Pollut. 2001, 130, 1463–1468. [Google Scholar] [CrossRef]
- Maeda, Y.; Morioka, J.; Tsujino, Y.; Satoh, Y.; Zhang, X.D.; Mizoguchi, T.; Hatakeyama, S. Material damage caused by acidic air pollution in East Asia. Water Air Soil Pollut. 2001, 130, 141–150. [Google Scholar] [CrossRef]
- Hutchinson, A.J.; Johnson, J.B.; Thompson, G.E.; Wood, G.C.; Sage, P.W.; Cooke, M.J. Stone degradation due to wet deposition of pollutants. Corros. Sci. 1993, 34, 1881–1898. [Google Scholar] [CrossRef]
- Kanazu, T.; Matsumura, T.; Nishiuchi, T.; Yamamoto, T. Effect of simulated acid rain on deterioration of concrete. Water Air Soil Pollut. 2001, 130, 1481–1486. [Google Scholar] [CrossRef]
- Johnson, J.B.; Montgomery, M.; Thompson, G.E.; Wood, G.C.; Sage, P.W.; Cooke, M.J. The influence of combustion-derived pollutants on limestone deterioration: 2. The wet deposition of pollutant species. Corros. Sci. 1996, 38, 267–278. [Google Scholar] [CrossRef]
- Wallinder, I.O.; Verbiest, P.; He, W.; Leygraf, C. The influence of patina age and pollutant levels on the runoff rate of zinc from roofing materials. Corros. Sci. 1998, 40, 1977–1982. [Google Scholar]
- Verbiest, P.; Janssen, C.R.; Wallinder, I.O. Environmental Effects of Zinc runoff from Phosphated zinc Sheets used for Building Application. In Proceedings of the 14th International Corrosion Congress, Cape Town, South Africa, 26 September–1 October 1999. [Google Scholar]
- Azuma, H.; Takeichi, A.; Tachi, K. Advances in Corrosion Protection by Organic Coatings III; Electrochemical Society Inc.: Pennington, NJ, USA, 1997; p. 212. [Google Scholar]
- Tsujino, Y.; Satoh, Y.; Kuramoto, N.; Maeda, Y. Effect of acid deposition on urushi lacquer in East Asia. Water Air Soil Pollut. 2001, 130, 1487–1492. [Google Scholar] [CrossRef]
- Wang, Z.Y.; Zheng, Y.P. The corrosion influence of metals by acid rain in southwest China. Total Corros. Control 1997, 11, 45–48. (In Chinese) [Google Scholar]
- Wang, Z.Y. The corrosion influence of painted steel by acid rain. Total Corros. Control 1997, 11, 22–24. (In Chinese) [Google Scholar]
- Wang, Z.Y.; Yu, G.C.; Zheng, Y.P. Investigation on interrelation of accelerated corrosion testing and atmospheric exposure of zinc. J. Chin. Soc. Corros. Prot. 1999, 19, 239–244. (In Chinese) [Google Scholar]
- Sun, Z.H.; Li, J.G.; Li, M.Z. Future of accelerated atmospheric corrosion testing of metal materials. J. Mater. Eng. 1995, 12, 41–42. (In Chinese) [Google Scholar]
- Wang, Z.Y.; Yu, G.C.; Han, W. Atmospheric corrosion performance of zinc at several selected test sits in China. Corros. Sci. Prot. Technol. 2003, 15, 191–195. (In Chinese) [Google Scholar]
- Yu, F.; Wang, J.N.; Cao, D.; Jiang, H.Q. Guideline for Chinese Environmental and Economic Accounting; China Environmental Science Press: Beijing, China, 2009. (In Chinese) [Google Scholar]
- ECON. An Environmental Cost Model; ECON Report No. 16/2000; ECON Centre for Economic Analysis: Oslo, Norway, 2000. [Google Scholar]
- Guo, X.M.; Yu, F.; Zhao, Y. Pollution Damage Cost Assessment: Theories and Methodologies; Environmental Science Press: Beijing, China, 2009. (In Chinese) [Google Scholar]
- National Bureau of Statistics of China. 2014 China Statistical Yearbook; China Statistics Press: Beijing, China, 2014.
Figure 1.
Division of the Eastern, Central, and Western regions.
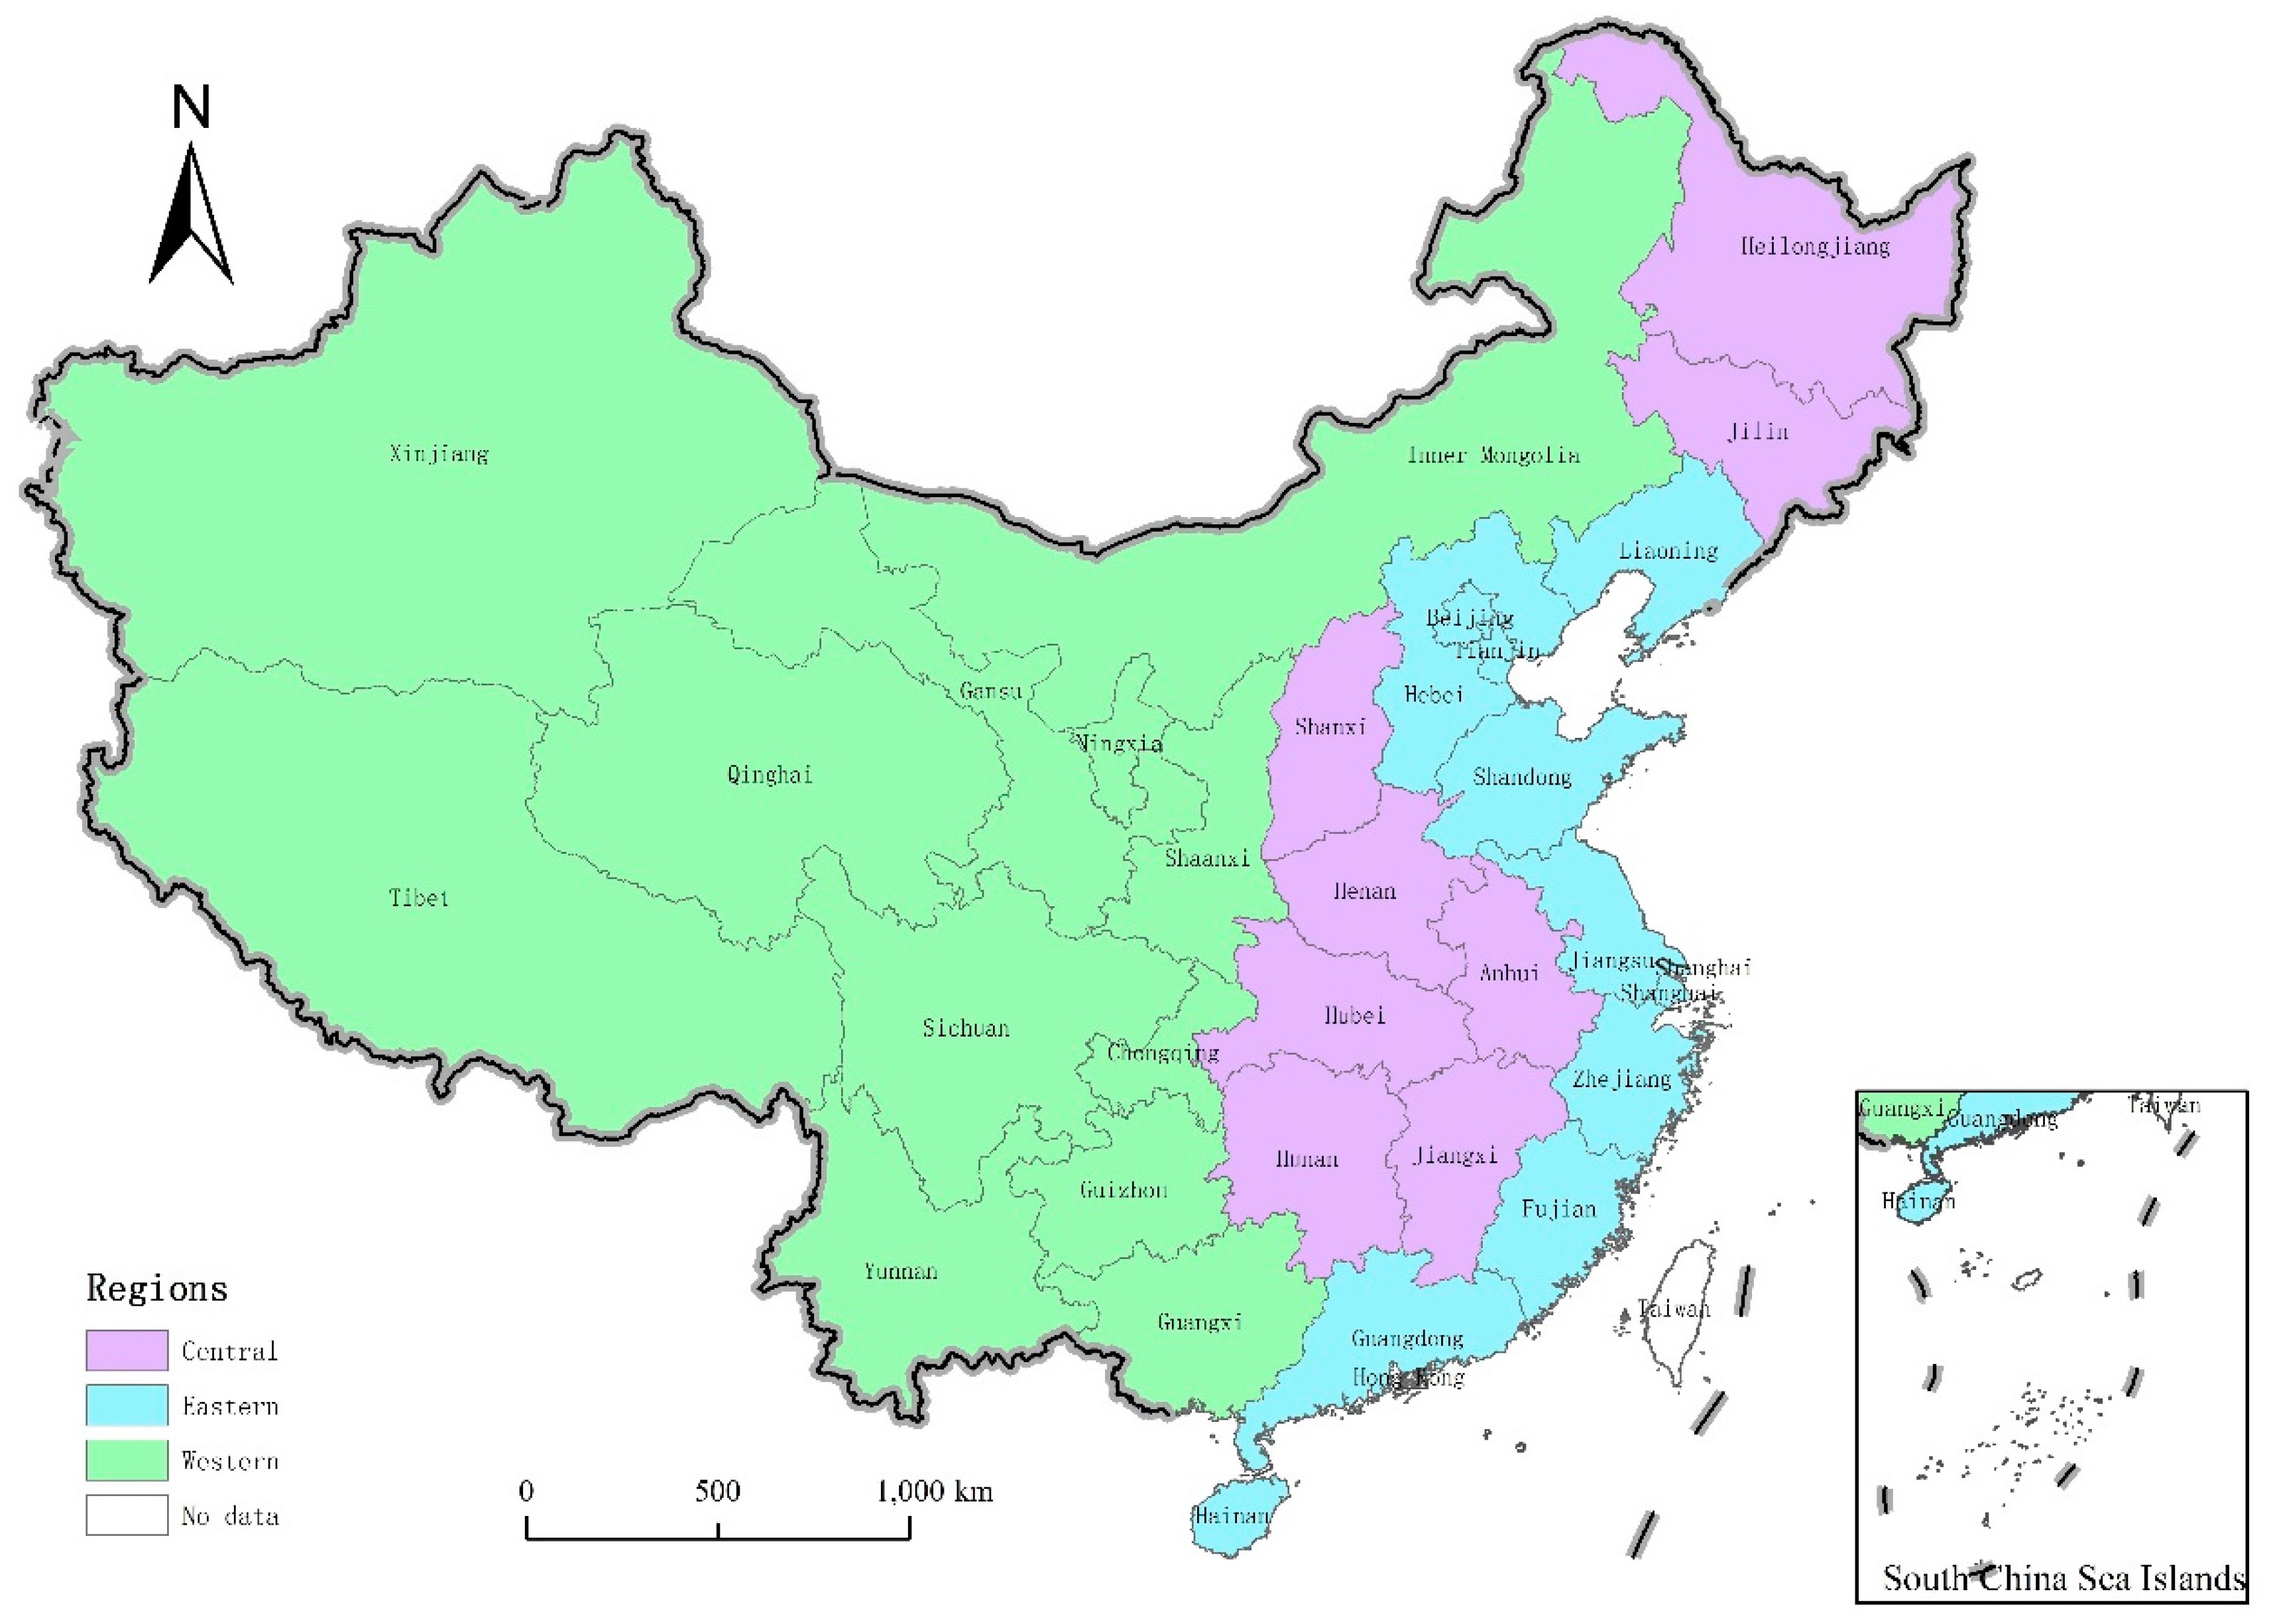
Figure 2.
Spatial distribution of acid deposition on city-level in China in 2013.
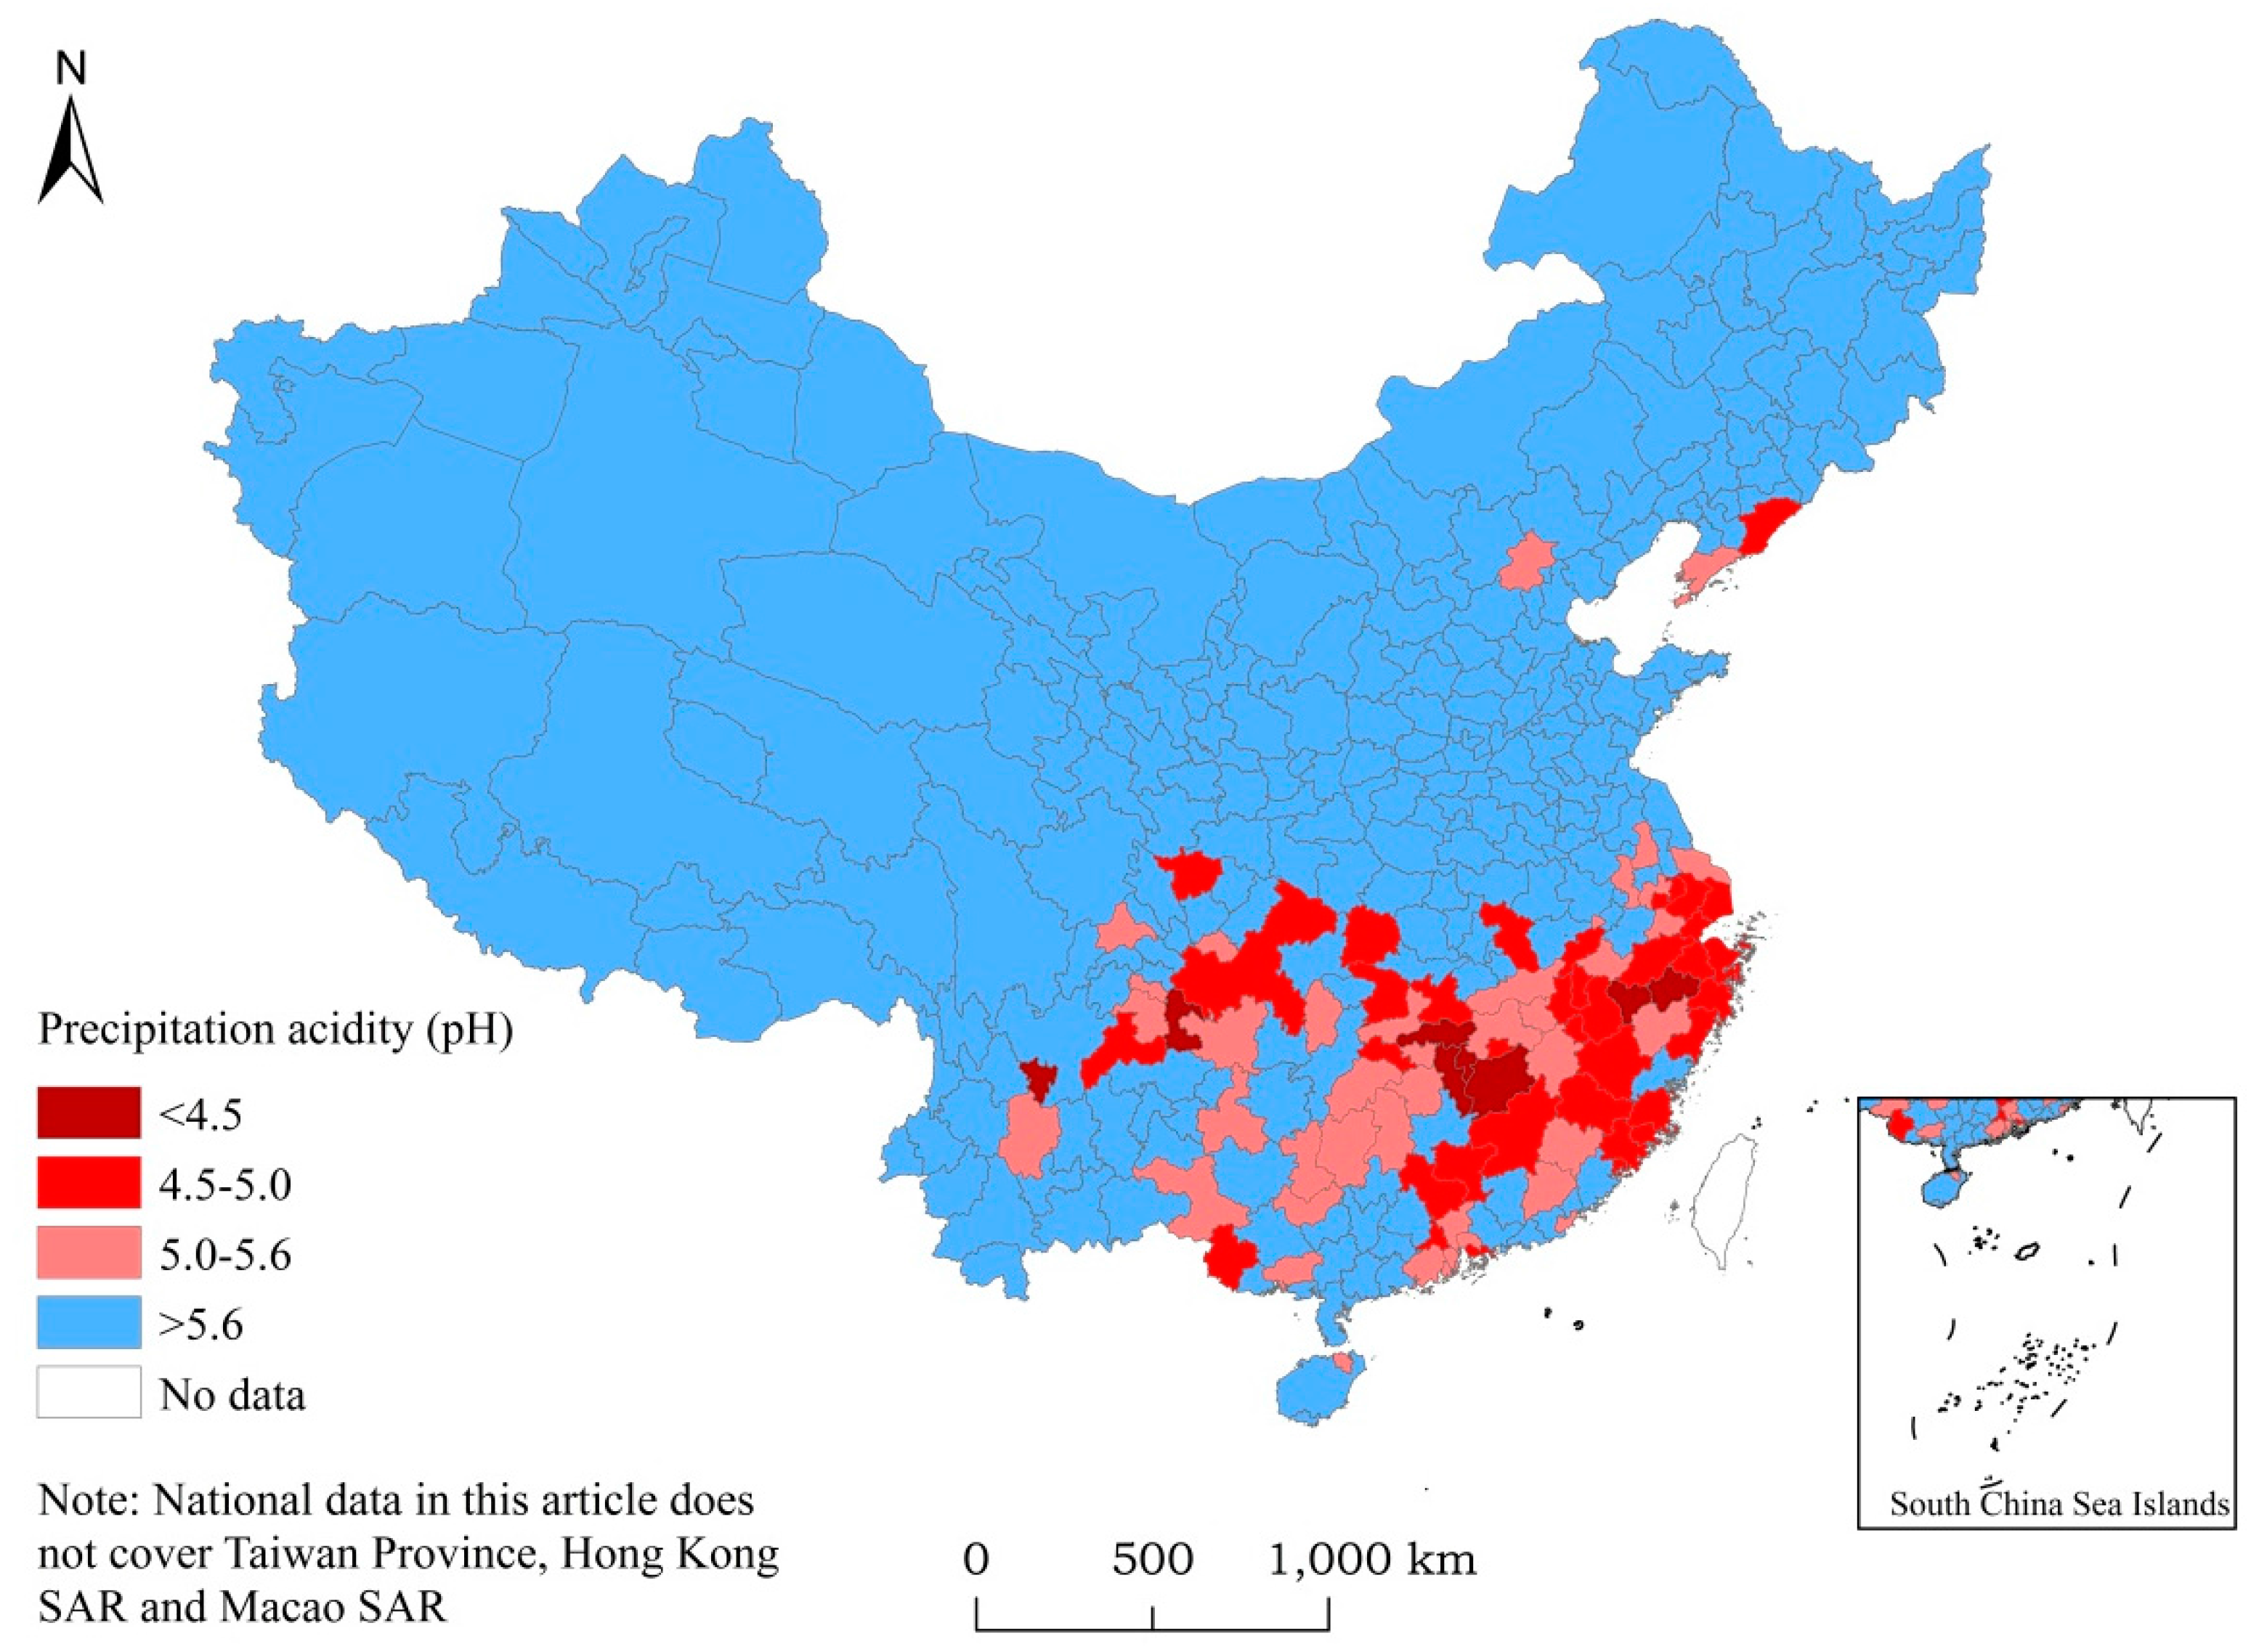
Figure 3.
Spatial distributions of annual average SO2 concentrations on city-level in China in 2013.
Figure 3.
Spatial distributions of annual average SO2 concentrations on city-level in China in 2013.
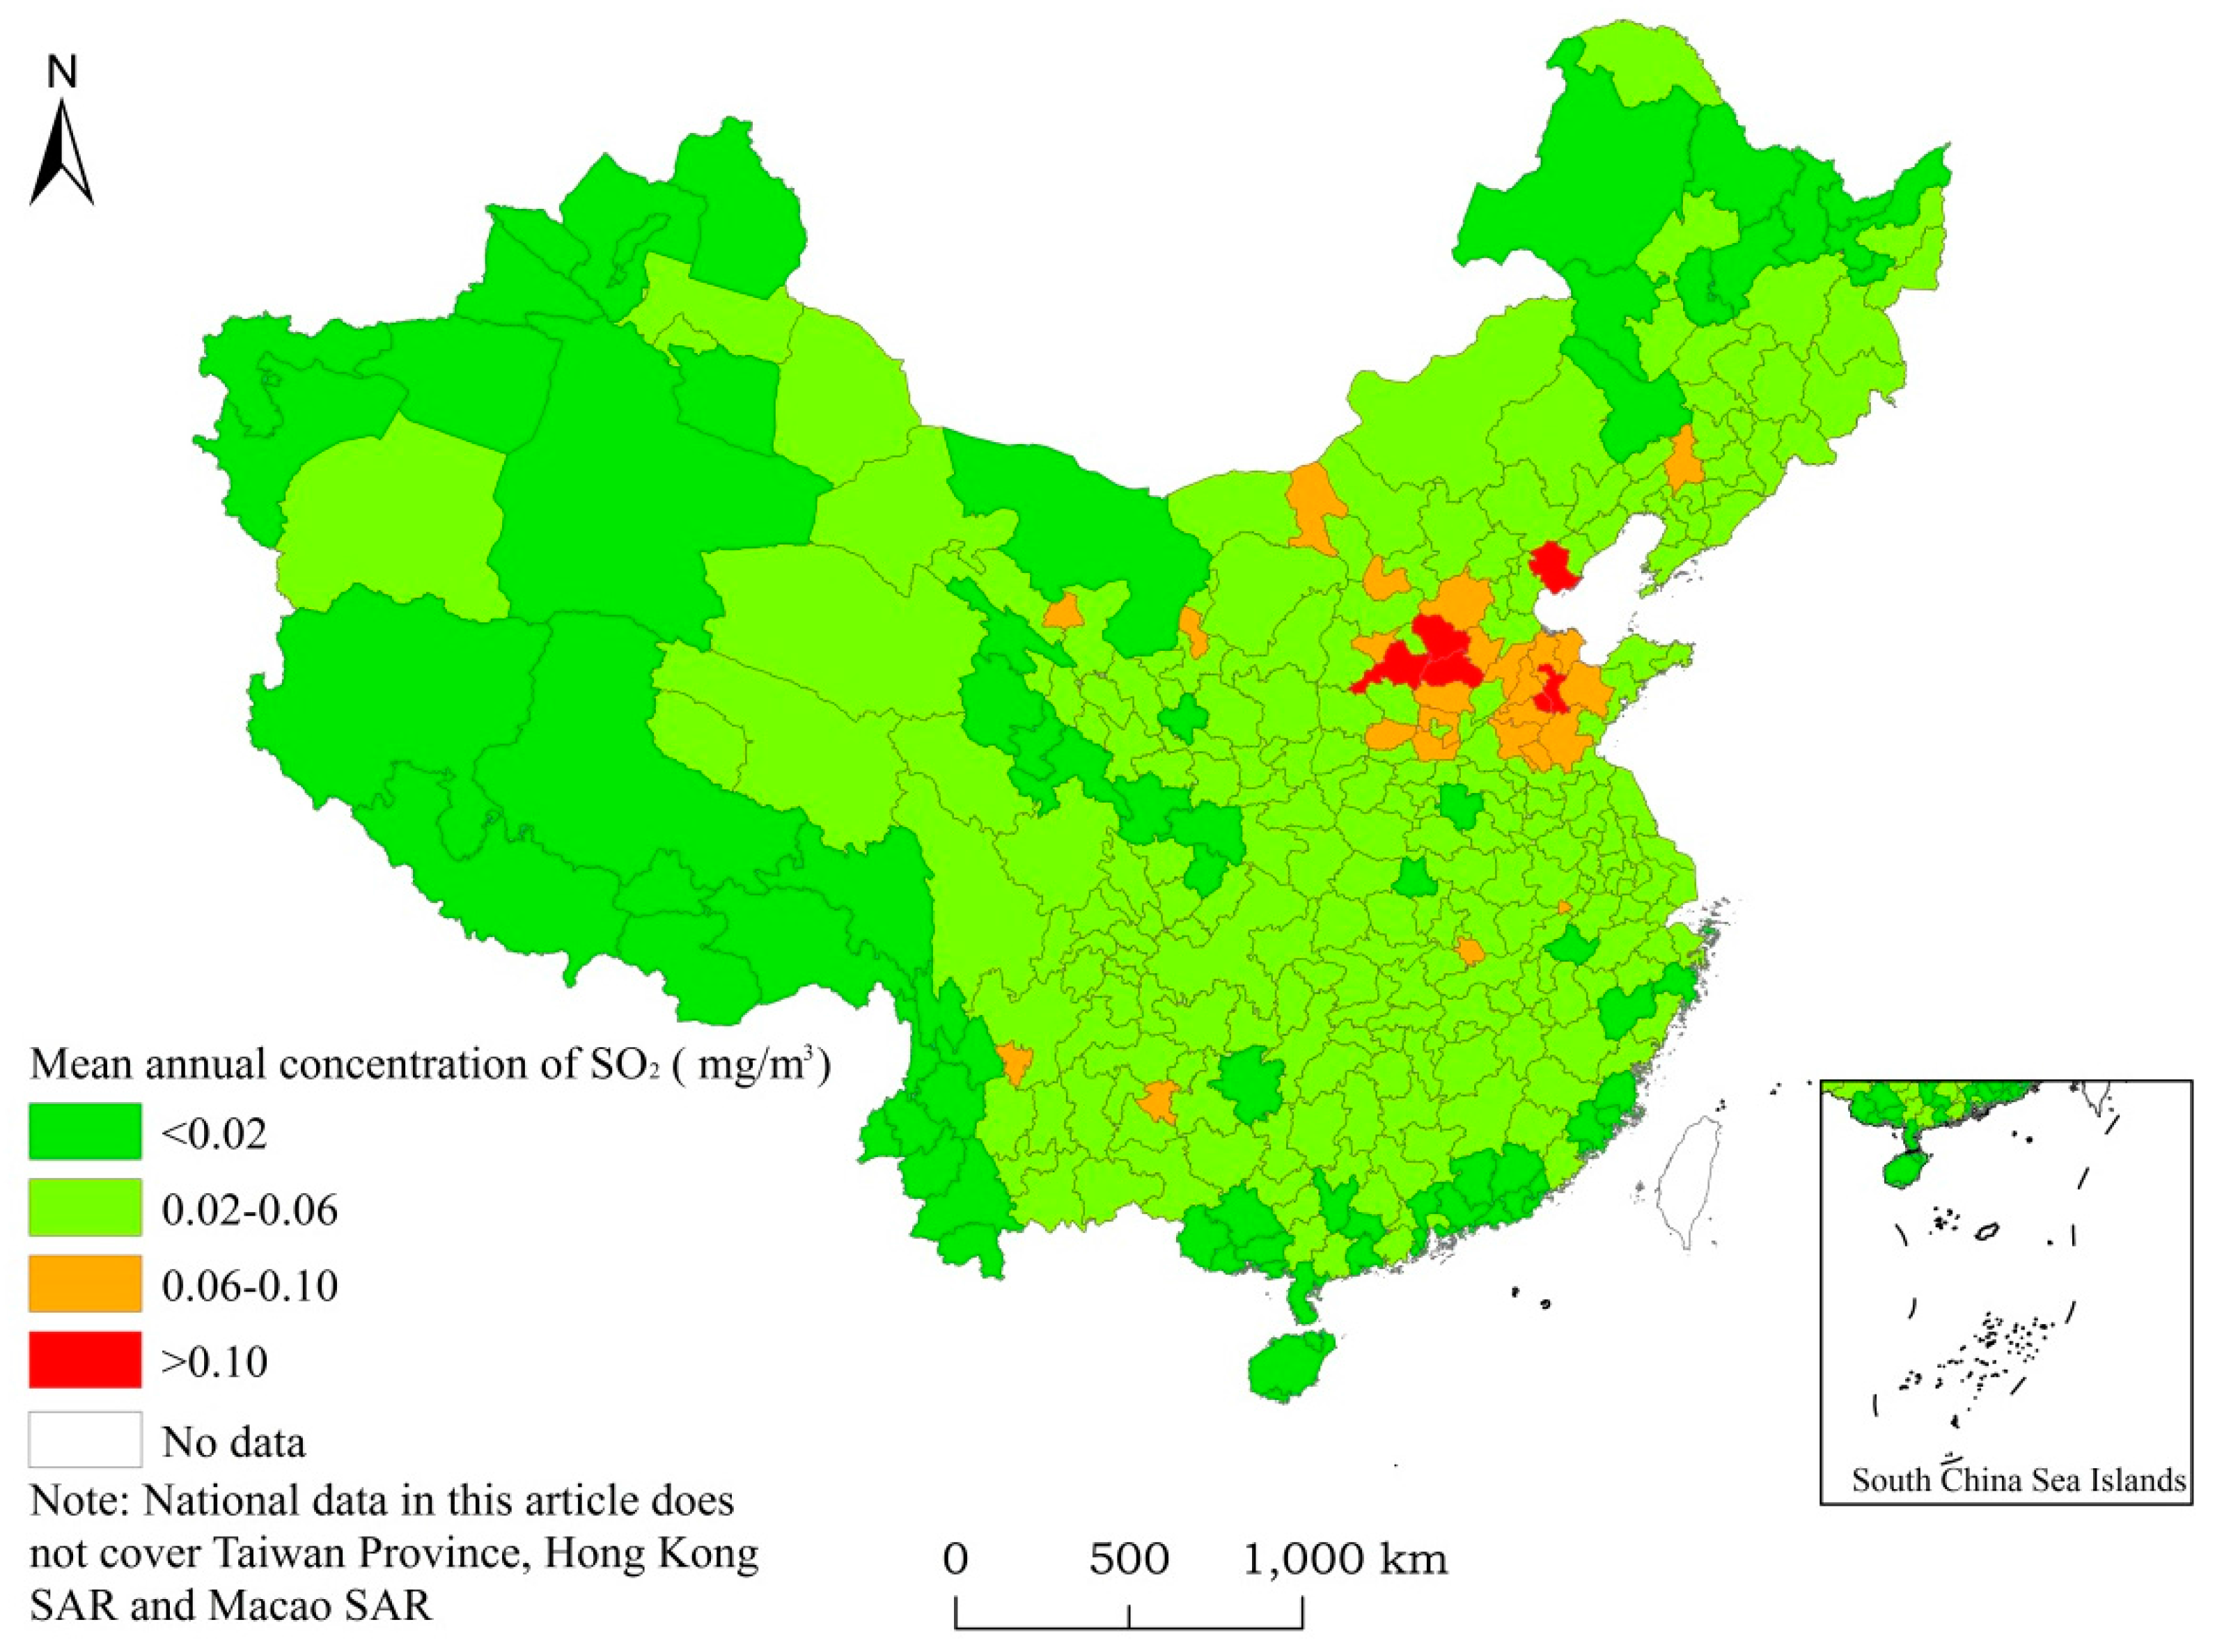
Figure 4.
Spatial distribution of material exposure inventory on city-level in China.
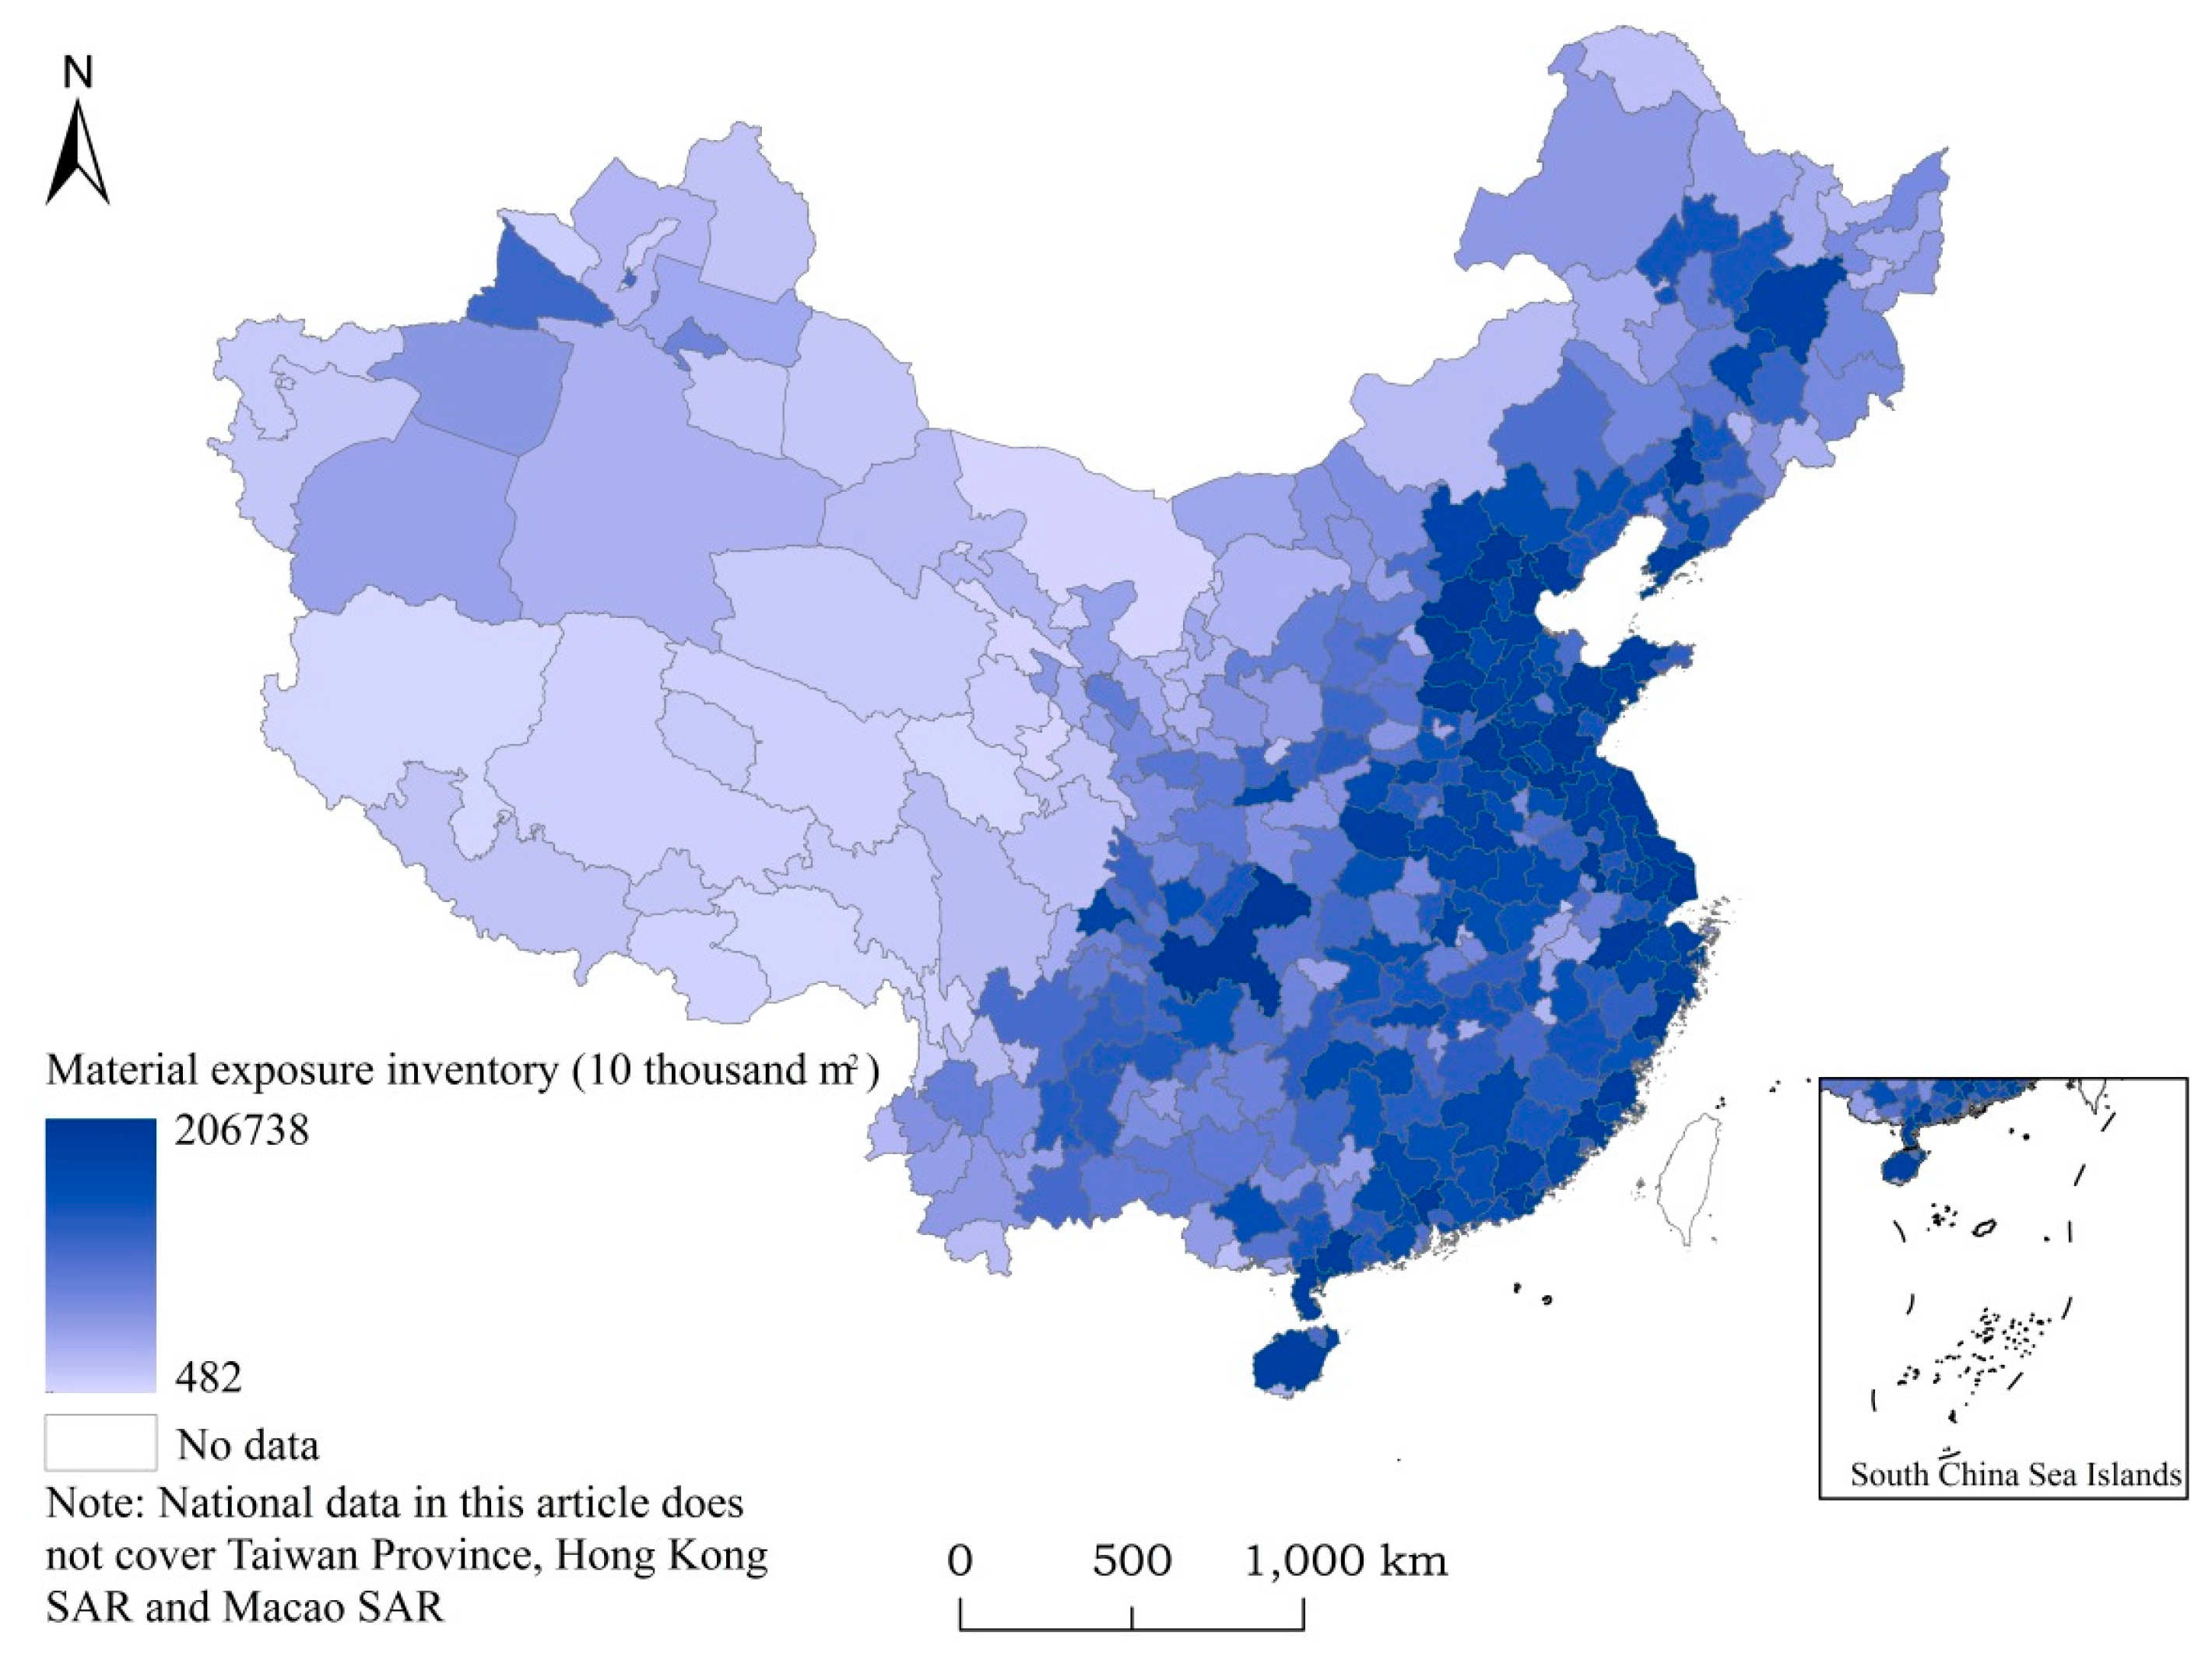
Figure 5.
Spatial distribution of estimated material loss caused by acid deposition on city-level in China.
Figure 5.
Spatial distribution of estimated material loss caused by acid deposition on city-level in China.

Figure 6.
Spatial distribution of proportion in cities’ GDP of material loss incurred by acid deposition on city-level in China.
Figure 6.
Spatial distribution of proportion in cities’ GDP of material loss incurred by acid deposition on city-level in China.

Table 1.
Exposure inventory of building materials in different regions of China (unit: m2/per person).
Table 1.
Exposure inventory of building materials in different regions of China (unit: m2/per person).
| Material | Eastern Region | Central Region | Western Region | ||||
|---|---|---|---|---|---|---|---|
| Municipal District | Rural Area | Municipal District | Rural Area | Municipal District | Rural Area | ||
| 1 | Cement | 7.25 | 5.16 | 3.87 | 2.76 | 12.96 | 14.8 |
| 2 | Brick | 18.51 | 13.18 | 11.07 | 7.88 | 2.64 | 4.49 |
| 3 | Aluminum | 10.03 | 7.14 | 3.35 | 2.39 | 1.71 | 0.82 |
| 4 | Painted wood | 1.24 | 0.88 | 0.61 | 0.43 | 0.15 | 0.89 |
| 5 | Marble/granite | 9.14 | 6.51 | 0.41 | 0.29 | 1.02 | 0.75 |
| 6 | Ceramics and mosaic | 40.97 | 29.17 | 10.54 | 7.5 | 26.53 | 14.47 |
| 7 | Terrazzo | 22.51 | 16.03 | 2.62 | 1.87 | 1.68 | 0.1 |
| 8 | Coating/paint ash | 4.61 | 3.28 | 33.3 | 23.71 | 5.8 | 0.91 |
| 9 | Tile | 2.36 | 1.68 | 0.07 | 0.05 | 1.05 | 0.75 |
| 10 | Galvanized steel | 0.29 | 0.21 | 0.15 | 0.11 | 0.09 | 0.05 |
| 11 | Painted steel | 6.69 | 4.76 | 0.02 | 0.01 | 1.23 | 1.03 |
| 12 | Painted steel protective screening | 13.82 | 9.84 | 7.38 | 5.26 | 6.13 | 4.37 |
| 13 | Galvanized protective screening | 9.21 | 6.56 | 4.92 | 3.5 | 4.09 | 2.91 |
Table 2.
Exposure–response relationship functions, CDLs and calculated results of and for major materials.
Table 2.
Exposure–response relationship functions, CDLs and calculated results of and for major materials.
| SN | Material | Y/(μm/a) | CDL/(μm) | /(μm/a) | /(a) |
|---|---|---|---|---|---|
| 1 | Cement | If [SO2] < 15 μg/m3, then = 50 a, else = 40 a. | — | — | 50 |
| 2 | Brick | If [SO2] < 15 μg/m3, then = 70 a, else = 65 a. | — | — | 70 |
| 3 | Aluminum | Y = 0.14 + 0.98[SO2] + 0.04 × 10⁴[H+] | 10 | 0.141 | 70.92 |
| 4 | Painted wood | Y = 5.61 + 2.84[SO2] + 0.74 × 10⁴[H+] | 13 | 5.63 | 2.31 |
| 5 | Marble/granite | Y = 14.53 + 23.81[SO2] + 3.80 × 10⁴[H+] | 160 | 14.63 | 10.94 |
| 6 | Ceramics and mosaic | If [SO2] < 15 μg/m3, then = 70 a, else = 65 a. | — | — | 70 |
| 7 | Terrazzo | If [SO2] < 15 μg/m3, then = 50 a, else = 40 a. | — | — | 50 |
| 8 | Coating/paint ash | Y = 5.61 + 2.84[SO2] + 0.74 × 10⁴[H+] | 13 | 5.63 | 2.31 |
| 9 | Tile | If [SO2] < 15 μg/m3, then = 45 a, else = 40 a. | — | — | 45 |
| 10 | Galvanized steel | Y = 0.43 + 4.47[SO2] + 0.95 × 10⁴[H+] | 7.3 | 0.45 | 16.22 |
| 11 | Painted steel | Y = 5.61 + 2.84[SO2] + 0.74 × 10⁴[H+] | 13 | 5.63 | 2.31 |
| 12 | Painted steel protective screening | Y = 5.61 + 2.84[SO2] + 0.74 × 10⁴[H+] | 13 | 5.63 | 2.31 |
| 13 | Galvanized protective screening | Y = 0.43 + 4.47[SO2] + 0.95 × 10⁴[H+] | 7.3 | 0.45 | 16.22 |
Where [SO2] (ρ (SO2)) unit: mg/m3, [H+] (c (H+)), unit: mol/L. [SO2] & [H+] refer to the annual averages of the study year.
Table 3.
Reference price of material maintenance or replacement.
| SN | Material | Price (Yuan/m2) | SN | Material | Price (Yuan/m2) |
|---|---|---|---|---|---|
| 1 | Cement | 29 | 8 | Coating/paint ash | 20 |
| 2 | Brick | 86 | 9 | Tile | 11 |
| 3 | Aluminum | 266 | 10 | Galvanized steel | 21 |
| 4 | Painted wood | 27 | 11 | Painted steel | 21 |
| 5 | Marble/granite | 266 | 12 | Painted steel protective screening | 21 |
| 6 | Ceramics and mosaic | 64 | 13 | Galvanized protective screening | 21 |
| 7 | Terrazzo | 35 |
Table 4.
Estimated exposure inventory of various materials in China.
| SN | Material | Material Exposure Inventory (10 Thousand m2) |
|---|---|---|
| 1 | Cement | 987,851 |
| 2 | Brick | 1,311,989 |
| 3 | Aluminum | 579,280 |
| 4 | Painted wood | 97,902 |
| 5 | Marble/granite | 427,495 |
| 6 | Ceramics and mosaic | 2,792,800 |
| 7 | Terrazzo | 1,054,133 |
| 8 | Coating/paint ash | 1,467,289 |
| 9 | Tile | 133,590 |
| 10 | Galvanized steel | 20,041 |
| 11 | Painted steel | 321,396 |
| 12 | Painted steel protective screening | 1,028,162 |
| 13 | Galvanized protective screening | 685,108 |
| Total | 10,907,037 | |
© 2017 by the authors. Licensee MDPI, Basel, Switzerland. This article is an open access article distributed under the terms and conditions of the Creative Commons Attribution (CC BY) license (http://creativecommons.org/licenses/by/4.0/).
Share and Cite
MDPI and ACS Style
Zhang, Y.; Li, Q.; Zhang, F.; Xie, G. Estimates of Economic Loss of Materials Caused by Acid Deposition in China. Sustainability 2017, 9, 488. https://doi.org/10.3390/su9040488
AMA Style
Zhang Y, Li Q, Zhang F, Xie G. Estimates of Economic Loss of Materials Caused by Acid Deposition in China. Sustainability. 2017; 9(4):488. https://doi.org/10.3390/su9040488
Chicago/Turabian StyleZhang, Yinjun, Qian Li, Fengying Zhang, and Gaodi Xie. 2017. "Estimates of Economic Loss of Materials Caused by Acid Deposition in China" Sustainability 9, no. 4: 488. https://doi.org/10.3390/su9040488
Note that from the first issue of 2016, this journal uses article numbers instead of page numbers. See further details here.