A Holistic Sustainability Assessment Method for Urban Food System Governance


Research Institute of Organic Agriculture (FiBL), Frick CH-5070, Switzerland
*
Author to whom correspondence should be addressed.
Sustainability 2017, 9(4), 490; https://doi.org/10.3390/su9040490
Submission received: 30 January 2017
/
Revised: 6 March 2017
/
Accepted: 20 March 2017
/
Published: 24 March 2017
(This article belongs to the Section Sustainable Agriculture)
Abstract
:A growing number of people live in cities. Urban food systems and their impacts on ecosystems and socio-economic conditions are becoming increasingly important. To address the challenge of making urban food systems more sustainable, a rising number of assessments of urban food systems have been published. Some used large quantitative datasets while others were descriptive in nature and/or do not address the whole thematic spectrum of sustainability. In this study, an indicator set was developed, which uses widely available data to address all dimensions of sustainability. The indicators focus on policies and measures of public administration and local politics and are based on the guidelines for Sustainability Assessment of Food and Agriculture Systems (SAFA) by the Food and Agriculture Organization (FAO). To operationalize the SAFA-Guidelines, we developed, in a participatory process, a multi-criteria assessment method with 97 indicators for evaluating 51 of the 58 SAFA subthemes, which were deemed relevant for the context of an urban food system. The first application of this method in the city of Basel, Switzerland, revealed concrete areas of improvement relating to the sustainability of the food system. In combination with cost-effectives analysis, stakeholder consultation, and monitoring measures, the results of the assessment method can be used to initiate the process of moving towards more sustainable urban food systems.
1. Introduction
The worldwide proportion of humans living in urban areas is expected to rise from 54% in 2014 to 66% in 2050 [1]. This growth in urban areas has various impacts on the environment in and around cities [2,3]. Consumption patterns are changing due to the general income increase which comes along with urbanization, which in turn impacts the global production system significantly [4]. For example, per capita consumption of meat in urban areas is higher than in rural areas [5] and therefore has the potential to increase the pressure on agricultural land in the future. Furthermore, consumer choices affect which and how crops are grown and, to a certain extent, farmers’ incomes. At the same time, the increased consumption of processed food [5] and of energy-dense foods [6] have caused a rise in chronic diseases.
With a mounting awareness of the relevance of urban food systems, there have been growing calls for integrated urban food policies (e.g., [7,8,9,10]), which aim at improving the sustainability of urban food systems. Meanwhile, some cities have already implemented urban food strategies (for examples, see [8,9,10]). The Milan Urban Food Policy Pact (MUFPP, [11]) was signed in 2015 by representatives from 132 cities and promises to enhance cooperation in making urban food systems more sustainable. While the MUFPP provides a framework for the transition towards more sustainable urban food systems, the Sustainable Development Goals (SDG) are expected to further promote this process. Although they do not explicitly target the sustainability of urban food systems, they address different topics that are strongly connected to urban food systems, such as hunger and sustainable agriculture (SDG 2), non-communicable diseases (SDG 3), inclusiveness in urban areas (SDG 11), and sustainable consumption (SDG 12).
In order to develop, implement, or monitor food policies, there have been different solutions presented on how to assess the sustainability of a food system. Reports on the various existing methods have been compiled in the on-going City Food Tools project [12] and by Prosperi et al. [13]. The thematic scope varies among the different approaches. Some of the analysis tools encompass a broader view of sustainability by considering social, environmental, and economic themes. The UK Department for Environment, Food, and Rural Affairs (DEFRA) developed an indicator set to monitor the goal achievement of the UK’s Food 2030 strategy [14]. It considers a wider range of topics such as health, food affordability, food safety, productivity of agriculture, animal welfare, capacity building, and environmental aspects [14]. The indicators are based on quantitative data compiled at the national level. Similarly, a recent study by Gustafson et al. [15] proposed an indicator set to assess national food systems, which defines seven metrics to assess a food system: Food Nutrient Adequacy, Ecosystem Stability, Food Affordability & Availability, Sociocultural Wellbeing, Resilience, Food Safety, and Waste & Loss Reduction [15]. One to five equally weighted indicators are used to measure the performance of each metric [15] and are based on worldwide available indices and quantitative primary data [15]. A broader range of sustainability topics, including local food supply, healthy diets, affordability, emergency preparedness, animal welfare, and environmental protection operationalized by indicators relying on quantitative data were also considered in an assessment of San Diego County’s food system [16].
More descriptive, process-oriented studies of the respective food systems’ current state were used in both the Greater Philadelphia region [17] and in Bristol [18]. These studies considered different aspects of sustainability, such as the regional agriculture, food distribution, consumption, and stakeholders in the case of Philadelphia [17], and the same processes but additionally including waste generation in the case of Bristol [18]. Wascher et al. [19] assessed the self-reliance and innovativeness of urban areas in terms of food supply. Although they assessed the sustainability of local supply chains, the main focus was on identifying innovative short food supply chains and the spatial environmental impacts of regional food production. Kremer and DeLiberty mapped the growing potential for local food supply around the city of Philadelphia with the help of GIS [20].
Quantitative sustainability assessment approaches, and especially those with a broad thematic scope, have specific data requirements, which raises questions about data availability [14,15,16]. These issues are likely to be more pronounced when food systems are assessed at the urban, rather than at the national or regional level, because the necessary data is often only available on supra-urban levels. While the more descriptive approaches yield an in-depth analysis of processes and actors within an urban food system, they are not suitable for comparing different urban food systems in terms of sustainability because of non-unified or absent metrics. Although it is important to account for the specific setting within an urban food system, a common sustainability assessment method is needed as a starting point to facilitate the cooperation between different cities, such as those targeted by the MUFPP.
In this study, we therefore aimed to combine the thematic diversity of existing approaches to create an assessment method that enables the evaluation of the sustainability performance of urban food system governance while also enabling the comparison between cities. Potential areas of action needed to be directly deducible from the assessment’s results to ensure practical relevance for policy makers. This primary goal explains the different focus of this study compared to the methods presented above: Rather than looking at the current state of the urban food system’s sustainability itself, the presented method assesses to what extent the urban food system is governed sustainably by local politics and administration. The assessment method was required to be based on easily available data at the urban level and on a comprehensive concept of sustainability. A secondary aim of this study was to apply the sustainability assessment method to allow some reflection on the method and its applicability. The applicability will be also compared to other approaches with the help of the DPSIR framework (Drivers, Pressures, States, Impacts and Responses) [21], chosen because it supports the characterization of the scope of the different indicator sets: While indicators focusing on the responses (e.g., implementation of a new greenhouse gas emission law) are not suitable to evaluate the effectiveness of new policies, the opposite is true for indicators focusing on drivers (e.g., increased meat consumption due to higher household income), pressures (e.g., increased greenhouse gas emissions), states (e.g., increased temperatures), and impacts (e.g., loss of natural habitats).
2. Materials and Methods
2.1. Model Setup
The process of creating the sustainability assessment method included: the definition of system boundaries, the choice and adaption of the analytical framework, and the development of the indicators.
2.1.1. System Boundaries
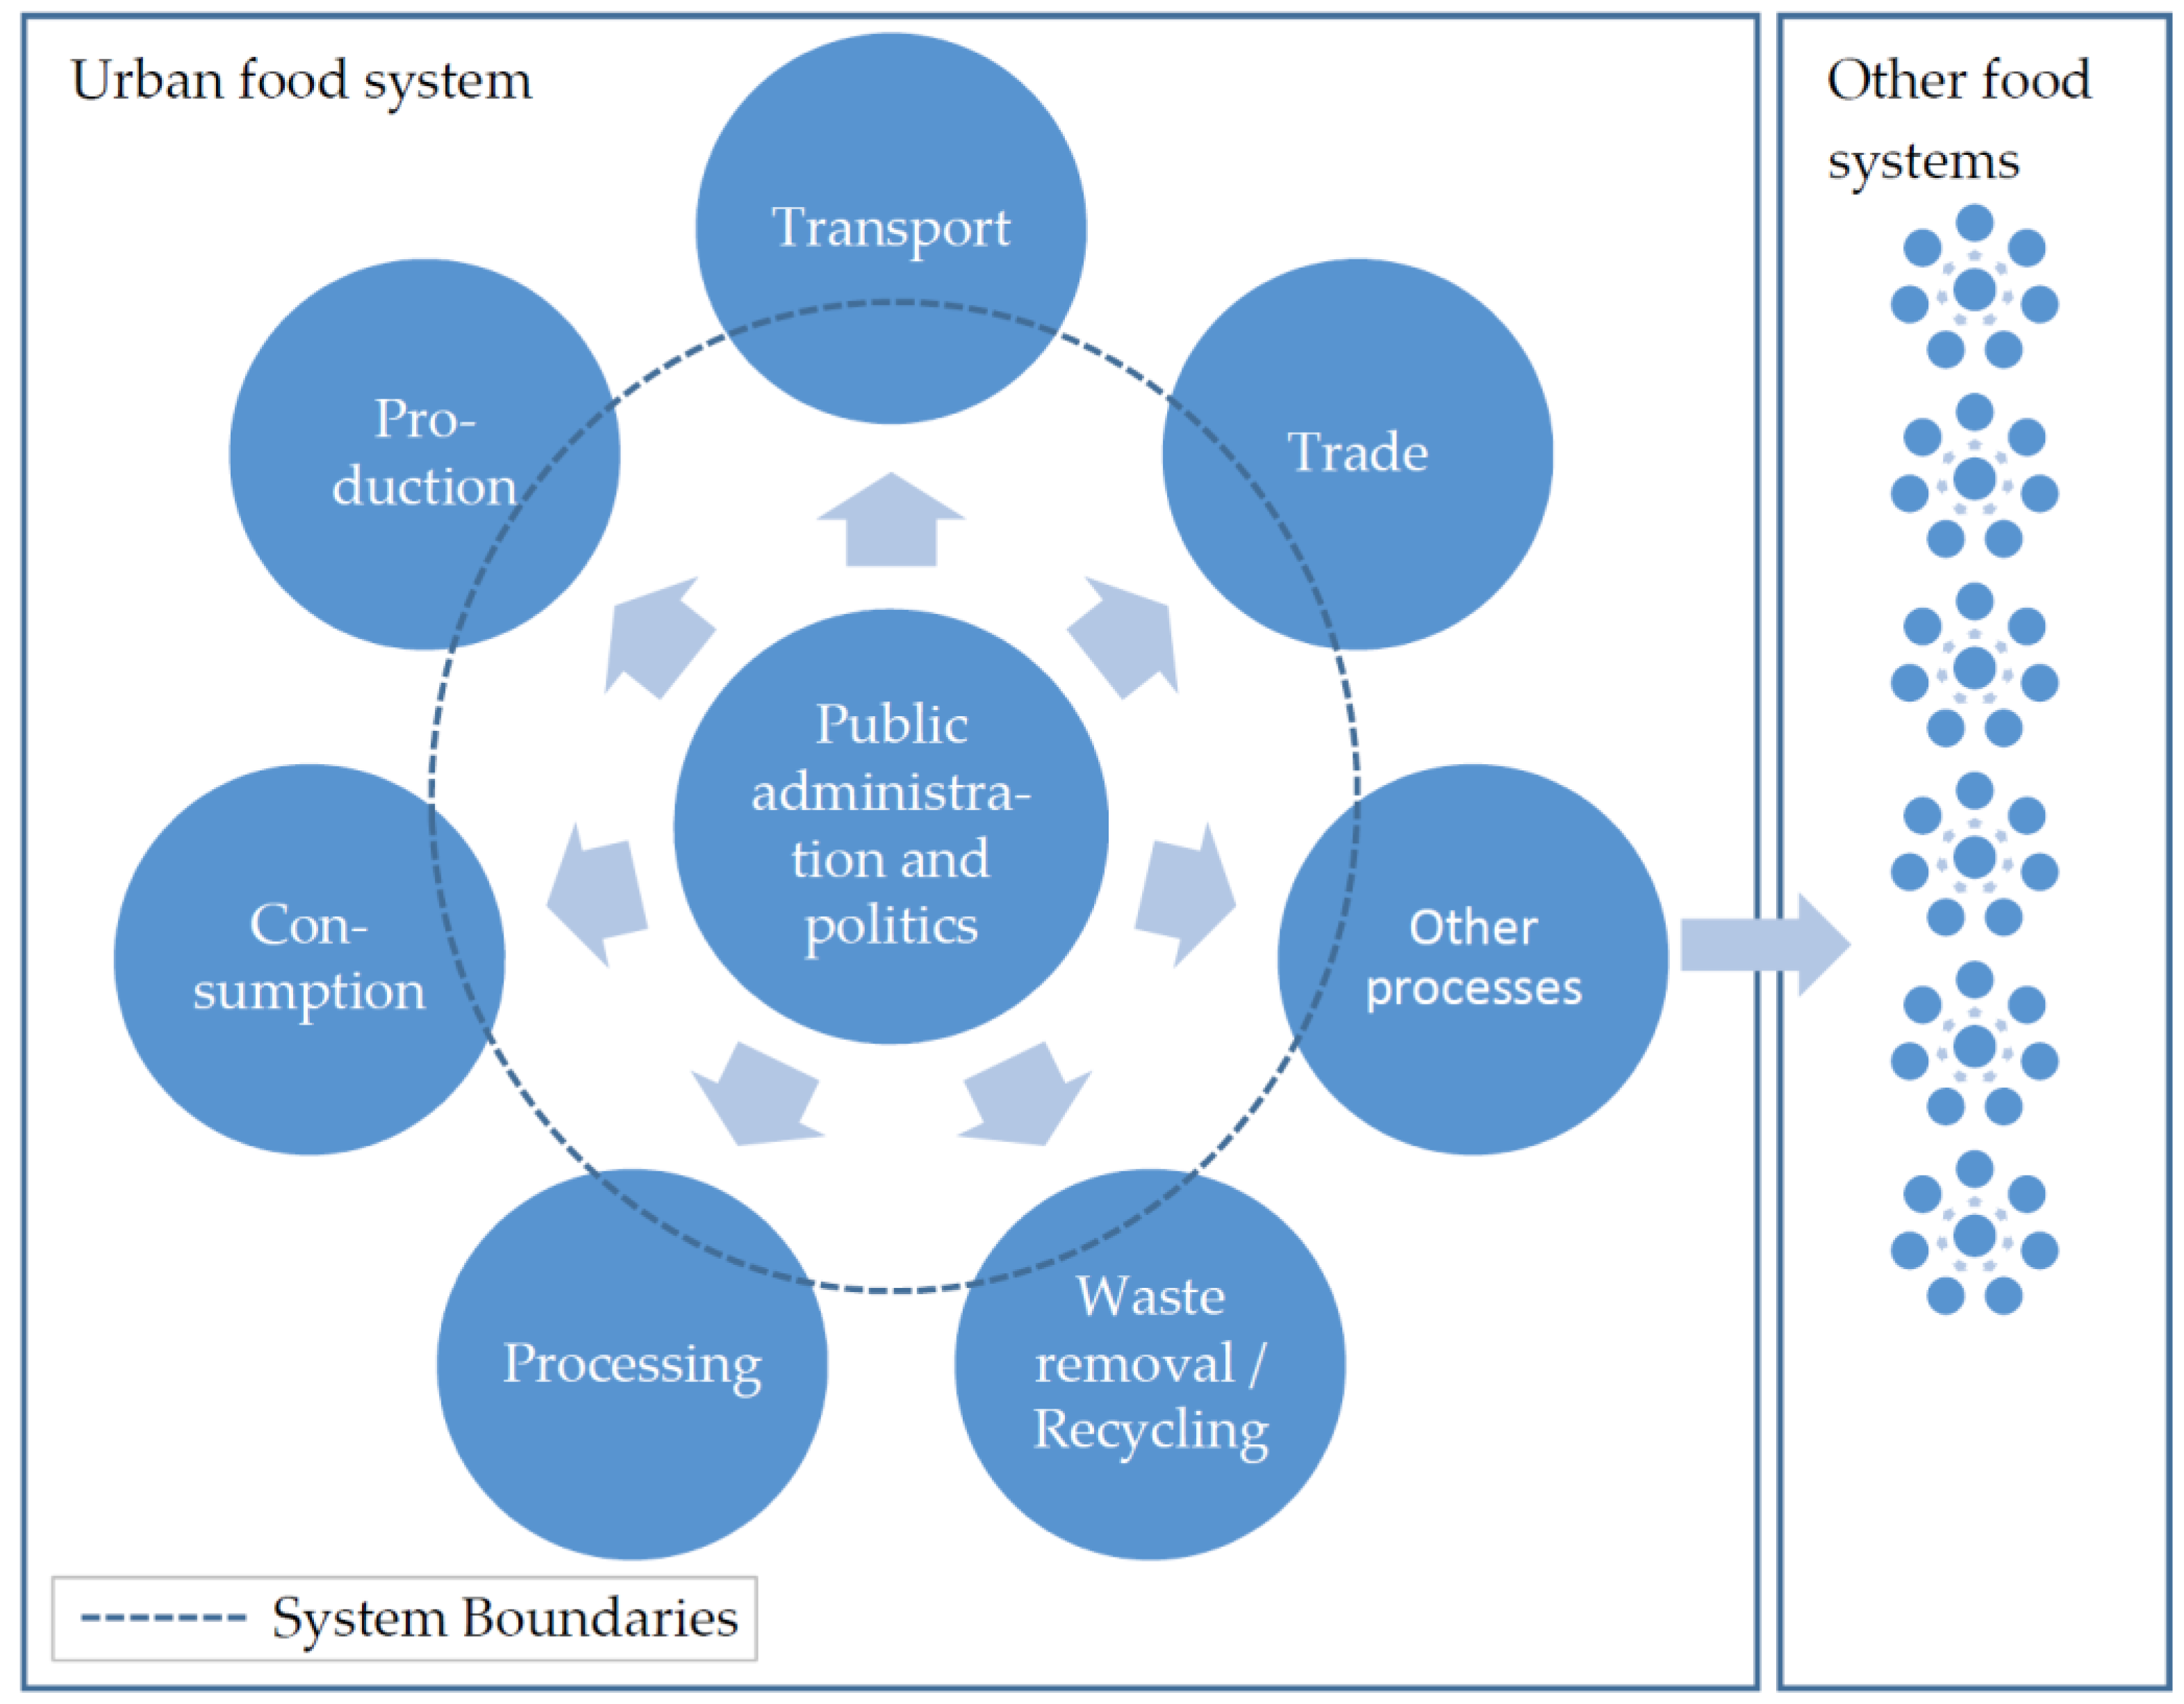
The system boundaries were defined in two steps: First, the general system boundaries of an urban food system were defined to include all food-related processes in the urban area as well as their corresponding actors. This general definition considered all kinds of food-related processes, from production to consumption and waste management. Additionally, processes that are not directly food-related but which impact other food systems (Figure 1), such as financial investments into agricultural systems outside the city, were included in this definition. However, since only part of an urban food system can be influenced by public administration and local politics, the system boundaries were narrowed down in a second step to the (potential) interactions of the mentioned institutions with the processes and actors of the urban food system (Figure 1). This should ensure that the assessment results yield practical suggestions for policy makers on what policies and measures to implement in order to improve the sustainability of the urban food system.
2.1.2. Analytical Framework
After having defined the system boundaries, a suitable analytical sustainability framework to offer a broad view on sustainability (e.g., not only ecological topics) while focusing on food related issues and being globally applicable was sought. The guidelines for Sustainability Assessment of Food and Agriculture systems (SAFA Guidelines), which were published by the Food and Agriculture Organization of the United Nations (FAO, [22]), were found to be suitable. The SAFA Guidelines were developed as a response to the steadily growing number of sustainability frameworks in the food sector with the aim of harmonizing existing approaches within a common, widely accepted framework [22]. The guidelines comprise four dimensions of sustainability: Good Governance, Environmental Integrity, Economic Resilience, and Social Well-Being. These four dimensions are divided into 21 themes with 58 subthemes in total (Figure 2). For each of the 58 subthemes, a goal is defined to evaluate the sustainability of farms or businesses along the food value chain. Depending on the goal, either a business or a societal perspective prevails. Whereas the first considers the resilience of the farm or business to sustain itself in the future, the latter takes into account the impact of the farm or business on society and the environment [23].
The goals of the SAFA subthemes focus on food value chains and needed to be adapted to be applicable to the context of urban food system governance, which meant that the following criteria had to be defined: Firstly, the meaning of the goal’s sustainability topic could not be changed, while accounting for the pre-defined system boundaries of public administration and local politics. Public administration and local politics should therefore be able to potentially influence the degree of goal achievement of a certain subtheme. Secondly, the subthemes needed to include all the relevant aspects of an urban food system. Finally, the subthemes had to focus on food-related topics to avoid overly general assessment results. Based on these three criteria and with the help of the literature, the suitable SAFA subthemes were selected, their goals adapted and, when necessary, new subthemes added.
2.1.3. Determination of the Degree of Goal Achievement
Using Multi-Criteria Analysis [24], the degree of goal achievement for each subtheme (DGAi; Equation (1)) was calculated.
where N is the number of indicators per subtheme, i is the index of the subtheme, IMni is the subtheme-specific weight of an indicator [1,2,3], and ISn is the rating of an indicator (0–100%). The degree of goal achievement accordingly expresses, on a scale from 0 to 100%, the extent to which a subtheme’s sustainability goal was reached. This type of metric was selected to yield meaningful and comprehensible assessment results and to reduce the complexity when comparing between different assessments.
2.1.4. Indicator Selection and Weighting
The indicator development included four steps: Indicators were drafted based on a set of selection criteria, discussed with stakeholders, revised according to the outcome of the discussion, and weighted for each of the adapted subthemes.
In the first step of indicator development, consistent selection criteria were defined using a procedure adapted from Schader et al. [25]: A potential indicator must be based on available data and has to influence the goal achievement of at least one of the adapted SAFA subthemes. In addition to these basic criteria, the indicators should cover as many interactions as possible between the food system’s stakeholders, public administration, and local politics. The latter criterion aims at ensuring a broad picture of urban food system governance, and the relevance of the indicator set. Based on the literature, a first draft set of indicators was developed and a main subtheme assigned to each indicator.
In the second step, the indicators were discussed in a participatory process with stakeholders from Basel’s food system to determine their perceived relevance. The stakeholder group consisted of representatives from the public administration (urban planning, waste management, extension services, environmental protection, and green area management); retail, farmers, and urban gardening associations; and food waste management consultants. The group was sub-divided into smaller groups according to the participants’ expertise. The ensuing discussion was structured similarly to the Delphi method [26]: For each indicator that was discussed, the participants read the description of the indicator and the assigned main subtheme’s goal. The stakeholders then individually rated the indicator from 1 (low relevance for the goal achievement of the main subtheme) to 3 (high relevance for goal achievement of the main subtheme). Finally, the stakeholders justified their ratings in the group discussion. Where a consensus was reached during this discussion, the corresponding rating was noted and, in all other cases, the individual ratings of the stakeholders were listed. In addition to the rating of relevance, the stakeholders had the opportunity to comment on the indicators.
In the third step, the indicators were revised based on the comments and the relevance rating that resulted from the stakeholder discussion. New indicators were added when the workshop participants had suggested that aspects of the urban food system were not covered.
The fourth step was to specify scales from 0 to 100% for each indicator, by defining the worst and the best possible conditions in relation to the corresponding main subtheme goal. The best condition was derived from best practices described in the literature while the worst practices signified no contribution to the subtheme goal. Wherever possible, values between zero and 100% were also defined based on existing examples from the literature. The scales were then reviewed by three experts with backgrounds in environmental sciences, socioeconomics, urban research, and agriculture. Together with these experts, the weights (1–3) of the indicators for the different adapted subthemes were defined. The weighting process was based on discussing the stakeholders’ relevance ratings and then assigning the weights for each indicator for all relevant subthemes.
2.1.5. Development of Interview Questions
The indicators that were derived in the participatory development process are based on two different types of data: online resources (e.g., online law catalogue) and data derived from stakeholder interviews. For the latter, interview questions needed to be defined to ensure the uniform application of the method in different urban food systems with varying experts conducting the interviews.
Depending on the topics raised by the indicators, the stakeholder interviews address different kinds of actors including representatives from public administration to provide information about public policies and laws; representatives from civil society and soup kitchens, and sellers at farmers’ markets to provide information as the basis for indicators to assess the enabling environment for actors in the food system who have low economic power; and canteen managers to provide data on social conditions, governance, and procurement policy in public/public-private canteens. For each of the actors, the questions were formulated in a way to most precisely acquire the data needed to rate the indicators.
2.2. Implementation of the Approach for Basel’s Urban Food System
2.2.1. Study Area
The urban canton of Basel, Switzerland was selected for a first application of the assessment method because there is a dynamic urban agriculture movement in the city with a multitude of different projects being implemented (see Section 2.2.6). Despite the political open-mindedness towards social and environmental topics and its various civil society initiatives, the canton of Basel had not yet assessed its food system governance in a holistic manner.
The canton of Basel-Stadt is located in the north of Switzerland and is subdivided into the city of Basel and the two smaller communities of Riehen and Bettingen. Since all three communities form a closely connected urban area of 3695.71 ha and 192,420 inhabitants [27,28], the whole canton was considered for the analysis of Basel’s urban food system. The canton Basel-Stadt borders Germany, France, and the Swiss canton Basel-Landschaft. With the latter, the canton Basel-Stadt shares administrative responsibilities in the agricultural area (such as offering extension services to farmers). There are 8 farms in the canton of Basel-Stadt which have arable land, livestock, or both. Additionally, there are 11 vineyards within the political boundaries of Basel-Stadt [29]. In total, there were 91 persons employed in agriculture and fishery in 2014 [30]. An additional 2257 persons worked in the food-processing sector, 391 in the food wholesale sector, 2346 in the food retail sector, and 10,105 persons in the catering sector [30]. In total, 8% of employed people worked in the food sector [30,31]. For brevity, the canton Basel-Stadt will be referred to as Basel in the following sections.
2.2.2. Identification of Structural Aspects of Basel’s Food System
An overview of the structural aspects of Basel’s urban food system was gained to prepare for the interviews with relevant stakeholders. This included internet research to complete the information about different administrative departments and their responsibilities concerning the topics raised by the indicators and the corresponding interview questions. Furthermore, representatives of the administration were contacted to provide details about different types of institutional arrangements of public/public-private canteens. This information was needed as a basis for the development of the sampling method. For the same purpose, further online research was employed to gain an overview of the documents available as well as an overview of farmers’ markets, food-related civil society initiatives, and soup kitchens in Basel.
2.2.3. Document Analysis
For the assessment, various documents were analyzed to either rate indicators directly based on the information contained in the documents or to validate the information provided during interviews. For the first purpose, the following documents were screened for the German analogues of the terms “sustainable food”, “food”, and/or “sustainability”/”sustainable” and, where needed, were more closely analyzed for related topics such as health and spatial planning:
In addition, Basel’s financial report [42] was analyzed for public spending on food-related topics, and the training program of the regional agricultural extension center [43] helped to provide information about which capacity building measures could potentially improve which areas of sustainability with regards to regional agriculture. The yearly reports from 2013 and 2014 of Basel’s cantonal laboratory [44,45] served as a basis to determine the scope of food product controls.
A review of food system-relevant legal documents (and their changes in the year 2015) served to both, directly rate indicators and validate the answers received during the interviews. The analyzed legal documents included cross-sectoral laws such as the public procurement law [46] and ordinance [47] and the law on Basel’s ombudsman system [48]. In addition, relevant laws in the areas of environmental protection, agriculture, health, and education were analyzed.
To validate the information provided during the interviews, caterers’ websites were screened for mission statements or similar documents and the investment guidelines of Basel’s pension fund [49] were reviewed.
2.2.4. Interviews with Public or Public-Private Canteen Managers
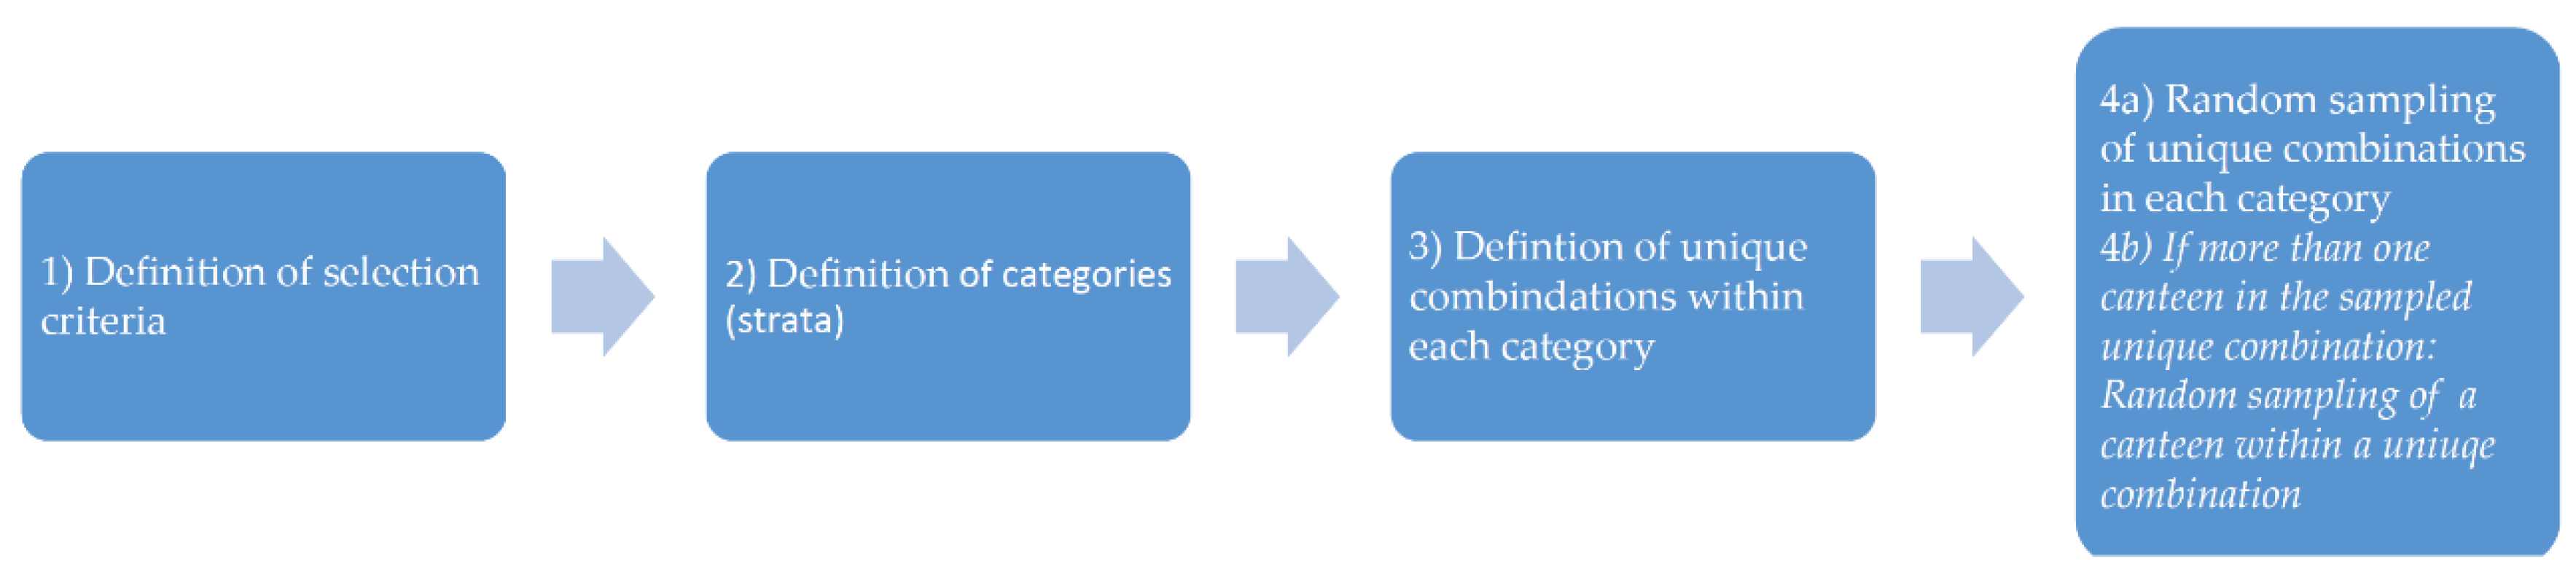
A stratified sampling method was applied for the selection of public-private canteens to interview. The basic selection criterion was that the institutions either needed to be organized directly under public law or have the same function as corresponding public-law institutions (Figure 3, step 1).
The kinds of institutions (strata) were then defined in a way that all institutional arrangements (stated-owned, partly independent, subsidized, etc.) in the urban food system were covered (Figure 3, step 2) and the categories of Kindergarten to secondary level I schools, secondary level II schools, universities, administration, hospitals, private-public nursing homes, and public-law companies were selected. The category Kindergarten to secondary level I schools was further divided in the all-day schools and out-of-school catering. All-day schools can be either run by the Basel administration or by a private management contractor. The latter normally sub-contracts the catering for their institution to a private caterer. Even in the neighborhood of all-day schools with catering, there can be out-of-school catering services which offer an alternative to the school canteen and are subsidized by the Basel administration.
Having defined the sampling categories, unique combinations of an institution (school, hospital, etc.) and a caterer (both public and private) were identified for each category (Figure 3, step 3). In each stratum, one unique combination was selected by random sampling (Figure 3, step 4a). Since the category Kindergarten―secondary level 1 schools held the largest number of unique combinations and the caterers are directly contracted by the cantonal administration instead of the schools themselves, a second canteen was sampled. In the cases where a unique combination comprised more than one canteen, a second random sample was applied to select the canteen (Figure 3, step 4b). Since the same all-day school-contractor normally runs more than one all-day school, the management contractor was taken instead of the corresponding institutions (schools) to determine the unique combinations.
Table 1 shows the number of unique combinations per category.
Except for the all-day school catering category, all interviews were conducted face-to-face. The interviewee received the structured questionnaire in advance in order to prepare for the interview. After the interview, the interviewee provided additional material in written form for those questions that could not be sufficiently answered during the interview.
2.2.5. Interviews with Public Administration Representatives
The questions developed for public administration representatives were divided into separate questionnaires based on the acquisition of information described in Section 2.2.2. The interviewees received the questions to answer in written form.
2.2.6. Interview with Representatives from Food-Related Civil Society Initiatives
After a review of different initiatives in Basel, the association “Urban Agriculture Basel” was found to represent many of the food-related civil society initiatives and was selected to be interviewed in written form. Over 40 projects relating to food co-ops, community supported agriculture, urban gardening, food sharing, etc. are coordinated [50] under the umbrella of the association.
2.2.7. Interviews with Soup Kitchen Representatives
The selection of soup kitchens to be interviewed was based on two strata: local organizations and national organizations with soup kitchens in Basel. The reason for the stratification was to cover the local-only perspective but also the perspective of an actor with experience in other cities in Switzerland. One interview partner was selected for each type.
2.2.8. Interviews with Farmers’ Market Sellers
Five weekly farmers’ markets are part of Basel’s urban food system. Whereas four of them take place on either Friday or Saturday, the main market in Basel takes place daily. Only regional producers were considered for sampling because the interviews were intended to detect the satisfaction with the direct-marketing possibilities in Basel. Two strata were then introduced for sellers with a one-day or multiple-day presence on the farmers’ markets. Sellers with a multiple-day presence make full use of direct-marketing possibilities so only one interview was scheduled with these actors, while two interviews were planned with farmers who sell on only one week-day. The selected farmers provided their answers in written form.
2.2.9. Calculation of Indicator Ratings and DGAi
The indicator results were calculated in two ways, depending on the number of data sources. For single-data source indicators (e.g., an indicator based on the answer of a representative from the public administration), the indicator was directly rated with the help of the indicator scale. For multi-data sources indicators (e.g., an indicator based on the answers from representatives of public/public-private canteens), each data source (m) was rated separately with the help of the indicator scale and the results were then aggregated to the indicator score (ISn) (Equation (2)):
After having calculated the scores of each indicator, the DGAi for all subthemes was calculated according to Equation (1) in Section 2.1.3.
3. Results
3.1. Assessment Model
3.1.1. Analytical Framework
Not all of the SAFA subthemes were adaptable to the context of an urban food system. Seven of the 58 subthemes would have needed a major change in the original SAFA-goal formulation and were therefore not further considered in this study (Figure 2). Beside the subthemes Remedy, Restoration and Prevention, and Rights of Suppliers, the other five subthemes (Long-Ranging Investment, Profitability, Stability of Supply, Stability of Market, and Liquidity) were all part of the economic dimension. The adapted goals of the remaining 51 SAFA subthemes are listed in supplementary materials Table S1.
Food-related civil society initiatives play a vital role in urban food systems and are addressed in the recommended actions of the Milan Urban Food Policy Pact [11]. To account for this missing aspect in the SAFA Guidelines, the additional subtheme Civil Society Initiatives was included.
3.1.2. Indicators
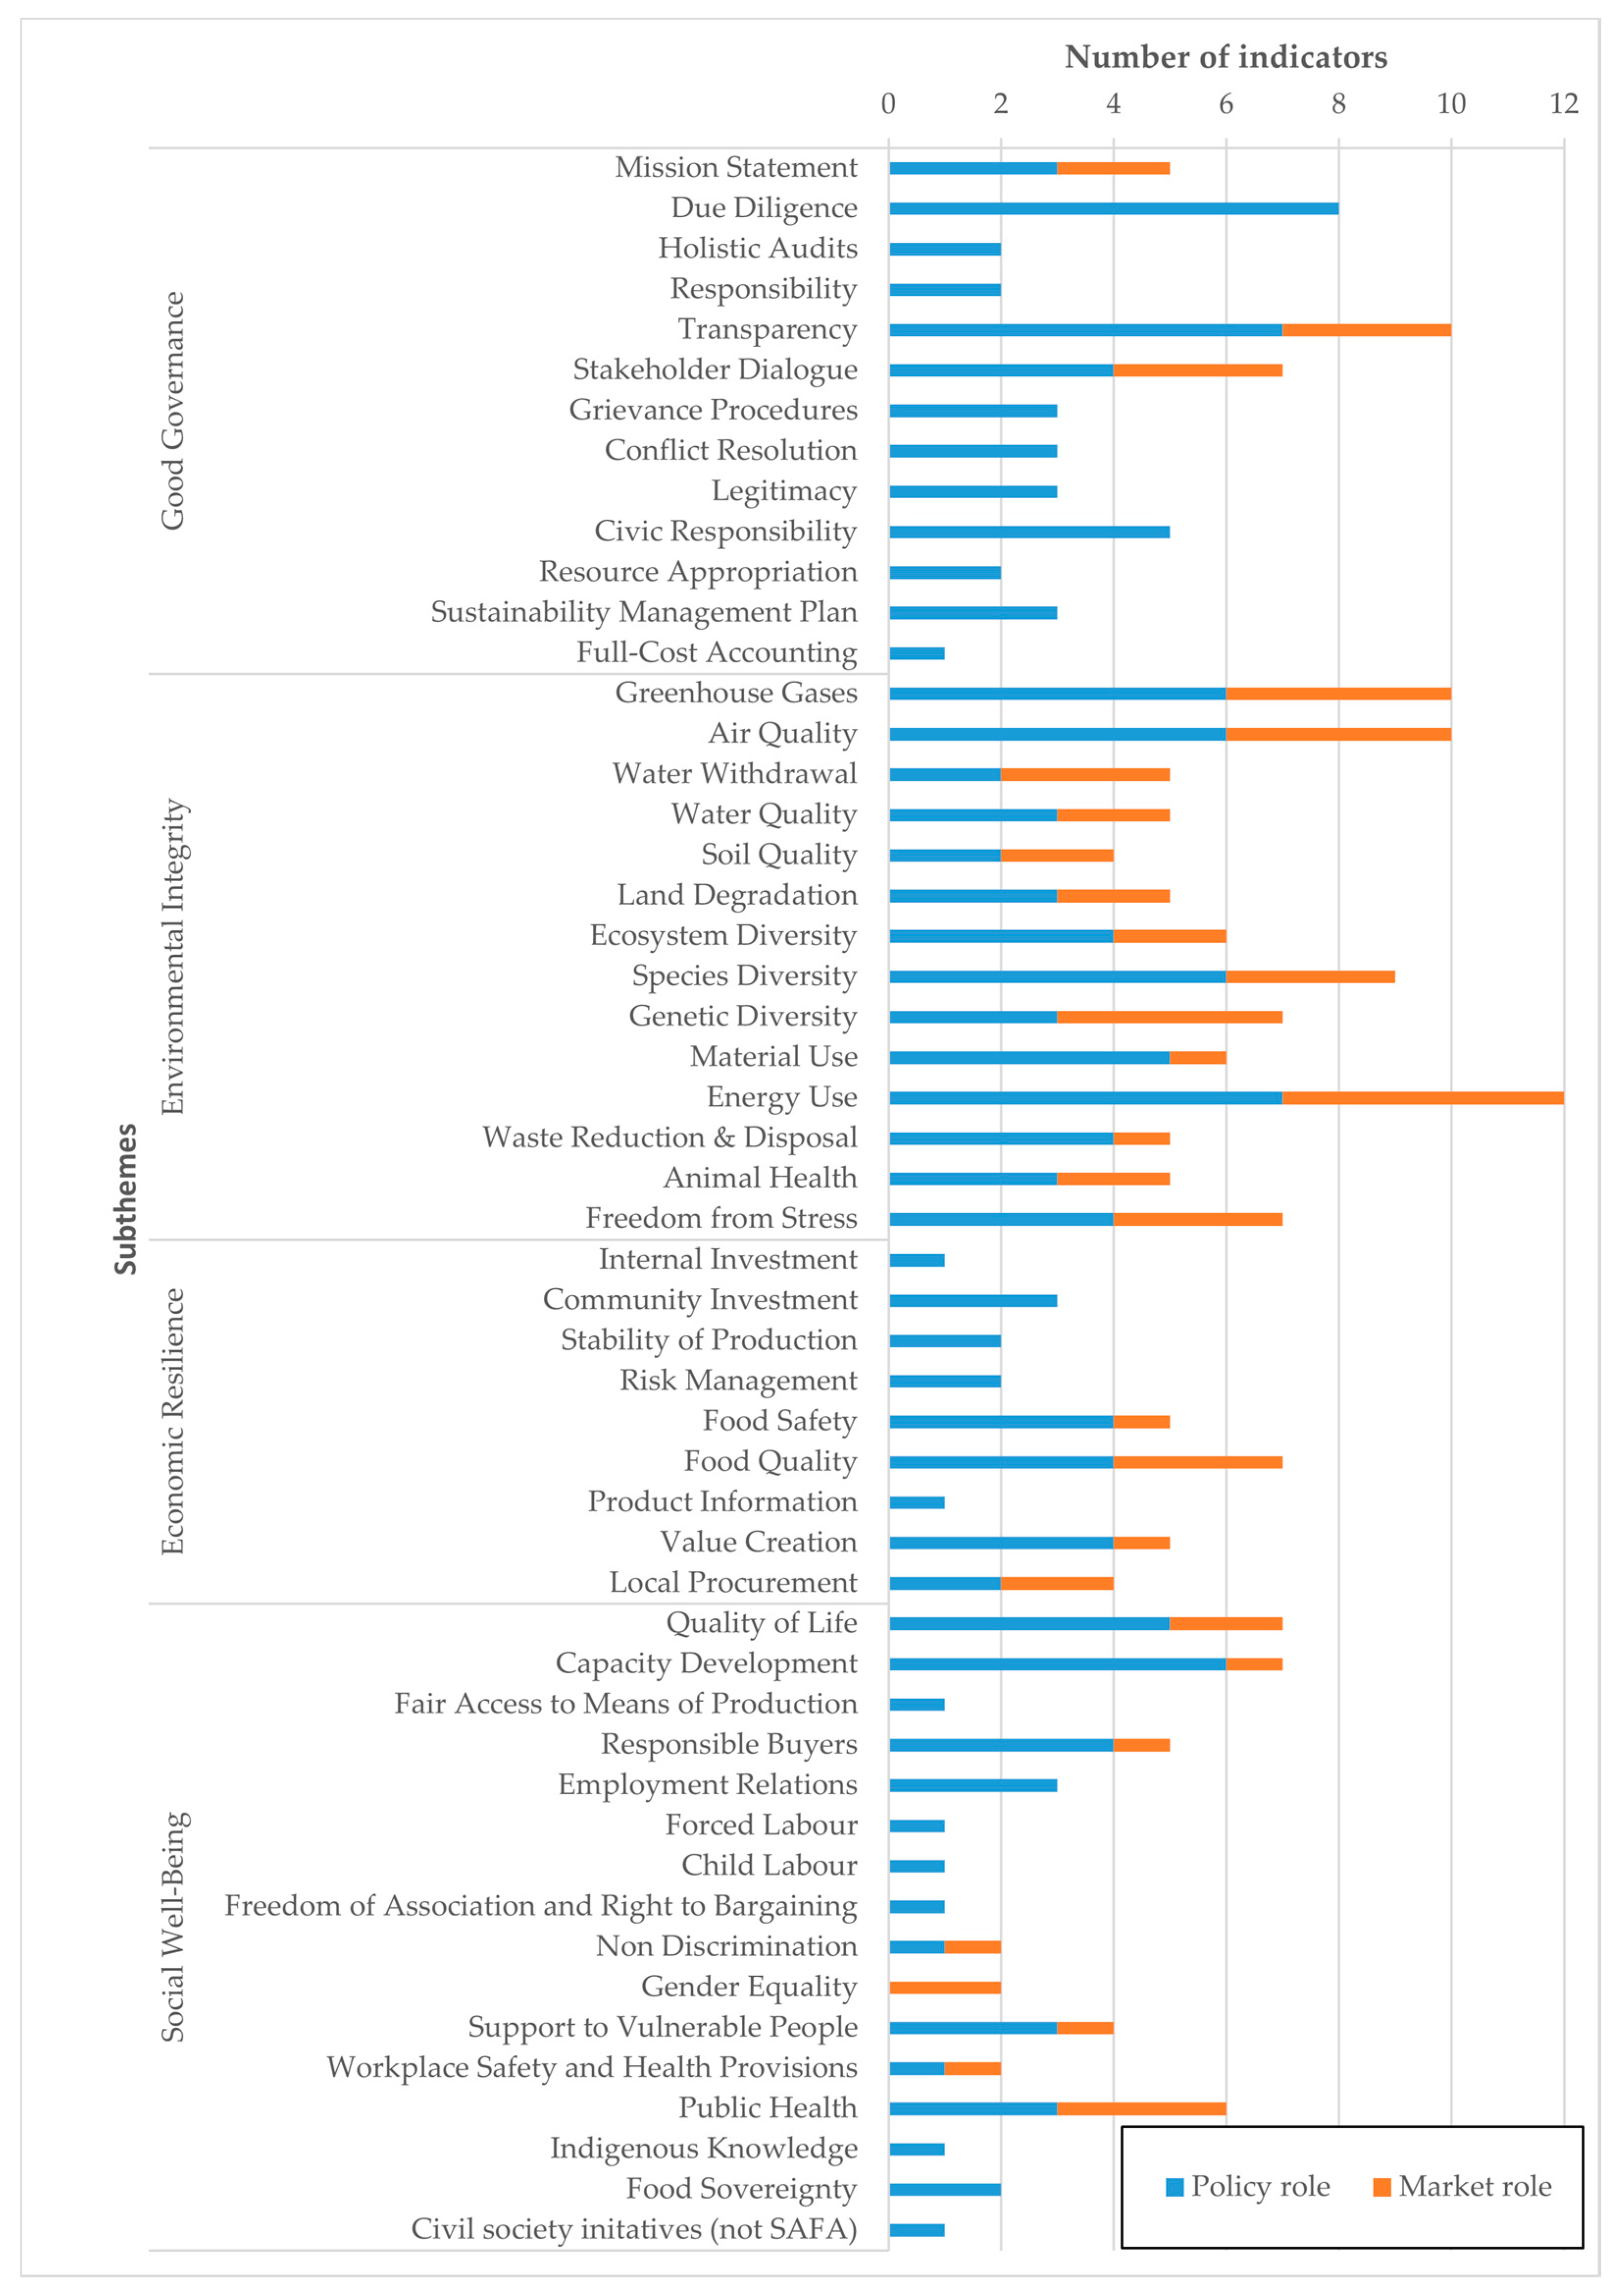
In total, 97 indicators were developed in the participatory process described in Section 2.1.4 (see Supplementary Materials Table S2 for the list of indicators). They are based on two roles of the local politics and administration: The “policy role” considers the activities of the local politics and administration that influence other actors and processes in the urban food system through regulation (and controls), incentives, educational efforts, research, and support of initiatives. The “market role” considers public or public-private canteens to be a direct actor in the food system by purchasing and providing food. The number of indicators that are relevant to the policy role (72) exceeds those which assess the market role (25), which corresponds to the larger set of different public responsibilities in the case of the policy role. The indicators based on the market role mostly operationalize subthemes in the dimension of Environmental Integrity (Figure 4).
The highest number of indicator impacts is found in the dimension of environmental integrity (96). It therefore exhibits considerably more indicator-subtheme relations than the other three dimensions.
Adopting the analytical view of the DPSIR-model and conceptually expanding it to social and economic state variables, 91 of the indicators are response-related, five indicators are state-related, and one indicator is pressure-related (see Supplementary Materials Table S2 for the categorization of the indicators). The predominance of indicators that are response-related corresponds to the study’s goal to assess urban food policies based on easily available data. This also explains why the majority of indicators are based on qualitative input data.
Although the study’s focus was on public administration and local politics, other actors of the urban food system are indirectly covered by the indicators: primary producers, processors, distributors, wholesale, retail, restaurants, consumers, allotment gardeners, urban gardeners, and soup kitchens. Conceptually, all the indicators are either related to the process of legislation or to law enforcement. Both processes comprise various sub processes or areas of actions, which are covered by different indicators: public procurement, public sustainability reporting, public advising services, public education programs, public information campaigns, farmer subsidization, public support, lobbying on higher administrative levels, public investment, public infrastructure, levying of fees, and social services.
In total, the 97 indicators impact with 226 weights (IMni) on the goal achievement of the 52 subthemes. Figure 4 gives an overview of the type and number of indicators per subtheme.
3.2. Assessment of Basel’s Urban Food System Governance
In the following section, examples of results from the assessment of Basel’s urban food system governance are presented. They are structured according to the SAFA-Dimensions. The results show that Basel has already implemented policies and measures to improve the sustainability of its food system, but some areas with the potential for improvement were identified.
It could generally be observed that the investigated canteens returned a wide range of indicator performances. For 13 out of the 25 market role-indicators, there was a least one canteen with the minimum rating (0%) and at least one with the maximum rating (100%). For a detailed list of the indicator ratings and rating explanations, see Supplementary Materials Table S3.
3.2.1. Good Governance
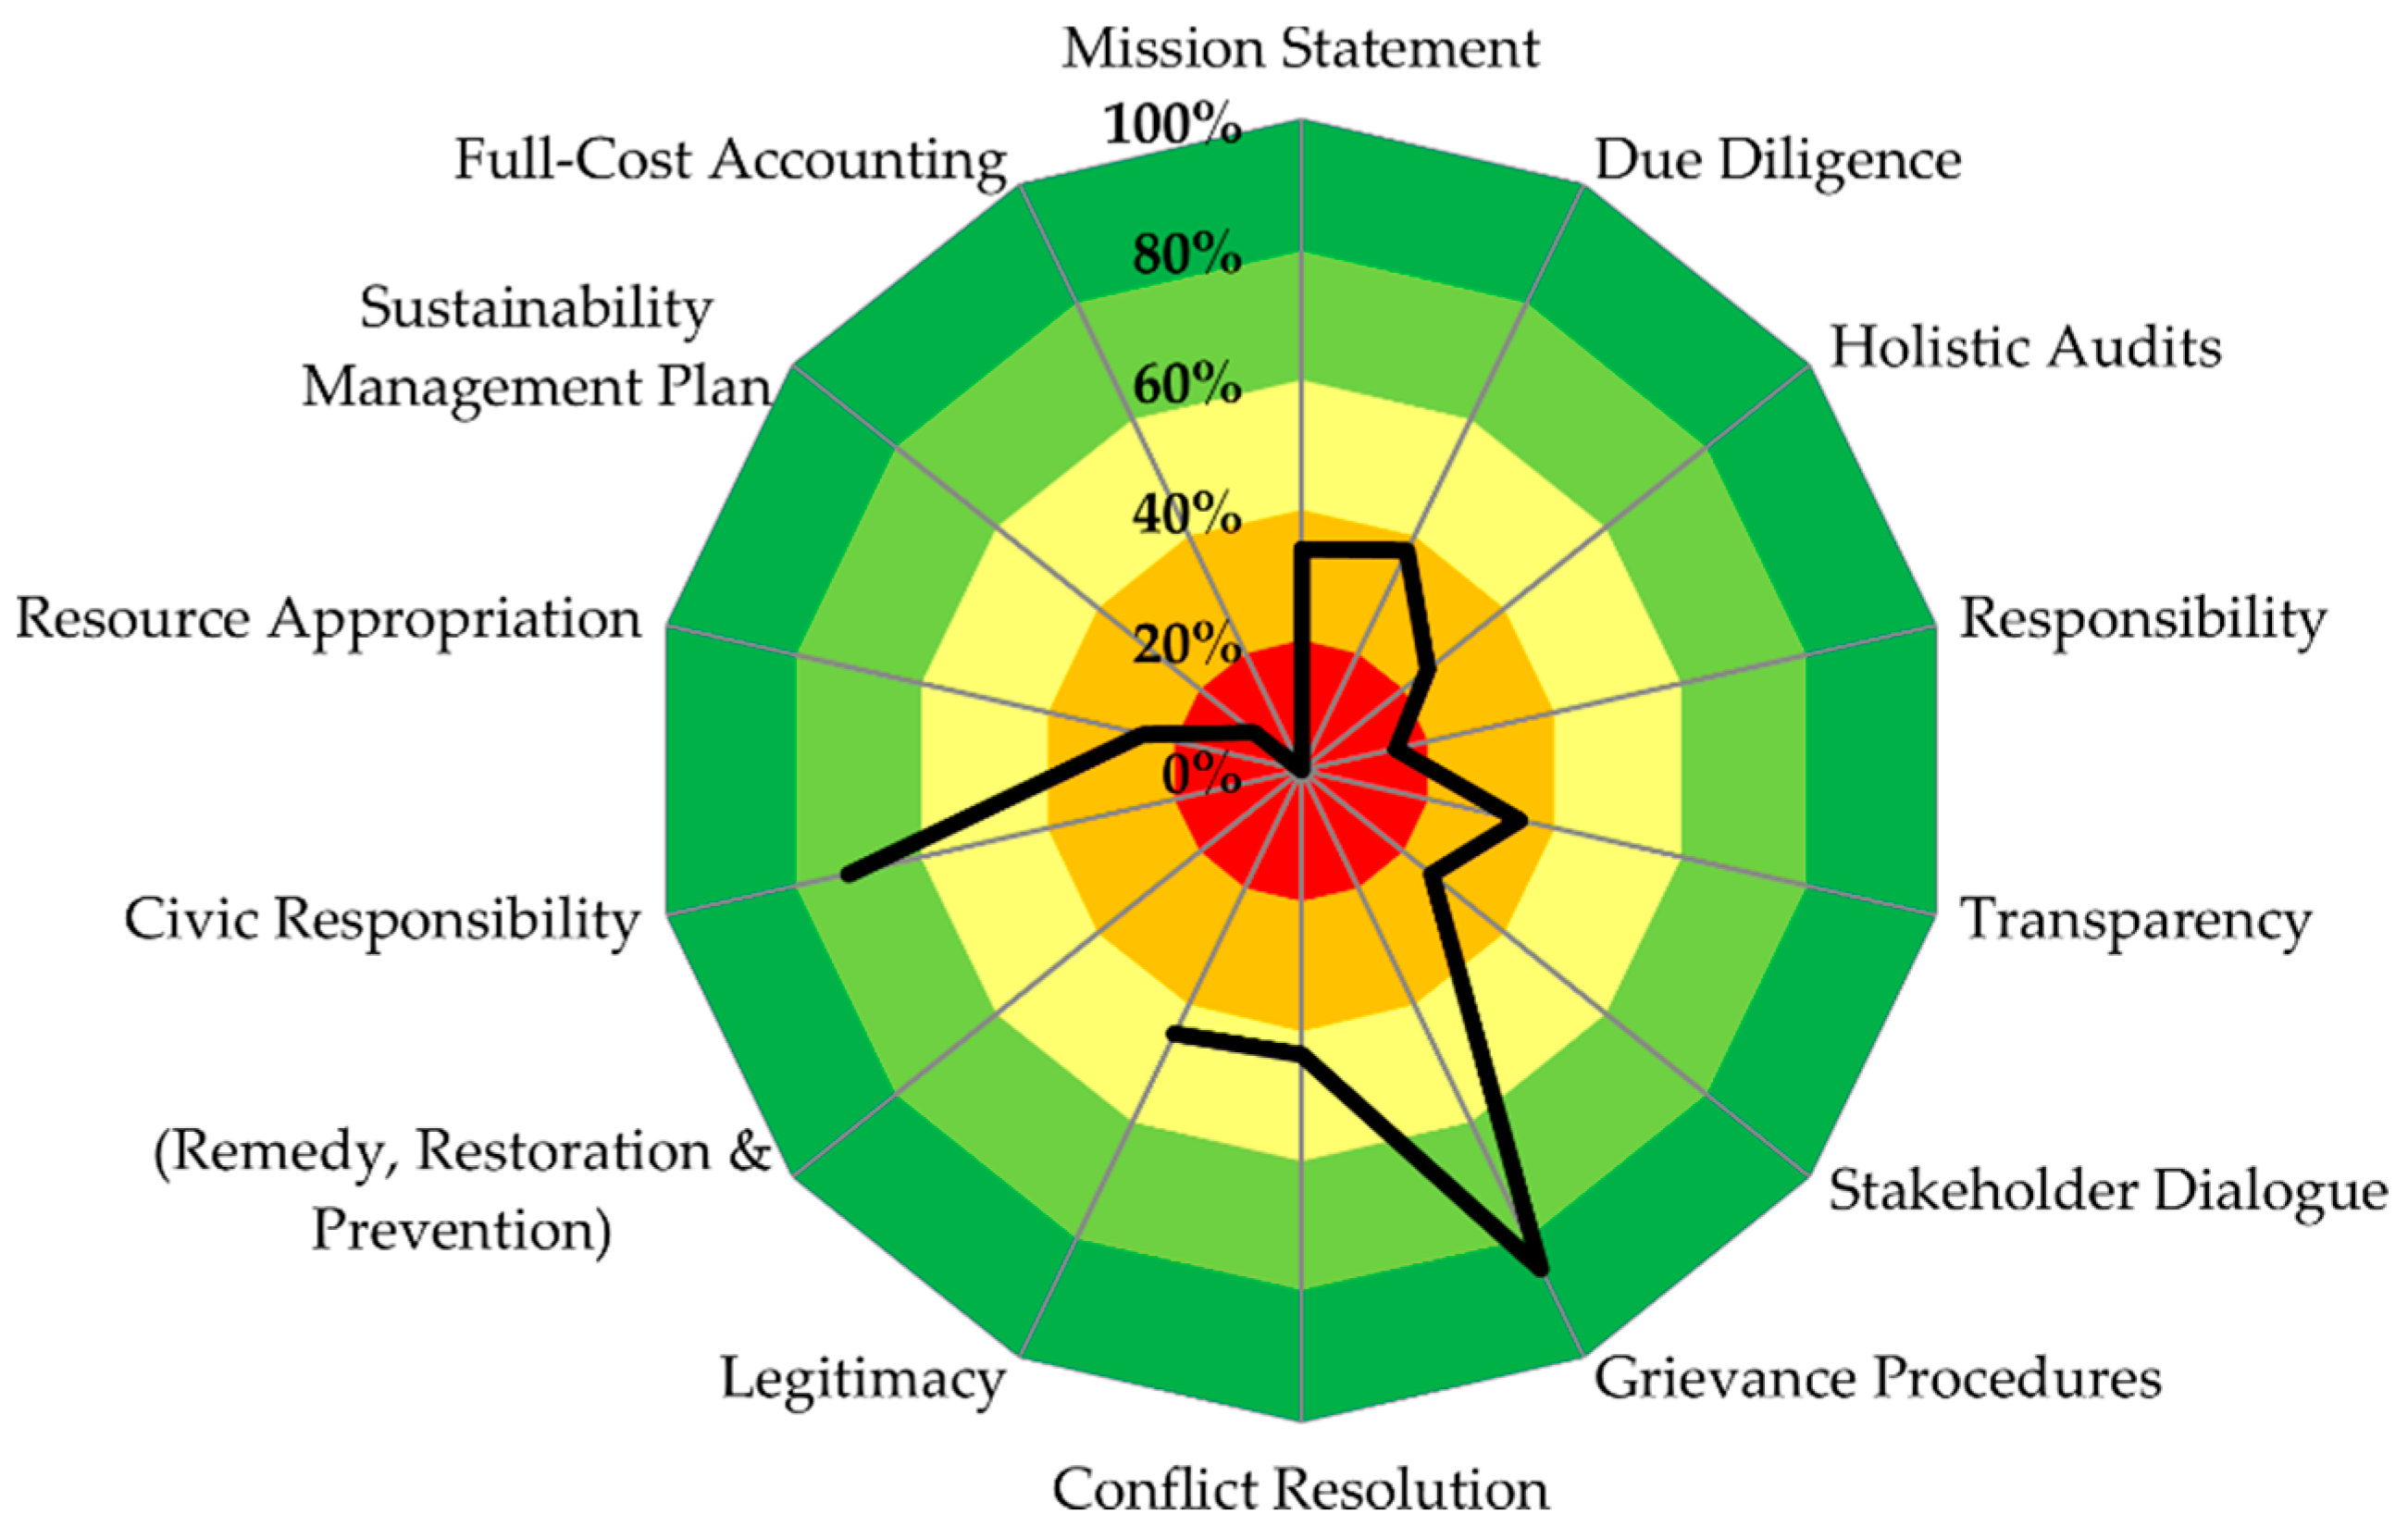
In general, the subthemes in the SAFA dimension, Good Governance, received low scores (DGAi). The best result was achieved for the subtheme Grievance Procedures (85%, see Figure 5). The high rating can be explained by the public ombudsman-system in Basel. It enables different actors of the food system to file complaints against the public administration, which are then handled with confidentiality, effectiveness, and independence from the administration. The goals of the subthemes Mission Statement, Due Diligence, Holistic Audits, Responsibility, Transparency, Stakeholder Dialog, Conflict Resolution, Legitimacy, Resource Appropriation, and Sustainability Management Plan were only achieved to a maximum of 50%. The first rating (Mission Statement) is mainly a result of the lack of written commitment relating to sustainable food in both the Basel constitution and the mission statements of canteens. The low score of the subtheme Due Diligence is because Basel’s public pension fund has no specific criteria on how to avoid resource conflicts in other agricultural systems related to its investments. This also led to the low goal achievement of Resource Appropriation. Similarly, Basel has not yet tried to estimate the external costs of its food system which is why the subtheme Full-Cost Accounting scored 0%. The lack of accounting for the external costs of the food system is also in line with the finding that food is only indirectly mentioned in Basel’s sustainability report, which explains the low goal achievement of Holistic Audits. The corresponding absence in the sustainability report of food-related goals and indicators led to the low rating of the subtheme Responsibility. The fact that canteens do not publish their supplier or raw material list and that contracts between the local administrations and their food suppliers or canteen managers are not publicly available mainly influenced the rating of the result relating to the food system’s transparency. The score of the subtheme Stakeholder Dialogue is also rather low, which can be mainly attributed to the lack of an inclusive urban food policy council. This also influences the goal achievement of Conflict Resolution negatively, which returned a comparatively higher score (44%) due to the public ombudsman-system. With a similar rating (45%), Legitimacy is positively influenced by the annual reports of Basel’s control commission which did not find major irregularities in public management relating to food. The subtheme Sustainability Management Plan scored close to zero because Basel has no overarching food strategy.
Basel is a member of the Swiss Cities Association (SSV) and the urban network ICLEI-Local Governments for Sustainability. Both organizations lobby for more sustainable public procurement. Together with its official statements on Swiss law revisions, Basel directly or indirectly advocates for more sustainable food systems, both nationally and internationally. This leads to the dimension’s second highest rating in the subtheme Civic Responsibility (71%).
3.2.2. Environmental Integrity
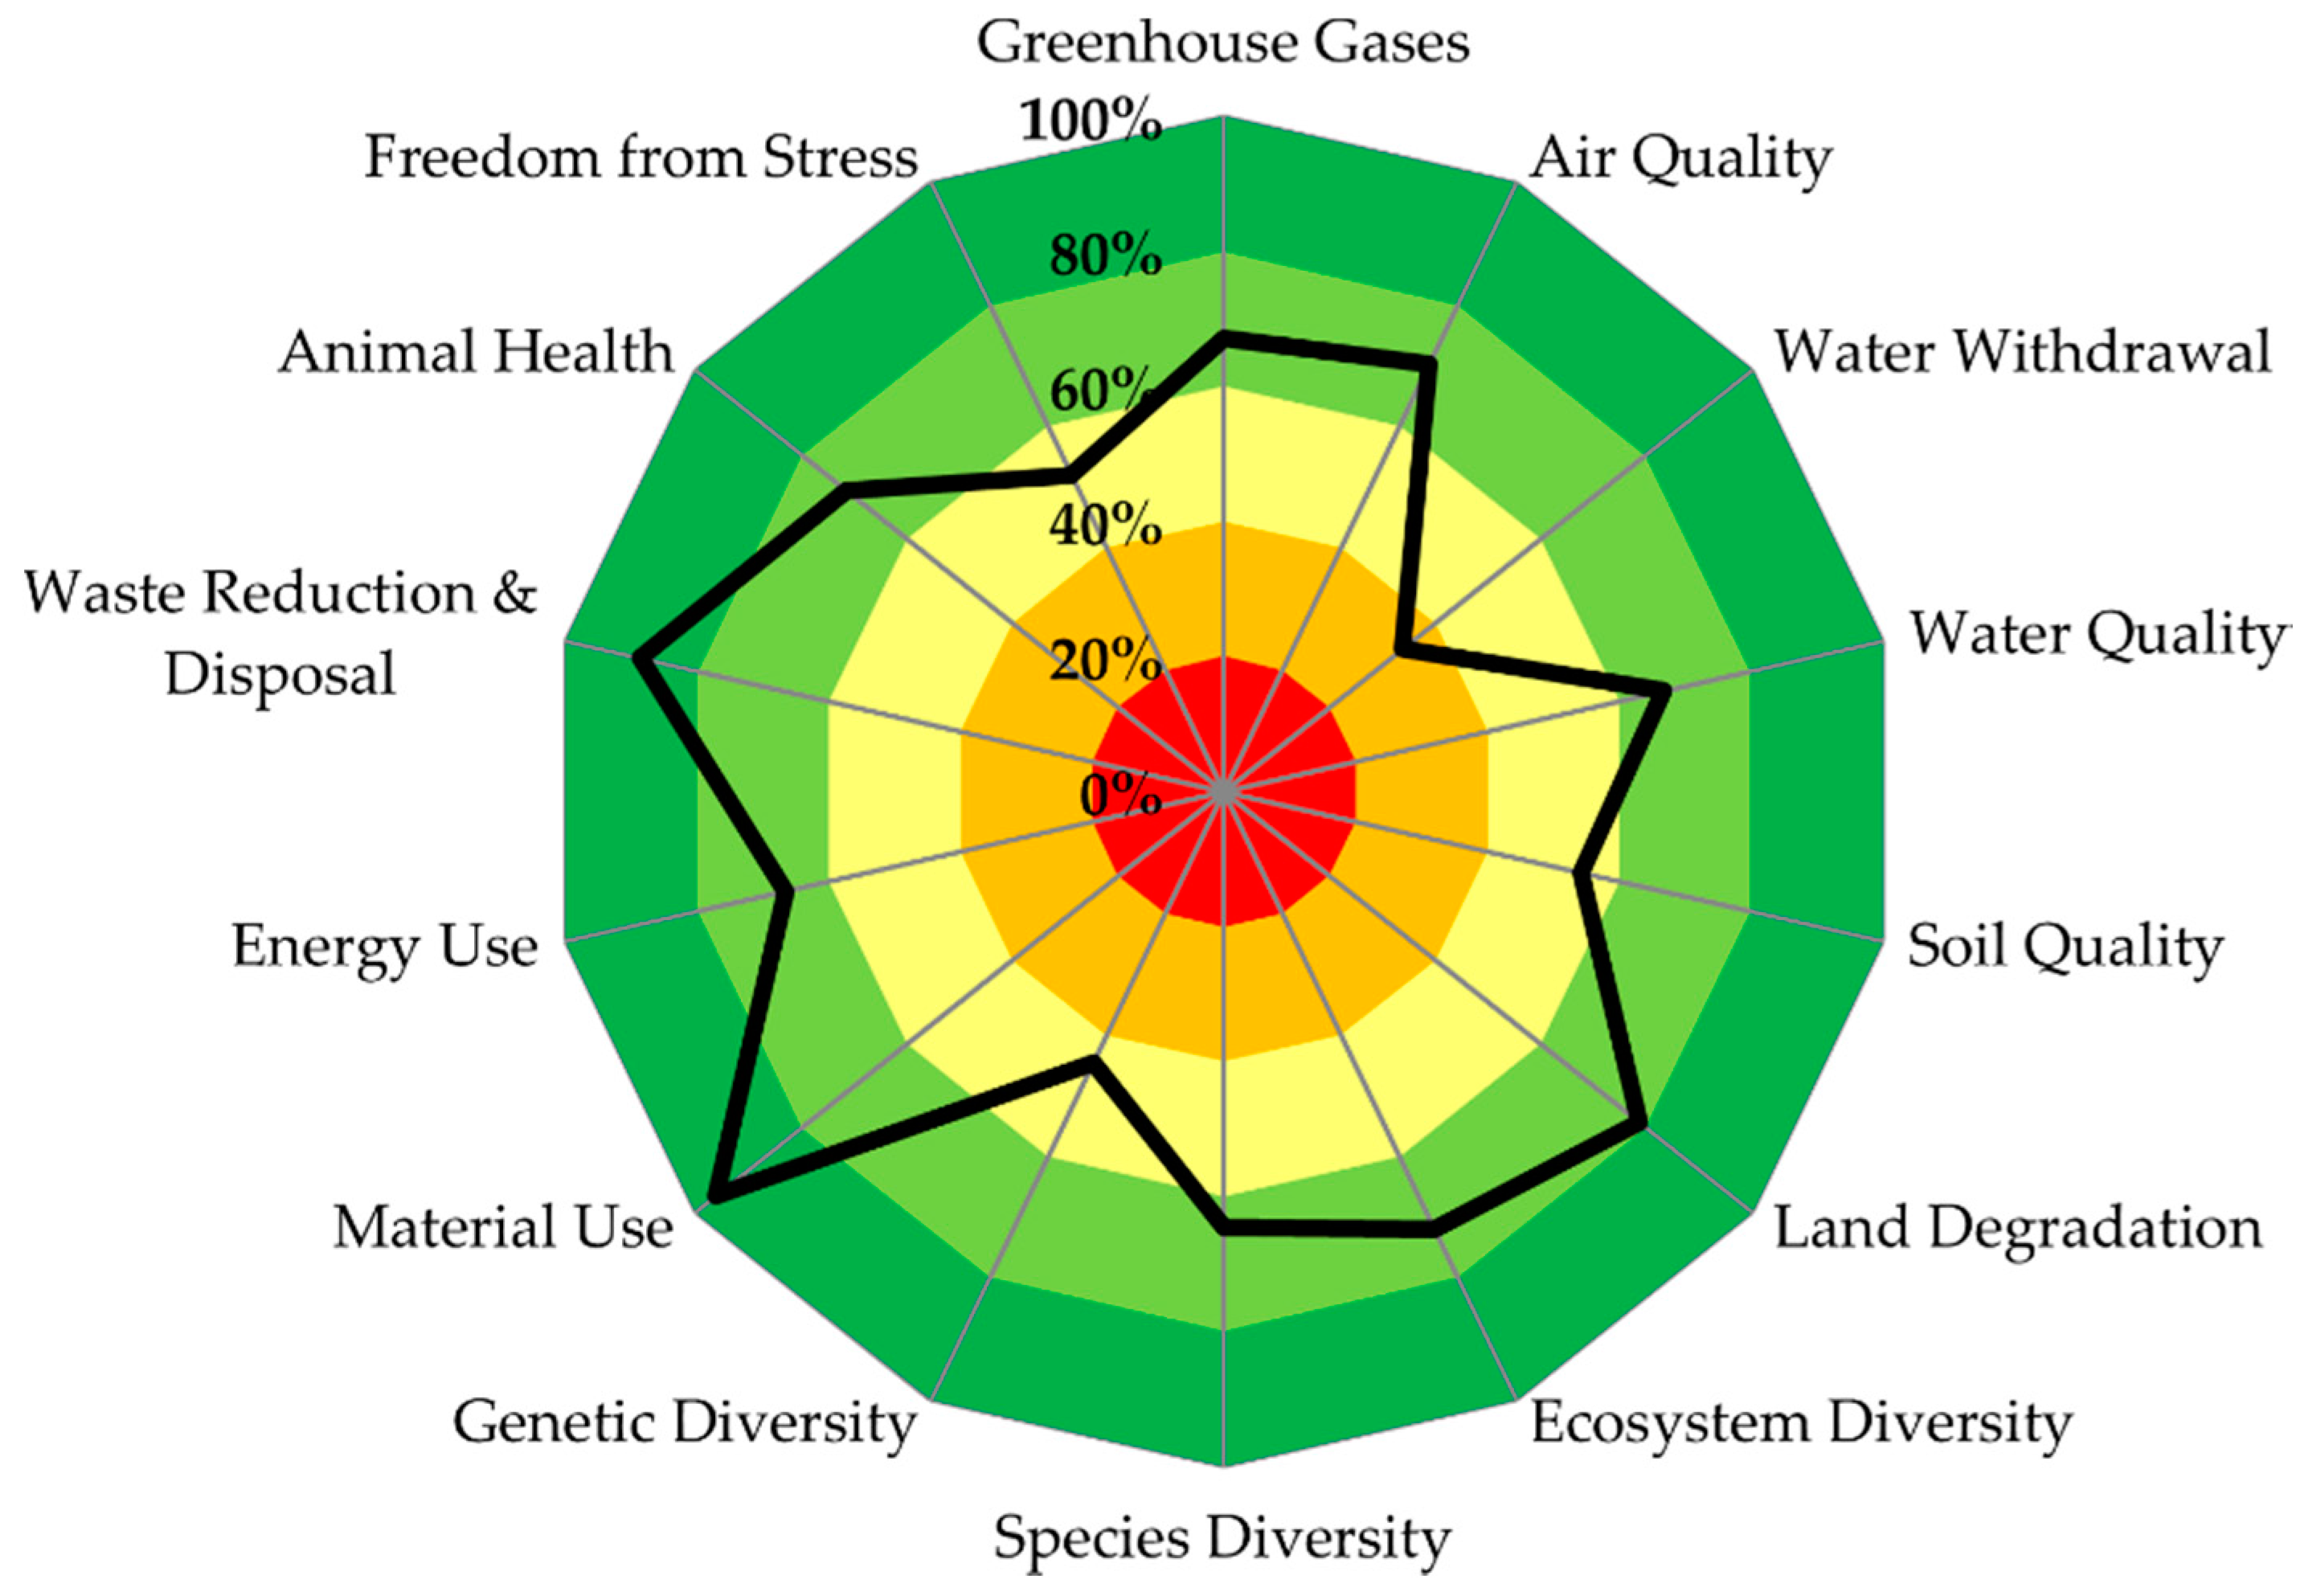
Compared to the dimension of Good Governance, environmental subthemes were on average rated higher (Figure 6). All other DGAi exceeded 40% except for the result of the subtheme Water Withdrawal (34%). The majority of the investigated canteens do not focus on reducing the water footprint of their meals while food-related water use is not part of Basel’s political agenda.
The subthemes Waste Reduction and Disposal and Material Use both scored highly with 96% and 89%, respectively. These relatively high ratings are the result of Basel’s engagement to reduce waste and promote recycling by the creation of dense network of recycling points, awareness raising campaigns on the topic of food waste, energy recovery from food waste in its partly owned biomass power generation plant, and efforts in promoting composting.
The subthemes Greenhouse Gases, Air quality, Water Quality, Soil Quality, Land Degradation, Ecosystems Diversity, Species Diversity, Genetic Diversity, Energy Use, Animal Health, and Freedom from Stress were all rated between 40% and 80%. The goal achievement of Greenhouse Gases was positively influenced by the promotion of vegetarian and seasonal meals by the investigated canteens. The latter is mirrored in accordingly formulated public invitations to tenders relating to canteen management and in the criteria of the canteen-label “Fourchette verte -Ama terra”, which is actively supported by Basel’s administration. However, climate-friendly canteen operation and transport-related emission reduction receive less attention from both the administration and canteens. In addition to the reasons that contributed to the high rating of Greenhouse Gases, the goal achievement of the subtheme Air Quality was positively impacted by the public administration’s efforts to reduce emissions of air pollutants in peri-urban agriculture. Basel also promotes organic agriculture by offering training and financial incentives, which positively influence the subtheme Water Quality. Furthermore, the connection of all households in Basel to waste water treatment plants contributes to the goal achievement. Although the promotion of organic agriculture also positively impacted the rating of Soil Quality, it was compensated by the finding that only three of the investigated canteens bought organic raw materials or products from time to time. In turn, the subtheme Land Degradation exhibited a relatively higher score because of Basel’s efforts towards increased urban densification to minimize the loss of farmland. Biodiversity is, apart from public support for organic agriculture, mainly promoted in three ways: additional financial incentives to increase biodiversity in agriculture; by investigating biodiversity in allotment gardens; and by canteens partly refraining from buying products from endangered resources. Despite these measures in canteens, rare varieties or breeds were only procured in one case, which negatively affects the rating of the subtheme Genetic Diversity. Energy Use was positively impacted by the energy recovery from food waste and the procurement of seasonal food, but negatively influenced by the neglect of canteens to optimize energy use in food transport and canteen operations. While most of the investigated canteens buy meat to a large extent from Switzerland, animal welfare labels were not considered in the procurement of animal products. Basel conducts animal welfare controls on farms and at the abattoir, but the results of these controls are not made available to the public. These findings lead to a moderate rating in the subthemes Animal Health and Freedom from Stress, while the former result is additionally positively impacted by training courses relating to animal health that are offered to farmers.
3.2.3. Economic Resilience
The results in the dimension of Economic Resilience were similar in their range to the scores in the dimension Environmental Integrity (Figure 7). The goal of the subtheme Food Safety was achieved with 90%. The rating is mainly rooted in the risk-based food safety controls along the whole agri-food-chain, for which the results are published online. These controls are complemented by a sophisticated system of ensuring the drinking water quality in Basel.
The subthemes Community Investment and Stability of Production were also rated highly with 88% and 81%, respectively. The result for Community Investment is positively impacted by Basel’s public university, which offers a study course in sustainable development and contributes with its research and projects to the knowledge related to sustainable food. With its agricultural extension center, Basel also promotes the resilience of the regional agriculture and therefore scores relatively highly in the subtheme Stability of Production.
Risk Management, Food Quality, Local Procurement, and Internal Investment ranged between 60% and 80%. Risk Management was positively impacted by Basel’s emergency concept for drinking water supply but the clearly defined responsibilities for food emergency relief do not include a written concept on how to deal with food shortages during the first days of an emergency. The rating of the subtheme Food Quality takes into account the written commitment of the majority of the investigated canteens to provide healthy food. The rating is nevertheless negatively impacted by the fact that only half of the investigated canteens follow recognized nutritional standards. Instead, canteens put more emphasize on regional procurement of food, which, together with public measures to increase the share of regional products at farmers’ markets, positively impacts the goal achievement of Local Procurement. Basel’s general efforts to promote a sustainable food system in different areas of action (policy, environmental, and health measures) lead to the relatively high rating in the case of the subtheme Internal Investment.
Value Creation and Product Information were the only subthemes rated below 60%. The rating for Value Creation can be explained by Basel promoting regional agricultural by its extension center but having neglected direct marketing in the training curriculum. When it comes to the controls of product labeling, Basel’s administration is focused on nutritional contents and only indirectly on the verification of sustainability claims, which explains the comparatively low goal achievement in the subtheme Product Information.
3.2.4. Social Well-Being
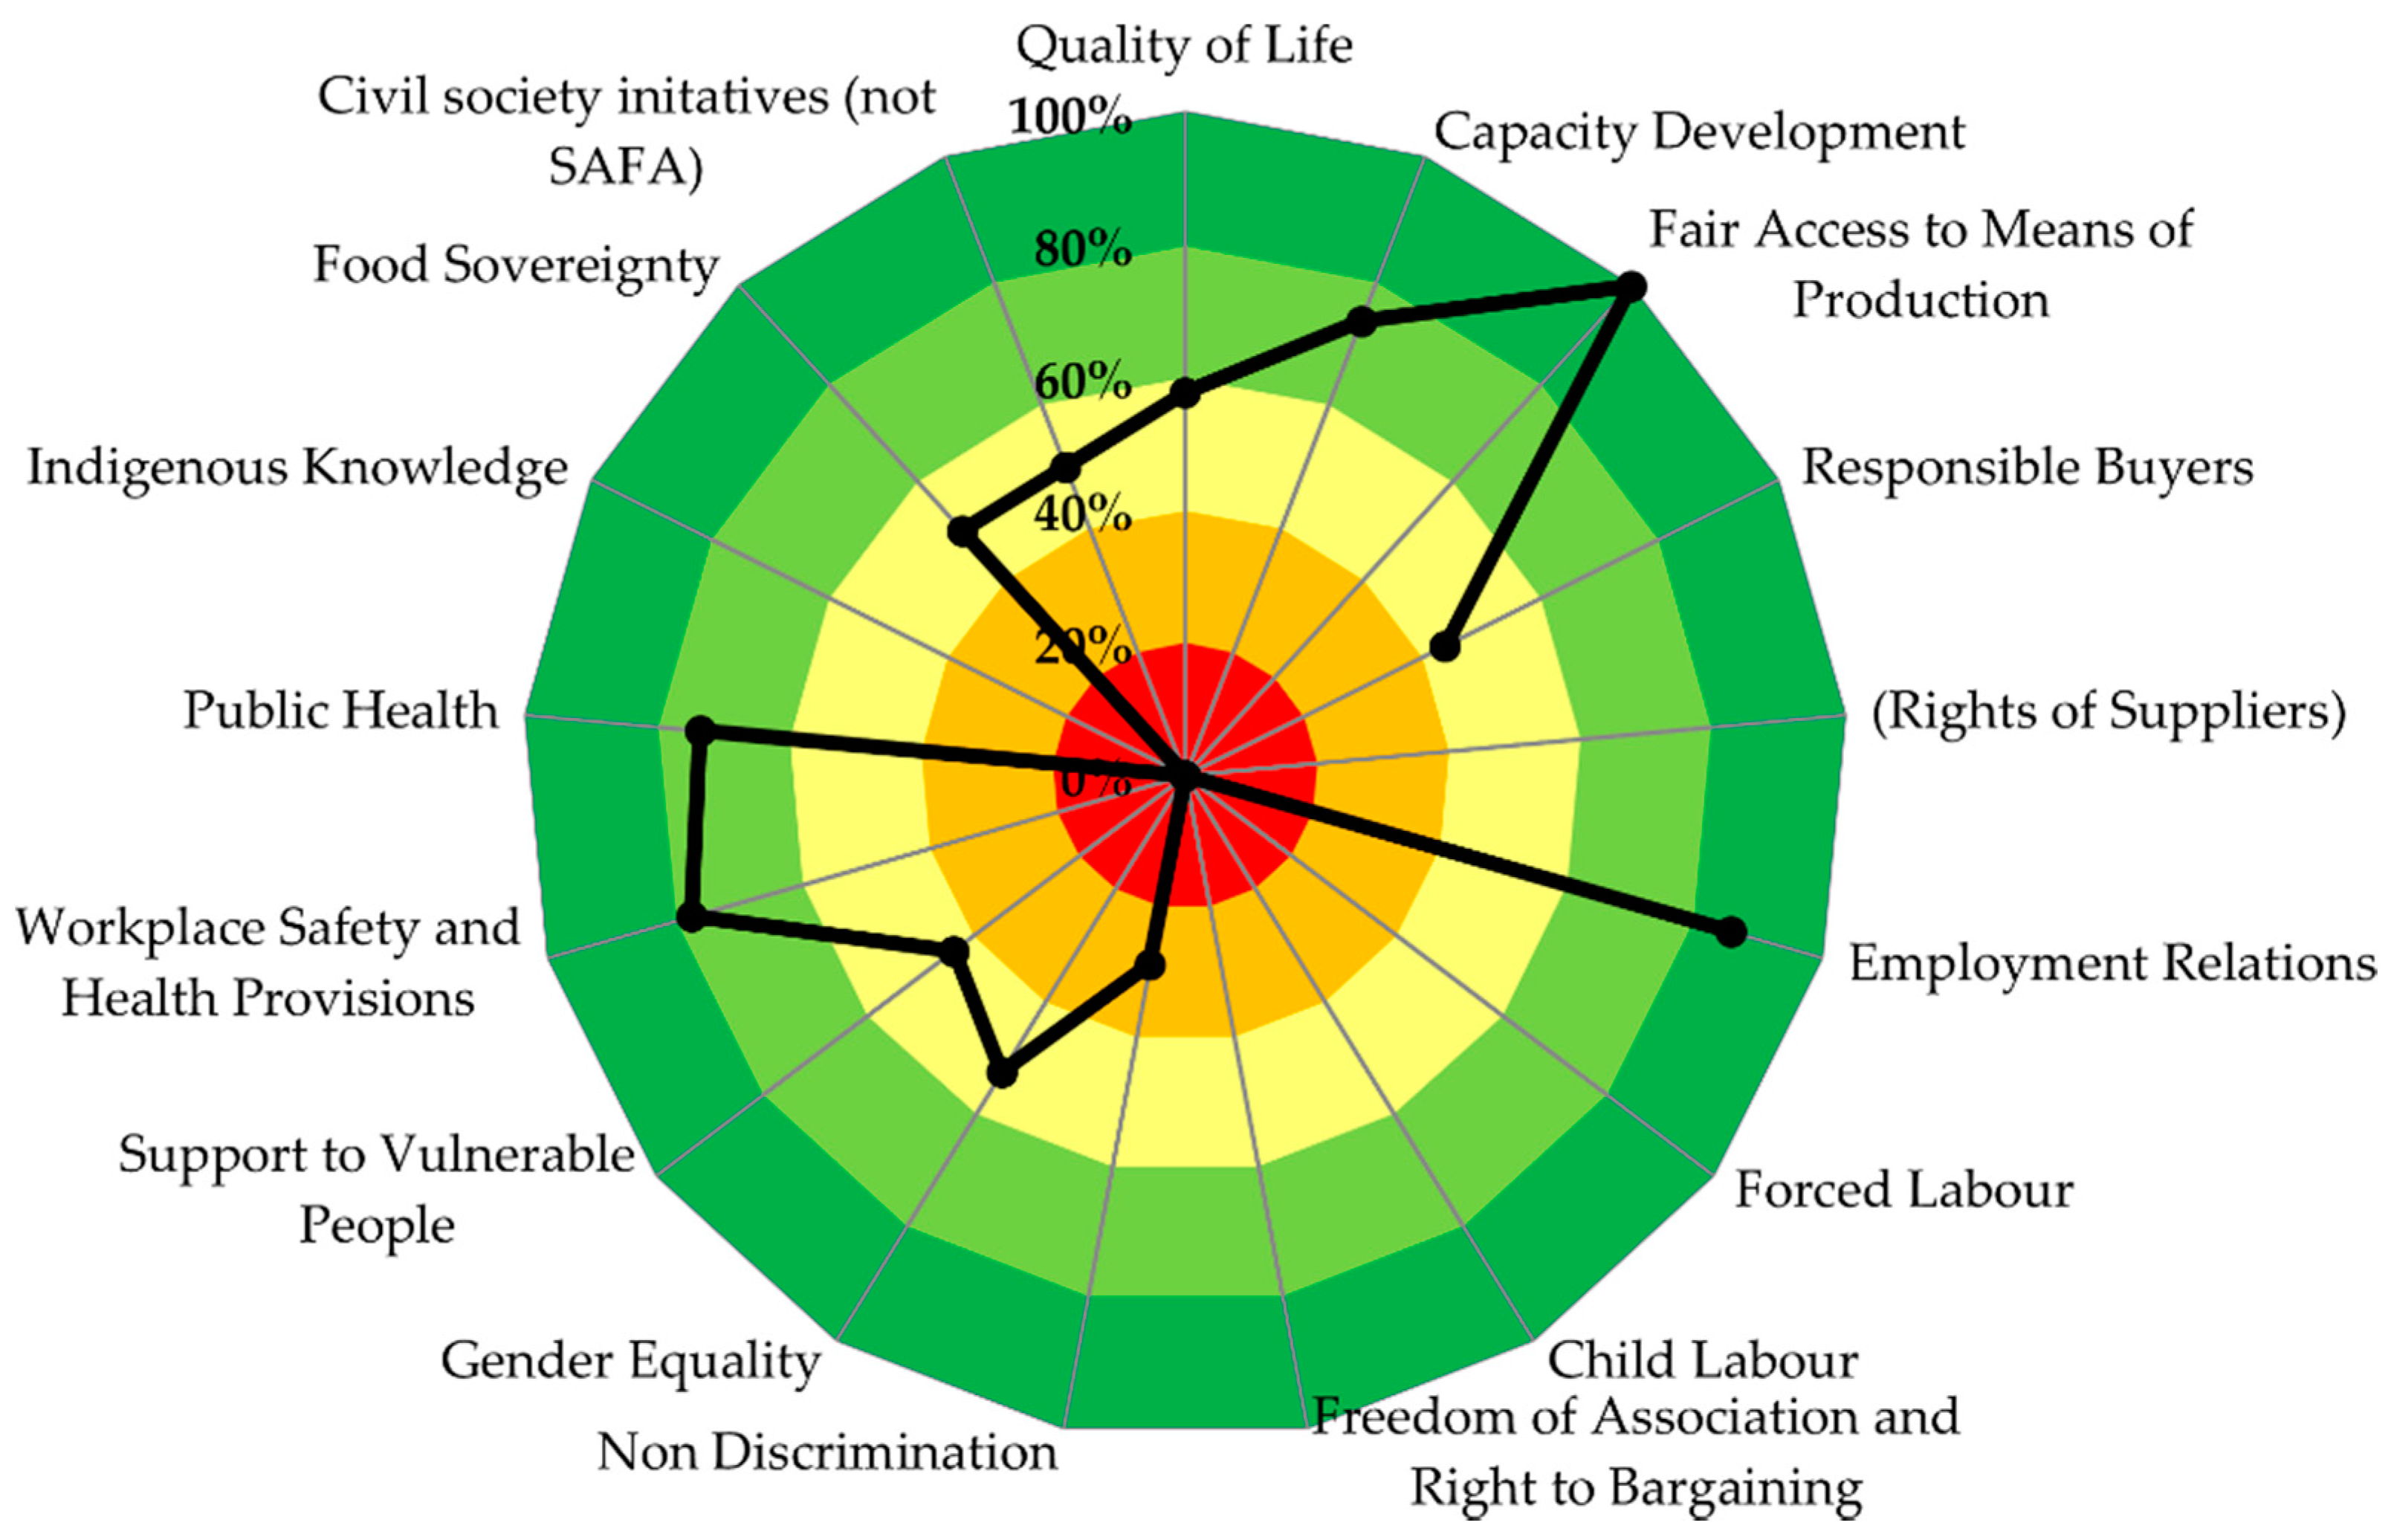
The results in the dimension: Social Well-Being range from 0 to 100% DGAi (Figure 8). The subthemes Fair Access to Means of Production and Employment Relations were both rated highly with 100% and 86%, respectively. Fair Access to Means of Production was rated highly because of Basel’s financial support for the regional agricultural extension center, which facilitates farmers’ access to know-how. The high score of the subtheme Employment Relations is rooted in risk-based labour law controls along the whole agri-food chain and that Basel defines minimum requirements for contracts in agriculture.
Also the subthemes of Workplace Safety and Health Provisions, Public Health, and Capacity Development revealed a degree of goal achievement over 70%. Basel offers tailored training to companies in the food sector on issues of workplace safety and health. Furthermore, the investigated canteens have implemented measures for occupational safety. These findings combine to explain the high score of the subtheme Workplace Safety and Health Provisions. Public Health is mainly positively affected by Basel’s target group-specific information campaigns, programs to tackle non-communicable diseases, and campaigns to promote healthy food. The subtheme Capacity Development is positively impacted by the food-related study courses at the University of Basel and the University of Applied Sciences and Arts Northwestern Switzerland, the services offered to farmers at the Basel’s regional agricultural extension center, and the number of days committed to further education by the staff of the investigated canteens.
Responsible Buyers, Gender Equality, Support to Vulnerable People, Food Sovereignty, Civil Society Initiatives, and Quality of Life each reveal a DGAi between 40% and 60%. The score of the subtheme Responsible Buyers is based on the analysis of Basel’s public procurement system. While having a central procurement department and a corresponding law, Basel defined rather weak social criteria for public procurement in which controls or audits of contractors during the duration of a contract are not common. This finding mirrors the small proportion of the investigated canteens that exclusively buy fair trade bananas, coffee, and/or tea, and leads to the comparably low rating of the subtheme Responsible Buyer. Although the proportion of female canteen managers is relatively high, less than half of the investigated canteens collected and analyzed data on equal pay or had implemented wage brackets. This is reflected in the comparably low degree of goal achievement in the case of Gender Equality. The relatively low rating of Support to Vulnerable People was mainly based on the extent to which healthy food is available to socially disadvantaged people. Although the latter receives target group-specific information on healthy food by the public information system, Basel has not conducted a mapping of fresh food stores and there were conflicting opinions held by soup kitchen managers about whether Basel provides enough healthy food to socially disadvantaged people. The comparably low degree of goal achievement of the subtheme Civil Society Initiatives can be explained by the lack of a responsible person in the public administration to coordinate and consult different initiatives and by the rather weak support of the city to provide areas and to contribute financially. Although the number of weekly hours worked by the staff of the investigated canteens is low compared to the standards of the International Labour Organization (ILO), part-time work was not found to be common. Together with the lack of fresh food mapping, this explains the rather low rating in terms of Quality of Life.
The goals of the subthemes Forced Labour, Child Labour, Freedom of Association, and Right to Bargaining were not achieved at all (DGAi = 0%) because of the weak public procurement criteria and the lack of criteria relating to the ILO core conventions dealing with these topics. The Indigenous Knowledge goal was also not achieved because Basel missed the opportunity it had to comment on the legal implementation of the Nagoya Protocol [51] into Swiss federal law. The subtheme Non Discrimination returned a slightly better score of 29% because Basel’s procurement law requires proof of equality between men and women from contractors.
4. Discussion
4.1. Assessment Model
4.1.1. Analytical Framework
We found that SAFA, despite its focus on farms and businesses, provided a suitable framework for assessing the sustainability of urban food system governance. Due to its focus on food, it covers a wide range of food-related sustainability topics. The finding that not all the subthemes could be adapted to the urban context was mainly due to the mixed-perspective approach of SAFA, which considers both the business and societal perspectives of sustainability. The subthemes that were based on a societal perspective proved to be more readily transferable, although with two notable exceptions. The subtheme Remedy, Restoration and Prevention would have needed to be adapted to relate to the city’s legal system and therefore would have failed the criterion of being food-focused. The subtheme Rights of Suppliers analyses buyer-supplier relations but, as there are a multitude of buyer-supplier relations in the urban food system which are not only defined by law, but also depend on the specific procurement context, adapting the subtheme Rights of Suppliers would have yielded ambiguous results.
The subthemes Long-Ranging Investment, Profitability, Stability of Supply, Stability of Market, and Liquidity were all based on the business perspective and could not be adapted to the context of an urban food system. The business perspective is difficult to adapt because it is oriented towards defining the sustainability of business operations. Given the system boundaries applied in this study, this would have meant analyzing the economic resilience of the city itself, which would have gone beyond the scope of this study and also meant that the subtheme goals would not have had a focus on food topics.
4.1.2. Indicators
While the system boundaries influenced the adaptability of the SAFA guidelines, they also created the major difference between this study and other approaches with a similar thematic scope. This is especially true for the mostly quantitative studies by DEFRA [14] and Gustafson et al. [15], as well as the report by Ellsworth et al. [16] on the San Diego county food system. These studies [14,15,16] focused on driver-related indicators, such as food prices in the case of the DEFRA study [14], pressures, such as per capita land use in the case of the model from Gustafson et al. [15], and states, such as the number of polluted waterways in the San Diego region [16]. The system boundaries defined in this study had the effect that most of the indicators were response-related rather than driver, pressure, or state-related. The advantage of having mostly response-related indicators is that data can be obtained with a reasonable investment of time and effort. Additionally, this type of indicator is crucial in reaching the goal of this study, i.e., assessing the sustainability of food system governance. The indicators allowed us to describe the processes and policies in the food system and to disclose potential areas of action, which is intended to start a discussion on how to further improve the sustainability of urban food systems. Nevertheless, decision makers still need to analyze the results of the assessment in the context of their urban food system because the weaknesses revealed by the assessment are neither evaluated in the sense of a cost-effectiveness analysis nor do they consider the political or societal acceptance. The neglect of political or societal acceptance also applies to the other, more quantitative, approaches but those approaches can be used for monitoring the effectiveness of implemented policies while the approach presented in this study has its strength instead in gaining a first picture of the food system governance and potential areas of action.
The response-related indicators cover a wide range of different aspects in the food system. The two roles of local administration and politics on which the indicators are based correspond with the analytical framework of Wiskerke [52], who considers local government to be both a market and food policy actor. The broadly defined indicator scales mean that a majority of the indicators can be expected to be globally applicable but the indicators are based on the assumption that a city has a high level of political sovereignty and that financial and human resources are available to implement and monitor measures, which might limit the applicability in some contexts.
The Environmental Integrity dimension revealed the highest number of impacts by the indicators, while the indicator coverage for Economic Resilience could be further improved by also taking new indicators related to the local food processing industry into account. For example, the local food processing industry has the potential to strengthen primary production in the region by buying local raw materials. Furthermore, by taking farmers’ markets as the only form of direct marketing in the indicator set, the term “direct marketing” has possibly been too narrowly defined. In addition to farmers’ markets, other centralized direct marketing systems may be present, such as food hubs for institutional buyers [53] or platforms for direct farmer-to-consumer sales.
The application of the approach in the case of Basel’s urban food system shed light on critical areas, which was also recognized by the local administration with the results being taken as a basis for its ongoing discussion on how to improve the sustainability of the food system. The strength of the results, the disclosure of potential areas of action, and the adaptability of the response-related indicators suggest that this approach is suitable for application in other urban food systems, although some further development with regard to the Economic Resilience dimension, as proposed above, is recommended. To address the new food systems context, the identification of structural aspects of a target city’s food system needs to be undertaken. Once the necessary contextual information has been collected, interviews can be planned based on the stratified sampling approaches; using probabilistic sampling to render the aggregated results more robust. The results can readily be used for identifying potential areas of action and, in consultation with stakeholders, for implementing both action and a cost-effective monitoring system.
4.2. Assessment of Basel’s Urban Food System Governance
The results of the assessment of Basel’s urban food system governance yielded transparent results which can be used as the basis for further policy development. Several of the various measures to improve the sustainability performance of the urban food system have already been implemented: especially in the Environmental Integrity dimension. However, the low scores in the Good Governance dimension indicate that there is a lack of coordination and monitoring of these measures. Furthermore, the external impacts of Basel’s food system have not yet been considered in decision making, which could be especially helpful for prioritizing measures.
The results in the economic sustainability dimension show that Basel improves the resilience of the urban food system through its investments in education and training. Resilience is further supported by the detailed controls of food and strategies in the case of emergency. The rather low scores in some subthemes in the Social Well-Being dimension can be explained by the public-procurement processes which include only a few social criteria. This corresponds to the finding that the external costs are not yet being considered entirely.
5. Conclusions
The assessment yielded a broad overview of the city’s policies and implemented measures with regard to a sustainable food system. The indicators used—which are based on policies and measures related to processes within the urban food system on which the public administration and local politics have (potential) influence—present a contrast with other methods, which mostly focus more directly on the drivers, pressures, states, and impacts themselves. It is possible to conduct an analysis within a limited amount of time because the assessment is based on easily available data. The results of the assessment are thematically comprehensive, easy to understand, and directly indicate future areas of action because they focus on existing policies described in the literature and directly address politics and the local administration. In particular, the approach provides guidance for targeting the challenges that the sustainable development goals are addressing. In the case of Basel, the assessment yielded concrete suggestions for public administration and local politics on how to move in the direction of a more sustainable food system. The identified weaknesses included the lack of strategic planning and transparency within the food system and the rather weak public procurement criteria.
The assessment approach appears to be readily adapted to different cities: especially if the content improvements that we have suggested are implemented. The prerequisites for application in other contexts are that the target cities have a high degree of political sovereignty and the financial capacity to implement measures. While the assessment can be the start of a process to make a city’s food system more sustainable, the measures derived from the assessment should be evaluated in terms of cost-effectiveness and the implementation of measures should be monitored with the aid of selected quantitative indicators. The wide applicability of the assessment approach also enables the comparison of results between different cities, which may facilitate co-operation between cities as intended by the MUFPP.
Supplementary Materials
The following are available online at www.mdpi.com/2071-1050/9/4/490/s1, Table S1: Original and adapted subtheme goals, Table S2: List of indicators, Table S3: List of indicator ratings.
Acknowledgments
This research has been financed by the Swiss State Secretariat for Education, Research and Innovation SERI, under the COST Action “Urban Agriculture in Europe” (TD 1106). We want to thank the experts Rebekka Frick, Lukas Baumgart, and Anja Heidenreich who contributed to the gathering of data and the further development of the assessment model. We express our gratitude to Robert Home whose corrections improved the comprehensibility of the paper. We are also grateful for the valuable inputs for the indicator development by the stakeholder group: Conradin Bolliger, René Bourquin, Manuel Crain, Christophe Eggenschwiler, Lisa Eggenschwiler, Urs Guyer, Johanna Gysi, Markus Hurschler, Stefanie Kaiser, Dominik Keller, Lukas Kilcher, Tilla Künzli, Martin Lüchinger, Toni Mathis-Dürring, Simona Matt, Heinz Müller, and Nadia Pecoraro. We furthermore thank the two anonymous reviewers whose comments improved the comprehensibility of the paper and Olivia Lewis for the proofreading.
Author Contributions
Jan Landert, Christian Schader, Heidrun Moschitz, and Matthias Stolze designed the study; Jan Landert, Christian Schader, and Heidrun Moschitz developed the indicator set and wrote the paper.
Conflicts of Interest
The authors declare no conflict of interest.
References
- United Nations, Department of Economic and Social Affairs. Population Division World Urbanization Prospects: The 2014 Revision; United Nations, Department of Economic and Social Affairs: New York, NY, USA, 2015. [Google Scholar]
- Grimm, N.B.; Faeth, S.H.; Golubiewski, N.E.; Redman, C.L.; Wu, J.G.; Bai, X.M.; Briggs, J.M. Global change and the ecology of cities. Science 2008, 319, 756–760. [Google Scholar] [CrossRef] [PubMed]
- McKinney, M.L. Urbanization, biodiversity, and conservation. Bioscience 2002, 52, 883–890. [Google Scholar] [CrossRef]
- Godfray, H.C.J.; Crute, I.R.; Haddad, L.; Lawrence, D.; Muir, J.F.; Nisbett, N.; Pretty, J.; Robinson, S.; Toulmin, C.; Whiteley, R. The future of the global food system. Philos. Trans. R. Soc. B Biol. Sci. 2010, 365, 2769–2777. [Google Scholar] [CrossRef] [PubMed]
- Satterthwaite, D.; McGranahan, G.; Tacoli, C. Urbanization and its implications for food and farming. Philos. Trans. R. Soc. B 2010, 365, 2809–2820. [Google Scholar] [CrossRef] [PubMed]
- Dixon, J.; Omwega, A.M.; Friel, S.; Burns, C.; Donati, K.; Carlisle, R. The Health Equity Dimensions of Urban Food Systems. J. Urban Health 2007, 84, 118–129. [Google Scholar] [CrossRef] [PubMed]
- Pothukuchi, K.; Kaufman, J.L. Placing the food system on the urban agenda: The role of municipal institutions in food systems planning. Agric. Hum. Values 1999, 16, 213–224. [Google Scholar] [CrossRef]
- Blay-Palmer, A. The Canadian Pioneer: The Genesis of Urban Food Policy in Toronto. Int. Plan. Stud. 2009, 14, 401–416. [Google Scholar] [CrossRef]
- Morgan, K. Nourishing the city: The rise of the urban food question in the Global North. Urban Stud. 2015, 52, 1379. [Google Scholar] [CrossRef]
- Wiskerke, J.S.; Viljoen, A. Sustainable Urban Food Provisioning: Challenges for Scientists, Policymakers, Planners, and Designers. In Sustainable Food Planning: Evolving Theory and Practice; Wageningen Academic Publishers: Wageningen, The Netherlands, 2012. [Google Scholar]
- Milan Urban Food Policy Pact. Available online: http://www.foodpolicymilano.org/en/urban-food-policy-pact-2/?platform=hootsuite (accessed on 20 March 2017).
- Blay-Palmer, A.; Renting, H.; Dubbeling, M. City-Region Food Systems. A Literature Review; RUAF Foundation: Leusden, The Netherlands, 2015. [Google Scholar]
- Prosperi, P.; Moragues-Faus, A.; Sonnino, R.; Devereux, C. Measuring Progress Towards Sustainable Food Cities: Sustainability and Food Security Indicators—Report of the ESRC Financed Project “Enhancing the Impact of Sustainable Urban Food Strategies ”. Available online: http://sustainablefoodcities.org/getstarted/developingindicators (accessed on 20 March 2017).
- Department for Environment, Food and Rural Affairs (DEFRA). Indicators for a Sustainable Food System; DEFRA: York, UK, 2011.
- Gustafson, D.; Gutman, A.; Leet, W.; Drewnowski, A.; Fanzo, J.; Ingram, J. Seven Food System Metrics of Sustainable Nutrition Security. Sustainability 2016, 8, 196. [Google Scholar] [CrossRef]
- Ellsworth, S.; Feenstra, G. Assessing the San Diego County Food System: Indicators for A More Food Secure Future; Sustainable Agriculture Research and Education Program, and Agricultural Sustainability Institute: Davis, CA, USA, 2010. [Google Scholar]
- DPVRC. Greater Philadelphia Food System Assessment Study; Delaware Valley Regional Planning Commission: Philadelphia, PA, USA, 2010. [Google Scholar]
- Carey, J. Who Feeds Bristol? Towards A Resilient Food Plan. Available online: https://www.fibl.org/fileadmin/documents/de/news/2015/SUPURBFOOD_Handout_A-resilient-food-system-plan-for-Bristol_Zurich_16Jan2015.pdf (accessed on 20 March 2017).
- Wascher, D.M.; Jeurissen, L.J.J.; Zasada, I.; Doernberg, A.; Piorr, A.; Sali, G.; Corsi, S.L.; Monaco, F.; Schmutz, U.; de Kroes, J.; et al. Tools & Methods. In Food Planning and Innovations for Sustainable Metropolitan Regions—Synthesis Report; Wascher, D.M., Kneafsey, M., Piorr, A., Eds.; Wageningen University Research: Wageningen, The Netherlands, 2015. [Google Scholar]
- Kremer, P.; DeLiberty, T.L. Local food practices and growing potential: Mapping the case of Philadelphia. Appl. Geogr. 2011, 31, 1252–1261. [Google Scholar] [CrossRef]
- Smeets, E.; Weterings, R. Environmental Indicators: Typology and Overview; European Environment Agency (EEA): Copenhagen, Denmark, 1999. [Google Scholar]
- Food and Agriculture Organization of the United Nations (FAO). SAFA Sustainability Assessment of Food and Agriculture Systems—Guidelines Version 3.0; Food and Agriculture Organization of the United Nations (FAO): Rome, Italy, 2014. [Google Scholar]
- Schader, C.; Grenz, J.; Meier, M.S.; Stolze, M. Scope and precision of sustainability assessment approaches to food systems. Ecol. Soc. 2014, 19, 42. [Google Scholar] [CrossRef]
- Dodgson, J.; Spackman, M.; Pearman, A.; Phillips, L. Multi-Criteria Analysis: A Manual. Available online: http://eprints.lse.ac.uk/12761/1/Multi-criteria_Analysis.pdf (accessed on 20 March 2017).
- Schader, C.; Baumgart, L.; Landert, J.; Muller, A.; Ssebunya, B.; Blockeel, J.; Weisshaidinger, R.; Petrasek, R.; Mészáros, D.; Padel, S.; et al. Using the Sustainability Monitoring and Assessment Routine (SMART) for the Systematic Analysis of Trade-Offs and Synergies between Sustainability Dimensions and Themes at Farm Level. Sustainability 2016, 8, 274. [Google Scholar] [CrossRef]
- Linstone, H.A.; Turoff, M. The Delphi Method: Techniques and Applications; Addison-Wesley Reading: Boston, MA, USA, 1975; Volume 29. [Google Scholar]
- Bundesamt für Statistik, Ständige Wohnbevölkerung nach Staatsangehörigkeitskategorie, Alter und Kantone (German Only). Available online: https://www.bfs.admin.ch/bfs/de/home/statistiken/bevoelkerung. assetdetail.252469.html (accessed on 4 November 2016).
- Kanton Basel-Stadt, Basel kompakt (German Only). Available online: http://www.statistik.bs.ch/haeufig-gefragt/basel-kompakt.html (accessed on 14 January 2017).
- Kanton Basel-Stadt, Betriebe in Basel-Stadt (German Only). Available online: http://www.aue.bs.ch/landwirtschaft/betriebe-basel-stadt.html (accessed on 4 November 2016).
- Bundesamt für Statistik, Arbeitsstätten und Beschäftigte nach Kanton, Wirtschaftsart und Grössenklasse (German Only). Available online: https://www.pxweb.bfs.admin.ch/Selection.aspx? px_language=de&px_db=px-x-0602010000_103&px_tableid=px-x-0602010000_103\px-x-0602010000_103.px&px_type=PX (accessed on 4 November 2016).
- Kanton Basel-Stadt, Beschäftigte (German Only). Available online: http://www.statistik.bs.ch/zahlen/tabellen/3-erwerbsleben/beschaeftigte.html (accessed on 4 November 2016).
- Kanton Basel-Stadt. Verfassung des Kantons Basel-Stadt, Stand 29.02.2016 (German Only); Kanton Basel-Stadt: Basel, Switzerland, 2016. [Google Scholar]
- Kanton Basel-Stadt. Nachhaltigkeitsbericht 2013 (German Only); Kanton Basel-Stadt: Basel, Switzerland, 2013. [Google Scholar]
- Schweizerisches Gesundheitsobservatorium. Gesundheitsreport Kanton Basel-Stadt. Standardisierte Auswertungen der Schweizerischen Gesundheitsbefragung 2012 und weiterer Datenbanken (Obsan Dossier 31) (German Only); Schweizerisches Gesundheitsobservatorium (Obsan): Neuchâtel, Switzerland, 2014. [Google Scholar]
- Kanton Basel-Stadt. Bericht der Geschäftsprüfungskommission des Grossen Rates des Kantons Basel-Stadt zum Jahresbericht 2014 Sowie Über Besondere Wahrnehmungen. (German Only); Kanton Basel-Stadt: Basel, Switzerland, 2015. [Google Scholar]
- Kanton Basel-Stadt. Bericht der Geschäftsprüfungskommission des Grossen Rates des Kantons Basel-Stadt zum Jahresbericht 2013 Sowie Über Besondere Wahrnehmungen. (German Only); Kanton Basel-Stadt: Basel, Switzerland, 2014. [Google Scholar]
- Kanton Basel-Stadt. Bericht der Geschäftsprüfungskommission des Grossen Rates des Kantons Basel-Stadt zum Jahresbericht 2012 Sowie Über Besondere Wahrnehmungen. (German Only); Kanton Basel-Stadt: Basel, Switzerland, 2013. [Google Scholar]
- Kanton Basel-Stadt. Bericht der Geschäftsprüfungskommission des Grossen Rates des Kantons Basel-Stadt zum Jahresbericht 2011 Sowie Über Besondere Wahrnehmungen. (German Only); Kanton Basel-Stadt: Basel, Switzerland, 2012. [Google Scholar]
- Kanton Basel-Stadt. Bericht der Geschäftsprüfungskommission des Grossen Rates des Kantons Basel-Stadt zum Jahresbericht 2010 Sowie Über Besondere Wahrnehmungen. (German only); Kanton Basel-Stadt: Basel, Switzerland, 2011. [Google Scholar]
- Kanton Basel-Stadt. Handbuch Tagesstrukturen der Volksschulen im Kanton Basel-Stadt (German Only); Kanton Basel-Stadt: Basel, Switzerland, 2013. [Google Scholar]
- Kanton Basel-Stadt. Verpflegung Für Tagesstrukturen Der Primarstufe Der Stadt Basel (German Only); Erziehungsdepartement des Kantons Basel-Stadt Volksschulen, Ed.; Kanton Basel-Stadt: Basel, Switzerland, 2014. [Google Scholar]
- Kanton Basel-Stadt. Jahresbericht 2015 (German Only); Kanton Basel-Stadt: Basel, Switzerland, 2016. [Google Scholar]
- Landwirtschaftliches Zentrum Ebenrain. Kurse & Weiterbildung 2015/2016 (German Only); Landwirtschaftliches Zentrum Ebenrain: Sissach, Switzerland, 2015. [Google Scholar]
- Kantonales Laboratorium Basel-Stadt. Jahresbericht 2014 (German Only); Kanton Basel-Stadt: Basel, Switzerland, 2015. [Google Scholar]
- Kantonales Laboratorium Basel-Stadt. Jahresbericht 2013 (German Only); Kanton Basel-Stadt: Basel, Switzerland, 2014. [Google Scholar]
- Kanton Basel-Stadt. Gesetz über öffentliche Beschaffungen (Beschaffungsgesetz), Stand 04.03.2010 (German ONLY); Kanton Basel-Stadt: Basel, Switzerland, 2010; Volume 914.100. [Google Scholar]
- Kanton Basel-Stadt. Verordnung Zum Gesetz Über Öffentliche Beschaffungen (Beschaffungsverordnung, VöB), Stand 01.01.2016 (German Only); Kanton Basel-Stadt: Basel, Switzerland, 2016; Volume 914.110. [Google Scholar]
- Kanton Basel-Stadt. Gesetz Betreffend Die Beauftragte/den Beauftragten Für Das Beschwerdewesen (Ombudsfrau/Ombudsmann) des Kantons Basel-Stadt, Stand 28.04.2013 (German Only); Kanton Basel-Stadt: Basel, Switzerland, 2013; Volume 152.900. [Google Scholar]
- Pensionskasse Basel-Stadt. Anlagereglement (German Only); Pensionskasse Basel-Stadt: Basel, Switzerland, 2015. [Google Scholar]
- Urban Agriculture Basel: Alle Projekte. Available online: http://urbanagriculturebasel.ch/project_category/projekte/ (accessed on 28 October 2016).
- Kamau, E.C.; Fedder, B.; Winter, G. The Nagoya Protocol on access to genetic resources and benefit sharing: What is new and what are the implications for provider and user countries and the scientific community? Law Dev. J. (LEAD) 2010, 6, 248–263. [Google Scholar]
- Wiskerke, J.S.C. On Places Lost and Places Regained: Reflections on the Alternative Food Geography and Sustainable Regional Development. Int. Plan. Stud. 2009, 14, 369–387. [Google Scholar] [CrossRef]
- Knigge, L.; Brimlow, J.N.; Metcalf, S.S. Food Hubs: Connecting Farms with Local and Regional Markets. In Urban Sustainability: Policy and Praxis; Gatrell, J.D., Jensen, R.R., Patterson, M.W., Hoalst-Pullen, N., Eds.; Springer International Publishing: Cham, Switzerland, 2016; pp. 169–184. [Google Scholar]
Figure 1.
System boundaries of the study. Other actors than public administration and politics are not explicitly depicted but are represented by the food system’s processes shown in the figure.
Figure 1.
System boundaries of the study. Other actors than public administration and politics are not explicitly depicted but are represented by the food system’s processes shown in the figure.

Figure 2.
The 21 themes and 58 subthemes of the Sustainability Assessment of Food and Agriculture (SAFA) Guidelines. Those subthemes with grey colored background have been omitted for this study whereas the subtheme Civil Society Initiatives (green colored background) has been added to the existing SAFA subthemes (see Section 3.1.1). Source: Adapted from [22].
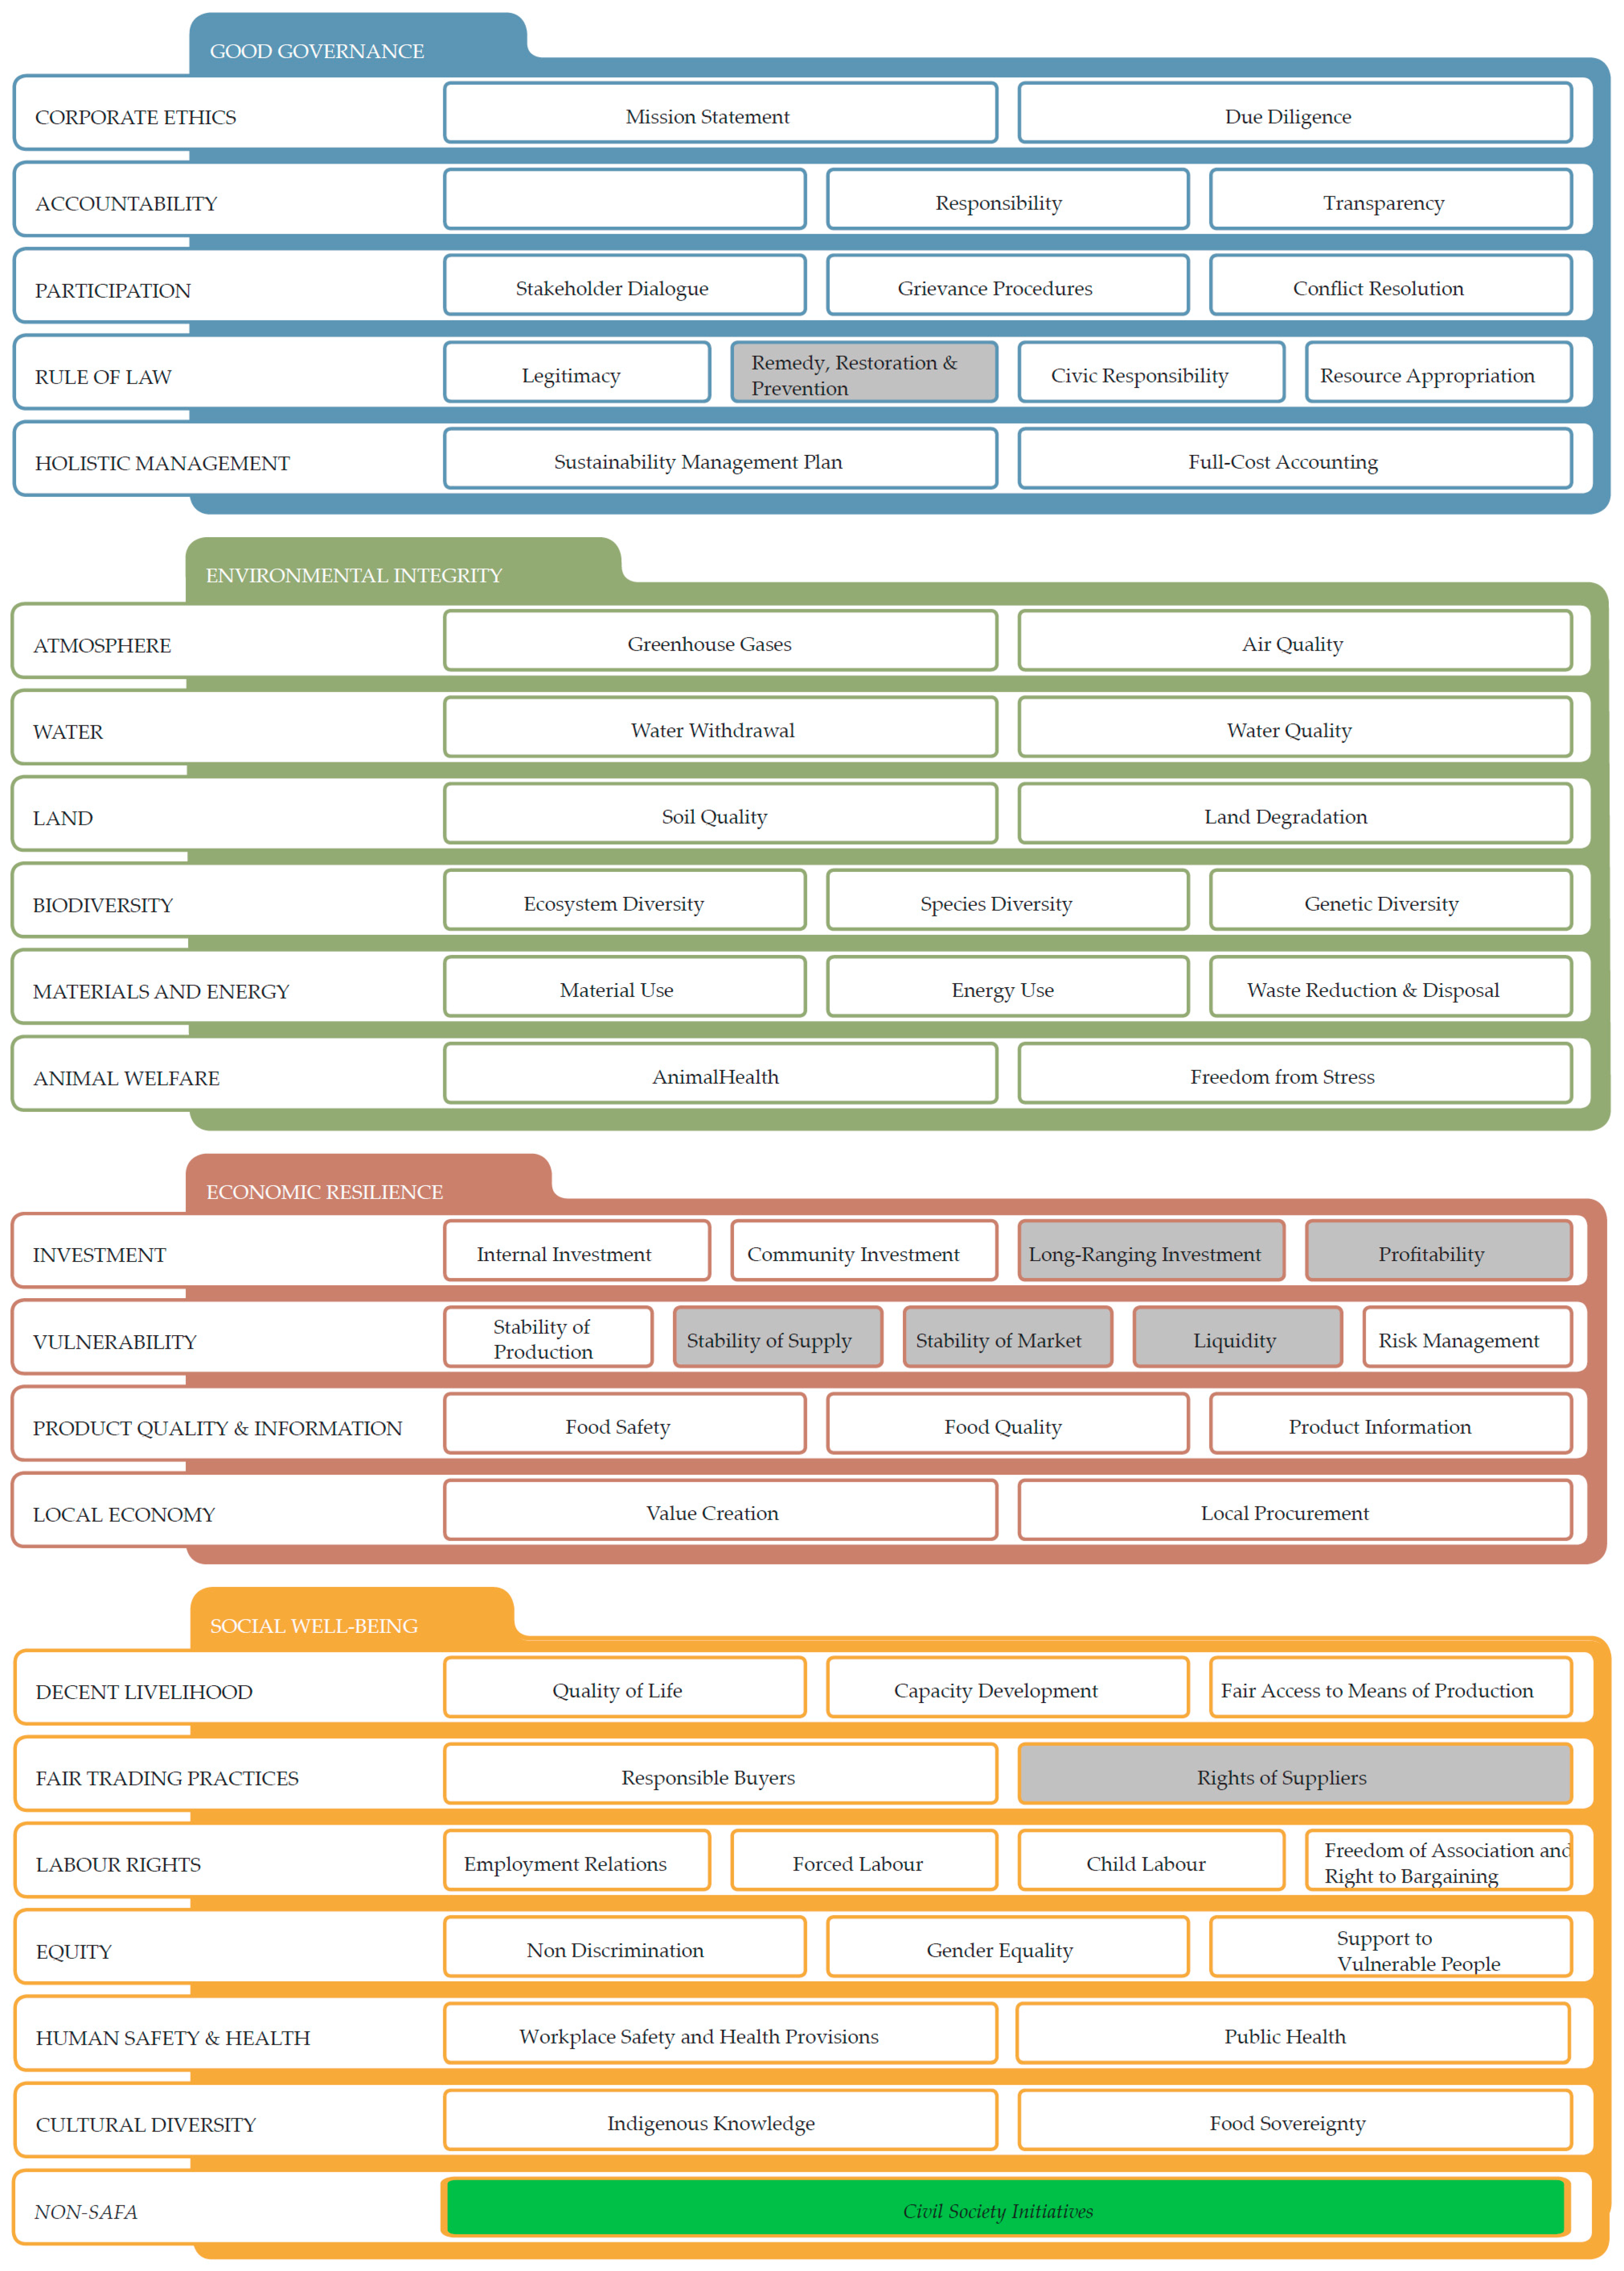
Figure 3.
Sampling process of canteens.

Figure 4.
Number of indicators impacting the goal achievement of the subthemes depicted by role.

Figure 5.
Results (degree of goal achievement, DGAi) of the SAFA-Dimension Good Governance. The subtheme in parentheses (Remedy, Restoration, & Prevention) could not be adapted to the context of the urban food system.
Figure 5.
Results (degree of goal achievement, DGAi) of the SAFA-Dimension Good Governance. The subtheme in parentheses (Remedy, Restoration, & Prevention) could not be adapted to the context of the urban food system.

Figure 6.
Results (DGAi) of the SAFA-Dimension Environmental Integrity.

Figure 7.
Results (DGAi) of the SAFA-Dimension Economic Resilience. The subthemes in parentheses could not be adapted to the context of the urban food system.
Figure 7.
Results (DGAi) of the SAFA-Dimension Economic Resilience. The subthemes in parentheses could not be adapted to the context of the urban food system.
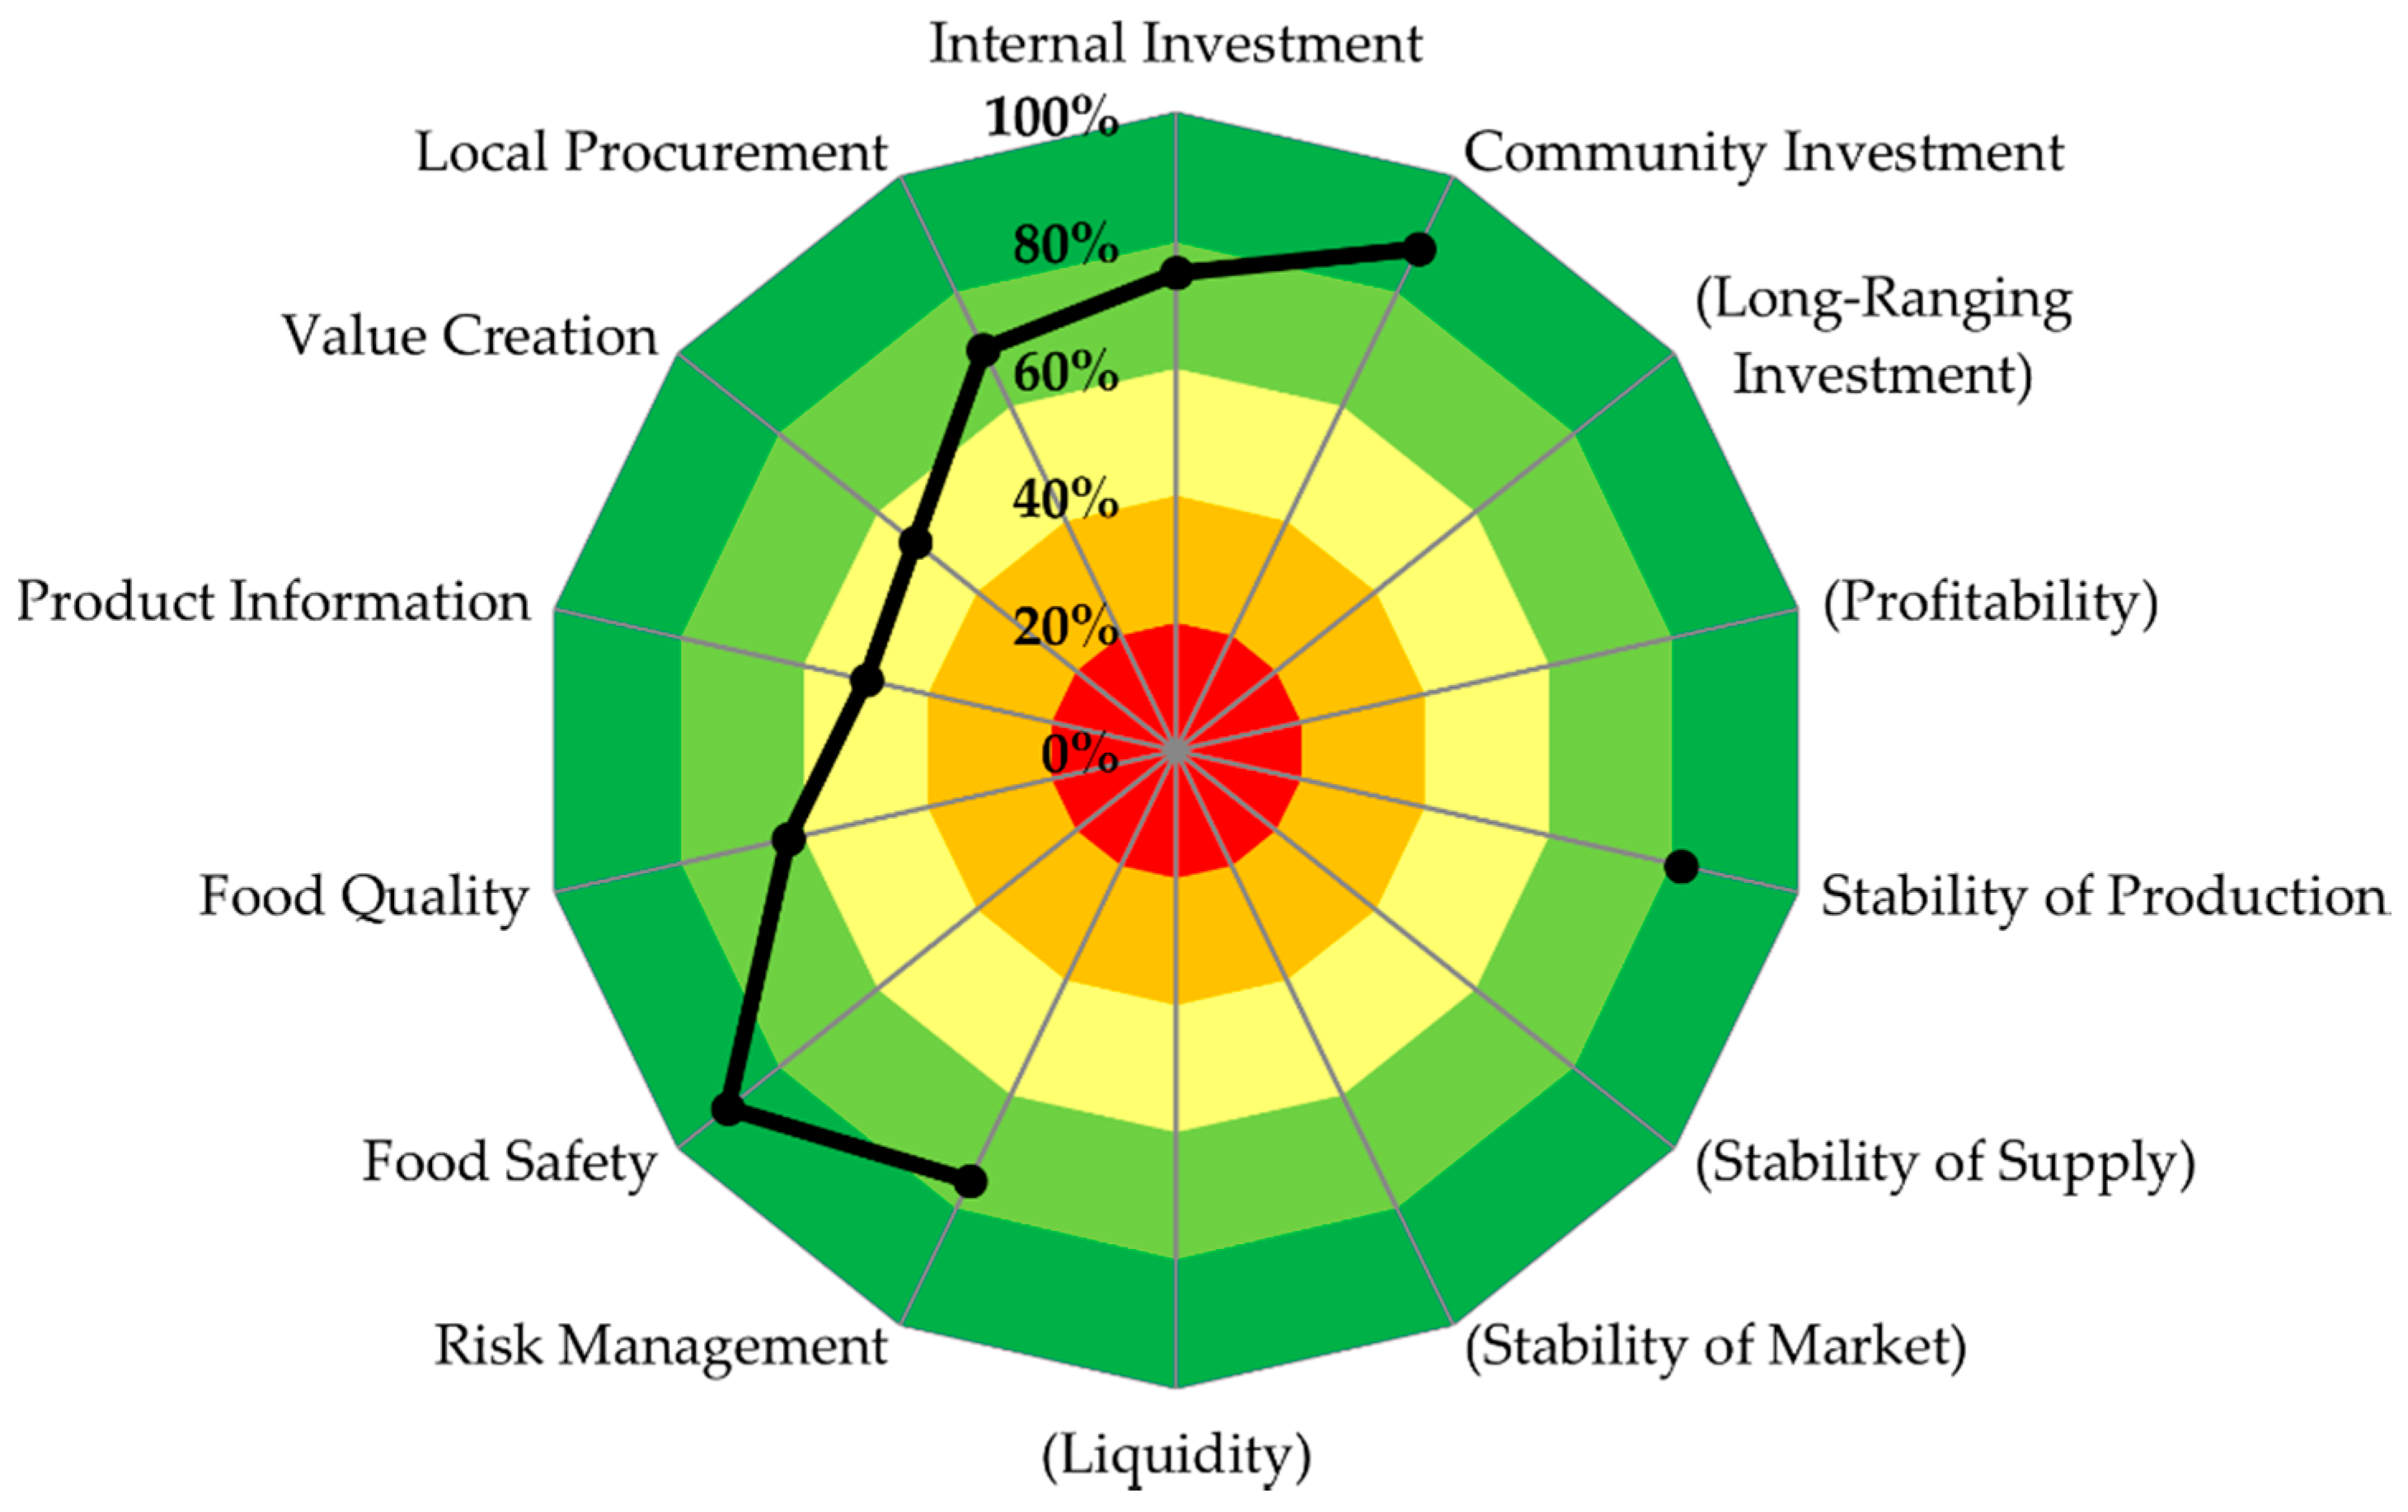
Figure 8.
Results (DGAi) of the SAFA-Dimension Social Well-Being. The subtheme in parentheses (Rights of Suppliers) could not be adapted to the context of the urban food system.
Figure 8.
Results (DGAi) of the SAFA-Dimension Social Well-Being. The subtheme in parentheses (Rights of Suppliers) could not be adapted to the context of the urban food system.


Table 1.
Categorization and number of Basel’s canteens and the corresponding institutions.
| Institutions (strata) | Number of Institutions/All-Day Schools Management Contractors | Canteens | Caterer (Including Public Caterer) | Unique Combinations (Institution/Contractor–Caterer) |
|---|---|---|---|---|
| Universities (of applied sciences) | 2 | 9 | 2 | 2 |
| Secondary level II schools | 17 | 25 | 3 | 8 |
| Kindergarten—secondary level I schools (all-day schools) | 7 | 36 | 14 | 20 |
| Kindergarten—secondary level I schools (additional out of school catering; non all-day schools) | 17 | 25 | 17 | 21 |
| Administration | 1 | 1 | 1 | 1 |
| Public-law companies | 1 | 1 | 1 | 1 |
| Hospitals | 5 | 8 | 7 | 7 |
| Private-public nursing homes | 7 | 7 | 7 | 7 |
© 2017 by the authors. Licensee MDPI, Basel, Switzerland. This article is an open access article distributed under the terms and conditions of the Creative Commons Attribution (CC BY) license (http://creativecommons.org/licenses/by/4.0/).
Share and Cite
MDPI and ACS Style
Landert, J.; Schader, C.; Moschitz, H.; Stolze, M. A Holistic Sustainability Assessment Method for Urban Food System Governance. Sustainability 2017, 9, 490. https://doi.org/10.3390/su9040490
AMA Style
Landert J, Schader C, Moschitz H, Stolze M. A Holistic Sustainability Assessment Method for Urban Food System Governance. Sustainability. 2017; 9(4):490. https://doi.org/10.3390/su9040490
Chicago/Turabian StyleLandert, Jan, Christian Schader, Heidrun Moschitz, and Matthias Stolze. 2017. "A Holistic Sustainability Assessment Method for Urban Food System Governance" Sustainability 9, no. 4: 490. https://doi.org/10.3390/su9040490
Note that from the first issue of 2016, this journal uses article numbers instead of page numbers. See further details here.