
A Multicriteria Model for Optimization of Maintenance in Thermal Energy Production Systems in Hospitals: A Case Study in a Spanish Hospital

1
Business Administration Department, University of Castilla-la Mancha, Ciudad Real 13071, Spain
2
Engineering and Management Department, University of Lisbon, Lisbon 1049-001, Portugal
*
Author to whom correspondence should be addressed.
Sustainability 2017, 9(4), 493; https://doi.org/10.3390/su9040493
Submission received: 8 November 2016
/
Revised: 14 March 2017
/
Accepted: 16 March 2017
/
Published: 25 March 2017
(This article belongs to the Section Energy Sustainability)
Abstract
:Health Care Organizations are large consumers of energy resources. This is due to the large number of services they must offer continuously, the strict requirements of temperature and humidity for patients and comfort for all visitors. Facilities for thermal energy production are critical as they guarantee the proper working of care services by producing primary air, eliminating legionella, and providing air conditioning to theatres, emergency areas, ICUs, neonatology departments, etc. Nonetheless, despite the importance of thermal energy production systems, there is no prior literature analysing the best maintenance to be applied to these systems. This study describes an innovative multicriteria model designed with the Measuring Attractiveness by a Categorical Based Evaluation Technique (MACBETH) approach and Markov chains, in choosing the best combination of maintenance policies to guarantee the best quality of care. The model was created with the co-operation of a decision group made up of those in charge of different areas of a Health Care Organization. This gives the current availability of the thermal energy production systems, and the availability that would be achieved by applying other alternatives. In the system that produces hot water for the air conditioning units, the best alternative is found to be corrective and preventive maintenance. In the cold-water production system for air conditioning, the model recommends the use of corrective, preventive and predictive maintenance, monitored by vibration analysis. For the systems producing hot domestic water and hot and cold water for other systems, corrective and preventive maintenance is recommended. In the legionella treatment system, it is best to apply corrective, preventive and periodic predictive maintenance (quarterly by combustion analysis). Finally, the implications for quality of care of changing the maintenance alternatives are considered. This research was carried out on thermal energy production systems currently operational in the University General Hospital of Ciudad Real (Spain). The methodology used in this study, together with the criteria, descriptors, weightings, etc., may serve as a standard for other Health Care Organizations, with the final goal of improving quality of care.
1. Introduction
Health care organizations are one of the largest consumers of energy resources. This is due to:
- (a)
- The large number of services offered.
- (b)
- Care services are provided continuously throughout the day and the year.
- (c)
- They have strict requirements to guarantee optimum conditions of temperature and humidity for patients, and to provide a certain degree of comfort for visitors.
The distribution of energy consumption into thermal and electrical energy depends on many factors such as the location of the hospital, its size, the characteristics of its apparatus and facilities, the services offered, the number of services provided, etc. It is a very complex matter to calculate a standard distribution for energy consumption in the health sector. This is because it depends on the number of care services provided. Most energy consumption, however, is linked to the working of systems for climate control and lighting. Thus, 45% of consumption may be considered to be due to air conditioning, 35% to lighting and 20% to production of sanitary hot water [1].
Water for human consumption is called domestic or clean water. The production facility consists of a cold-water and a hot-water circuit. Drinking water heated to 60 °C is then called Hot Domestic Water (HDW) and reaches 70 °C, in order to pasteurize it, in accordance with current Spanish regulations for the treatment of legionella. The system most commonly used in HDW facilities in the hospital environment is centralization, which uses boilers operating with solid, liquid or gas fuel. HDW facilities that have an accumulator tank, as hospitals do, allow for the availability of a large volume of water, but accumulating in this way creates the conditions for the development of legionella, if the temperature in the tanks is not guaranteed to stay above 60°.
Therefore, the production of HDW and its treatment to prevent legionella requires a large amount of energy due to the necessary high temperatures. There is also a need to ensure a minimum of preventive maintenance, as covered by the regulations for thermal facilities in buildings [2].
Up to now health care organizations have considered the need to save energy by focusing on investment in more efficient technologies, reducing demand, optimizing contracts or optimizing facilities. Up to now, however, the literature has not addressed the question on how efficient decision making in maintenance can affect the consumption of energy and resources such as water, as well as the quality of care in the hospital.
For example, avoiding faults, leaks or breakdowns may lead to a significant decrease in water consumption. This also leads to significant savings in energy because of the reduced fuel consumption involved in heating the water, a reduction in treatment products and in working hours of the pumping equipment. The decrease in pump working time leads to an extension of the life cycle of the equipment, and a more efficient use of resources.
If appropriate preventive maintenance is carried out, it will reduce the need for corrective maintenance, and there will be an improvement in performance of the facilities, a reduction in costs and better service, to the benefit of patients. A preventive programme in this type of facility usually consists of the actions shown in Table 1.
The choice of the best combination of maintenance policies is a complex decision [4], as it involves multiple factors: technical, environmental, economic, safety, and relating to business strategy. Multi-Criteria Decision Making (MCDM) techniques are considered ideal when multiple criteria are involved [5]. These criteria are generally in conflict, and may also involve multiple stakeholders, decision groups or scenarios. MCDM techniques assist in justifying decisions [6,7] to the community or the management of the company, as they guarantee a participatory decision model that is objective and easy to understand [8].
However, there are no precedents in the literature applying MCDM techniques to thermal energy production systems in health care organizations. That is, there is no analysis of systems intended to guarantee the correct operation of care services such as operating theatres, casualty areas, ICU’s, neonatology, etc., and elimination of legionella, production of primary air, etc. as in the case analysed here.
The literature that uses MCDM techniques for selection of maintenance policies mostly considers alternative maintenance policies in isolation. They consider only the use of, for example, preventive maintenance. However, organizations apply a combination of maintenance policies, since, for example, corrective maintenance should always exist.
There are many combinations of maintenance policies, and the choice of the most appropriate should be made through an objective decision-making process, based on mathematical techniques guaranteeing, in the case of health care organizations, the provision of care services to the required standard. It should be remembered that the quality of healthcare is a major concern for regional, national and international authorities [9]. This combination of maintenance policies was taken into consideration in this study when identifying the alternatives.
Total consumption in the Spanish hospital sector is 6x10⁶ watt/hours, which represents 2% of total national consumption [10]. The large number of state-run hospitals in Spain, together with the current economic recession, suggests the need to improve energy efficiency. This is defined as applying appropriate management of available resources to obtain the greatest benefit, avoiding any unnecessary cost [11].
The main aim of this study is to optimize maintenance in the thermal energy production systems in hospitals. A multicriteria model will be described, providing the optimal combination of maintenance policies to be applied to these systems. The idea is to obtain greater availability of the systems and thus, greater functionality of the care services that depend on them, leading to improvements in quality of care. This study was carried out in the University General Hospital of Ciudad Real (UGHCR), in Spain. This is a public hospital that opened in 2005.
The novel contributions of this research are:
- Development of a multicriteria model using the Measuring Attractiveness by a Categorical Based Evaluation Technique (MACBETH) approach for maintenance optimization.
- Applying a multicriteria model to thermal energy production systems in Health Care Organizations. They have critical characteristics as compared with other buildings and organizations, because of the quantity of water used and the number of services and people that depend on this provision. Some of these people will be patients with immune deficits, or illnesses that may be exacerbated by deficient provision of the systems under analysis.
- Modelling the thermal energy production systems in a hospital via continuous time Markov chains, for different combinations of maintenance policies.
- Analysing the solutions obtained by the multicriteria model and their implications for quality of care.
This study, then, gives an easily-applied methodology for any health care organization to choose the best combination of maintenance policies. The lack of precedents in the literature on this kind of decision making means that the criteria, descriptors, weightings, value functions, etc., given here may serve as standards for other health care organizations. The way the criterion ‘Impact on health care organization activity’ is designed is especially noteworthy. This criterion takes into account the availability of the system analysed, and the number of critical, important and normal systems that depend on it.
However, the most important contribution of this study is that it aims to improve quality of care. Particularly, the role played by systems or facilities not directly involved in patient care.
The integration of Markov chains and the MACBETH approach allowed the alternatives of the multicriteria model to be defined more accurately, the systems analysed to be better understood, and it provided up-to-date availability information for UGHCR. Availability is an important parameter in guaranteeing proper care services. The choice of the MACBETH approach made it possible to work around the hesitation or uncertainty inherent in group decision making. Furthermore, the alternatives of the problem are evaluated using only qualitative judgements about the difference of attractiveness between two elements at a time. This avoids the drawbacks of ordinal aggregation methods. The MACBETH approach has clearly defined procedures for carrying out each step of the decision process, which include the need to validate the results obtained by the group at each stage. This guarantees that the results of the research will be reliable.
The entire study was carried out on thermal energy production systems currently operational in a public hospital in Spain, thus guaranteeing the viability of the methodology used, and that good results, specific to each health care organization, can be obtained with relative ease.
This article is structured as follows: First comes a literature review on MCDM applied to energy and the selection of maintenance policies. Section 3 sets out a description of the mathematical grounds for the application of continuous time Markov chains. Next, Markov chains are applied to different thermal energy production systems in a hospital. The multicriteria model following the MACBETH approach is then explained; this is done by describing the criteria, descriptors, value functions and criteria weightings, following the methodology in logical order of application. Then, the results and the real implications their application would have on quality of care at the Hospital are shown. Finally, the conclusions, acknowledgements and references are presented.
2. Literature Review
MCDM methods have been applied with success to different research areas and problems (see for example [12,13] for an extensive literature review on application of MCDM methods). MCDM methods are held to be most suitable for solving problems related to energy [14]. MCDM methods can be classified into continuous and discrete methods depending on the characteristics of the alternatives evaluated [15]. Continuous MCDM methods, or Multi-Objective Decision Making (MODM) methods, are applied to problems where the decision space is continuous and the alternatives are not explicitly known. The solution is obtained by solving the mathematical model [16]. Discrete MCDM methods or Multi-Attribute Decision Making (MADM) methods have a finite number of alternatives, explicitly defined, a set of goals and criteria, and a method for classifying the alternatives based on how they satisfy the goals and the criteria [17].
Among different applications of MODM methods in the energy field, the following could be recalled for their importance: In [18], Zheng et al. (2015) develop a multi-objective group search optimizer with adaptive covariance and Lévy flights to optimize the power dispatch of a large-scale integrated energy system. The goals of economy and reliability of the power grid and distributed district heating and cooling units are taken into consideration. In [19], Yu et al. (2017) describe a multi-objective mixed integer non-linear programming model for investment decision making in a coal mine in China. The model described maximizes company profits and minimizes energy consumption and pollutant levels. In the field of renewable energy, Kantas et al. (2015) [20] analyse the economic and environmental viability of ethanol production from multiple biomass sources. They consider factors such as amount of biofuel inventory held per unit time, amount of biomass purchased and energy produced from each biomass type per unit time, CO2 emissions released and total water used during biofuel production per unit time, penalties and incentives for CO2 emissions and penalties for excessive water usage during biofuel production. In [21], Cobuloglu et al. (2015) set out a multi-objective mixed-integer optimization model to find optimal solutions on land allocations for food and energy crops, harvesting time and quantity, seeding time, and budget allocations to farm operation, while maximizing the economic and environmental benefits. A full and up-to-date review of MCDM methods applied to renewable energies can be found in Kumar et al. (2017) [14].
Additionally, MADM techniques are considered highly suited to problems of reliability, maintainability, availability and safety [22]. They have, as such, been successfully applied to the choice of maintenance policies in different types of company. Among the literature analysing choice of maintenance policy the following contributions are particularly noteworthy. In [23], Bevilacqua and Braglia (2000) apply the Failure Mode Effect and Criticality Analysis Technique (FMECA) to obtain a criticality index and to categorize the machinery by risk. Then, they apply the Analytic Hierarchy Process (AHP) to choose the optimal maintenance policy for each of the groups. In [24], Al-Najjar and Alsyouf (2003) classify maintenance policies by their ability to provide information about the changes in the behaviour of failure causes. They do this with a fuzzy multiple criteria decision-making methodology, where the failure modes are the criteria. Emblemsvåg and Tonning (2003) [25] apply AHP to identify, from among four options, the best maintenance policy for weapons system in the Norwegian Army. Monte Carlo simulations are used to evaluate the robustness of the decision. In [26], Bertolini and Bevilacqua (2006) build a model using AHP to obtain the priority levels for each maintenance policy, corrective, preventive and predictive. Next, a goal-programming model was applied to identify the best set of maintenance policies for the failure modes in a set of the 10 most critical centrifugal pumps operating in an Italian oil refinery. In [27], Gómez de León and Ruiz (2006) propose calculating an equipment criticality index via a normalized Simple Additive Weighting (SAW) method. The various maintenance policies are assigned according to the value obtained from the criticality test. In [28], Wang et al. (2007) construct a model that uses a modified fuzzy AHP, deriving crisp priorities from a consistent or inconsistent fuzzy judgement matrix and solving an optimization problem with non-linear constraints. In [29], Shyjith et al. (2008) combine AHP and Technique for Order Preference by Similarity to Ideal Solution (TOPSIS) to choose a maintenance policy in a textile industry. In a similar industry, Ilangkumaran and Kumanan (2009) [30] apply fuzzy AHP and TOPSIS to obtain a classification of maintenance policies. In [31], Mousavi et al. (2009) combine Factor Analysis and fuzzy TOPSIS in the choice of maintenance policies. In [32], Ahmadi et al. (2010) use AHP to calculate the effectiveness of appraisal criteria for a maintenance policy. The different maintenance policies in an aircraft system are ranked using the benefit-cost ratio, TOPSIS and VIseKriterijumska Optimizacija I Kompromisno Resenje (VIKOR). In [33], Arunraj and Maiti (2010) apply AHP to obtain a priority vector for the maintenance policies analysed. The priority vector is a goal-programming model with three goals: global scores of maintenance policies, local scores of maintenance policies based on risk contribution, and local scores of maintenance policies based on cost. In [34], Ghosh and Roy (2010) use the worst-case failure mode to calculate criticality of equipment, and with this information they prioritize maintenance activity. They then use fuzzy AHP and a goal-programming model to optimize the goals of risk reduction and cost minimization. In [35], Chen and Chen (2010) apply AHP, TOPSIS and grey relational analysis to choose the optimal maintenance policies and their performance in a semiconductor company, while Siew-Hong and Shahrul (2012) [4] use fuzzy TOPSIS to assess and select the optimal maintenance policy. In [36], Zhaoyang et al. (2011) combine a risk-based inspection method and AHP to choose the optimal maintenance policy in oil and gas industries. Risk is defined from the product of the probability of failure and the consequences of that failure, and the resulting combinations are presented in a risk matrix. The equipment is assigned a given maintenance policy depending on the level of risk. In [37], Zaim et al. (2012) apply AHP and the Analytic Network Process (ANP) to choose the most appropriate maintenance policy in a local newspaper printing facility in Turkey, while Shahin et al. (2012) [38] apply ANP to the machinery in a mining company. In [39], Cavalcante and Lopes (2015) use a multi-attribute value function to choose opportunistic maintenance, preventive maintenance or actions of minimal repairs in a cogeneration system using sugarcane bagasse at a power plant in Brazil. In [40], Kirubakaran and Ilangkumaran (2016) use fuzzy AHP, grey relational analysis and the TOPSIS technique to decide, from corrective maintenance, predictive maintenance, time-based preventive maintenance, and condition-based maintenance, which is best for the pumps of a paper manufacturing plant.
Following [41], the top of Figure 1 shows the criteria used in the MADM literature, ordered by frequency, for the choice of most suitable maintenance policy. Criteria of costs and savings are clearly most significant, together with other criteria such as competitiveness or quality, which are very important to industrial companies. On the other hand, the bottom part of Figure 1 gives the subcriteria for the most commonly used criteria: costs, savings, safety and availability.
The only precedent for analysing maintenance in health care organizations is in [42] where Taghipour et al. perform a statistical analysis of the maintenance data of complex medical equipment with censoring and missing information for the development of a maintenance/inspection optimization model. In [43], Sezdi (2013) studies the performance of medical devices to establish programmes of preventive maintenance. Specifically, the use of MADM techniques in the literature is limited to Taghipour et al. (2011) [44], which prioritizes medical devices according to their criticality through the use of AHP. The criticality values obtained are used to establish guidelines for selecting appropriate maintenance strategies for different classes of device. In [45], Carnero and Gómez (2016) describe a multicriteria methodology for the choice of maintenance policy in dialysis systems for patients infected with hepatitis C, and with hepatitis B, acute and chronic. The result is that corrective and preventive maintenance plus two reserve machines is the best choice.
3. Markov Chains
Markov processes are widely used in the literature as they allow systems to be modelled, and their reliability, maintainability, availability and safety parameters to be estimated [46].
Continuous-time Markov chains consider a discrete set of exhaustive and mutually exclusive states where the time at which there is a change from one state to another is random.
Mathematical modelling of a system by Markov chains is described in [47,48,49,50]. It consists of obtaining a graph defining the states of the system, and transition between states occurs through failure or repair. Failure may cause stoppage of the system directly (catastrophic failure) or through a process of wear. In the latter case the states of wear and decline are considered to be non-catastrophic failures.
The conditional probability of a transition in homogeneous continuous-time Markov chains is defined in Equation (1).
and the probability matrix for transition between states is shown in Equation (2).
where .
Furthermore, the transition probabilities should be continuous at t = 0.
The stationary state is obtained by letting and if the chain is regular the resulting matrix of transition probabilities is shown in Equation (3).
Substituting in the first equation of state in the form of a matrix:
gives Equation (5):
And since this gives:
Equations (3) and (6) state that in a regular Markov chain, considering time t sufficiently large, the transition and state probabilities stabilize to values independent of the initial state and of time t. This is called a stationary state.
While taking the derivative the second equality in Equation (4) for gives Equation (7).
and since
Writing out Equation (8) gives,
and deriving with respect to in ,
where, from Equation (9)
Furthermore, since , Equations (11) and (12) may be combined into a single equation:
and in matrix form,
Thus, the vector of probabilities in the stationary state may be expressed through Equation (15).
Given the specific structure of , the vector comprises the last line of matrix . This system of equations may be interpreted as a system of probabilistic fluid balances for the continuous chain.
4. Markov Chains for Thermal Energy Production Systems
The thermal energy production systems analysed in this study are in the UGHCR in Spain. This is a state-run hospital opened in 2005. It is one of the largest hospitals in Spain. Its direct catchment area includes 66 towns and villages, meaning it offers health care to some 174,550 people directly, and potentially to 370,000 inhabitants from other hospitals. It is a regional reference in the specialities of nuclear medicine, eating disorders, and for its blood bank.
The thermal energy production systems are responsible for producing hot and cold water centrally to meet the needs of UGHCR. These systems are codified in the UGHCR as Pracal, Prafri, Prafcd, Pacbom and Pafbom.
4.1. The Pracal System
The Pracal system (Figure 2) produces the hot water needed for the climate conditioning systems and also produces hot domestic water.
The system has four mixed boilers with a modulating burner, three of them are identical at 3000 kW each, while the other is of 900 kW, and is used to produce hot domestic water in summer. Three boilers working at full power can provide the minimum needs for the UGHCR. At times of low demand, such as in summer, or in the case of a breakdown in the smaller, 900 kW boiler, any of the three boilers is able to provide the required energy. Failure of the system is when two boilers break down.
Starting the boilers is an automatic process, carried out by the control system, depending on the load required. All incidents are registered in the control centre. A system failure is a breakdown in the burner, or breakage or blockage of the tube bundle of the boiler. If there is a failure in the control system, the boiler can be started manually.
λ11 and μ11 are defined as the rates of failure and repair due to breakdowns in the burner. λ12 and μ12 are the rates of failure and repair associated with breakage or blockage of the tube bundle of the boiler. The equivalent repair rate is calculated from Equation (16). Using the data for the specific system gives Equation (17).
The equivalent failure rate is .
Figure 3 shows the Markov graph for the Pracal system. In the graph, the nodes represent states. A link from state 0 to state 1 describes the transition probability from 0 to 1, in this case 4. The link from state 1 to state 0 represents the transition probability between these states, in this case the repair rate . A description of the five feasible states of the Pracal system is shown in Figure 2.
The transition matrix corresponding to the Markov graph is shown in Equation (18).
Solving the system of equations in Equation (15) gives the values for the probability vector in the stationary state. The solutions of these equations in all the systems analysed in this study were obtained using a recursive approach developed in MATLAB®.
Given that the system is operational in states 0, 1 and 2, the mean availability of the system is .
4.2. The Prafri System
The so-called Prafri system at UGHCR produces all the cold water required by the hospital for climate control purposes.
The system has three identical rotary coolers of 2700 kW each and a screw cooler of 900 kW, used to produce cold water at times of reduced demand. Two coolers working at full power are sufficient to provide the minimum needs for UGHCR. At times of low power, such as in winter or if there is a breakdown in the 900 kW cooler, any of the other three coolers is able to provide enough power to meet the demand.
System failure is when there is a breakdown in the second cooler. Once a fault is detected in any of the coolers, it will be repaired immediately. The coolers are started automatically according to the demand. All incidents are recorded at the control centre and tele-maintenance is provided in real time by the manufacturer’s support service. If there is a fault in the control system, the coolers can be started manually as required.
The failure and repair rates due to breakdown of the rotary cooler are defined as and . and are the failure and repair rates due to breakdown of the electric motor, and and are the failure and repair rates due to the starting-stopping mechanism. The equivalent repair rate is calculated from Equation (16), giving, for this system, Equation (19).
The equivalent failure rate is .
The graph and the transition matrix for this system are identical to those produced for the Pracal system, as the sequence of states is the same. The resulting transition matrix is, therefore, that shown in Equation (20).
The mean availability of the system is thus .
4.3. The Prafcd System
The so-called Prafcd system at UGHCR cools water from the condensers of the cooling units of the Prafri system.
The system comprises four cooling towers, which work in active redundancy, fed by a group of four pumps that also work in active redundancy. These pumps have similar characteristics (variable speed) and automatically alternate according to the number of working hours, and so, when calculating availability, they are considered as two groups operating in series: one comprising a set of cooling towers and the other a set of pumps. Each cooling tower contains an inbuilt automatic biocide dosage system to treat legionella.
The system is considered to have failed when two towers cease to function, including the anti-legionella system, or two pumps fail. The control centre indicates the existence of a fault in the towers but not in the anti-legionella system. is defined as the equivalent failure rate for each tower calculated from Equation (21), where and are the failure rates of the anti-legionella system, the mechanical and filtering system and the ventilation and mechanical transmission system, respectively.
is defined as the equivalent repair rate of each tower calculated from Equation (22), where and are the repair rates of the anti-legionella system, the mechanical and filtering system and the ventilation and mechnical transmission system, respectively.
The failure and repair rates of each pump are calculated in the same way as for the towers, where: and , are the failure and repair rates of the axle-bearing group, the mechanical closure system and the motor, respectively, for each pump. The equivalent failure and repair rates for each pump are defined as and .
The Markov graph and the availability matrix for each block are similar to those obtained for the Pracal system (Figure 3), but the failure and repair rates assigned in each case are specific to this system.
The mean availability of the system is the product of the mean availability obtained for each block, as shown in Equation (23).
where is the mean availability of the block comprising the cooling towers, and is the mean availability associated with the group of pumps. are the coefficients found by solving Equation (15).
4.4. The Pacbom and Pafbom Systems
The Pacbom and Pafbom systems feed hot and cold water produced by the Pracal and Prafri systems to other systems in the hospital.
The pumping system of the primary hot and cold water circuit comprises four identical pumps operating in parallel. These pumps have variable speed and alternate automatically according to the number of working hours. At full load three pumps operate simultaneously, so there is at least one reserve pump connected automatically if a breakdown in one of the operational would happen. We have assumed that the failure rate of the automatic control system is negligible. The system is considered to have failed when two pumps break down.
As the pumps in this system are similar to those in the Prafcd system, the same failure and repair rates will be used. Thus, . and are the failure and repair rates of each pump. The Markov graph for these systems is similar to that shown in Figure 4.
The transition matrix for this system is shown in Equation (24).
The system is operational in states 0 and 1, therefore, the mean availability of the system is .
5. A Multicriteria Model for Optimizing Maintenance Policies
The MACBETH approach was created by Bana e Costa and Vansnick [51]. It is an interactive approach for cardinal measurement that has been used on many real problems [52,53,54,55,56,57,58,59], among others on administration or public evaluation. MACBETH has the advantages of other MCDM methods, such as including a value tree resolving a complex problem into elements that are easier to analyse, structured in the form of a tree. This gives an organized visual overview of the concerns to be analysed. A large number of quantitative and/or qualitative decision criteria can also be included, as well as a tool to check the consistency of judgements. Additionally, the use of pairwise comparisons allow more accurate information to be obtained about the preferences of the decision makers [60]. MACBETH is easily understood by the decision group. Nevertheless, the final decision to choose the MACBETH approach was taken because:
- The alternatives of a problem can be evaluated using only qualitative judgments about the difference of attractiveness between two elements at a time, in order to generate numerical scores for the options in each criterion and to weight the criteria. It also avoids the drawbacks of ordinal aggregation methods, such as the Condorcet’s paradox or Arrow’s theorem [61].
- It comes with a user-friendly software called M-MACBETH [62]. M-MACBEH simplifies the application of the entire multicriteria evaluation process. Among the important tools are the construction of value functions by linear programming, the ability to show variation intervals for the valuations associated with the performance levels so as to retain compatibility with the remaining judgements of the judgement matrix. It also checks the consistency each time a judgement is given, and provides suggestions for solving any inconsistencies found, and it facilitates the performance of a broad sensitivity and robustness analysis.
- It offers the possibility of including different levels of precision in the judgements given. For example, if the decision group knows that one alternative is better than another but cannot specify how much better it is, the judgement “positive” may be chosen. On the other hand, if the group knows accurately how much better one alternative is than another, they can choose a value from among the various semantic categories of difference in attractiveness: no difference, very weak, weak, moderate, strong, very strong and extreme. It also allows hesitation or disagreement between the members of the group, allowing the choice of a number of consecutive categories. This permits uncertainty to be included in the decision process without having to use a fuzzy multicriteria model, with a far higher level of computational complexity.
- MACBETH, unlike other MCDM techniques, requires validation of the results obtained from the judgements given by the decision group. It requires, for example, the validation of the weightings of the criteria, and acceptance or adjustment of the judgement. This is to match them with the result expected by the group. The extra effort to analyse the intermediate results of the model leads to better decisions.
- MACBETH constructs the value functions, the weighing process, etc., using two reference levels (good and neutral) that must be defined for each evaluation criterion. Inconsistencies will be due to the unstructured way that pairwise comparisons are made [63]. MACBETH, like other MCDM models such as, for example, the Best-Worst Method [63], uses two references in the decision process, which leads to more consistent comparisons, and so to more objective and reliable results.
- The MACBETH approach consists of a complete methodology that facilitates objective decision making, requiring a series of steps that are not defined or not specified with other techniques. MACBETH has clearly defined procedures to guarantee that each step of the decision process: structuring, weighting and ranking (analysis of results and sensitivity analysis) is properly carried out.
For these reasons, the MCDM considered optimal for this study was the MACBETH approach.
We now describe the multicriteria model for optimizing maintenance in thermal energy production systems of UGHCR, using the MACBETH approach. The stages of the MACBETH methodology are first described, and then applied to the analysed systems.
5.1. Structuring
For the building of a multicriteria model, a decision group was set up, made up of those in charge of different areas of the UGHCR: maintenance of facilities, electromedicine, programming and admissions, environment, care staff, and health and safety. The decision group was coordinated by the head of technical services at UGHCR. This decision group established decision criteria, their descriptors and associated performance levels.
The decision group analysed the criteria applied in the previous literature. As this was, however, applied mostly to manufacturing, transport and energy organizations with different objectives, requirements and characteristics than a health care organization, they decided to propose their own criteria. Availability is, nonetheless, a criterion found in a large number of studies (Figure 1). The availability has been considered in this model, through the criterion Impact on health care organization activity, in an innovative manner. The literature also considers the criterion Investment cost together with Maintenance cost. However, the maintenance policies in this study do not require investment cost, as periodic and continuous predictive maintenance, proposed here as alternatives, would be outsourced by UGHCR. This assumes that there will be no need for equipment to gather or handle data, or fault diagnosis software. Therefore, the costs of outsourcing this policy are included in the maintenance costs. Environmental damage and zero pollution are the criteria used in the literature in the few existing studies that include environmental questions in the choice of maintenance policy. A descriptor was associated with each criterion or subcriterion to make an operational description. A descriptor is an ordered set of plausible performance levels in a criterion to describe objectively the impacts of alternatives with respect to that criterion [53]. Scale levels were defined for each descriptor. This allows unambiguous subsequent interpretation of the descriptors. Each scale has the reference levels Neutral (N), for a level considered by the group to be neither satisfactory nor unsatisfactory, and Good (G) considered by the group to be fully satisfactory [52]. These reference levels make the comparisons between criteria easier.
The decision group established the following decision criteria:
- Maintenance costs (MC). These are the annual maintenance costs for labour and materials associated with a given alternative for each system analysed. The scale levels of the descriptor Annual maintenance costs, ordered in decreasing order of relative attractiveness are:
- -
- L11 (highest level of performance). €1000 (G)
- -
- L12. €2000
- -
- L13. €3000 (N)
- -
- L14. €4000
- -
- L15 (lowest level of performance). €5000
- Operativity. This criterion is related with the working of the system from the perspective of health care professionals or maintenance of the medical equipment. This criterion includes the subcriteria Safety of maintenance workers and Suitability of maintenance actions. The scale levels of the descriptors associated with these subcriteria are common to all the systems analysed. Now, the subcriteria and the scale levels of the descriptors used are defined:
- ▪
- Safety of maintenance workers (SW). This assesses the risk that maintenance operatives and, in general, those who work directly with the systems, are exposed to. To assess the impact of this subcriterion on the alternatives, the descriptor Need to take safety precautions due to the existence of risk was defined by the decision group. The scale levels of this descriptor are as follows:
- -
- L21 (highest level of performance). There is no potential risk to the worker at any time (G).
- -
- L22 It is necessary to take certain basic precautions when undertaking the activity, due to the existence of some potential risk.
- -
- L23 It is necessary to take basic precautions when undertaking the activity, due to the existence of a definite risk (N).
- -
- L24 It is necessary to take basic precautions plus some specific precautions when undertaking the activity, due to the existence of a definite risk.
- -
- L25 (lowest level of performance). It is necessary to take basic, specific and emergency precautions when undertaking the activity, due to the existence of definite risk.
- ▪
- Suitability of maintenance actions (MA). This measures the level of suitability in the technical working of thermal energy production systems. That is, it considers safety when diagnosing faults, and the level of programming of the corrective tasks. The scale levels of the descriptor Capacity for diagnosing faults and programming corrective actions are:
- -
- L31 (highest level of performance). The maintenance worker gives reliable diagnoses of the breakdowns and faults analysed and with sufficient notice of the failure, so that corrective action can be programmed jointly with other systems involved (G).
- -
- L32 The maintenance worker gives reliable diagnoses of the breakdowns and faults analysed and with sufficient notice that corrective action needs to be programmed in the system.
- -
- L33 The maintenance worker gives reliable diagnoses of the breakdowns and faults analysed and with a period of notice such that corrective action must be carried out immediately in the system (N).
- -
- L34 The maintenance worker cannot give reliable diagnoses of all breakdowns and faults analysed and requires those in charge to take a decision. The period of advance warning in detecting the breakdown or fault is limited, and so immediate intervention is required, to carry out corrective action in the system.
- -
- L35 (lowest level of performance). The maintenance worker cannot give reliable diagnoses of the breakdowns and faults analysed and the period of advance warning in detecting the breakdown or fault means that immediate intervention is required, to carry out corrective action in the system.
- Impact on the environment (IE). This measures the level of negative consequences for the environment, both inside and in the areas surrounding UGHCR. The descriptor used is severity of environmental damage, and the scale levels are as follows:
- -
- L41 (highest level of performance). Does not cause any type of environmental damage (G).
- -
- L42. May cause environmental damage whose effects do not break regulations on the environment.
- -
- L43. May cause environmental damage requiring corrective measures to restrict such damage (N).
- -
- L44 (lowest level of performance). May cause irreversible environmental damage outside the limits of the hospital, which needs to be communicated to the authorities.
- Impact on health care organization activity (IA). This measures the impact that a failure in the thermal energy production systems would have on other hospital systems. To evaluate this, the descriptor shown in Equation (25) was defined. is the number of systems (critical, important and normal) that depend on the system analysed. is the weighting index, which may take the values one, two or four, accordingly, depending on whether the system analysed has been classified as normal, important or critical, respectively. is the mean availability of the system.Therefore, this descriptor takes into account the mean availability of the system evaluated and the influence that that system has on other systems that depend on it directly or indirectly, weighted according to criticality for the health care organization.The scale levels of this descriptor lie between the most favourable and most unfavourable possible, obtained in all the systems analysed in UGHCR. The most favourable value corresponds to the minimum possible value in the number of dependent systems and the minimum weighting and maximum mean availability possible, where the resulting value is . The most unfavourable scale level corresponds to . The scale levels, defined for the descriptor take into account the most and least favourable previous levels, are:
- -
- L51 (highest level of performance) 0 (G).
- -
- L52 (0, 50] (N).
- -
- L53 (50, 100]
- -
- L54 (100, 200]
- -
- L55 (lowest level of performance) (200, 400]
The hierarchical structure or value tree of the thermal energy production systems is shown in Figure 5.
A value function is required to assign value scores to the performance levels of a descriptor relative to the fixed scores of 0 and 100 assigned to the good and neutral reference levels. To convert the various scale levels of each descriptor into a value scale, the decision group gives qualitative judgements of differences in attractiveness between pairs of performance levels. The decision group was asked to choose one of the MACBETH semantic categories of difference in attractiveness: no, very weak, weak, moderate, strong, very strong or extreme. If necessary, judgements can be included that cover two or more consecutive MACBETH semantic categories. Each time the decision group provides a qualitative judgement, the consistency of all the judgements previously made by the group is checked automatically by the M-MACBETH software. The value function is generated by M-MACBETH through linear programming [64].
The obtained value functions were checked by the decision group to ensure that they adequately represent the relative magnitude of the decision makers’ judgements [65].
Figure 6 shows the MACBETH judgement matrices for the criteria/subcriteria: Maintenance costs, Safety of maintenance workers, Suitability of maintenance actions, Impact on the environment and Impact on health care organization activity.
All the judgement matrices given by the decision group are consistent. The value functions obtained by linear programming in M-MACBETH for the different criteria and subcriteria are shown in Figure 7. MACBETH identifies when a criterion uses qualitative performance levels (qualitative levels of scale of the descriptor) or quantitative performance levels. The subcriteria Safety of maintenance workers and Suitability of maintenance actions and for the criterion Impact on the environment, use qualitative levels of scale of the descriptor. In this case, the value function consists of a numerical scale that assigns the neutral reference level of the descriptor the value 0, and the good reference level the value 100. For example, Figure 7a shows that the value function of the criterion Safety of maintenance workers, the value 100 is assigned to the performance level L21, which considers that there is no potential risk and, therefore, has the good reference level. The scale level L23, assigned to the neutral reference level, is assigned the value 0. This means that the numerical scales are linear and continuous.
The criterion Maintenance cost uses quantitative performance levels. Figure 7c shows two graphs; on the left is a vertical axis with a numerical scale that assigns the neutral reference level of the descriptor Maintenance costs, in this case €3000, to the value 0, and the good reference level (€1000) to the value 100. On the right is a piecewise-linear value function graph. The horizontal axis shows the scale levels of the descriptor, and the vertical axis the scores. The value function of the criterion Maintenance costs gave a numerical scale in two linear pieces with different slopes, which implies a discontinuity in the scale levels: 1000 to 3000, and 3000 and 5000. These linear segments facilitate the calculation of the score of any alternative whose performance with respect to the Maintenance cost criterion is between two consecutive scale levels of its descriptor.
If, given the value function, the decision group wishes to change the score, the M-MACBETH software provides a graph interval, and within this interval the score of the scale level can be adjusted, keeping the scores of the other performance levels the same, and preserving the consistency of the judgement matrix. For example, if the decision group considers that the difference in attractiveness between 1000 and 2000 should be slightly greater than the difference between 2000 and 3000, M-MACBETH produces the graph in Figure 8. This shows that 2000 could be given a value in the interval 0.01 to 74.99 and the consistency of the judgement matrix would be maintained. This was not, however, the case in this study, and the decision group validated the value function originally obtained.
5.2. Weighting
To obtain weightings for the criteria, an additional alternative was defined at the neutral level for all criteria and subcriteria. The decision group was asked to qualitatively judge, using the MACBETH semantic categories from “very weak” to “extreme”, the increase in overall attractiveness provided by a swing from the neutral level to the most attractive impact level, in each of the criteria/subcriteria considered. For example, how much would a swing from neutral to good in Impact on the environment increase its overall attractiveness? The decision group answered “strong”. Next, how much would a swing from neutral to good in Suitability of maintenance actions increase its overall attractiveness? The answer of the decision group was “very weak”. A similar question was subsequently asked for the criteria Impact on health care organization activity, Maintenance costs and Safety of maintenance workers. In the case of the criterion Safety of maintenance workers, the group hesitated between weak and moderate qualitative judgements. Finally, they decided that to include both semantic categories in the answer was most suitable. These judgements make up the last column of the matrix of Figure 9. M-MACBETH software derives an incomplete ranking of the swings, which the decision group was asked to validate and complete, changing the order of the criteria/subcriteria in the matrix from the most attractive swing to the least attractive (see in Figure 10 the new ordering of the criteria/subcriteria by rows and columns).
The group then compared how much more preferable the change from the neutral to the good level is in the criterion Impact on hospital activity as opposed to the same change in the criterion Impact on the environment. The qualitative judgement given by the decision group was “weak”. Next, the group was asked How much more attractive is a swing from neutral to good in Impact on hospital activity than in Maintenance costs? The group was doubtful between weak and moderate. Therefore, the judgement matrix of Figure 10 includes both consecutive categories “weak-moderate”. This comparison process is repeated between the criterion Impact on health care organization activity and the criteria Safety of maintenance workers and Suitability of maintenance actions respectively. The first row of the weighting matrix is completed in this way.
This process was repeated, now first asking the group How much more attractive is a swing from neutral to good in Impact on the environment than in Maintenance costs? Of course, when a criterion is compared with itself, the absence of difference in attractiveness is shown with a “no” in the diagonal of the judgement matrix. The process is then repeated row-by-row (from left to right), comparing the swings pairwise, also using the MACBETH semantic categories, until the weighting of the judgement matrix was completed (see Figure 10) [65]. This procedure for producing the weightings of the criteria using references in the performance scales avoids the most common critical error found in decision making, according to Keeney [66].
The consistency of each judgement given by the group was tested by M-MACBETH. The weights obtained are: , , , and . The group was asked for their degree of agreement with the weights obtained and if they consider it necessary to adjust the values obtained interactively to obtain more appropriate values. Nevertheless, the decision group expressed agreement with the weightings obtained, and no adjustment was necessary. The weightings were therefore validated by the decision group. The validated weightings are shown in the scale column in Figure 10.
5.3. Alternatives
The alternatives considered in this study are a combination of various maintenance policies.
- -
- Corrective maintenance (ALT1). Corrective maintenance is carried out only when an unexpected failure occurs, or as a consequence of performing preventive or predictive activity if a need for corrective action is discovered. Once a fault has been detected, corrective maintenance has an almost immediate response. However, the resolution time depends on the nature and extent of the fault.
- -
- Corrective maintenance and preventive maintenance (ALT2). Preventive maintenance is carried out with differing frequencies, depending on the system: fortnightly for Pracal and Prafcd, and monthly for Prafri, Pacbom and Pafbom. Corrective maintenance is carried out in a complementary fashion, as stated above. In the Prafcd, the maintenance policies used for the cooling towers are corrective and preventive maintenance.
- -
- Corrective maintenance, preventive maintenance and periodic predictive maintenance (ALT3). Predictive maintenance is carried out quarterly in the Prafcd, Pacbom and Pafbom systems. This is done with portable devices that analyse the vibrations of the pumps and ventilators, to be later analysed for diagnosis. In the Pracal system, predictive maintenance is carried out quarterly by analysing the burning of the fuel. Corrective and preventive maintenance are performed as indicated for the previous alternative.
- -
- Corrective maintenance, preventive maintenance and continuous predictive maintenance (ALT4). In the Prafri system predictive maintenance is performed continuously by means of vibration analysis. The vibration data are transmitted to the control centre of the official support service. Corrective and preventive maintenance are performed as previously indicated.
6. Results
To obtain the Impact on health care organization activity for each system it is necessary to calculate in advance the mean availability for each alternative. Table 2, Table 3, Table 4 and Table 5 show the failure and repair rates as a function of the alternative under consideration, for the burner-boiler unit, the cooler units, the cooling towers and the pumps, respectively. Table 6 shows the results of the mean availability for each alternative and analysed system.
Equation (25) serves to calculate the impact of each system on hospital activity. Table 7 shows the number of critical, important and normal systems that depend on each system to be evaluated, and the resulting value of .
The results of the assessment of the criteria and subcriteria for each system and alternative are shown in Table 8.
The evaluation of each alternative in each thermal energy production system is carried out by simple additive aggregation from bottom to top in the value tree. When considering decision criteria, the performance of an alternative is calculated using Equation (26) [67].
with is the weight of each criterion and is the value score of in criterion .
Figure 11 shows the classification of alternatives obtained for the different thermal energy production systems at UGHCR by using Equation (26). The model gives as the most suitable alternative the use of corrective maintenance together with preventive maintenance (ALT2) in the Pracal, Pacbom and Pafbom systems. On the other hand, it recommends using corrective, preventive and periodic predictive maintenance (ALT3) in the Prafcd system, and corrective, preventive and monitored predictive maintenance (ALT4) in the Prafri system. UGHCR is currently applying, in all the analysed systems, corrective maintenance and preventive maintenance (ALT2). This assumes that the Pracal system has the highest possible availability (1), while the Prafcd and Prafri systems have an availability of 0.9990. In the case of Pacbom and Pafbom the availability is 0.9999 and, therefore, very close to the maximum possible.
In three of the analysed systems the model suggests continuing with the combination of maintenance policies that was already being used at UGHCR, that is, corrective and preventive maintenance. The model in these cases allows maintenance decisions to be justified based on objective models where the decisions have been based on the consensus of a multidisciplinary decision group.
In the case of the Prafcd system, the model suggests applying corrective, preventive and predictive maintenance. This assumes an improvement in availability of 3.20% and would require a cost increase of 41.33%.
The model suggests, together with the use of corrective and preventive maintenance, using continuous predictive maintenance in the Prafri system. This would mean the introduction of an additional maintenance policy with respect to those that were being used until then in the system at UGHCR. In this way, the system would go from an availability of 0.9990 to 0.9999. Maintenance costs would increase by 80.65%. Such a significant increase in cost is due to the high technological level of continuous predictive maintenance. That is, the use of continuous predictive maintenance requires purchasing and maintaining advanced systems for acquisition and handling of predictive data (vibration, oil used parameters, thermography images, etc.). Furthermore, high-level training of staff in order to use and develop the policy is required. Nonetheless, this cost increase is compensated by the fact that the use only of corrective and preventive maintenance can have serious consequences for the normal working of UGHCR, albeit for a short time. The change in the Prafcd and Prafri systems to the alternatives ALT3 and ALT4 respectively, would eliminate these serious consequences, which stem from the large number of systems that depend directly on the correct working of the Prafcd and Prafri systems, such as: 14 systems that produce conditioned air for operating theatres, three systems producing primary air in Casualty, two systems dedicated to producing primary air for ICUs, production of primary air for neonatology and paediatric services or haemodialysis. Thus, the best choice could eliminate small stoppages in the service of the system that might otherwise seriously affect a variety of hospital services that are considered critical or important. Furthermore, the application of ALT3 and ALT4 would improve maintenance programming, and safety of care and maintenance workers, increasing the availability of maintenance workers to perform maintenance activities of greater added value to the organization.
Table 9 shows the values obtained by the model for the alternatives currently applied at UGHCR and those proposed by the model in the Prafcd and Prafri. The availability and consequences of applying each alternative are also included. In the remaining systems, no change of alternative is suggested and therefore they are not included in Table 9.
The sensitivity analysis is performed by modifying a specific criterion weight slightly, to values considered feasible by the decision group, and subsequently adjusting the difference equally over the remaining criteria in such a way that . The classification of alternatives does not change. The results of the sensitivity analysis for the Pracal system when the criterion Maintenance cost is modified is shown in Figure 12a. The current weight of Maintenance cost in percentage is shown in red at the top of the figure (18.18%) and is accompanied by a continuous vertical red line. ALT2 is the alternative chosen for weighting in the criterion Maintenance cost, above 11.3%, given that it is the one with the largest overall variation. The intersection point between a pair of alternatives can be seen as a pink line. The weighting of the criterion that reaches this intersection point is shown on the x-axis (11.3%) and the overall score of the alternatives that cross (ALT2 and ALT4), is shown on the y-axis (66.5). For weightings in the criterion Maintenance cost lower than 11.3%, the alternative chosen would be ALT4. It would be necessary to assign to Maintenance costs a weighting 37.84% lower than the current one in order for the alternatives ALT2 and ALT4 to change places. This decrease is very high and is not considered feasible by the decision-making group.
Figure 12b shows that the current weight of the criterion Safety of maintenance workers is 13.64% and the alternative chosen for this value is ALT2. The intersection point between ALT2 and ALT4 is reached when the weighting of this criterion is 26.0%. For weightings higher than 26.0%, the alternative chosen would be ALT4. This supposes, an increase of 90.62% with respect to the current value, to produce this reversal of places. This increase required to change the classification of alternatives is so great that the decision group does not consider it feasible.
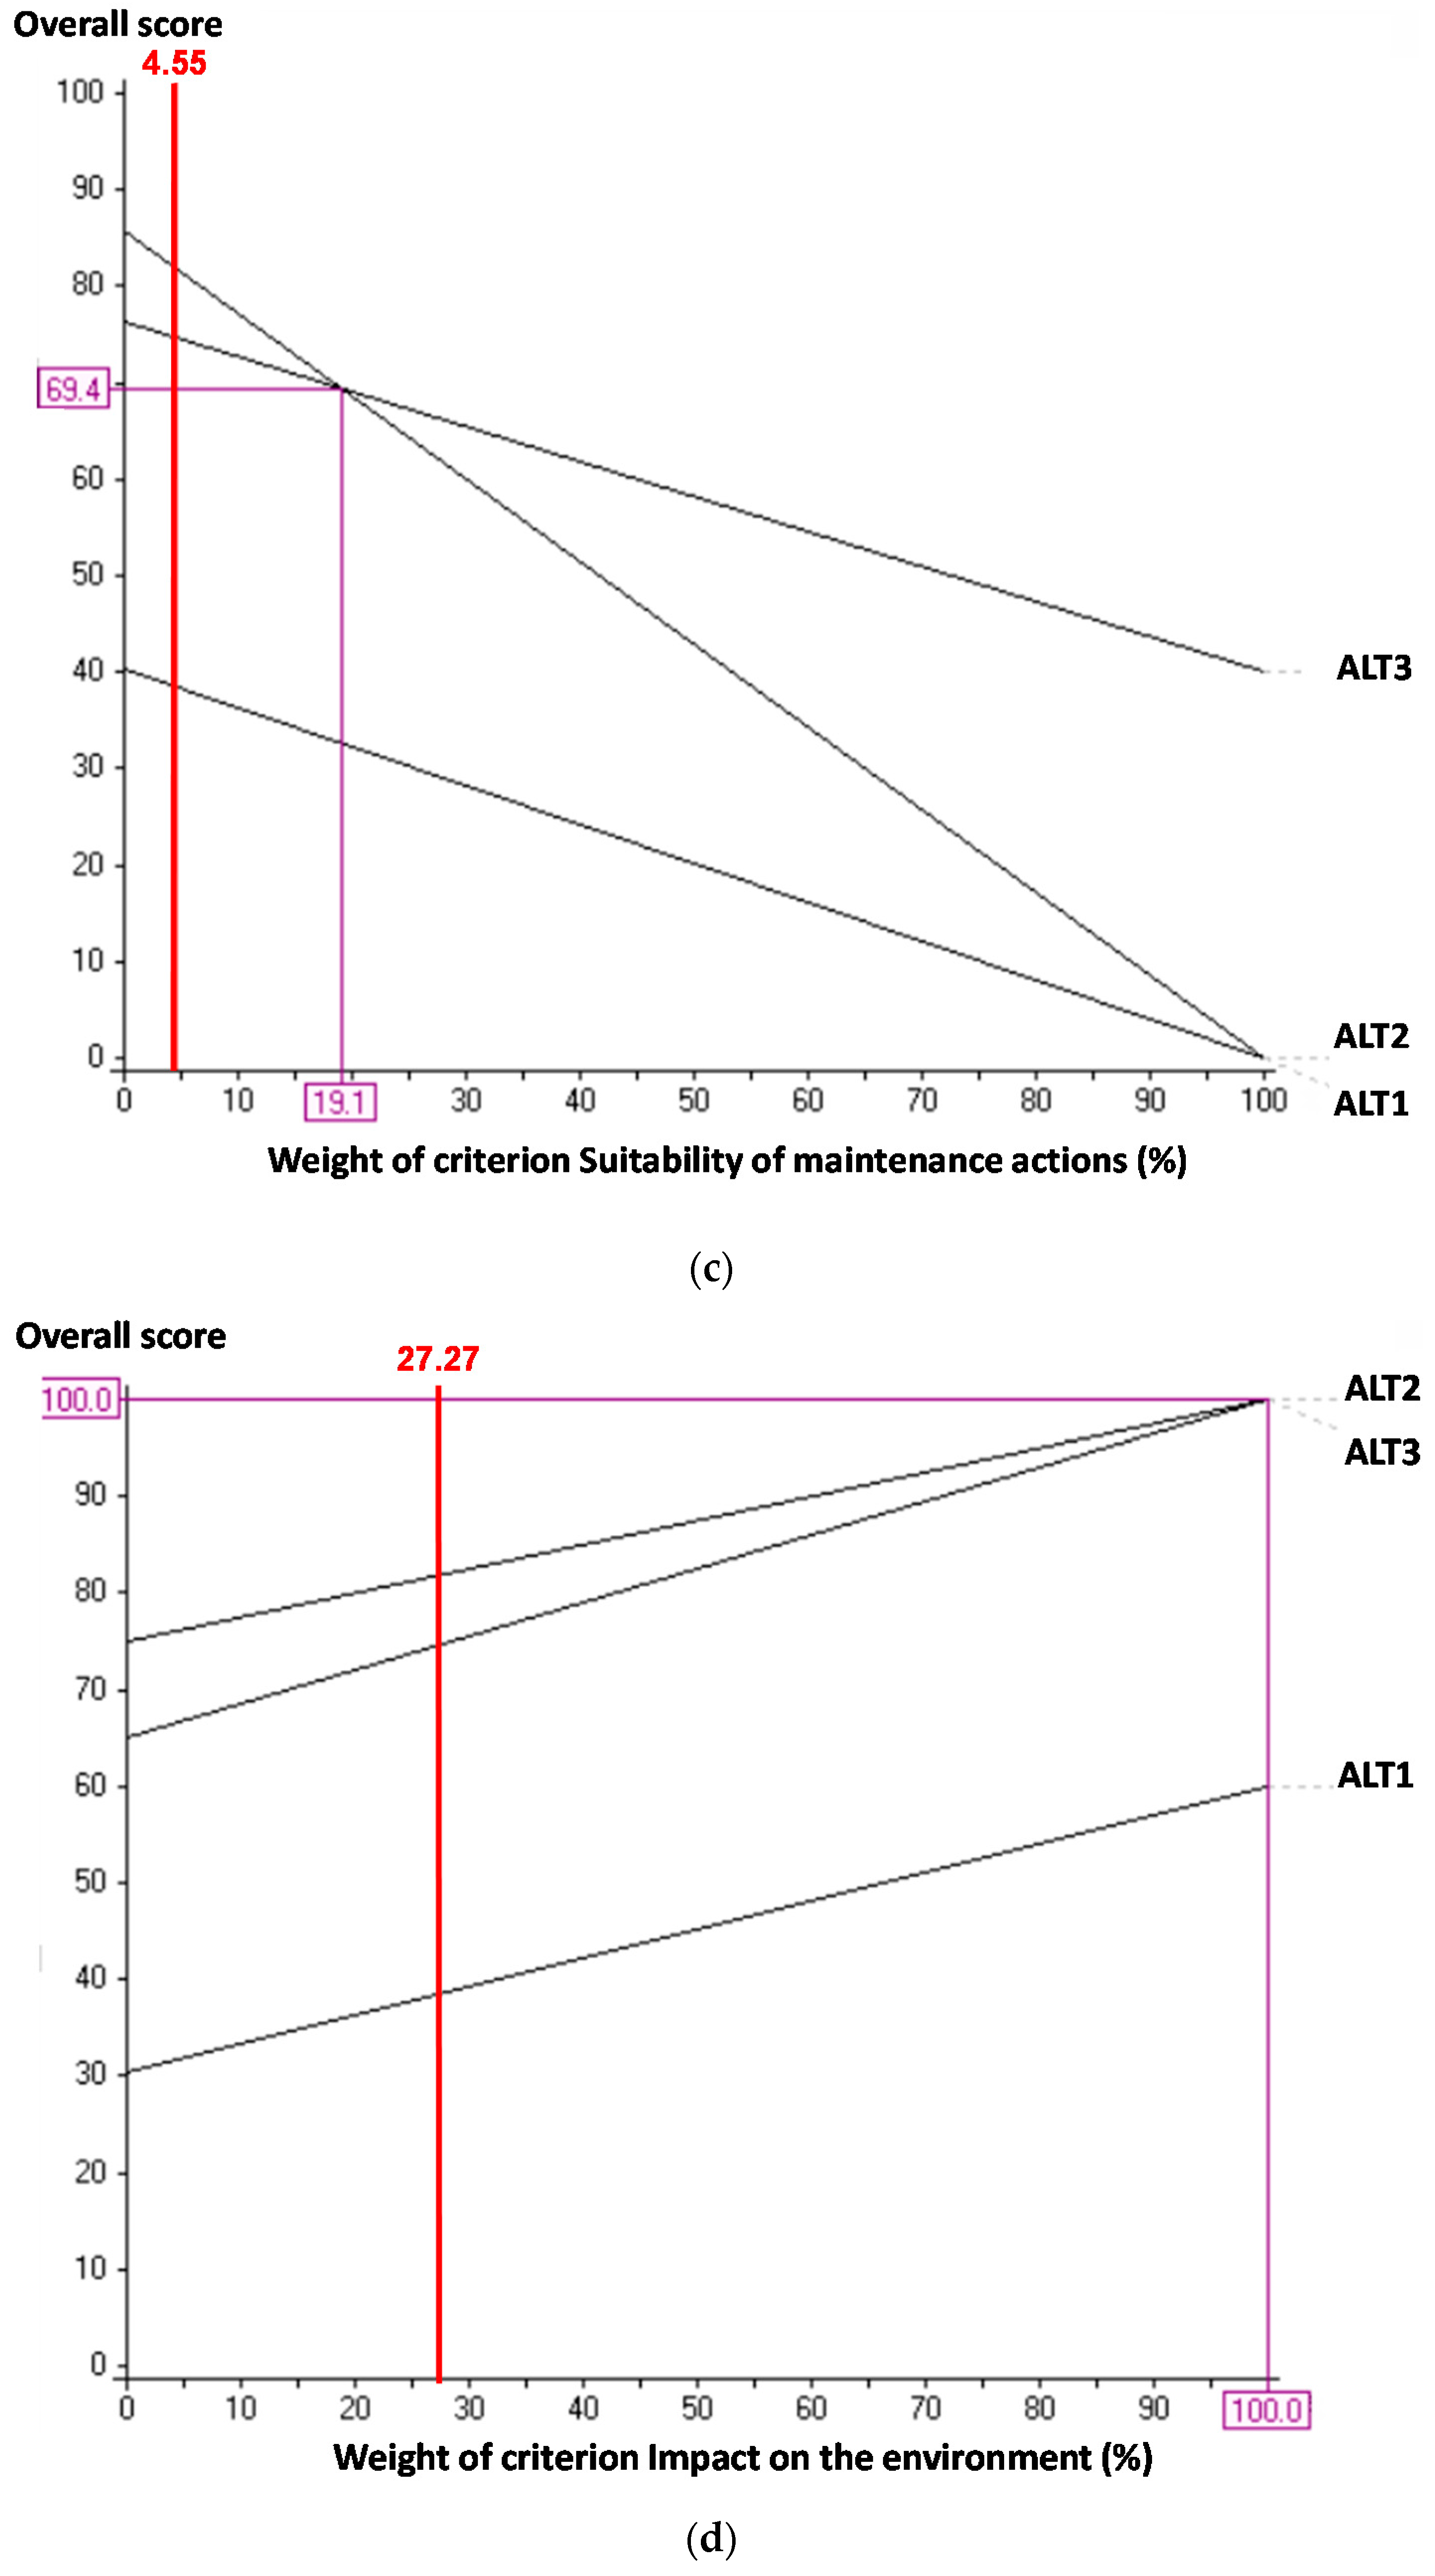
Figure 12c shows that the current weight of the criterion Suitability of maintenance actions is 4.55%. The intersection point between ALT2 and ALT4 is reached at the weighting 11.9%. Therefore, below this weighting the chosen alternative would be ALT2. An increase in the weighting of 161.54% in this criterion with respect to the current weighting would be required for the alternative chosen to switch to ALT4.
Figure 12d shows that the current weighting of the criterion Impact on the environment is 27.27% and in no case would there be a switch in the classification of alternatives if the weighting were modified. No intersection point can be perceived.
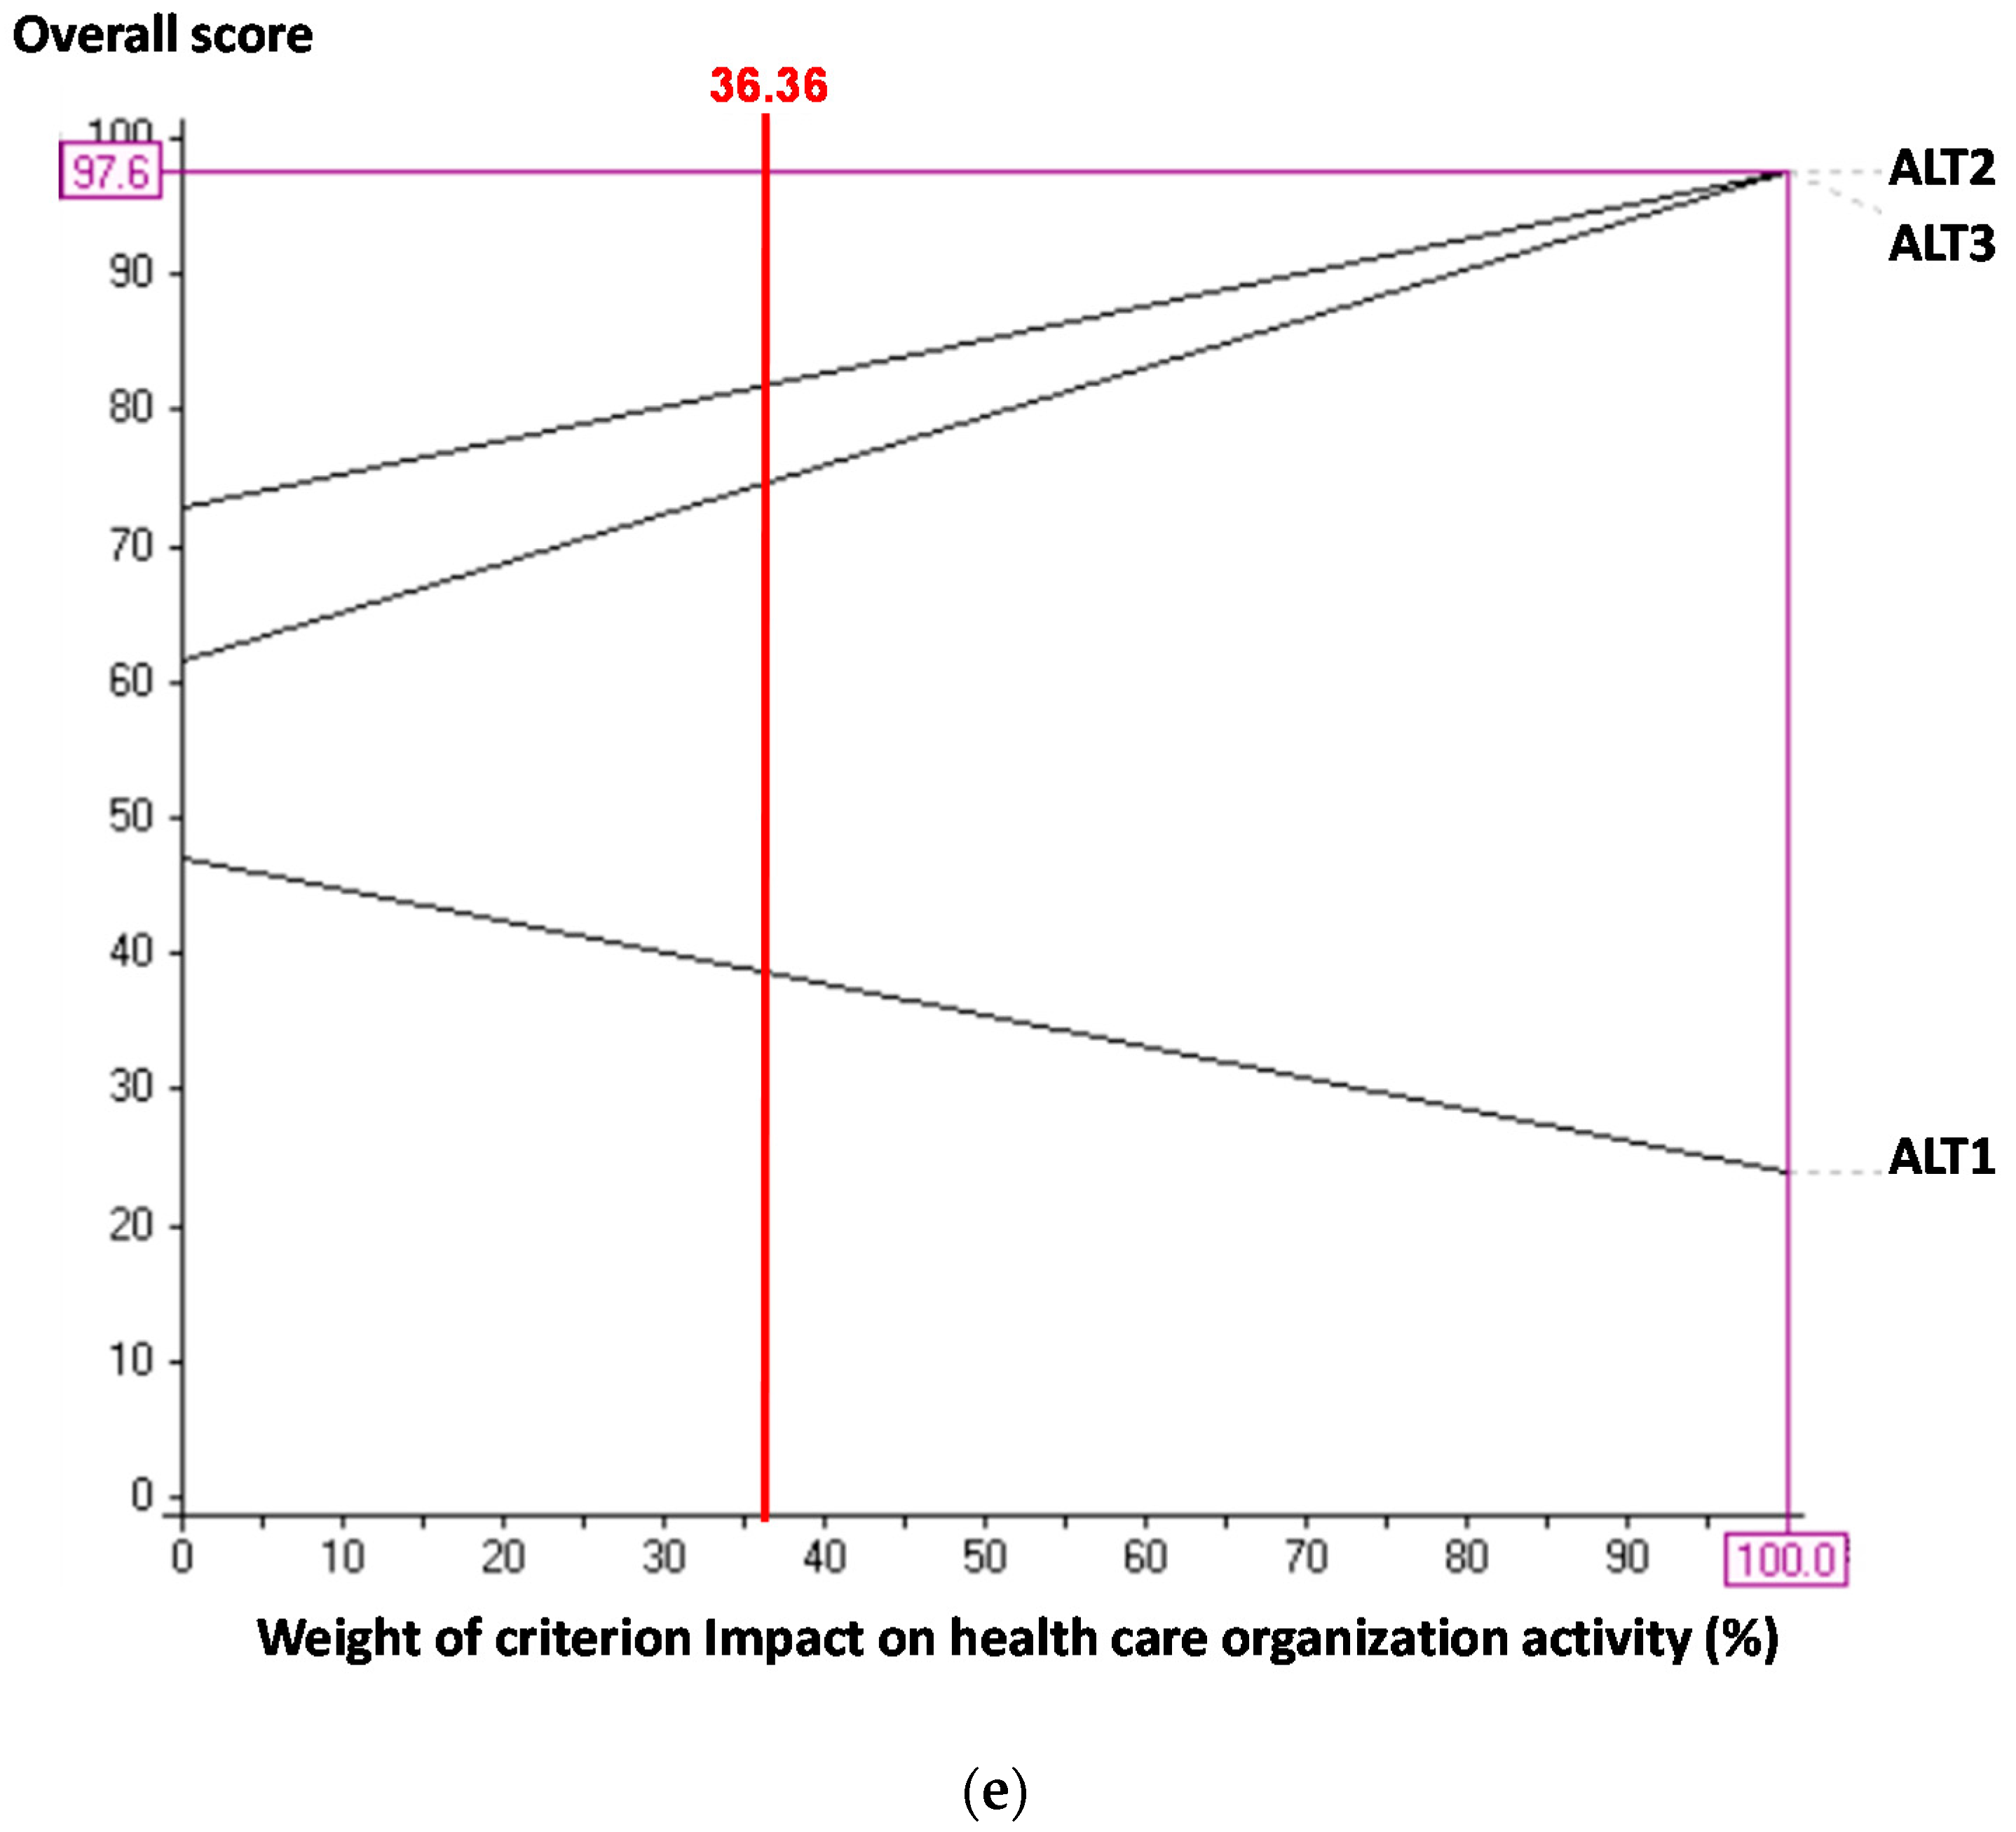
Figure 12e shows that the current weighting of the criterion Impact on health care organization activity is 36.36%. There is no intersection point between the alternatives in first and second place. The chosen alternative is ALT2 regardless of the weighting assigned to this criterion.
Thus, in all cases the decreases and increases required to change the classification from ALT2 to ALT4 are significantly large that the decision group does not consider them feasible. As a result, the model described is considered robust. Similar analyses were performed on the other systems, reaching the same conclusion in each case, as can be seen in Appendix A.
UGHCR developed a plan for introducing the most suitable alternatives suggested by the model. Thus, the introduction of ALT4 in the Prafri system is considered to take 15 days, specifying the need for specific additional training for maintenance staff.
The theoretical contribution of this research is a methodology that can be easily applied in other health care organizations, for the selection of the best maintenance strategy. This strategy combines various maintenance policies, following the usual practice of maintenance departments, unlike much of the current literature. Also, as there are no precedents in the literature, this model describes a number of decision criteria and descriptors that could be applied to other health care organizations. These criteria could also be adapted to the specific circumstances of each hospital.
7. Conclusions
This research analyses, for the first time, the optimal combination of maintenance policies to be applied to thermal energy production systems in hospitals. Although these systems are important in most organizations, in the case of health care organizations their criticality is considerably greater, given the implications for patient health. This is because these systems control the exact temperature and humidity as required by patients, in critical care areas such as theatres, casualty and neonatology, and they also provide hot domestic water ensure the absence of legionella.
To obtain an objective decision on the best combination of maintenance policies, an innovative multicriteria model was designed using the MACBETH approach. This guarantees a full, objective classification of the possible alternatives, which is also produced from judgements given by those in charge of difference care and non-care services in the hospital. To build the model, it was first necessary to model the systems to be analysed by continuous time Markov chains.
The result was that in Pracal, Pacbom and Pafbom the optimal combination of maintenance policies was already in place, and no later action was necessary. In Prafcd and Prafri systems, however, a need to change the maintenance alternative was found, in order to guarantee the best quality of care to patients. To this end, the Health Care Organization created a plan of action to achieve the policy changes recommended.
The most important contribution of this research is, however, the fact that it addresses improvements in quality of care in systems and facilities not directly involved in care, such as thermal energy production systems. The results of the study show in a practical way how a change in maintenance strategy to a combination of corrective, preventive and predictive maintenance (thermal analysis), alternating the preventive with the predictive policy in programmed quarterly checks, together with redundancy of transformers, would prevent stoppages in radiology, and therefore guarantee the proper provision of this care service. It would also improve safety of staff and patients, assist in compliance with current maintenance review standards, improve maintenance programming, etc. This research was carried out wholly in real thermal energy production systems in a state hospital in Spain, thus guaranteeing the viability of the methodology, and the ease that the best results for each health care organization can be obtained with.
Future development will consider the need to review the models periodically to see if it is possible to include new alternatives, in the form of new combinations of maintenance policies, for example, include the application of Total Productive Maintenance (TPM) or Reliability Centered Maintenance (RCM). It is also important to review the judgements given by the decision group, since changing economic or environmental circumstances, or the needs of care quality, may lead to different weightings for the criteria, or the need to include additional criteria in the model.
Although the MACBETH approach allows uncertainty, doubt or ambiguity to be included in certain areas of the decision process, the idea is to update the model in the future using a fuzzy MACBETH methodology and comparing the results with those from the model in this study.
Acknowledgments
This research was supported by the Junta de Comunidades de Castilla-La Mancha and the European Regional Development Fund under Grant number PPII-2014-013-P.
Author Contributions
María Carmen Carnero and Andrés Gómez conceived and designed the research and revised the results and research content. María Carmen Carnero performed the editing and revising the manuscript. Andrés Gómez performed the acquisition and analysis of data.
Conflicts of Interest
The authors declare no conflict of interest.
Nomenclature
| Markov Chain Models | Multicriteria MODEL | ||
| Parameters | Criteria (acronym) | ||
| λ11 | Failure rate due to breakdowns in the burner (failure/year) | MC | Maintenance costs |
| λ12 | Failure rate associated with breakage or blockage of the tube bundle of the boiler (failure/year) | SW | Safety of maintenance workers |
| Equivalent failure rate of the Pracal system (failure/year) | MA | Suitability of maintenance actions | |
| μ11 | Repair rate due to breakdowns in the burner (repair/year) | IE | Impact on the environment |
| μ12 | Repair rate associated with breakage or blockage of the tube bundle of the boiler (repair/year) | IA | Impact on health care organization activity |
| Equivalent repair rate of the Pracal system (failure/year) | Reference levels of descriptors | ||
| Mean availability of the Pracal system | N | Neutral reference level | |
| Failure rate due to breakdown of the rotary cooler (failure/year) | G | Good reference level | |
| Failure rate due to breakdown of the electric motor (failure/year) | Parameters | ||
| Failure rate due to the starting-stopping mechanism (failure/year) | Mean availability of a system | ||
| Equivalent failure rate of the Prafri system (failure/year) | Number of systems (critical, important and normal) that depend on the system analysed | ||
| Repair rate due to breakdown of the rotary cooler (repair/year) | Weighting index | ||
| Repair rate due to breakdown of the electric motor (repair/year) | Weights of criteria or subcriteria i | ||
| Repair rate due to the starting-stopping mechanism (repair/year) | Alternatives | ||
| Equivalent repair rate of the Prafri system (repair/year) | ALT1 | Strategy of maintenance combining corrective maintenance policy | |
| Mean availability of the Prafri system | ALT2 | Strategy of maintenance combining corrective maintenance and preventive maintenance | |
| Failure rate of the anti-legionella system (failure/year) | ALT3 | Strategy of maintenance combining corrective maintenance, preventive maintenance and periodic predictive maintenance | |
| Failure rate of the mechanical and filtering system (failure/year) | ALT4 | Strategy of maintenance combining corrective maintenance, preventive maintenance and continuous predictive maintenance | |
| Failure rate of the ventilation and mechanical transmission system (failure/year) | |||
| Equivalent failure rate of a tower (failure/year) | |||
| Equivalent repair rate of a tower (repair/year) | |||
| Repair rate of the anti-legionella system (repair/year) | |||
| Repair rate of the mechanical and filtering system (repair/year) | |||
| Repair rate of the ventilation and mechanical transmission system (repair/year) | |||
| Failure rate of the axle-bearing group (failure/year) | |||
| Failure rate of the mechanical closure system for each pump (failure/year) | |||
| Failure rate of the motor for a pump (failure/year) | |||
| Repair rate of the axle-bearing group for a pump (repair/year) | |||
| Repair rate of the mechanical closure system for a pump (repair/year) | |||
| Repair rate of the motor for a pump (repair/year) | |||
| Mean availability of the block comprising the cooling towers | |||
| Mean availability associated with the group of pumps of the Prafcd system | |||
| Mean availability of the Prafcd system | |||
| The equivalent failure rate of a pump (failure/year) | |||
| The equivalent repair rate of a pump (repair/year) | |||
| Mean availability of the Prafcd system | |||
| Mean availability of the Pacbom or Pafbom systems | |||
Appendix A
This Appendix describes the sensitivity analysis of the subsystems Prafcd, Prafri, Pacbom and Pafbom.
The current weight of each criterion is shown in red at the top of each Figure and is accompanied by a continuous vertical red line. The intersection point between the pair of alternatives classified in the two first positions is identified by means of pink lines.
The sensitivity analysis for the Prafcd system is shown in Figure A1. Figure A1a shows the evolution of the classification of alternatives when the weighting of the criterion Maintenance cost is modified. There is no change in the classification of ALT3 to ALT2 for any increase or decrease in the weighting of the criterion. If the weighting were greater than 90.10%, the alternative chosen would be ALT1. However, this weighting is too high and is not considered feasible by the decision group. Figure A1b shows that there will only be an intersection in the values of ALT3 and ALT2 if the criterion Safety of maintenance workers had a weighting of 100%. This would mean that there would only be one criterion in the model, and so no modification can occur in the classification of alternatives when the weighting of the criterion Safety of maintenance workers is modified. On changing the criterion Suitability of maintenance actions (Figure A1c), it can be seen that only if the criterion had a weighting of 0.00% would there be an intersection between the values of ALT3 and ALT2. This would mean that the criterion was not included in the model, which is not considered feasible. Figure A1d shows the sensitivity analysis when the weight of the criterion Impact on the environment is modified. It can be seen to behave in a similar way to the criterion Safety of maintenance workers. The same is true of the criterion Impact on health care organization activity (Figure A1e). The classification of alternatives obtained is therefore considered robust.
The sensitivity analysis for the Prafri system is shown in Figure A2. The results of the sensitivity analysis for the Prafri system when the criterion Maintenance cost is modified is shown in Figure A2a. The current weighting of the criterion Maintenance cost is 18.18%. The change in the classification of alternatives from ALT4 to that in second place (ALT3), would require a weighting of 20.70%. An increase of 13.86% in the weighting of this criterion would be necessary. Although this increase isn’t very high, it is not considered feasible by the decision-making group. Figure A2b shows the sensitivity analysis when the weight of the criterion Safety of maintenance workers is modified. There could never be a switch in the classification of the alternatives ALT4 and ALT2. Figure A2c shows the sensitivity analysis when the weight of the criterion Suitability of maintenance actions is modified. There are no intersection points between any of the alternatives. There cannot, therefore, be a change in the classification of alternatives. Figure A2d shows the sensitivity analysis when the weight of the criterion Impact on the environment is modified. A decrease of 22.02% is required for the alternative ALT2 to appear in first place in the classification. This decrease is considered too great by the decision group. Figure A2e shows the evolution of the classification of alternatives when the weight of the criterion Impact on health care organization activity is modified. A change from a weighting of 36.36% to less than 12.00% would be required on order for ALT2 to be classified in first place...This would be a decrease of 70.00% in the weighting of the criterion. Such a decrease is not considered feasible by the decision group. Looking at the complete analysis, the classification of alternatives does not change in any of the cases.
The sensitivity analysis for the Pacbom and Pafbom systems is shown in Figure A3. The results of the sensitivity analysis for these systems when the criterion Maintenance cost is modified is shown in Figure A3a. A decrease of 76.35% in the weighting of the criterion (from 18.18 to 4.30) for the classification to change from ALT2 to ALT3. This decrease is very high and is not considered feasible by the decision group. With respect to the change in weightings of the criteria Safety of maintenance workers, Impact on the environment and Impact on health care organization activity, it can be seen in Figure A3b,d,e), that weightings of 100% in all the criteria would be necessary to produce an intersection between ALT2 and ALT3. This is not considered feasible. For the criterion Suitability of maintenance actions (Figure A3c), the current weighting is 4.55%, and a weighting greater than 19.10% would be necessary for the chosen alternative to be ALT3. This increase is not considered feasible by the decision group. The model is therefore considered robust.
Figure A1.
Sensitivity analysis for the Prafcd system: (a) Maintenance cost; (b) Safety of maintenance workers; (c) Suitability of maintenance actions; (d) Impact on the environment; (e) Impact on health care organization activity.
Figure A1.
Sensitivity analysis for the Prafcd system: (a) Maintenance cost; (b) Safety of maintenance workers; (c) Suitability of maintenance actions; (d) Impact on the environment; (e) Impact on health care organization activity.
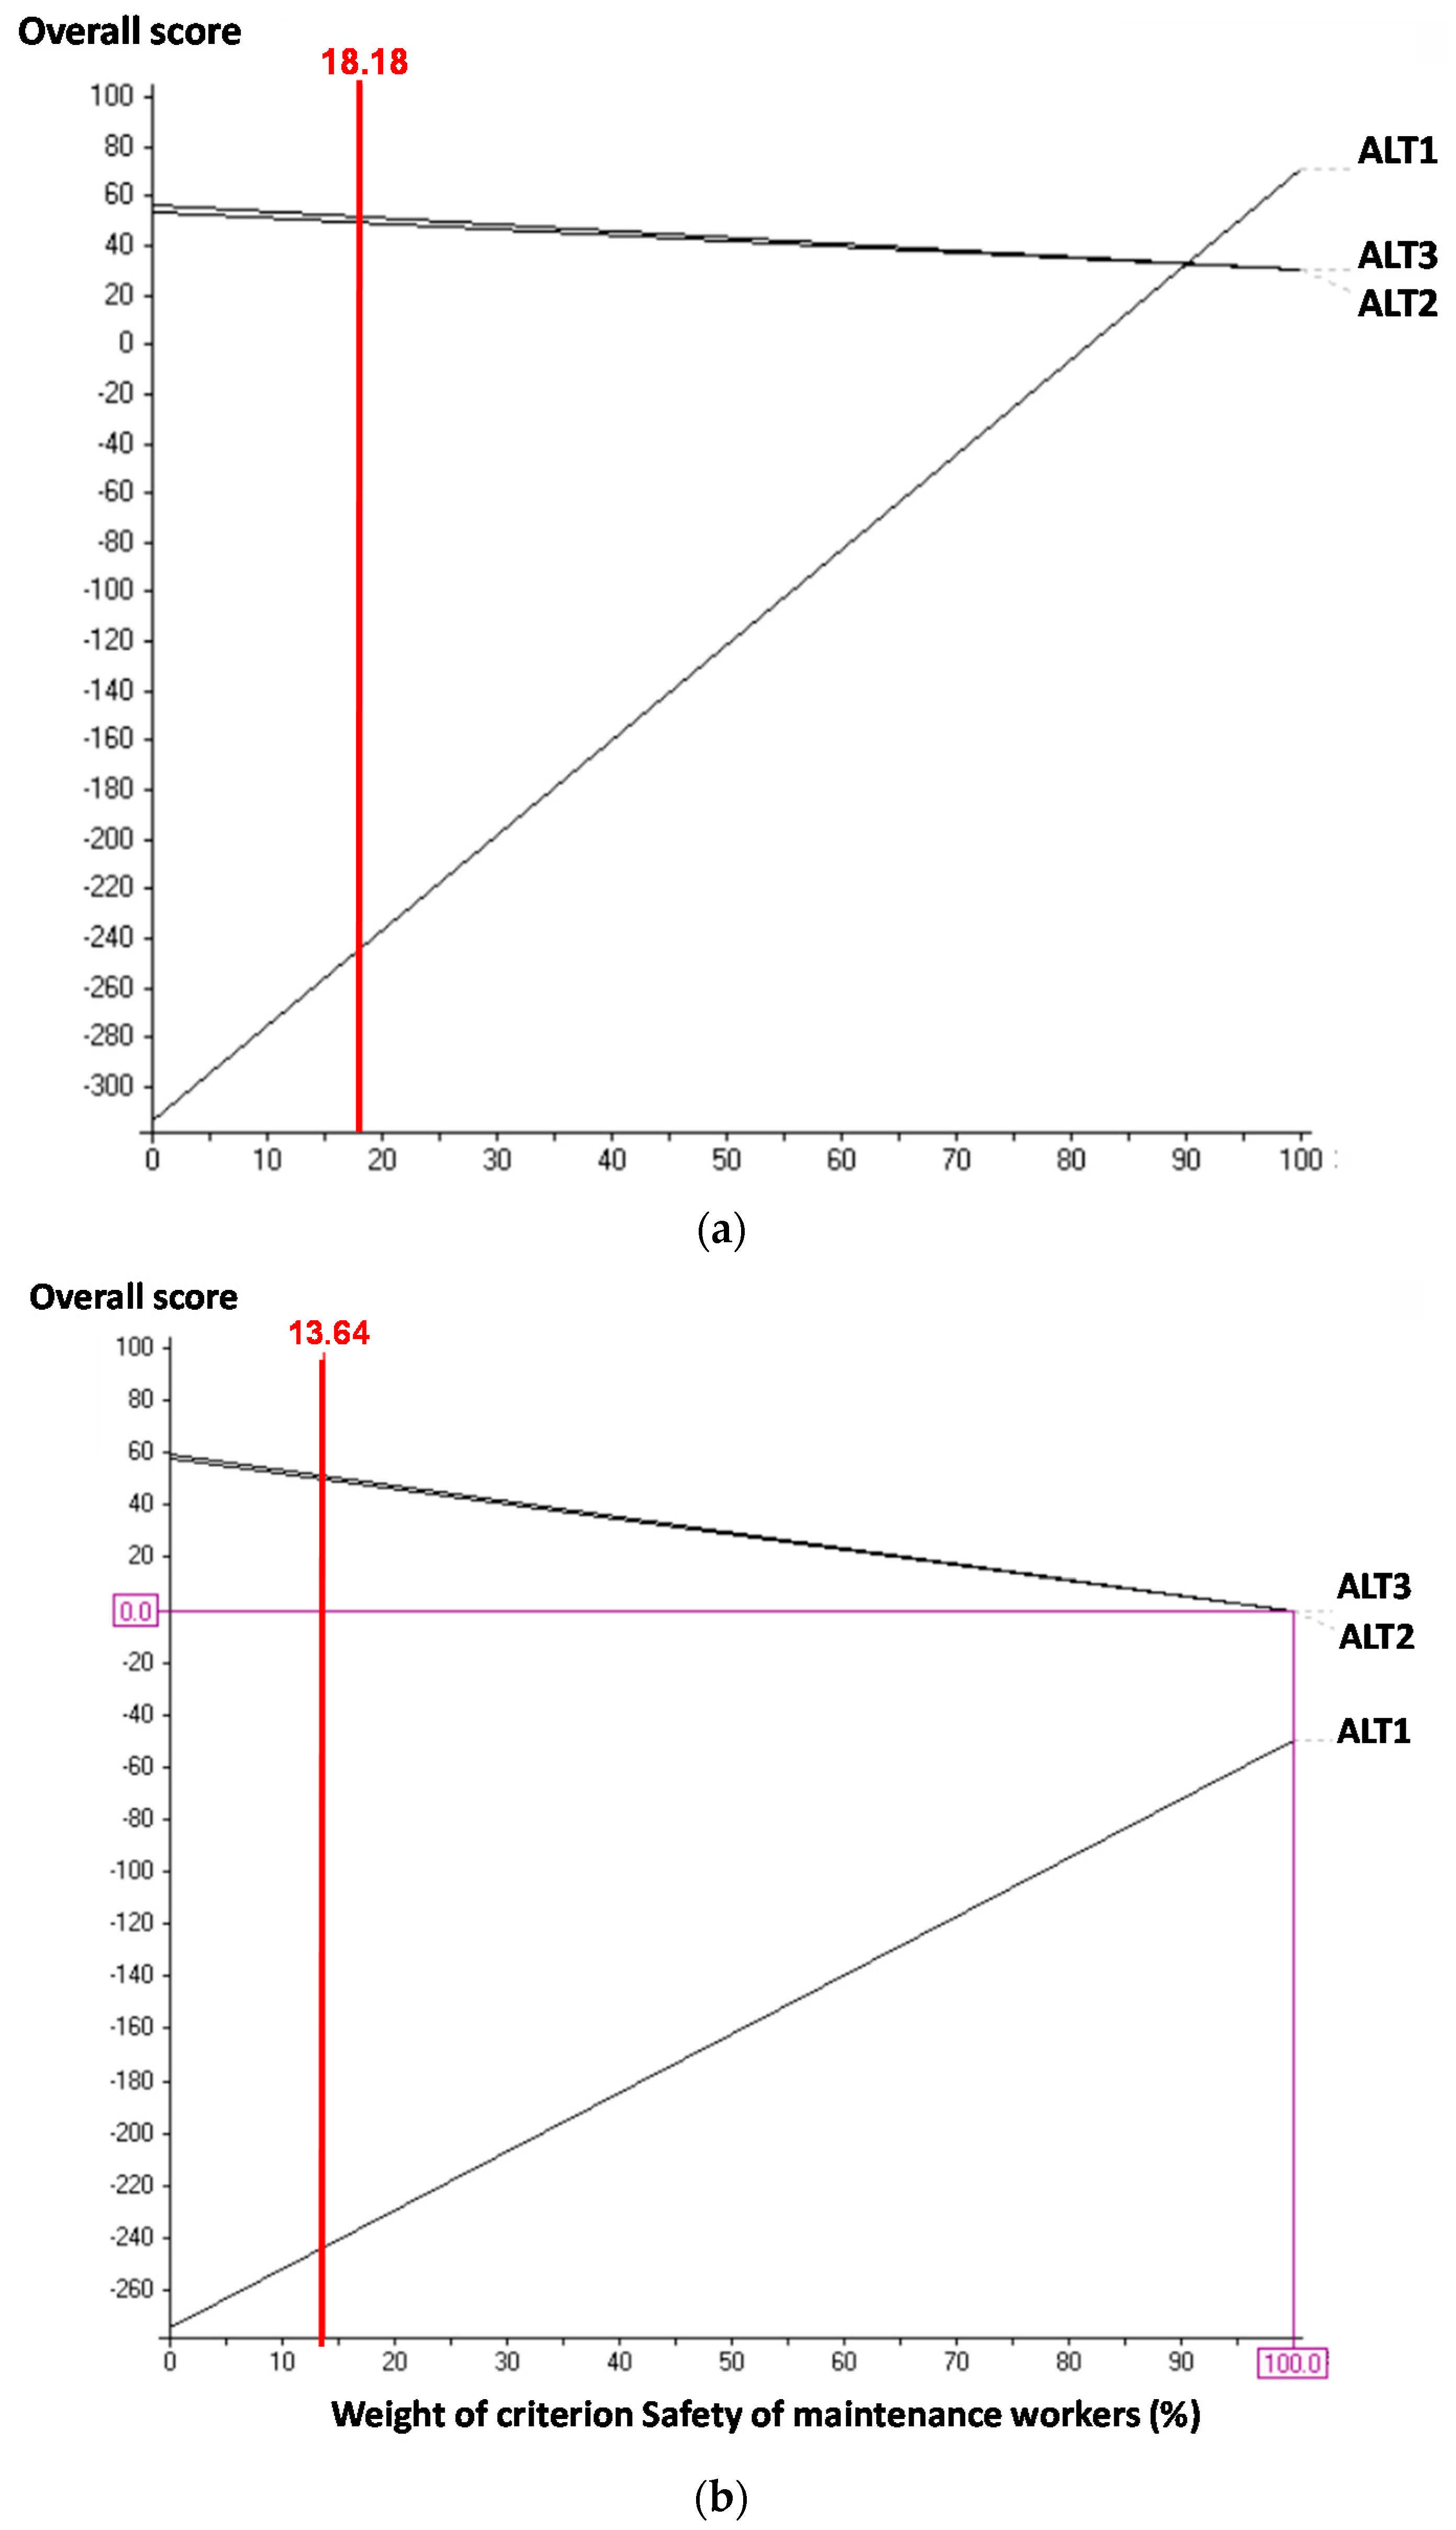

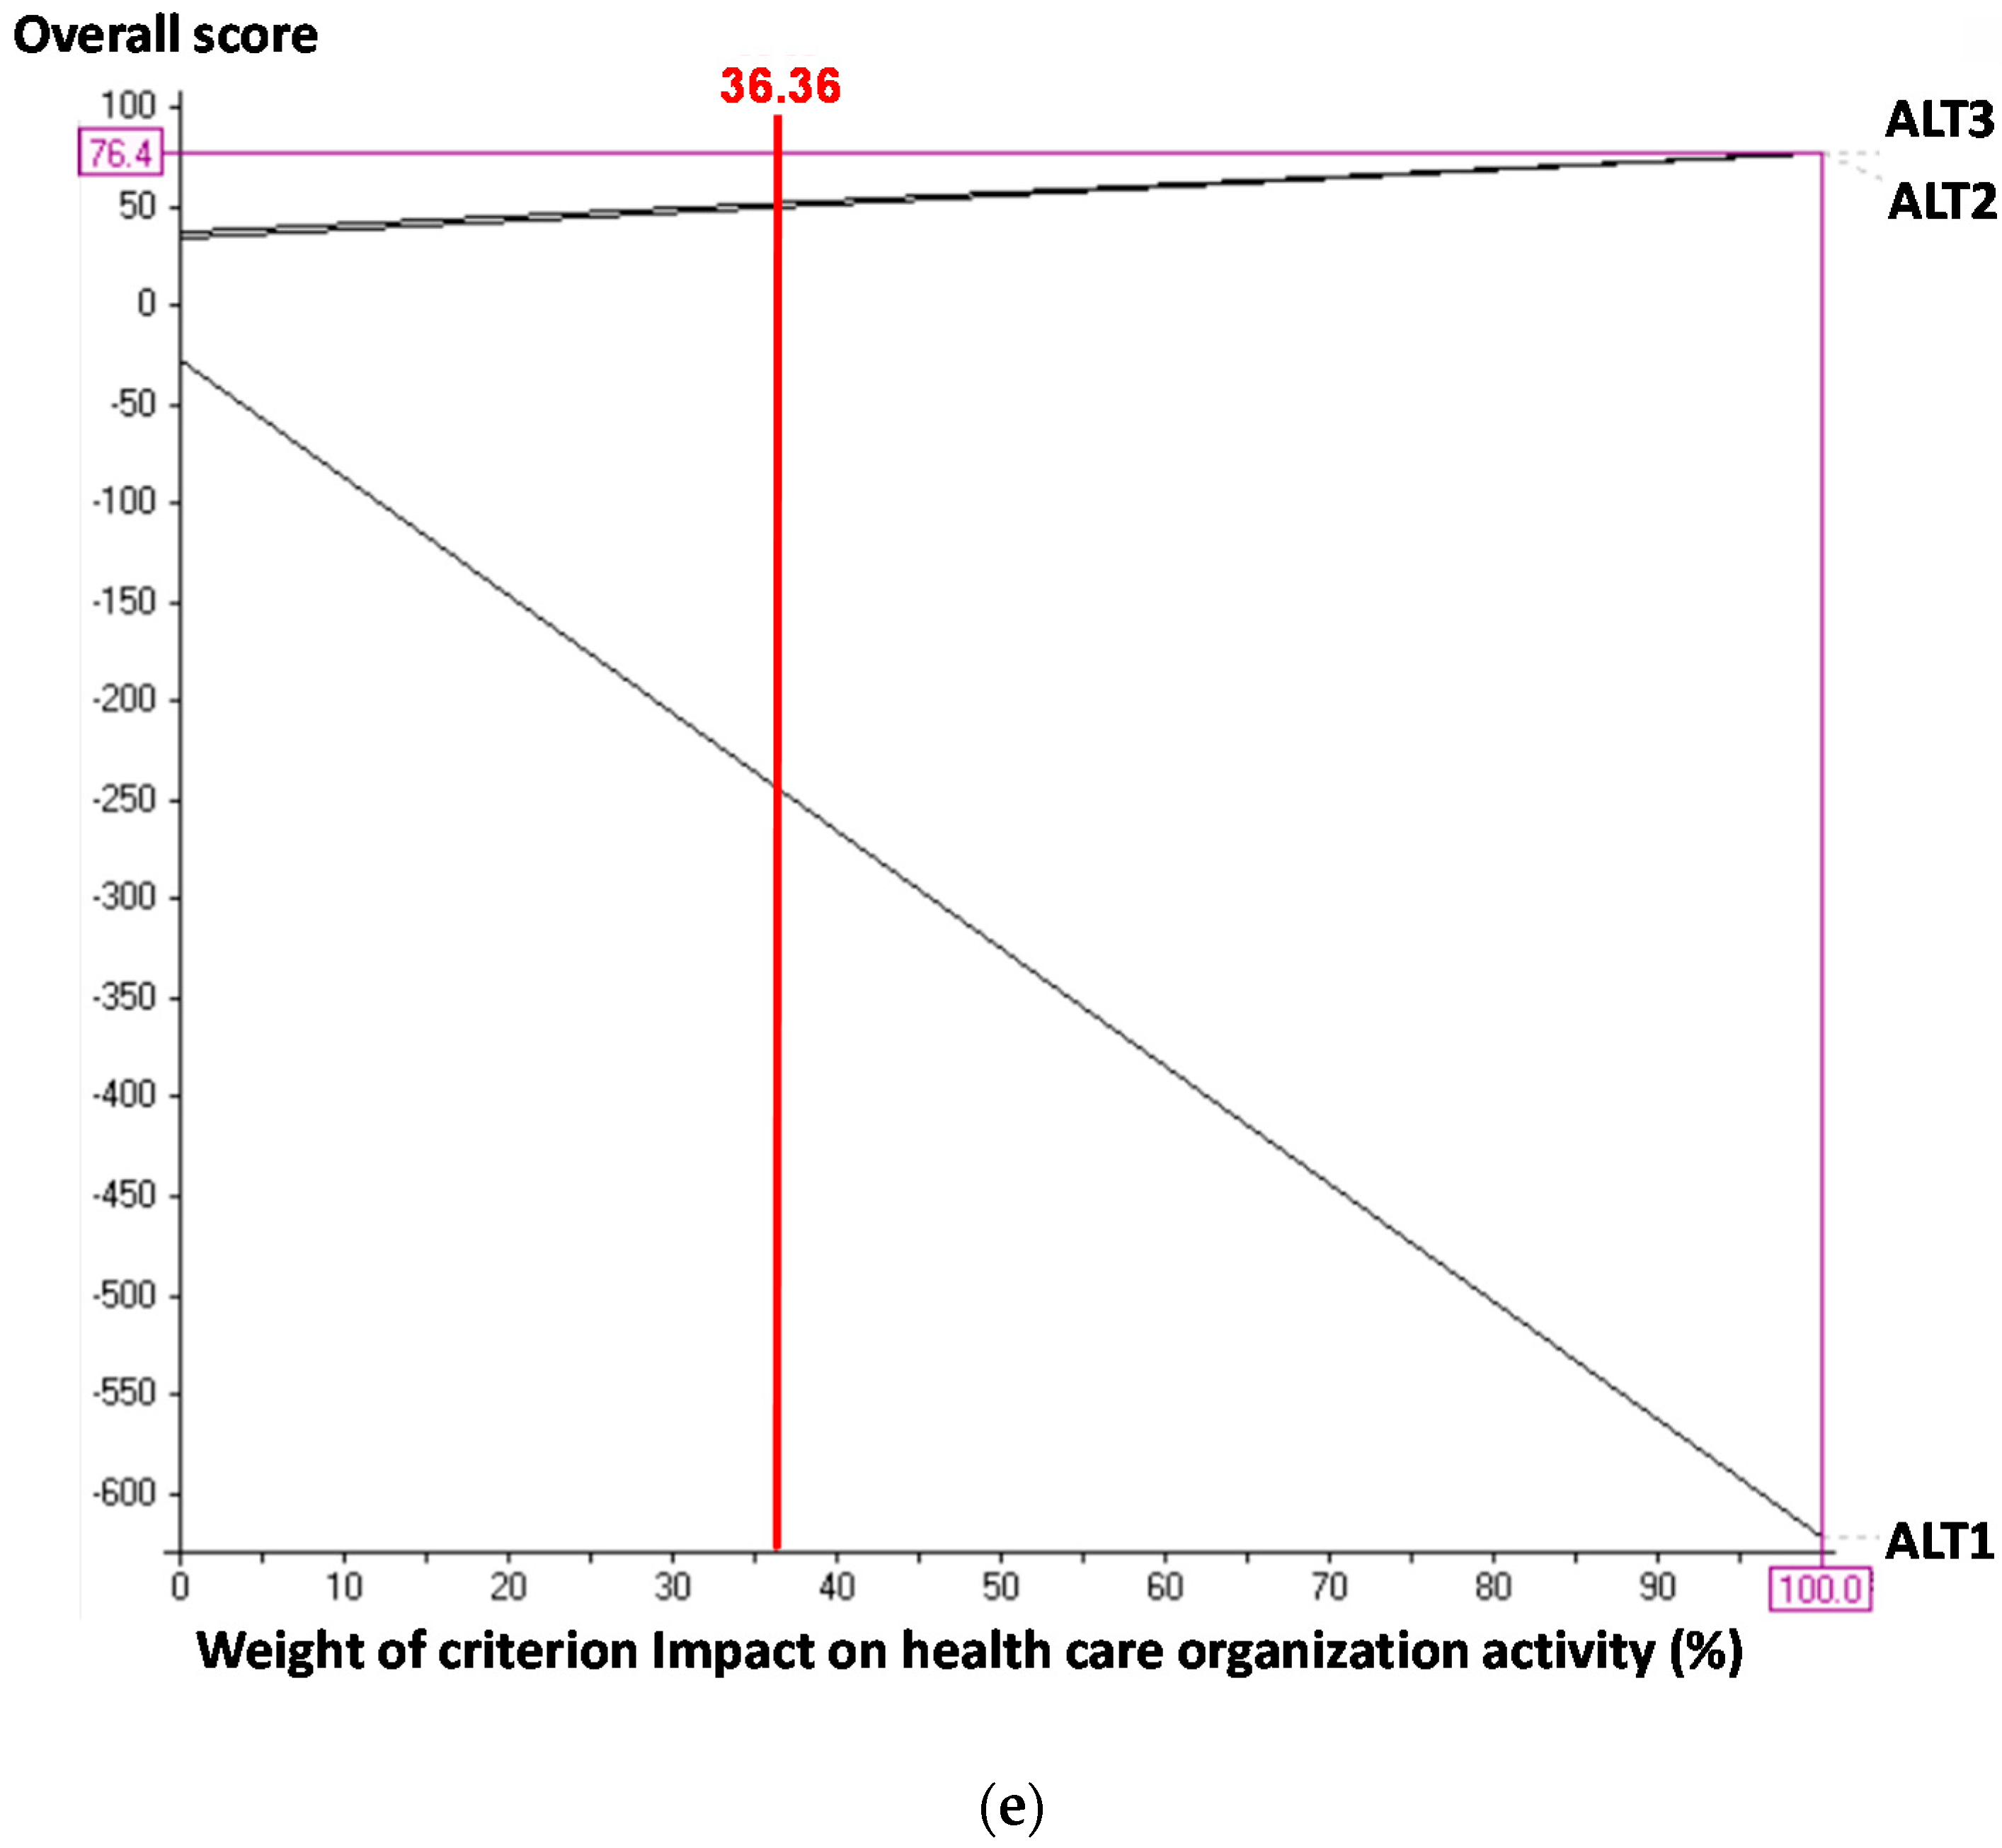
Figure A2.
Sensitivity analysis for the Prafri system: (a) Maintenance cost; (b) Safety of maintenance workers; (c) Suitability of maintenance actions; (d) Impact on the environment; (e) Impact on health care organization activity.
Figure A2.
Sensitivity analysis for the Prafri system: (a) Maintenance cost; (b) Safety of maintenance workers; (c) Suitability of maintenance actions; (d) Impact on the environment; (e) Impact on health care organization activity.

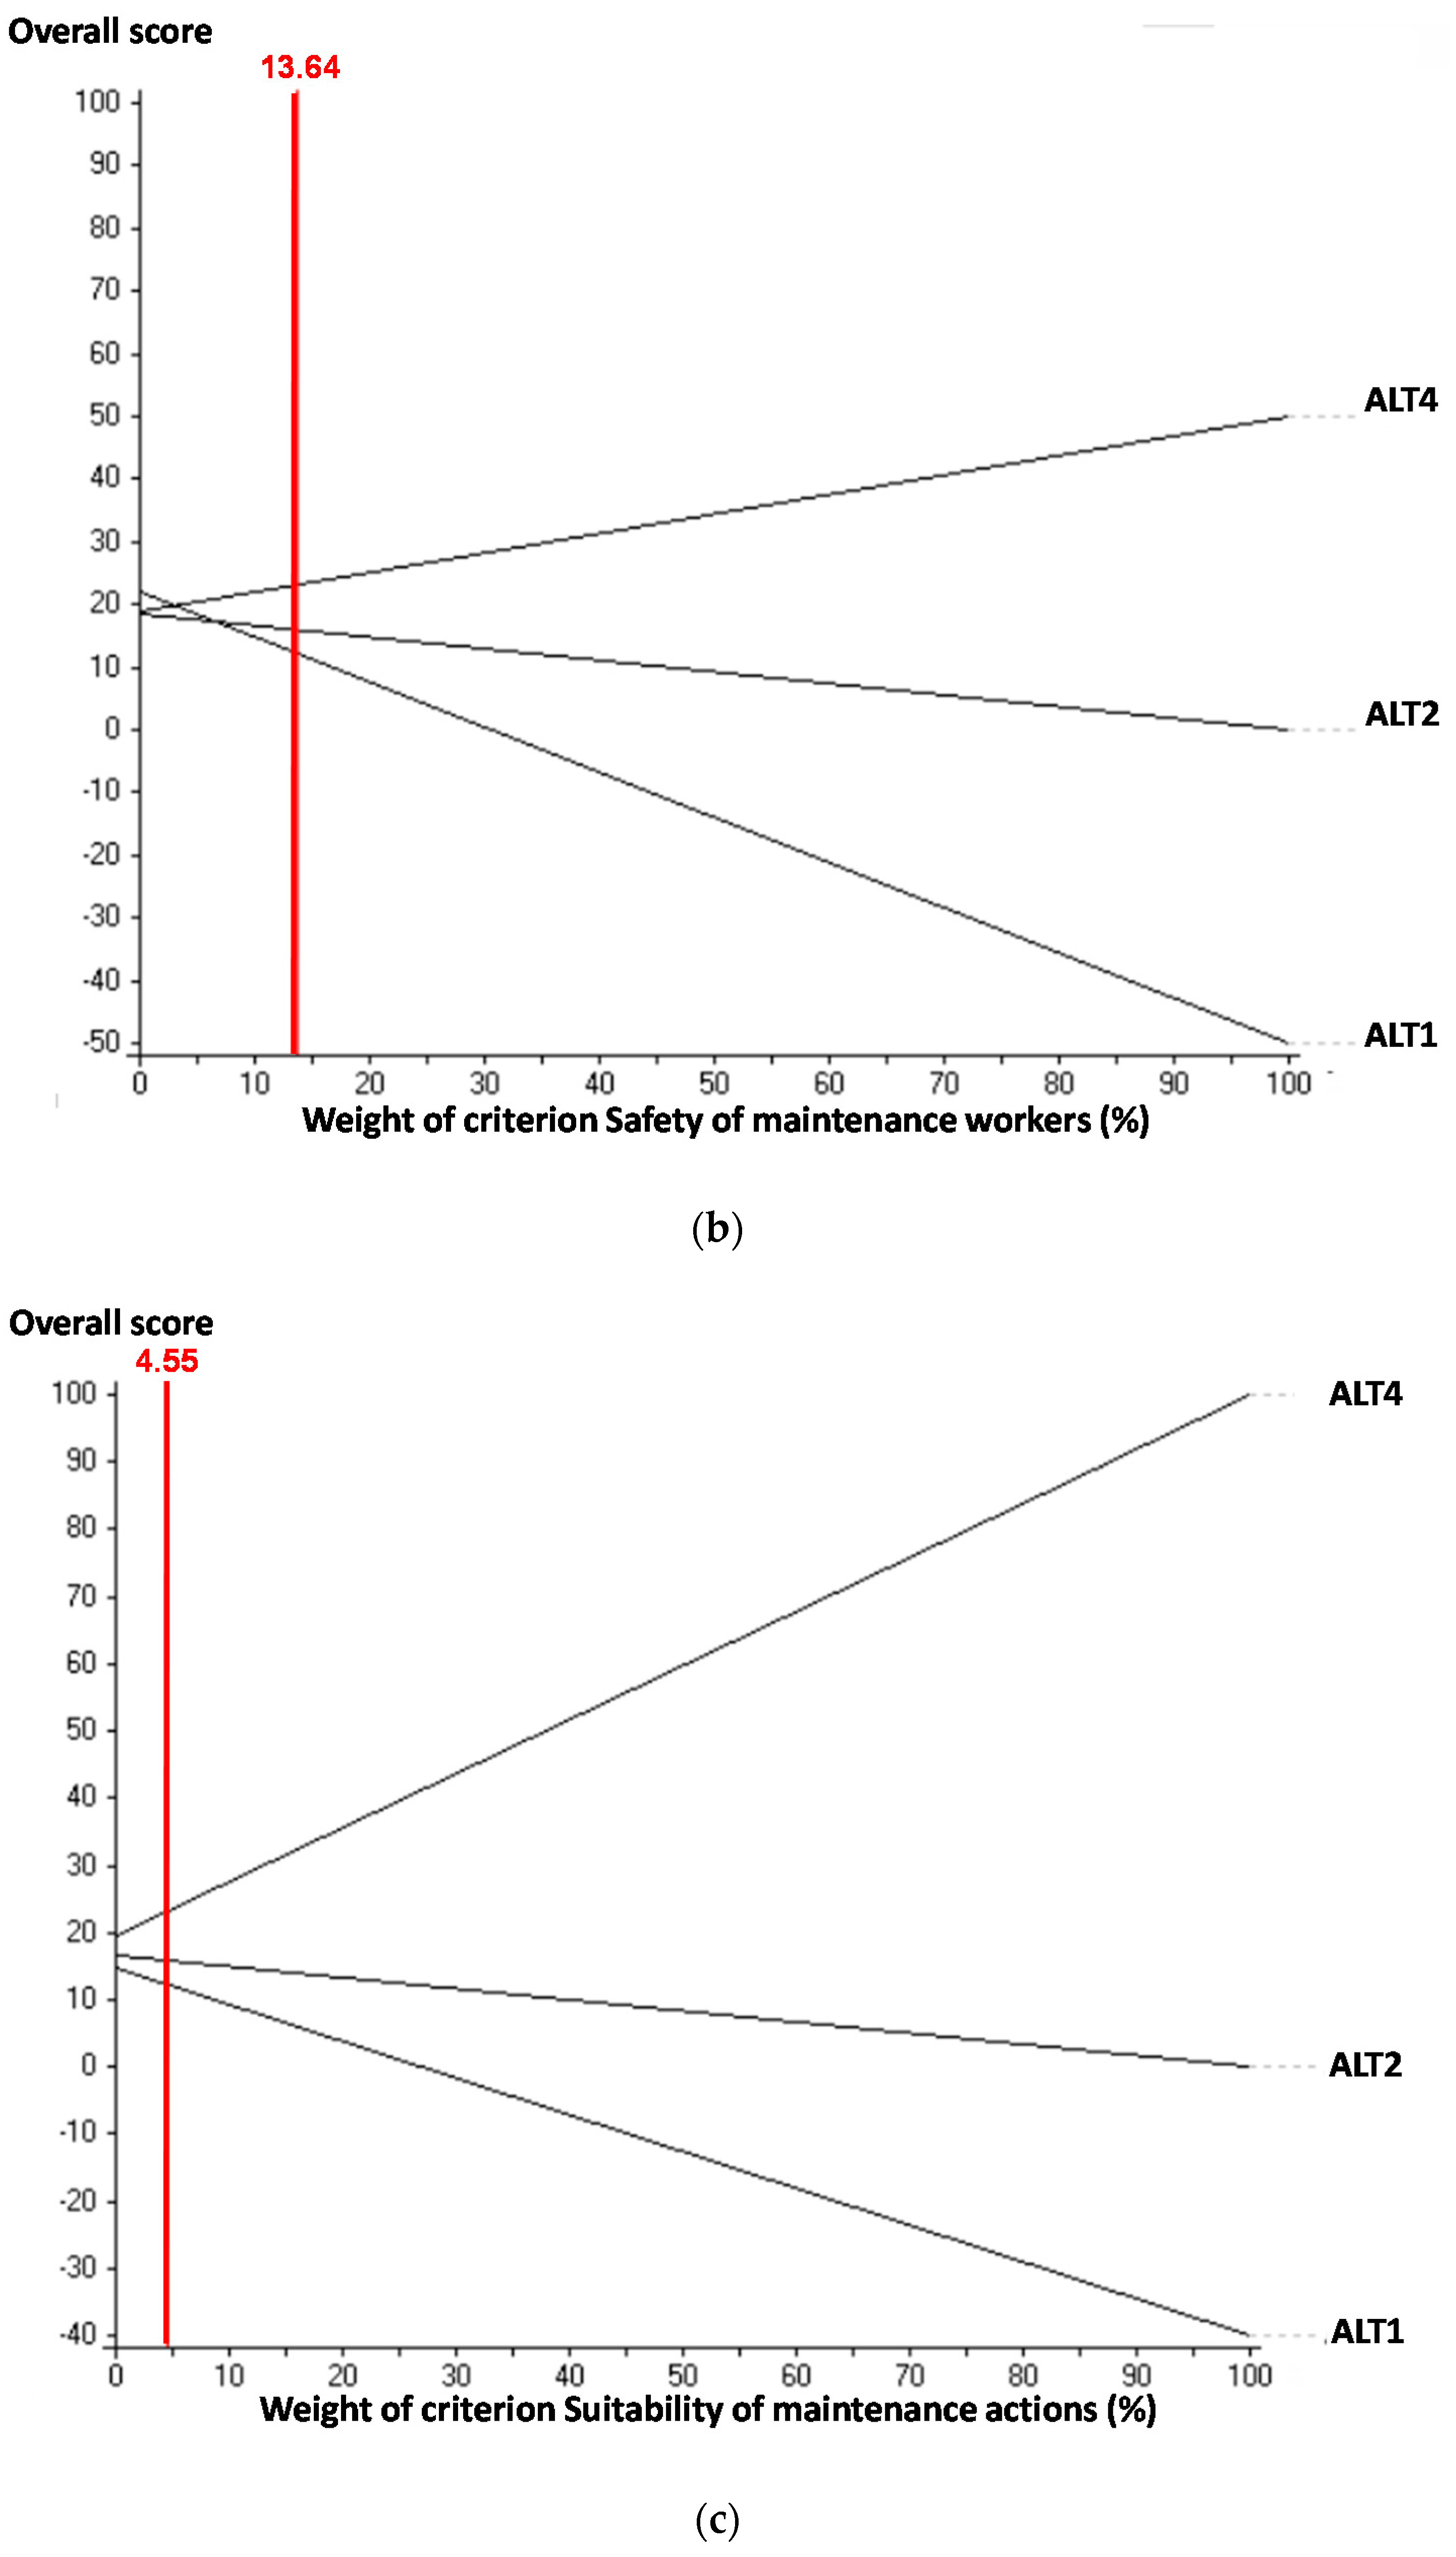

Figure A3.
Sensitivity analysis for the Pacbom and Pafbom systems: (a) Maintenance cost; (b) Safety of maintenance workers; (c) Suitability of maintenance actions; (d) Impact on the environment; (e) Impact on health care organization activity.
Figure A3.
Sensitivity analysis for the Pacbom and Pafbom systems: (a) Maintenance cost; (b) Safety of maintenance workers; (c) Suitability of maintenance actions; (d) Impact on the environment; (e) Impact on health care organization activity.

References
- Comunidad de Madrid. Guía de Ahorro y Eficiencia Energética en Hospitales, Consejería de Economía y Hacienda, organización Dirección General de Industria, Energía y Minas; Comunidad de Madrid: Madrid, Spain, 2010; Available online: www.madrid.org (accessed on 18 May 2016).
- ATECYR (Asociación Técnica Española de Climatización y Refrigeración). Agua Caliente Sanitaria Central. Guía Técnica; Instituto para la Diversificación y Ahorro de la Energía (IDAE) Serie Ahorro y Eficiencia Energética en la Climatización; ATECYR: Madrid, Spain, 2010.
- IDAE (Instituto para la Diversificación y Ahorro de la Energía). Guía Técnica: Mantenimiento de Instalaciones Térmicas; IDEA: Madrid, Spain, 2007.
- Siew-Hong, D.; Shahrul, K. Selection of optimal maintenance policy by using fuzzy multi criteria decision making method. In Proceedings of the International Conference on Industrial Engineering and Operations Management Istanbul, Istanbul, Turkey, 3–6 July 2012. [Google Scholar]
- Figueiredo, J.F.; Gonçalves, O.L.; Gomes, H.; Huamanchumo, R.; de Jesus, V.; Meiriño, M.J. Multi-Criteria Indicator for Sustainability Rating in Suppliers of the Oil and Gas Industries in Brazil. Sustainability 2014, 6, 1107–1128. [Google Scholar]
- Huang, I.B.; Keisler, J.; Linkov, I. Multi-criteria decision analysis in environmental sciences: Ten years of applications and trends. Sci. Total Environ. 2011, 409, 3578–3594. [Google Scholar] [CrossRef] [PubMed]
- Wątróbski, J.; Ziemba, P.; Jankowski, J.; Zioło, M. Green Energy for a Green City—A Multi-Perspective Model Approach. Sustainability 2016, 8, 702. [Google Scholar] [CrossRef]
- Carnero, M.C. Assessment of Environmental Sustainability in Health Care Organizations. Sustainability 2015, 7, 8270–8291. [Google Scholar] [CrossRef]
- Momete, D.C. Building a Sustainable Healthcare Model: A Cross-Country Analysis. Sustainability 2016, 8, 836. [Google Scholar] [CrossRef]
- López, M. Hospitales Eficientes: Una Revisión del Consumo Energético Óptimo. Ph.D. Thesis, University of Salamanca, Salamanca, Spain, 2011. [Google Scholar]
- García, B. Análisis de eficiencia del sector hospitalario: Una revisión de métodos. Cuad. Estudios Empres. 1997, 7, 151–176. [Google Scholar]
- Toloie-Eshlaghy, A.; Homayonfar, M. MCDM Methodologies and Applications: A Literature Review from 1999 to 2009. Res. J. Int. Stud. 2011, 21, 86–137. [Google Scholar]
- Mardani, A.; Jusoh, A.; Nor, K.M.D.; Khalifah, Z.; Zakwan, N.; Valipour, A. Multiple criteria decision-making techniques and their applications—A review of the literature from 2000 to 2014. J. Econ. Res. Ekonom. Istraz. 2015, 28, 516–571. [Google Scholar] [CrossRef]
- Kumar, A.; Sah, B.; Singh, A.R.; Deng, Y.; He, X.; Kumar, P. A review of multi criteria decision making (MCDM) towards sustainable renewable energy development. Renew. Sust. Energ. Rev. 2017, 69, 596–609. [Google Scholar] [CrossRef]
- Hajkowicz, S.A.; McDonald, G.T.; Smith, P.N. An evaluation of multiple objective decision support weighting techniques in natural resource management. J. Environ. Plann Man 2000, 43, 505–518. [Google Scholar] [CrossRef]
- Triantaphyllou, E.; Shu, B.; Nieto, S.; Ray, T. Multi-Criteria Decision Making: An Operations Research Approach. In Encyclopedia of Electrical and Electronics Engineering; Webster, J.G., Ed.; John Wiley & Sons: New York, NY, USA, 1998; Volume 15, pp. 175–186. [Google Scholar]
- Ananda, J.; Herath, G. A critical review of multi-criteria decision making methods with special reference to forest management and planning. Ecol. Econ. 2009, 68, 2535–2548. [Google Scholar] [CrossRef]
- Zheng, J.H.; Chen, J.J.; Wu, Q.H.; Jing, Z.X. Multi-objective optimization and decision making for power dispatch of a large-scale integrated energy system with distributed DHCs embedded. Appl. Energy 2015, 154, 369–379. [Google Scholar] [CrossRef]
- Yu, S.; Zheng, S.; Gao, S.; Yang, J. A multi-objective decision model for investment in energy savings and emission reductions in coal mining. Eur. J. Oper. Res. 2017, in press. [Google Scholar] [CrossRef]
- Kantas, A.B.; Cobuloglu, H.I.; Büyüktahtakin, I.E. Multi-source capacitated lotsizing for economically viable and clean biofuel production. J. Clean Prod. 2015, 94, 116–129. [Google Scholar] [CrossRef]
- Cobuloglu, H.I.; Büyüktahtakin, I.E. Food vs Biofuel: An Optimization Approach to the Spatio-Temporal Analysis of Land-Use Competition and Environmental Impacts. Appl. Energy 2015, 140, 418–434. [Google Scholar] [CrossRef]
- Martorell, S.; Villanueva, J.F.; Nebot, Y.C.S.; Sánchez, A.; Pitarch, J.L.; Serradell, V. RAMS +C informed decision-making with application to multi-objective optimization of technical specifications and maintenance using genetic algorithms. Reliab. Eng. Syst. Safe 2005, 87, 65–75. [Google Scholar] [CrossRef]
- Bevilacqua, M.; Braglia, M. The analytic hierarchy process applied to maintenance strategy selection. Reliab. Eng. Syst. Safe 2000, 70, 71–83. [Google Scholar] [CrossRef]
- Al-Najjar, B.; Alsyouf, I. Selecting the most efficient maintenance approach using fuzzy multiple criteria decision making. Int. J. Prod. Econ. 2003, 84, 85–100. [Google Scholar] [CrossRef]
- Emblemsvag, J.; Tonning, L. Decision support in selecting maintenance organization. J. Qual. Maint. Eng. 2003, 9, 11–24. [Google Scholar] [CrossRef]
- Bertolini, M.; Bevilacqua, M.A. A combined goal programming-AHP approach to maintenance selection problem. Reliab. Eng. Syst. Safe 2006, 91, 839–848. [Google Scholar] [CrossRef]
- Gómez de León, F.C.; Ruiz, J.J. Maintenance strategy based on a multicriterion classification of equipments. Reliab. Eng. Syst. Safe 2006, 91, 444–451. [Google Scholar] [CrossRef]
- Wang, L.; Chu, J.; Wu, J. Selection of optimum maintenance strategies based on a fuzzy analytic hierarchy process. Int. J. Prod. Econ. 2007, 107, 151–163. [Google Scholar] [CrossRef]
- Shyjith, K.; Ilangkumaran, M.; Kumanan, S. Multi-criteria decision-making approach to evaluate optimum maintenance strategy in textile industry. J. Qual. Maint. Eng. 2008, 14, 375–386. [Google Scholar] [CrossRef]
- Ilangkumaran, M.; Kumanan, S. Selection of maintenance policy for textile industry using hybrid multi-criteria decision making approach. J. Manuf. Technol. Manag. 2009, 20, 1009–1022. [Google Scholar] [CrossRef]
- Mousavi, S.S.; Nezami, F.G.; Heydar, M.; Aryanejad, M.B. A hybrid fuzzy group decision making and factor analysis for selecting maintenance strategy. In Proceedings of the Computers & Industrial Engineering International Conference, Troyes, France, 6–9 July 2009; pp. 1204–1209. [Google Scholar]
- Ahmadi, A.; Gupta, S.; Karim, R.; Kumar, U. Selection of maintenance strategy for aircraft systems using multi-criteria decision making methodologies. Int. J. Reliab. Qual. Saf. Eng. 2010, 17, 223–243. [Google Scholar] [CrossRef]
- Arunraj, N.S.; Maiti, J. Risk-based maintenance policy selection using AHP and goal programming. Saf. Sci. 2010, 48, 238–247. [Google Scholar] [CrossRef]
- Ghosh, D.; Roy, S. A decision-making framework for process plant maintenance. Eur. J. Ind. Eng. 2010, 4, 78–98. [Google Scholar] [CrossRef]
- Chen, F.L.; Chen, Y.C. Evaluating the maintenance performance of the semiconductor factories based on the analytical hierarchy process and grey relational analysis. Am. J. Appl. Sci. 2010, 7, 567–574. [Google Scholar] [CrossRef]
- Zhaoyang, T.; Jianfeng, L.; Zongzhi, W.; Weifeng, Z.J.H. An evaluation of maintenance strategy using risk based inspection. Saf. Sci. 2011, 49, 852–860. [Google Scholar]
- Zaim, S.; Turkyílmaz, A.; Acar, M.F.; Al-Turki, U.; Demirel, O.F. Maintenance strategy selection using AHP and ANP algorithms: A case study. J. Qual. Maint. Eng. 2012, 18, 16–29. [Google Scholar] [CrossRef]
- Shahin, A.; Pourjavad, E.; Shirouyehzad, H. Selecting optimum maintenance strategy by analytic network process with a case study in the mining industry. Int. J. Product. Qual. Manag. 2012, 10, 464–483. [Google Scholar] [CrossRef]
- Cavalcante, C.A.; Lopes, V.R.S. Multi-criteria model to support the definition of opportunistic maintenance policy: A study in a cogeneration system. Energy 2015, 80, 32–40. [Google Scholar] [CrossRef]
- Kirubakaran, B.; Ilangkumaran, M. Selection of optimum maintenance strategy based on FAHP integrated with GRA–TOPSIS. Ann. Oper. Res. 2016, 245, 285–313. [Google Scholar] [CrossRef]
- Carnero, M.C. MCDA Techniques in Maintenance Policy Selection. In Encyclopedia of Business Analytics and Optimization; Wang, J., Ed.; IGI Gobal: Hershey, PA, USA, 2014; Volume 3, pp. 406–415. [Google Scholar]
- Taghipour, S.; Banjevic, D.; Jardine, A.K.S. Reliability analysis of maintenance data for complex medical devices. Qual. Reliab. Eng. Int. 2011, 27, 71–84. [Google Scholar] [CrossRef]
- Sezdi, M. Performance Analysis for medical devices. Biomed. Eng. Res. 2013, 2, 139–146. [Google Scholar] [CrossRef]
- Taghipour, S.; Banjevic, D.; Jardine, A.K.S. Prioritization of medical equipment for maintenance decisions. J. Oper. Res. Soc. 2011, 62, 1666–1687. [Google Scholar] [CrossRef]
- Carnero, M.C.; Gómez, A. A multicriteria decision making approach applied to improving maintenance policies in healthcare organizations. BMC Med. Inf. Decis. Mak. 2016. [Google Scholar] [CrossRef] [PubMed]
- International Electrotechnical Commission. Application of Markov Techniques; CEI IEC 61165:2006; International Electrotechnical Commission (IEC): Geneva, Switzerland, 2006. [Google Scholar]
- Kaufman, A. Methods and Models of Operations Research; Prentice-Hall: Upper Saddle River, NJ, USA, 1963. [Google Scholar]
- Haigh, J. Probability Models; Springer-Verlag Limited: London, UK, 2002. [Google Scholar]
- Hillier, F.; Lieberman, G. Introduction to Operations Research; McGraw-Hill Science: New York, NY, USA, 2002. [Google Scholar]
- Taha, H.A. Investigación de Operaciones; Pearson Education, Inc., Prentice-Hall: Naucalpan, México, 2004. [Google Scholar]
- Bana e Costa, C.A.; Vansnick, J.C. Applications of the MACBETH approach in the framework of an additive aggregation model. J. Multi Criteria Decis. Anal. 1997, 6, 107–114. [Google Scholar] [CrossRef]
- Bana e Costa, C.A.; Carvalho, R. Assigning priorities for maintenance, repair and refurbishment in managing a municipal housing stock. Eur. J. Oper. Res. 2002, 138, 380–391. [Google Scholar] [CrossRef]
- Bana e Costa, C.A.; Correa, E.; de Corte, J.M.; Vansnick, J.C. Facilitating bid evaluation in public call for tenders: A socio-technical approach. Omega Int. J. Manag. 2002, 30, 227–242. [Google Scholar] [CrossRef]
- Roubens, M.; Rusinowska, A.; de Swart, H. Using MACBETH to determine utilities of governments to parties in coalition formation. Eur. J. Oper. Res. 2006, 172, 588–603. [Google Scholar] [CrossRef]
- Bana e Costa, C.A.; Oliveira, M.D. A multicriteria decision analysis model for faculty evaluation. Omega Int. J. Manag. 2012, 40, 424–436. [Google Scholar] [CrossRef]
- Bana e Costa, C.A.; Carnero, M.C.; Duarte, M. A multi-criteria model for auditing a Predictive Maintenance Programme. Eur. J. Oper. Res. 2012, 217, 381–393. [Google Scholar] [CrossRef]
- Rodrigues, T.C. The MACBETH Approach to Health Value Measurement: Building a Population Health Index in Group Processes. Procedia Technol. 2014, 16, 1361–1366. [Google Scholar] [CrossRef]
- Lavoie, R.; Deslandes, J.; Proulx, F. Assessing the ecological value of wetlands using the MACBETH approach in Quebec City. J. Nat. Conserv. 2016, 30, 67–75. [Google Scholar] [CrossRef]
- Cardoso, T.; Oliveira, M.D.; Barbosa-Póvoa, A.; Nickel, S. Moving towards an equitable long-term care network: A multi-objective and multi-period planning approach. Omega Int. J. Manag. 2016, 58, 69–85. [Google Scholar] [CrossRef]
- Bozbura, F.T.; Beskese, A.; Kahraman, C. Prioritization of human capital measurement indicators using fuzzy AHP. Expert Syst. Appl. 2007, 32, 1100–1112. [Google Scholar] [CrossRef]
- Olken, B. Condorcet’s Paradox and Arrow’s Impossibility Theorem. MIT Open Course Ware. Available online: http://ocw.mit.edu (accessed on 20 December 2016).
- Bana e Costa, C.A.; de Corte, J.M.; Vansnick, J.C. M-MACBETH User’s Guide. 2005. Available online: http://www.m-macbeth.com (accessed on 20 December 2016).
- Rezaei, J. Best-worst multi-criteria decision-making method. Omega Int. J. Manag. 2015, 53, 49–57. [Google Scholar] [CrossRef]
- Bana e Costa, C.A.; de Corte, J.M.; Vansnick, J.C. MACBETH (Measuring Attractiveness by a Categorical Based Evaluation Technique). In Encyclopedia of Operations Research and Management Science; Cochran, J.J., Cox, L.A., Keskinocak, P., Kharoufeh, J.P., Smith, J.C., Eds.; John Wiley & Sons: New York, NY, USA, 2011. [Google Scholar]
- Bana e Costa, C.A.; Chagas, M.P. A career choice problem: An example of how to use MACBETH to build a quantitative value model based on qualitative value judgments. Eur. J. Oper. Res. 2004, 153, 323–331. [Google Scholar] [CrossRef]
- Keeney, R.L. Value Focused Thinking: A Path to Creative Decisionmaking; Harvard University Press: Cambridge, UK, 1992. [Google Scholar]
- Bana e Costa, C.A.; de Corte, J.M.; Vansnick, J.C. MACBETH. Int. J. Inf. Technol. Decis. Mak. 2012, 11, 359–387. [Google Scholar] [CrossRef]
Figure 1.
Analysis of criteria applied in Multi-Attribute Decision Making (MADM) literature.

Figure 2.
Set of boilers with 3200 kW nominal power.
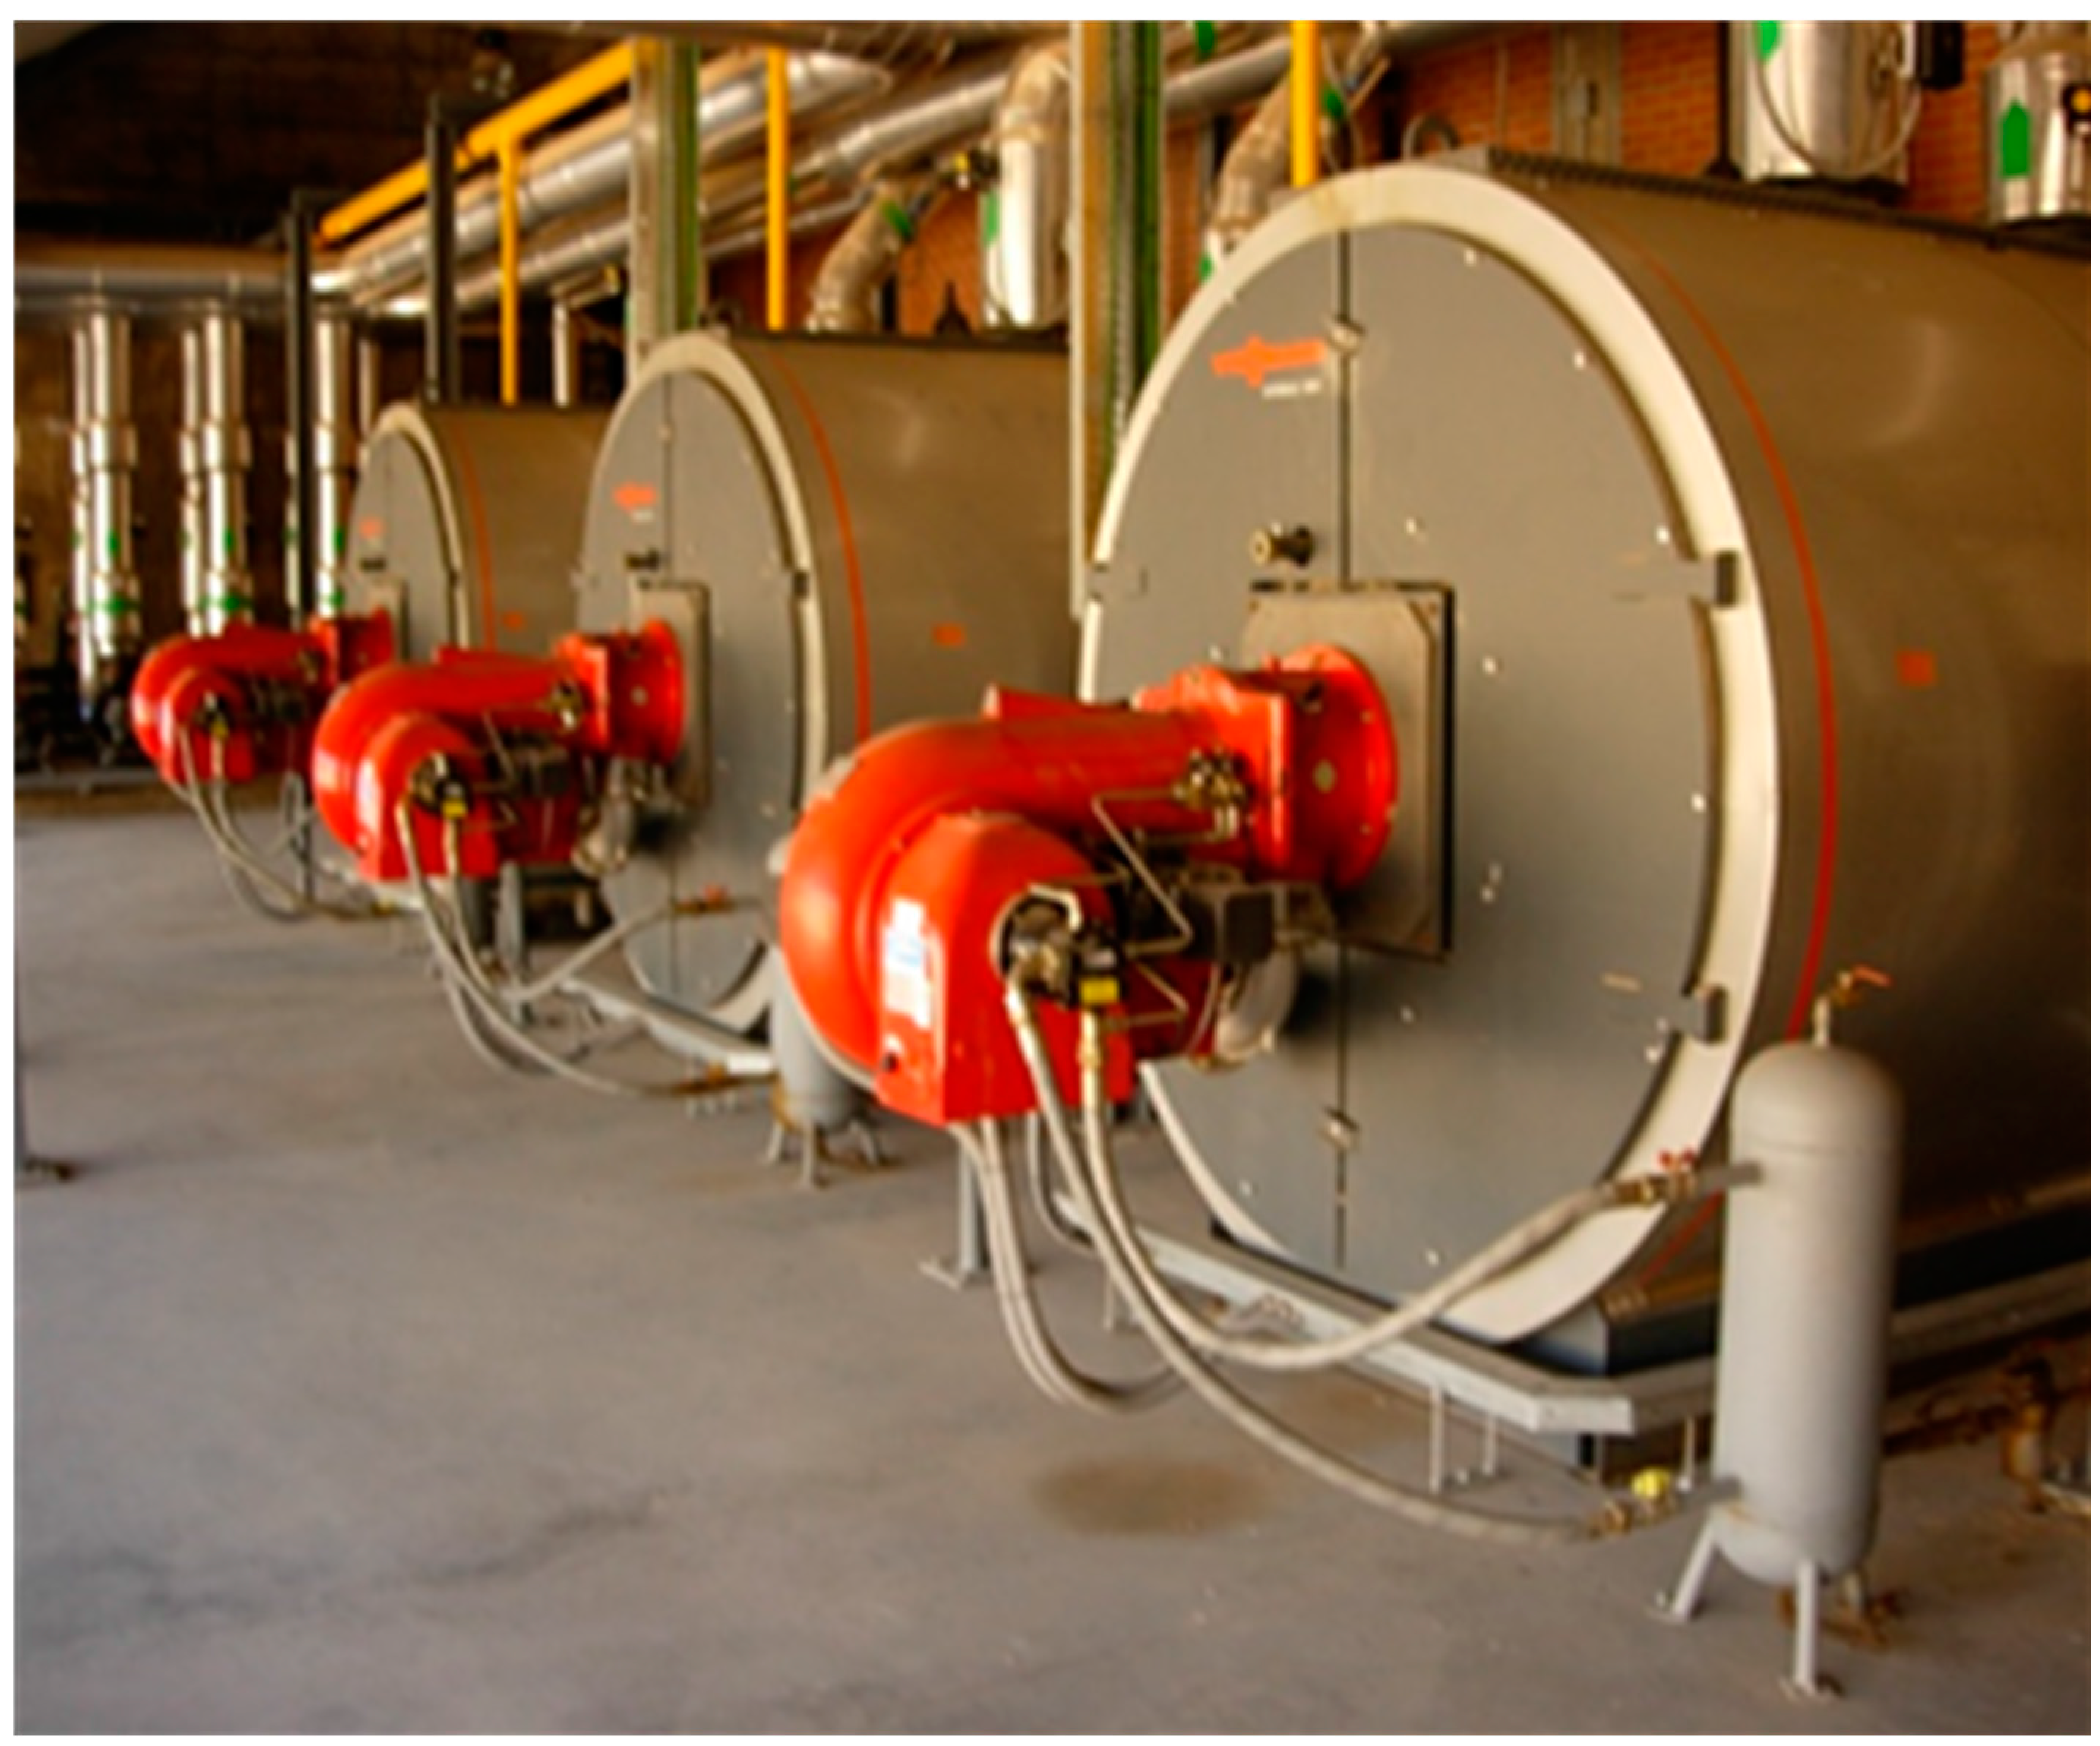
Figure 3.
Markov graph for the Pracal system.

Figure 4.
Markov graph for the Pacbom or Pafbom systems.

Figure 5.
Value tree.
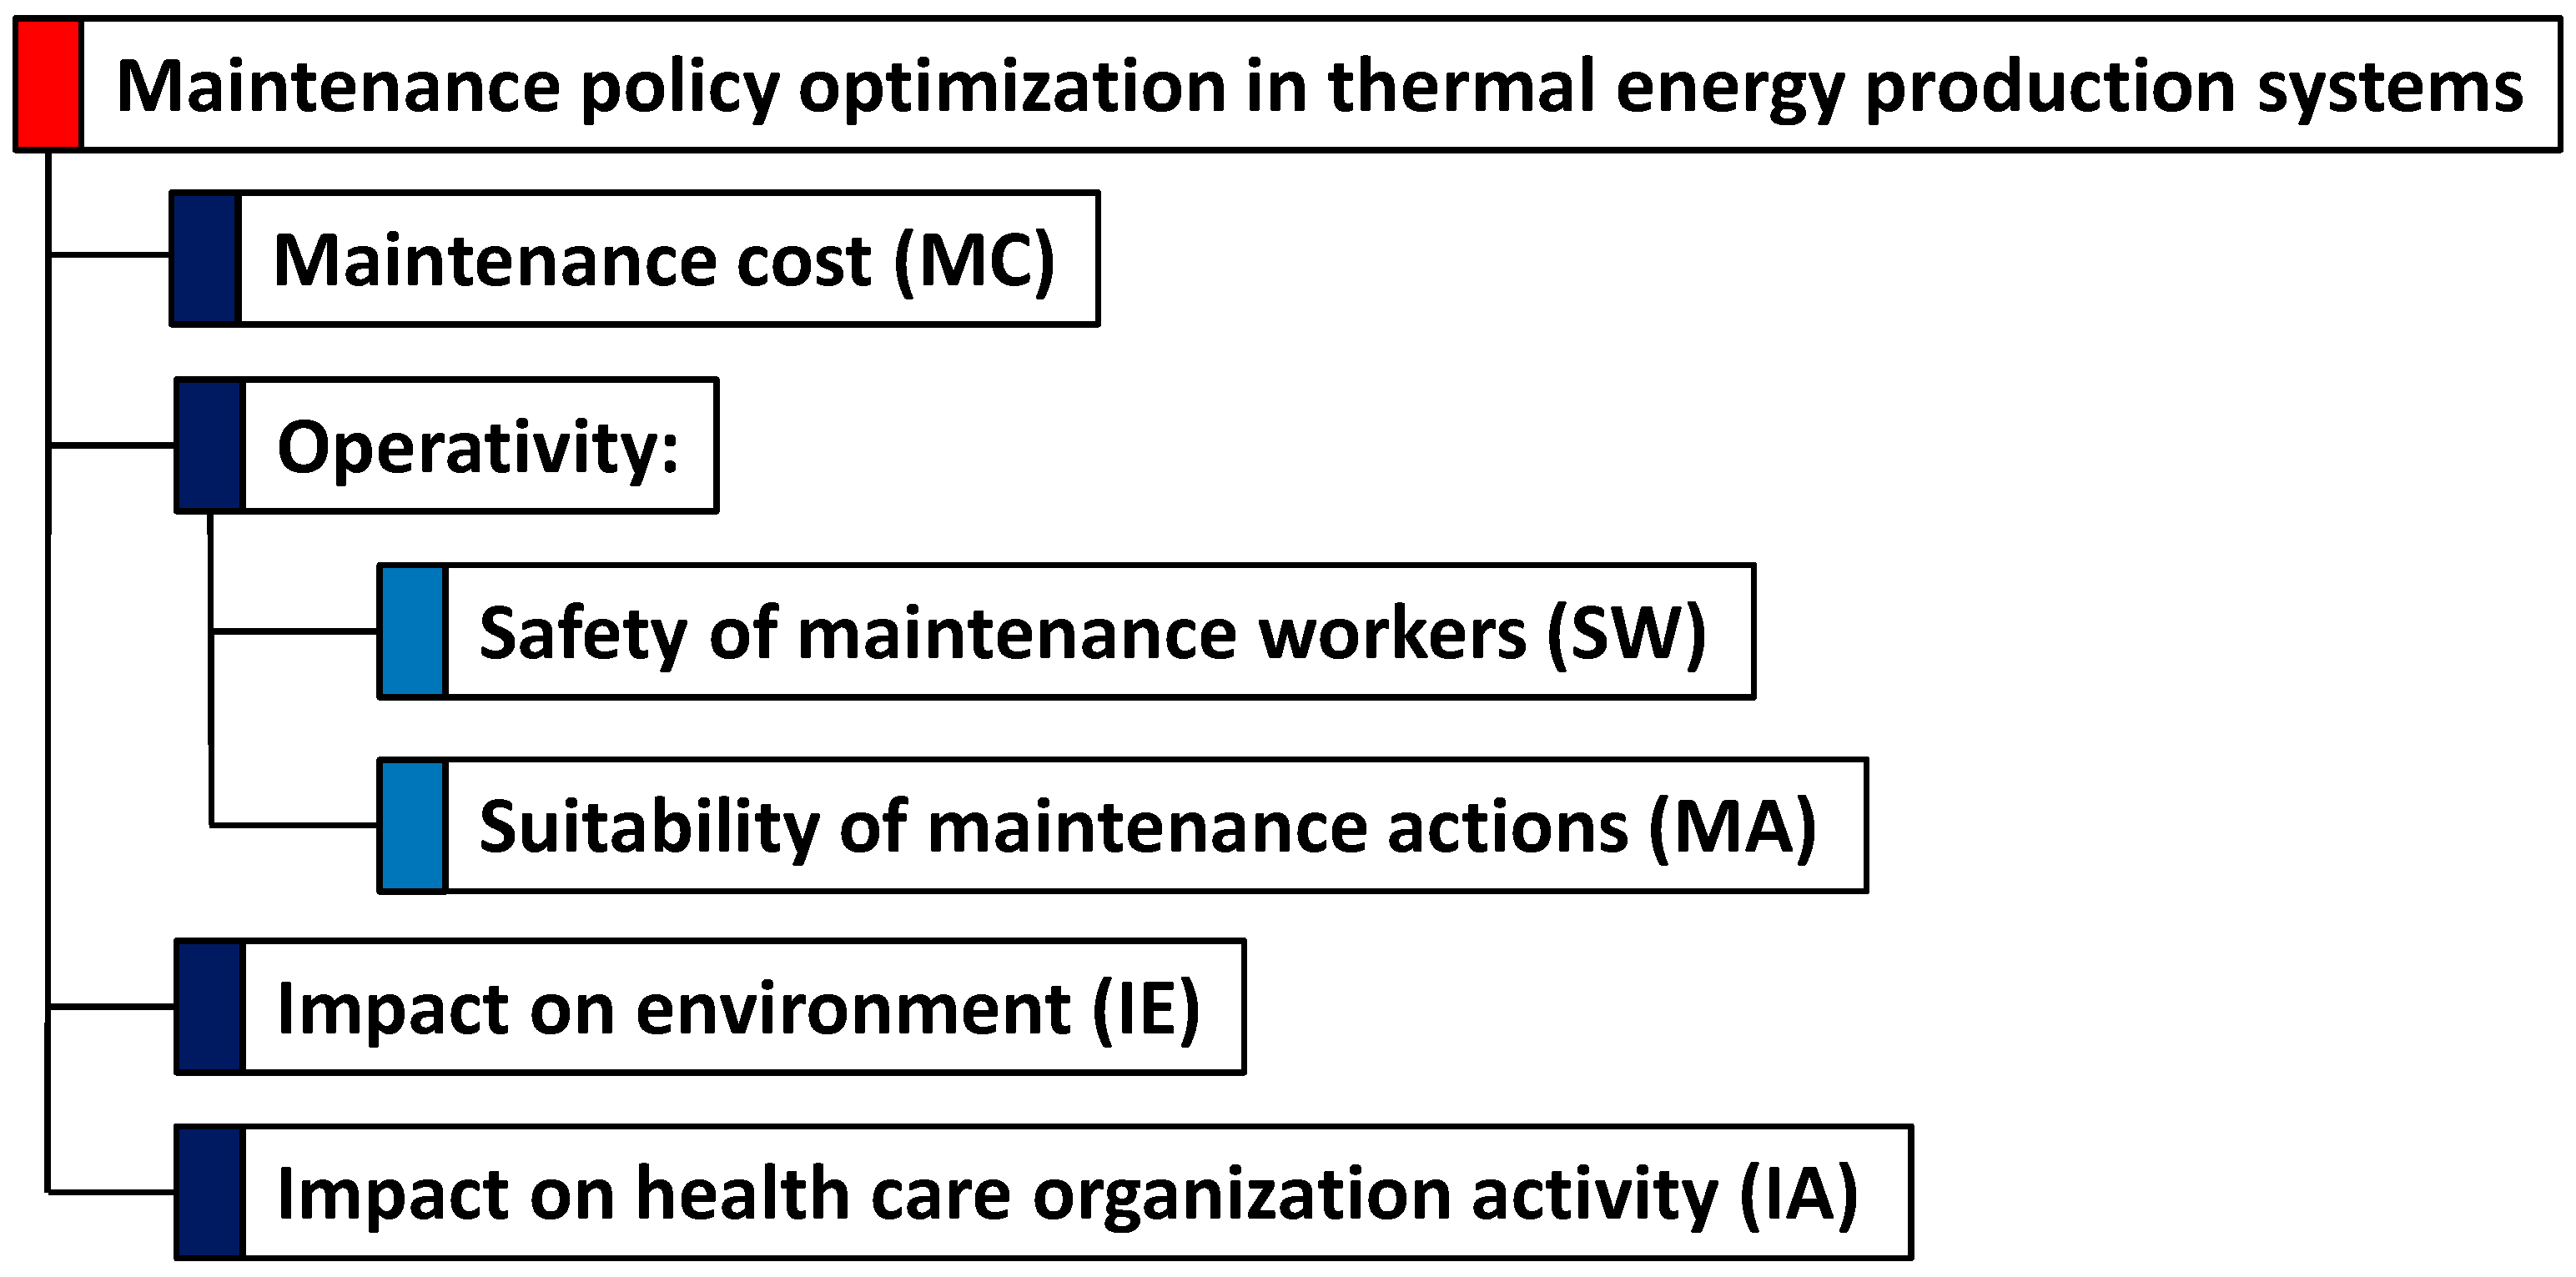
Figure 6.
Measuring Attractiveness by a Categorical Based Evaluation Technique (MACBETH) judgement matrices for the criteria/subcriteria: Safety of maintenance workers, Suitability of maintenance actions, Maintenance costs, Impact on the environment and Impact on health care organization activity (from top to bottom).

Figure 7.
Value functions of criteria: (a) Safety of maintenance workers; (b) Suitability of maintenance actions; (c) Maintenance costs; (d) Impact on the environment (e) Impact on health care organization activity.
Figure 7.
Value functions of criteria: (a) Safety of maintenance workers; (b) Suitability of maintenance actions; (c) Maintenance costs; (d) Impact on the environment (e) Impact on health care organization activity.

Figure 8.
Example of analysis of the value function of Maintenance cost criterion.
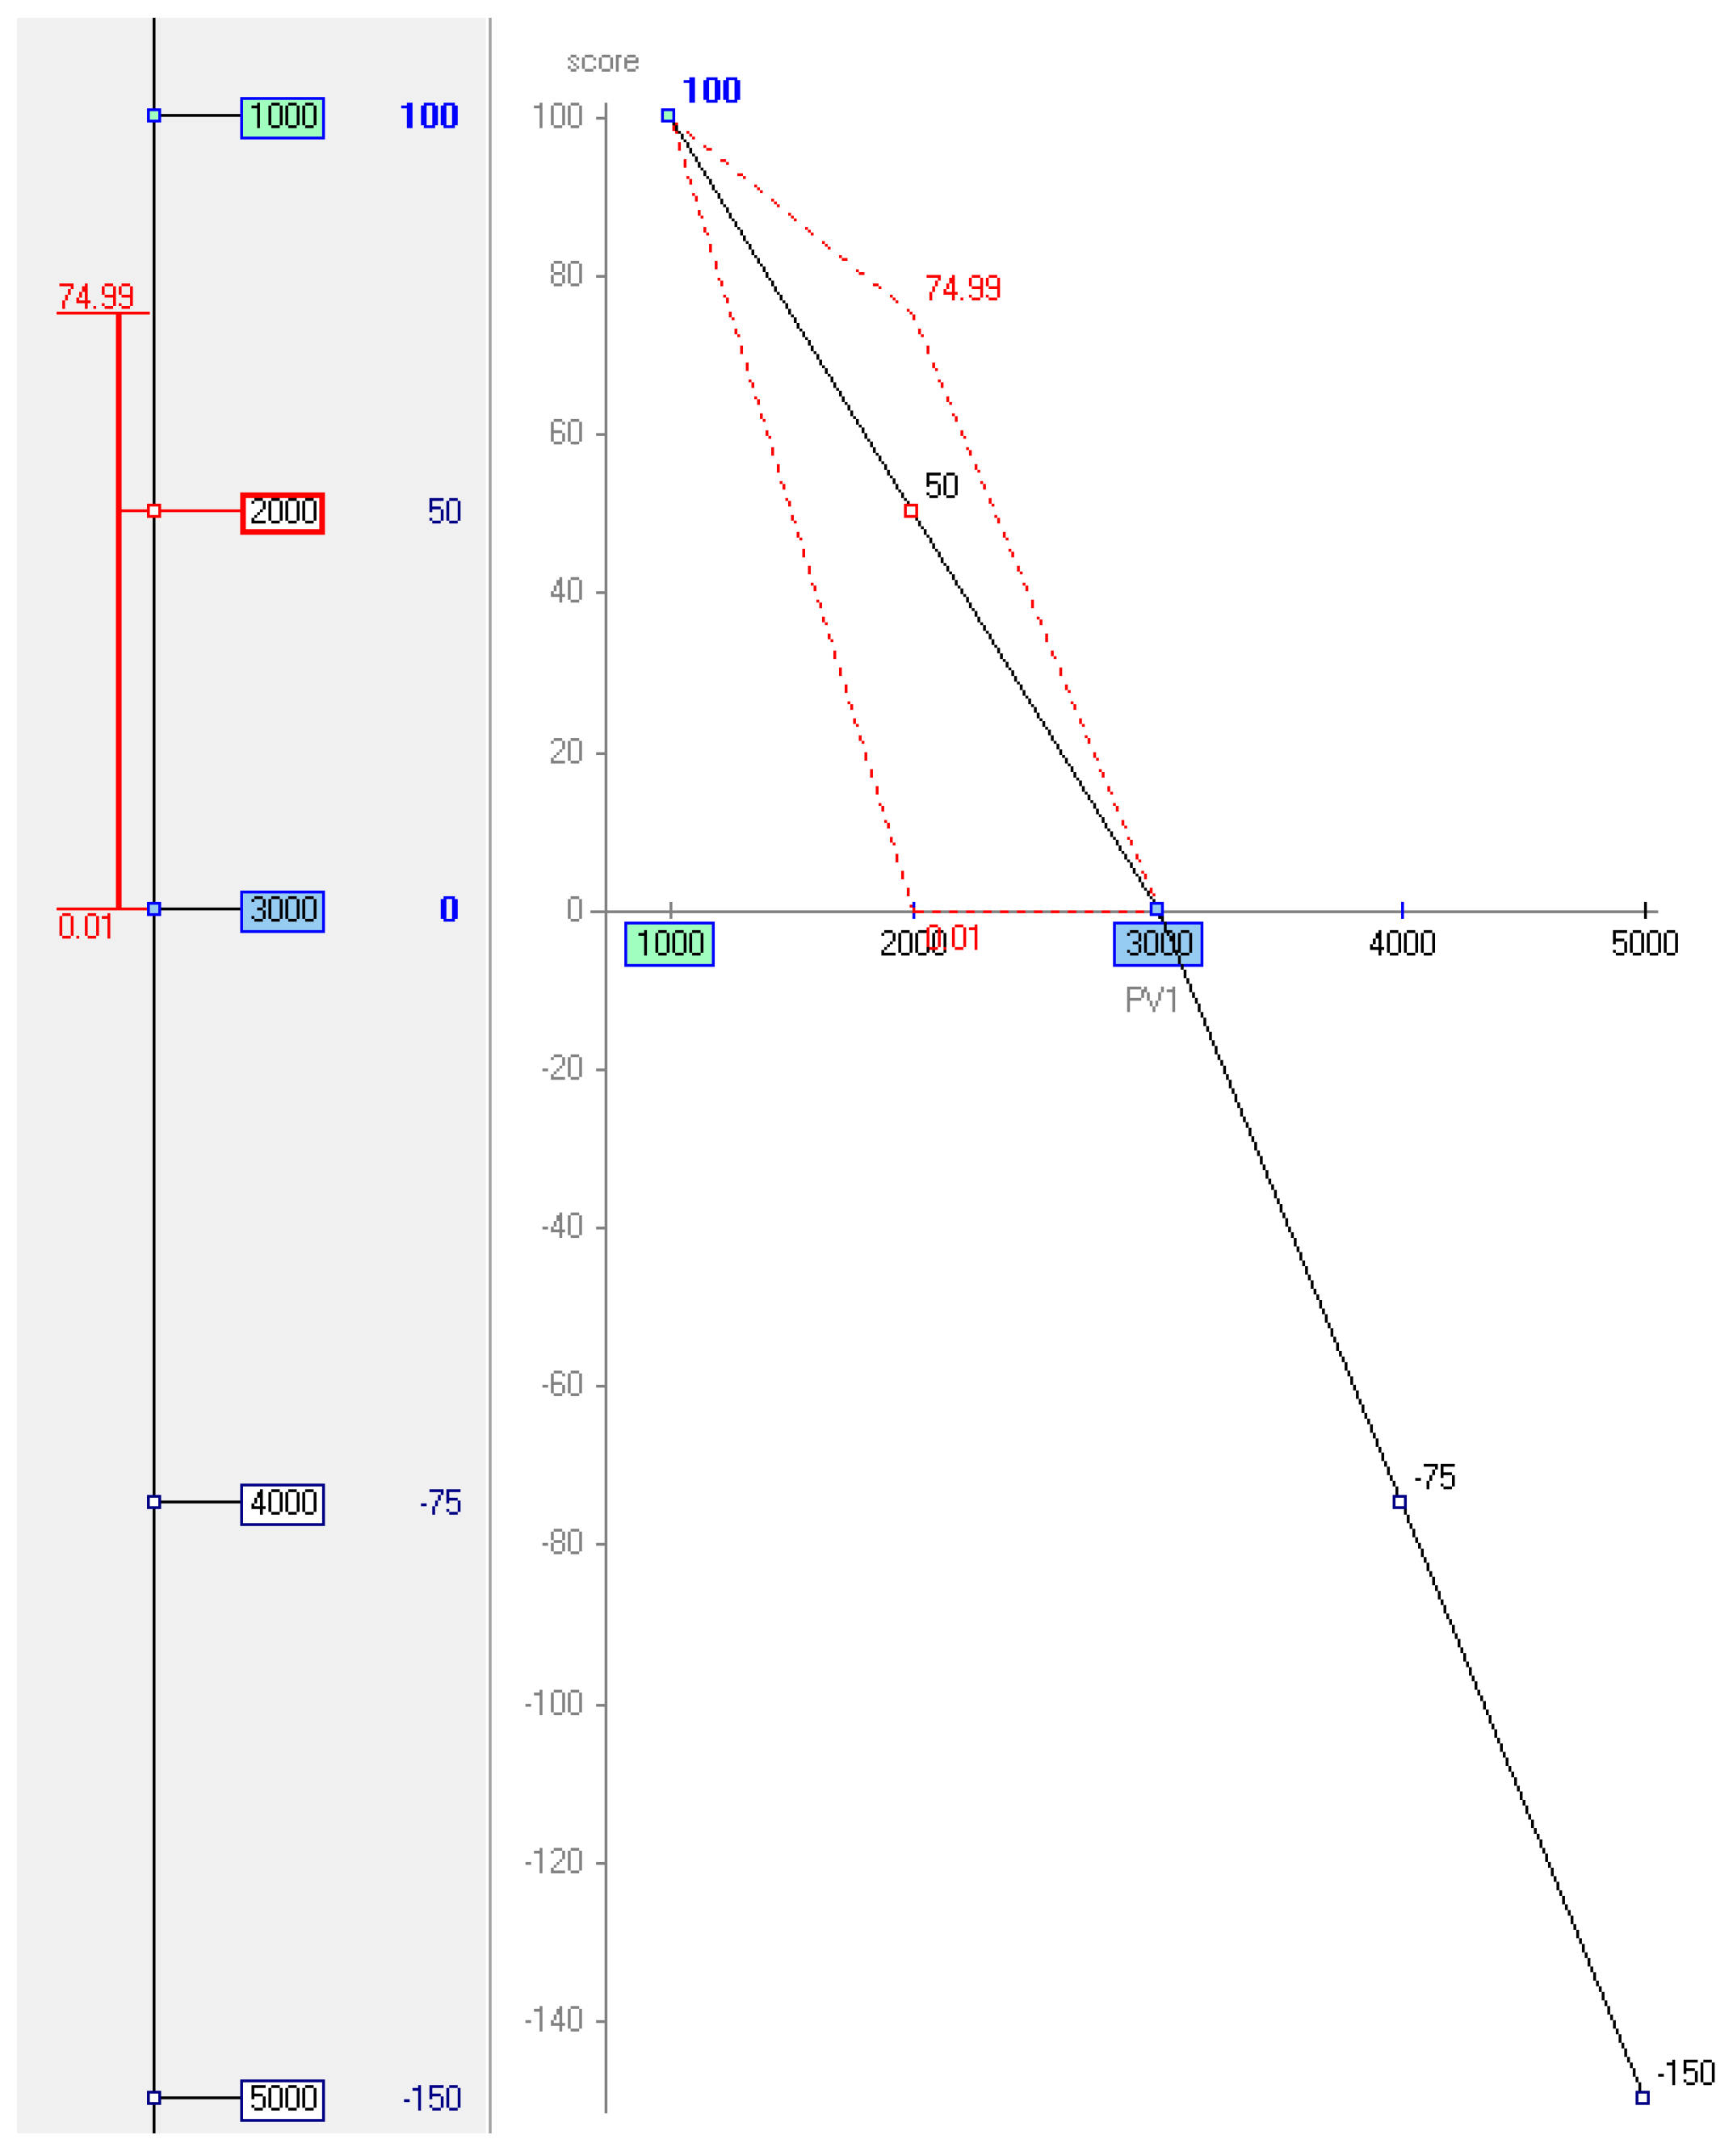
Figure 9.
Qualitative judgements for the swings.

Figure 10.
MACBETH judgement matrix for the criteria.
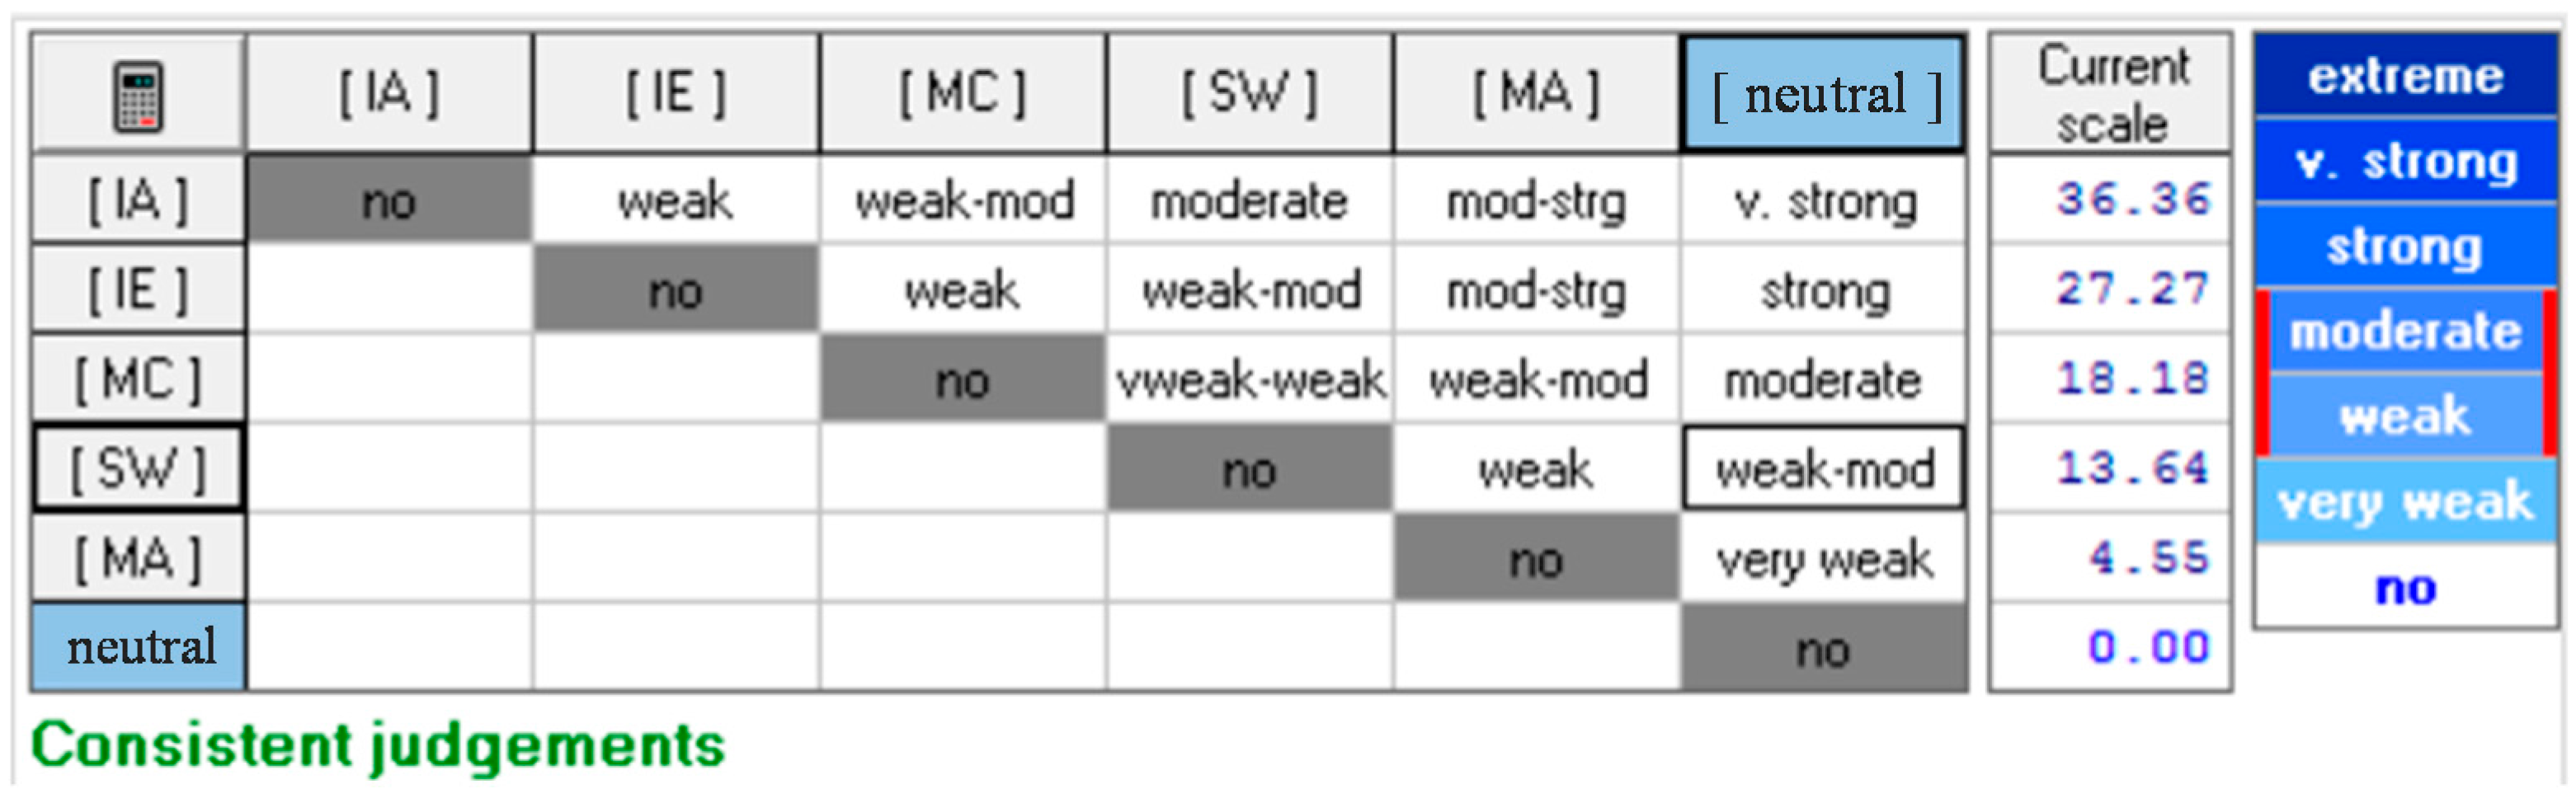
Figure 11.
Ranking of alternatives for the systems: (a) Pracal; (b) Prafcd; (c) Prafri; (d) Pacbom; (e) Pafbom.
Figure 11.
Ranking of alternatives for the systems: (a) Pracal; (b) Prafcd; (c) Prafri; (d) Pacbom; (e) Pafbom.
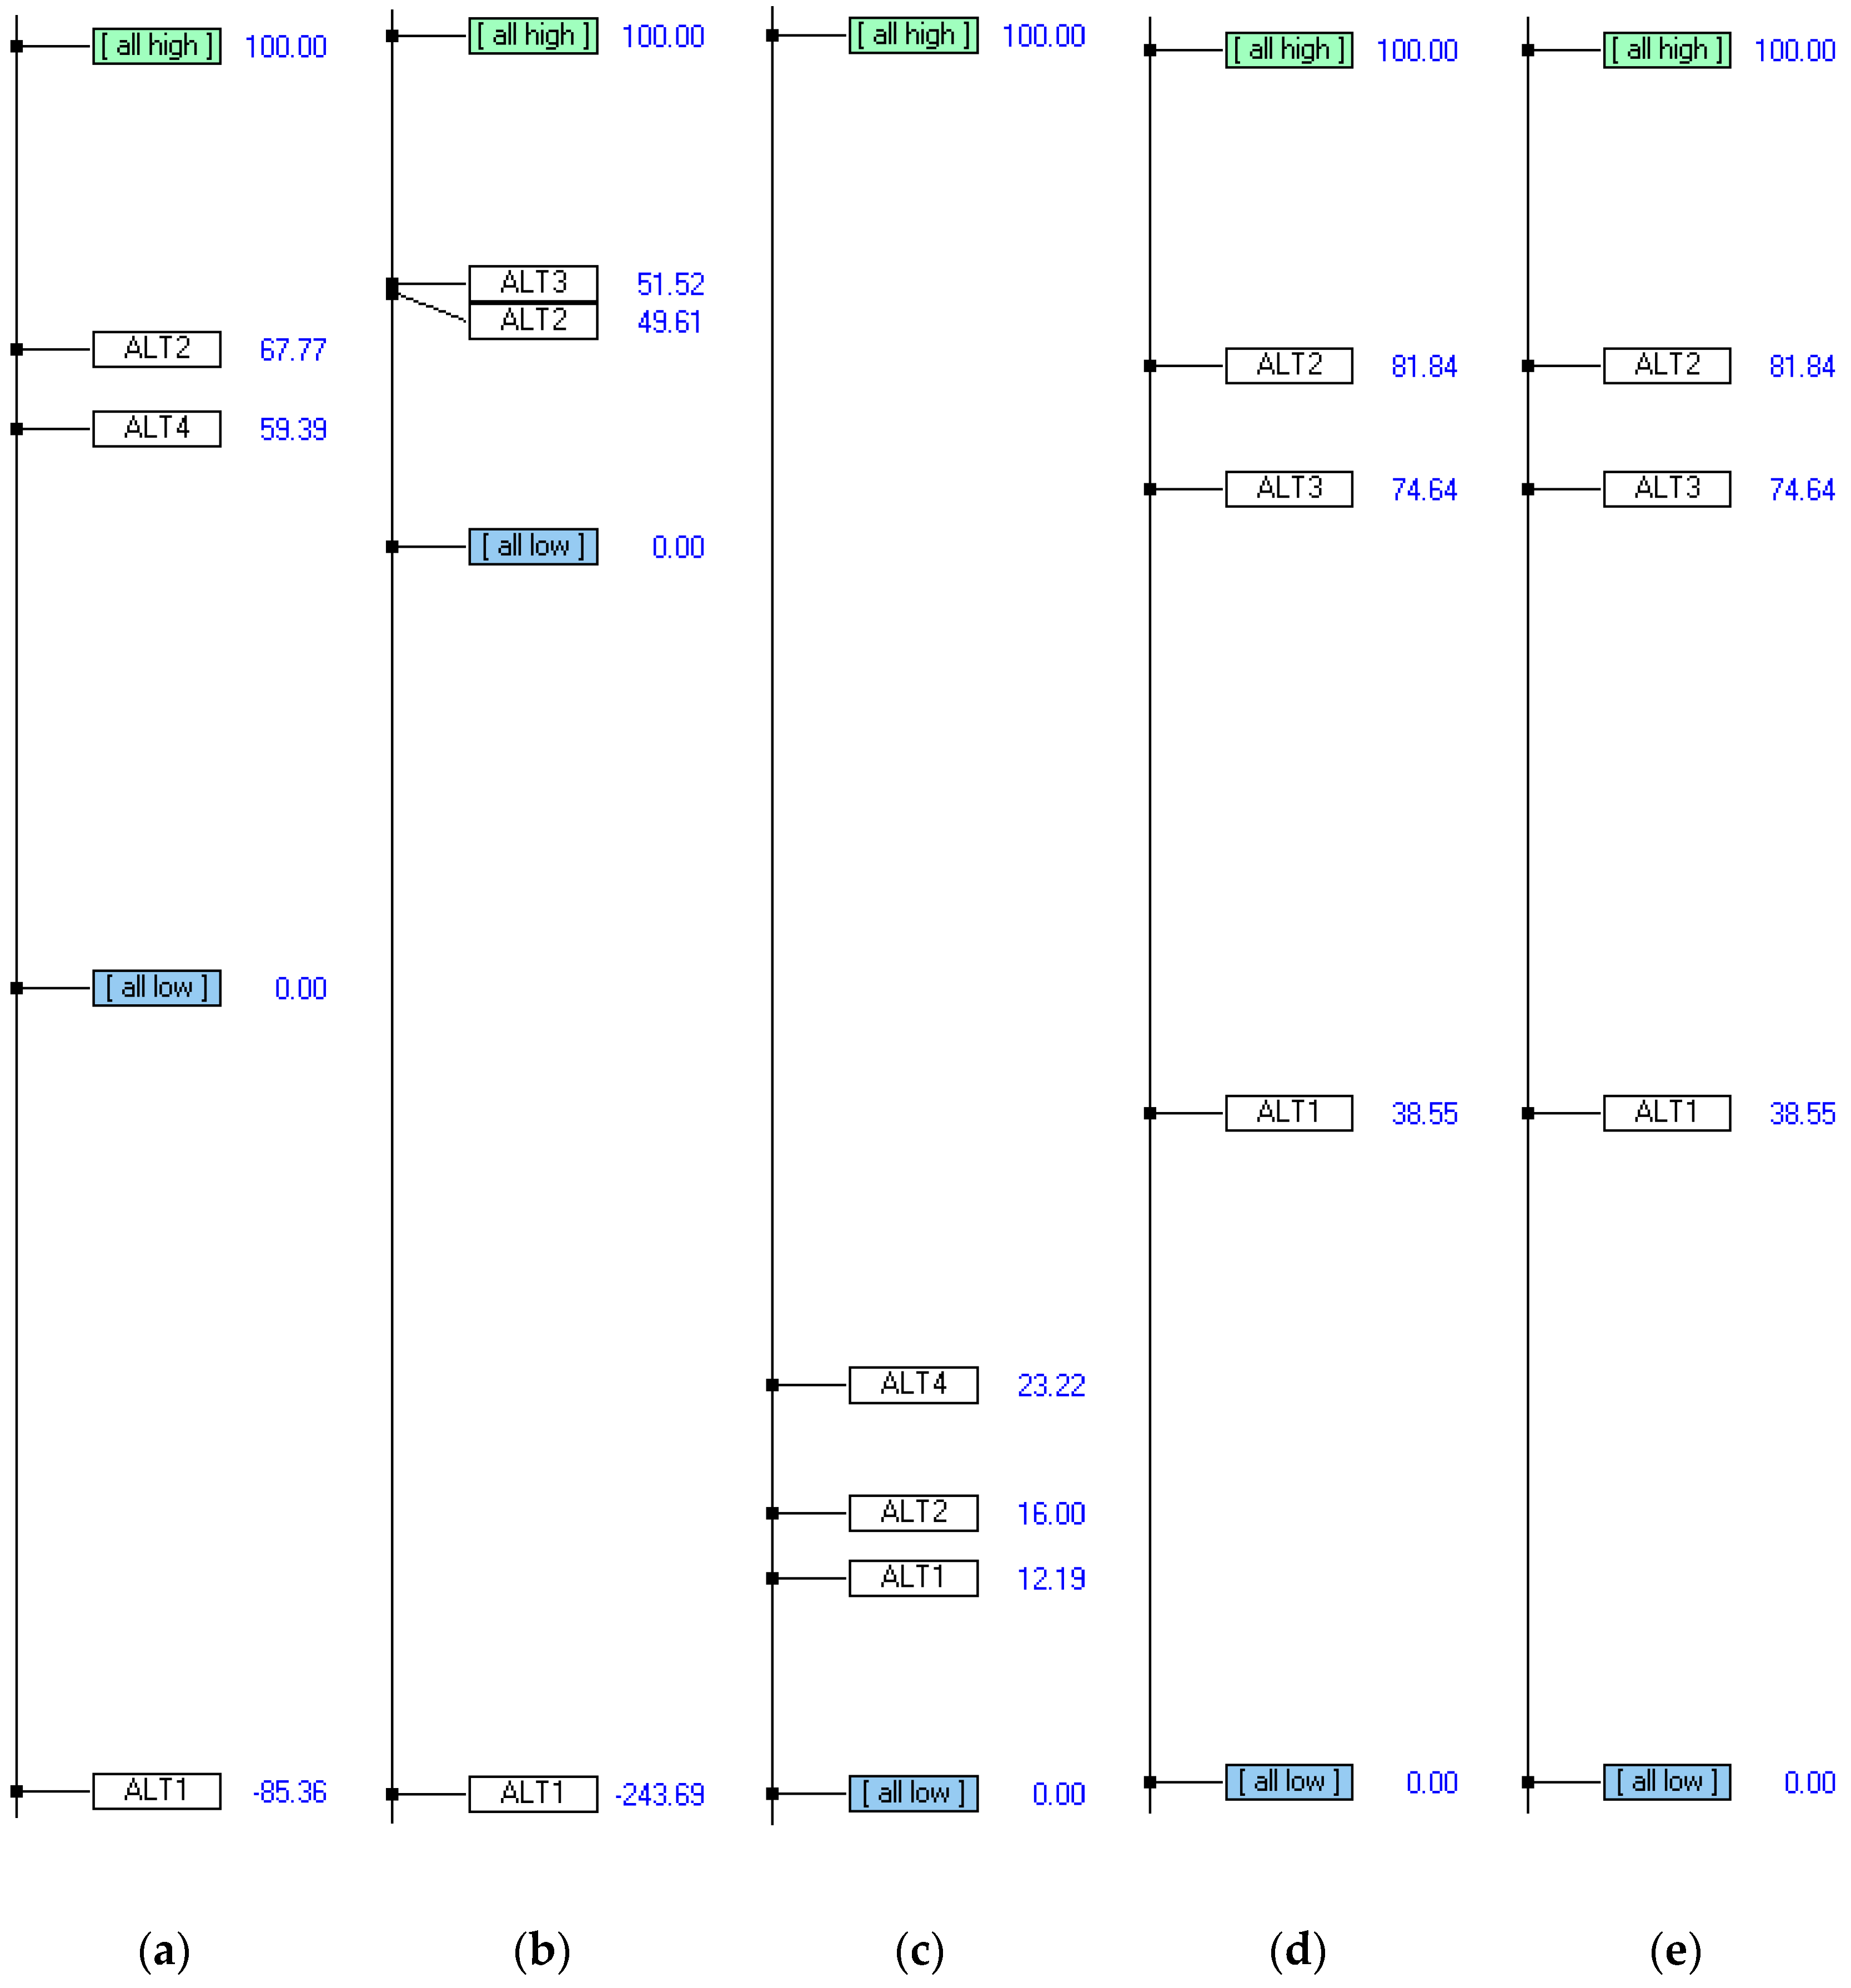
Figure 12.
Sensitivity analysis: (a) Maintenance cost; (b) Safety of maintenance workers; (c) Suitability of maintenance actions; (d) Impact on the environment; (e) Impact on health care organization activity.
Figure 12.
Sensitivity analysis: (a) Maintenance cost; (b) Safety of maintenance workers; (c) Suitability of maintenance actions; (d) Impact on the environment; (e) Impact on health care organization activity.

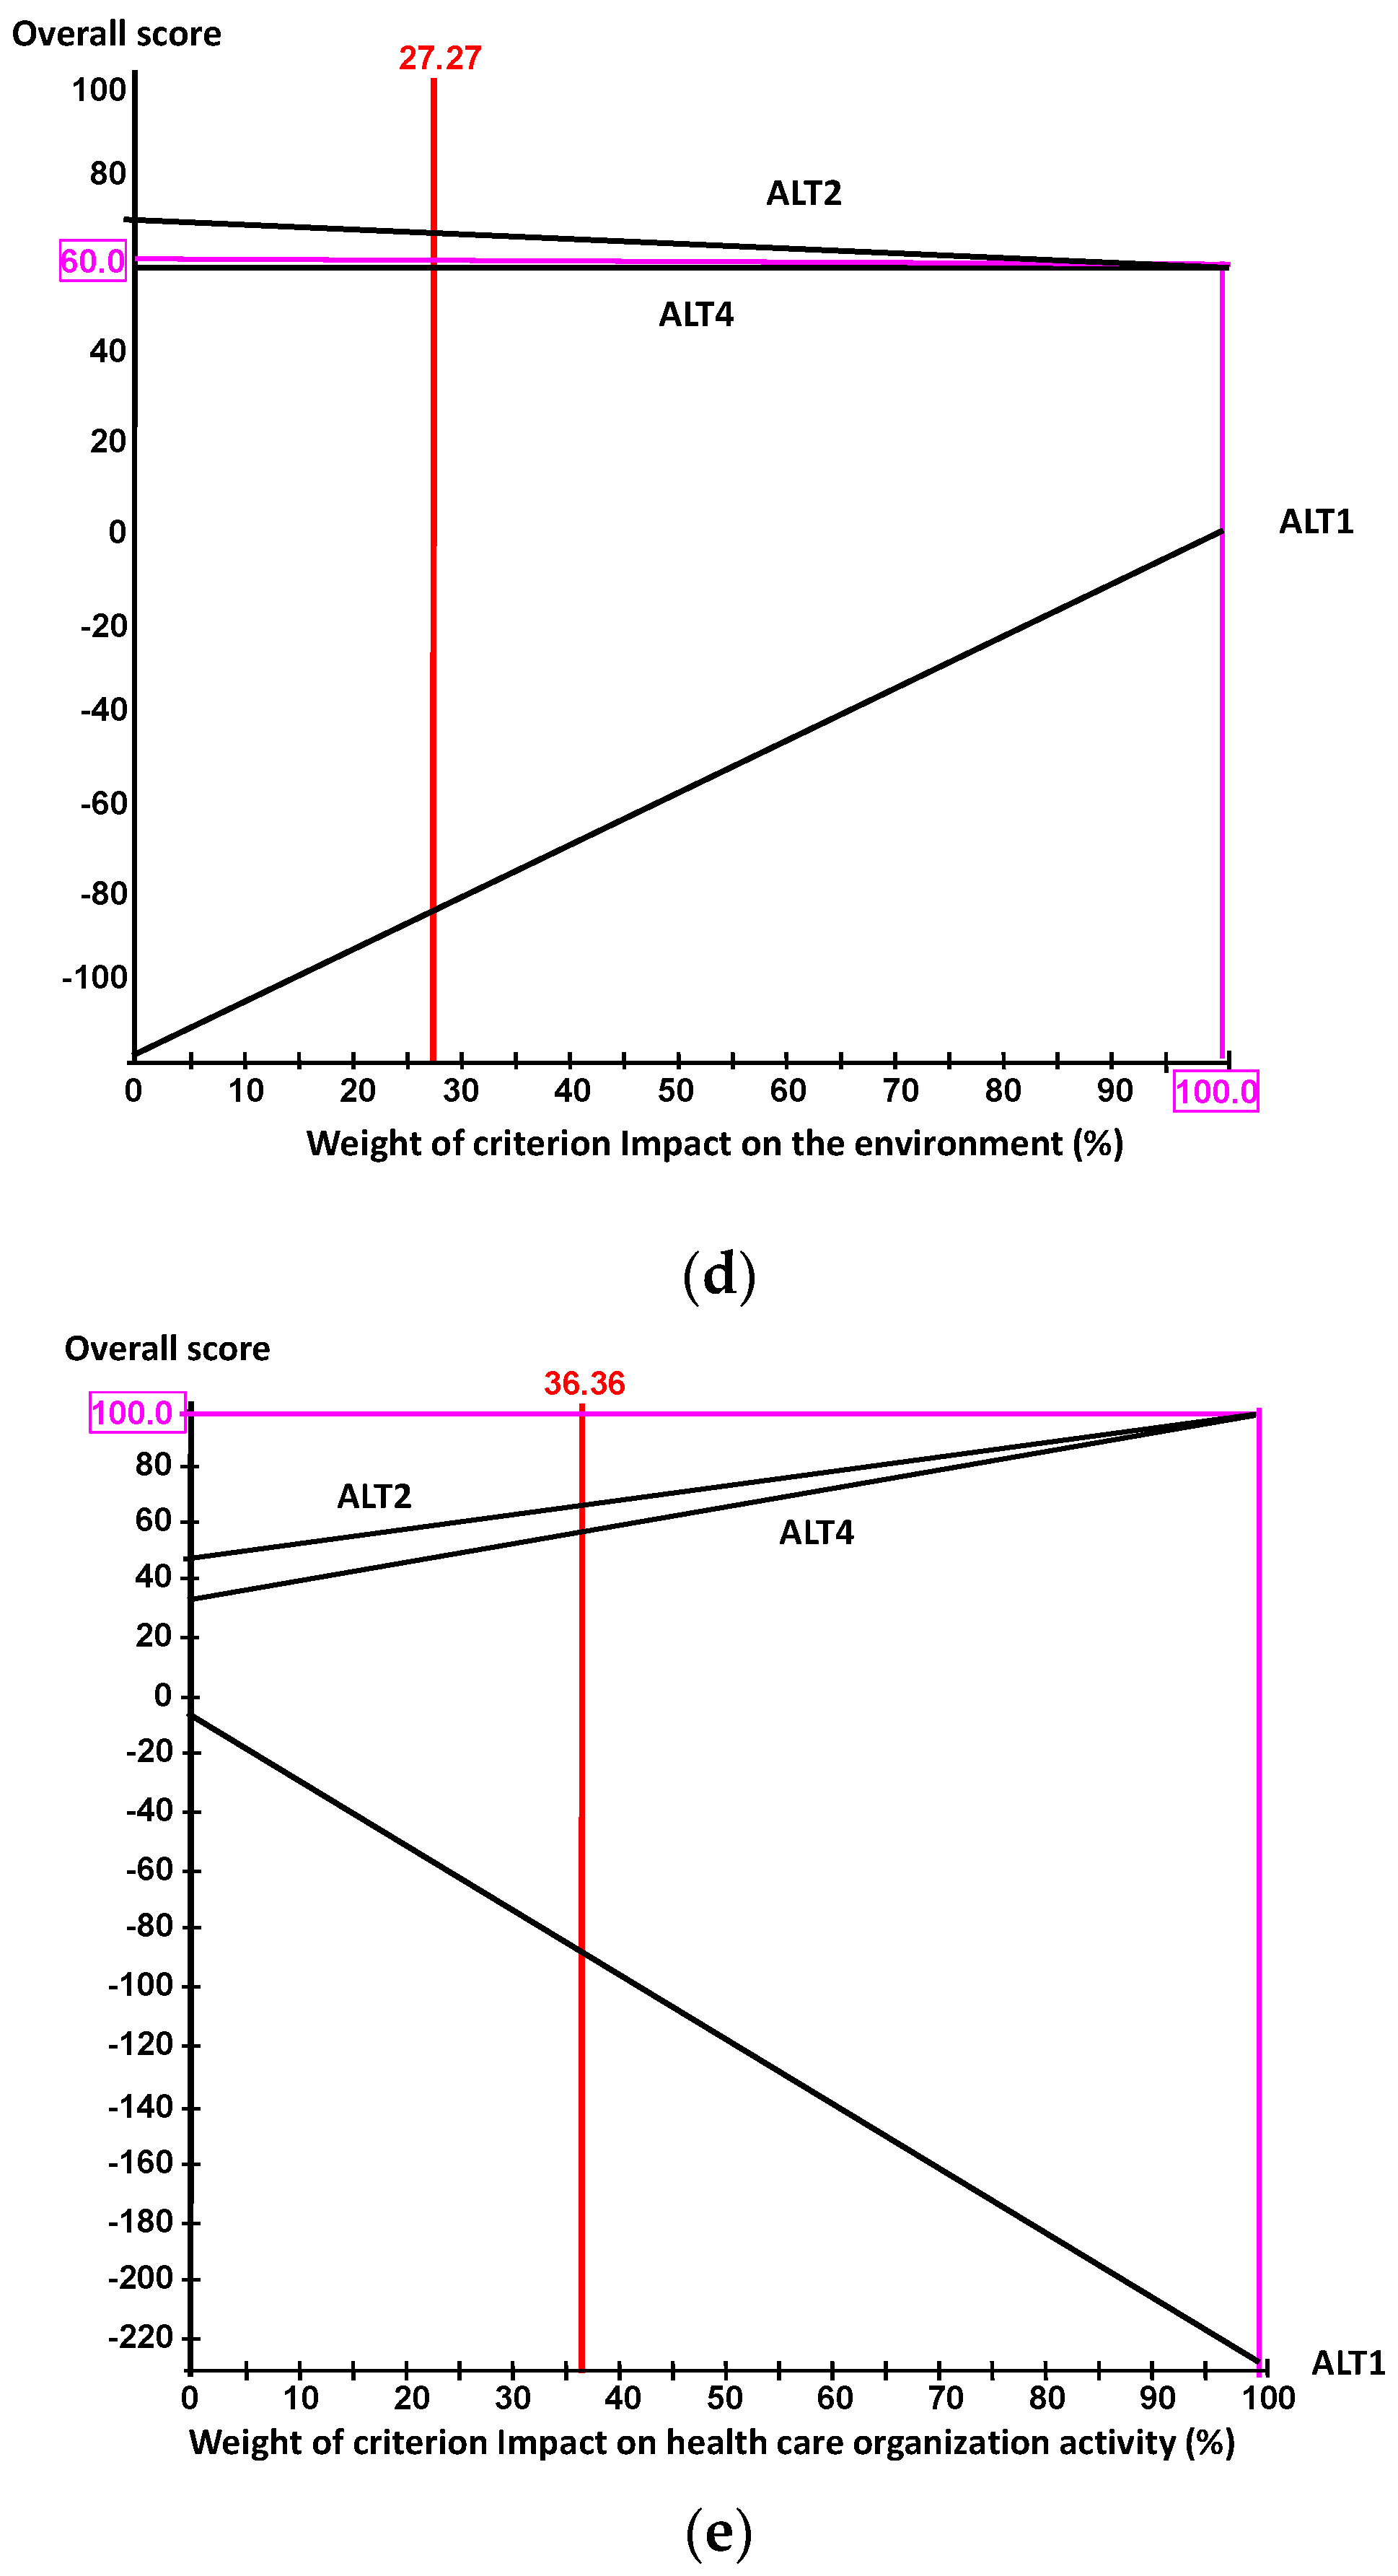

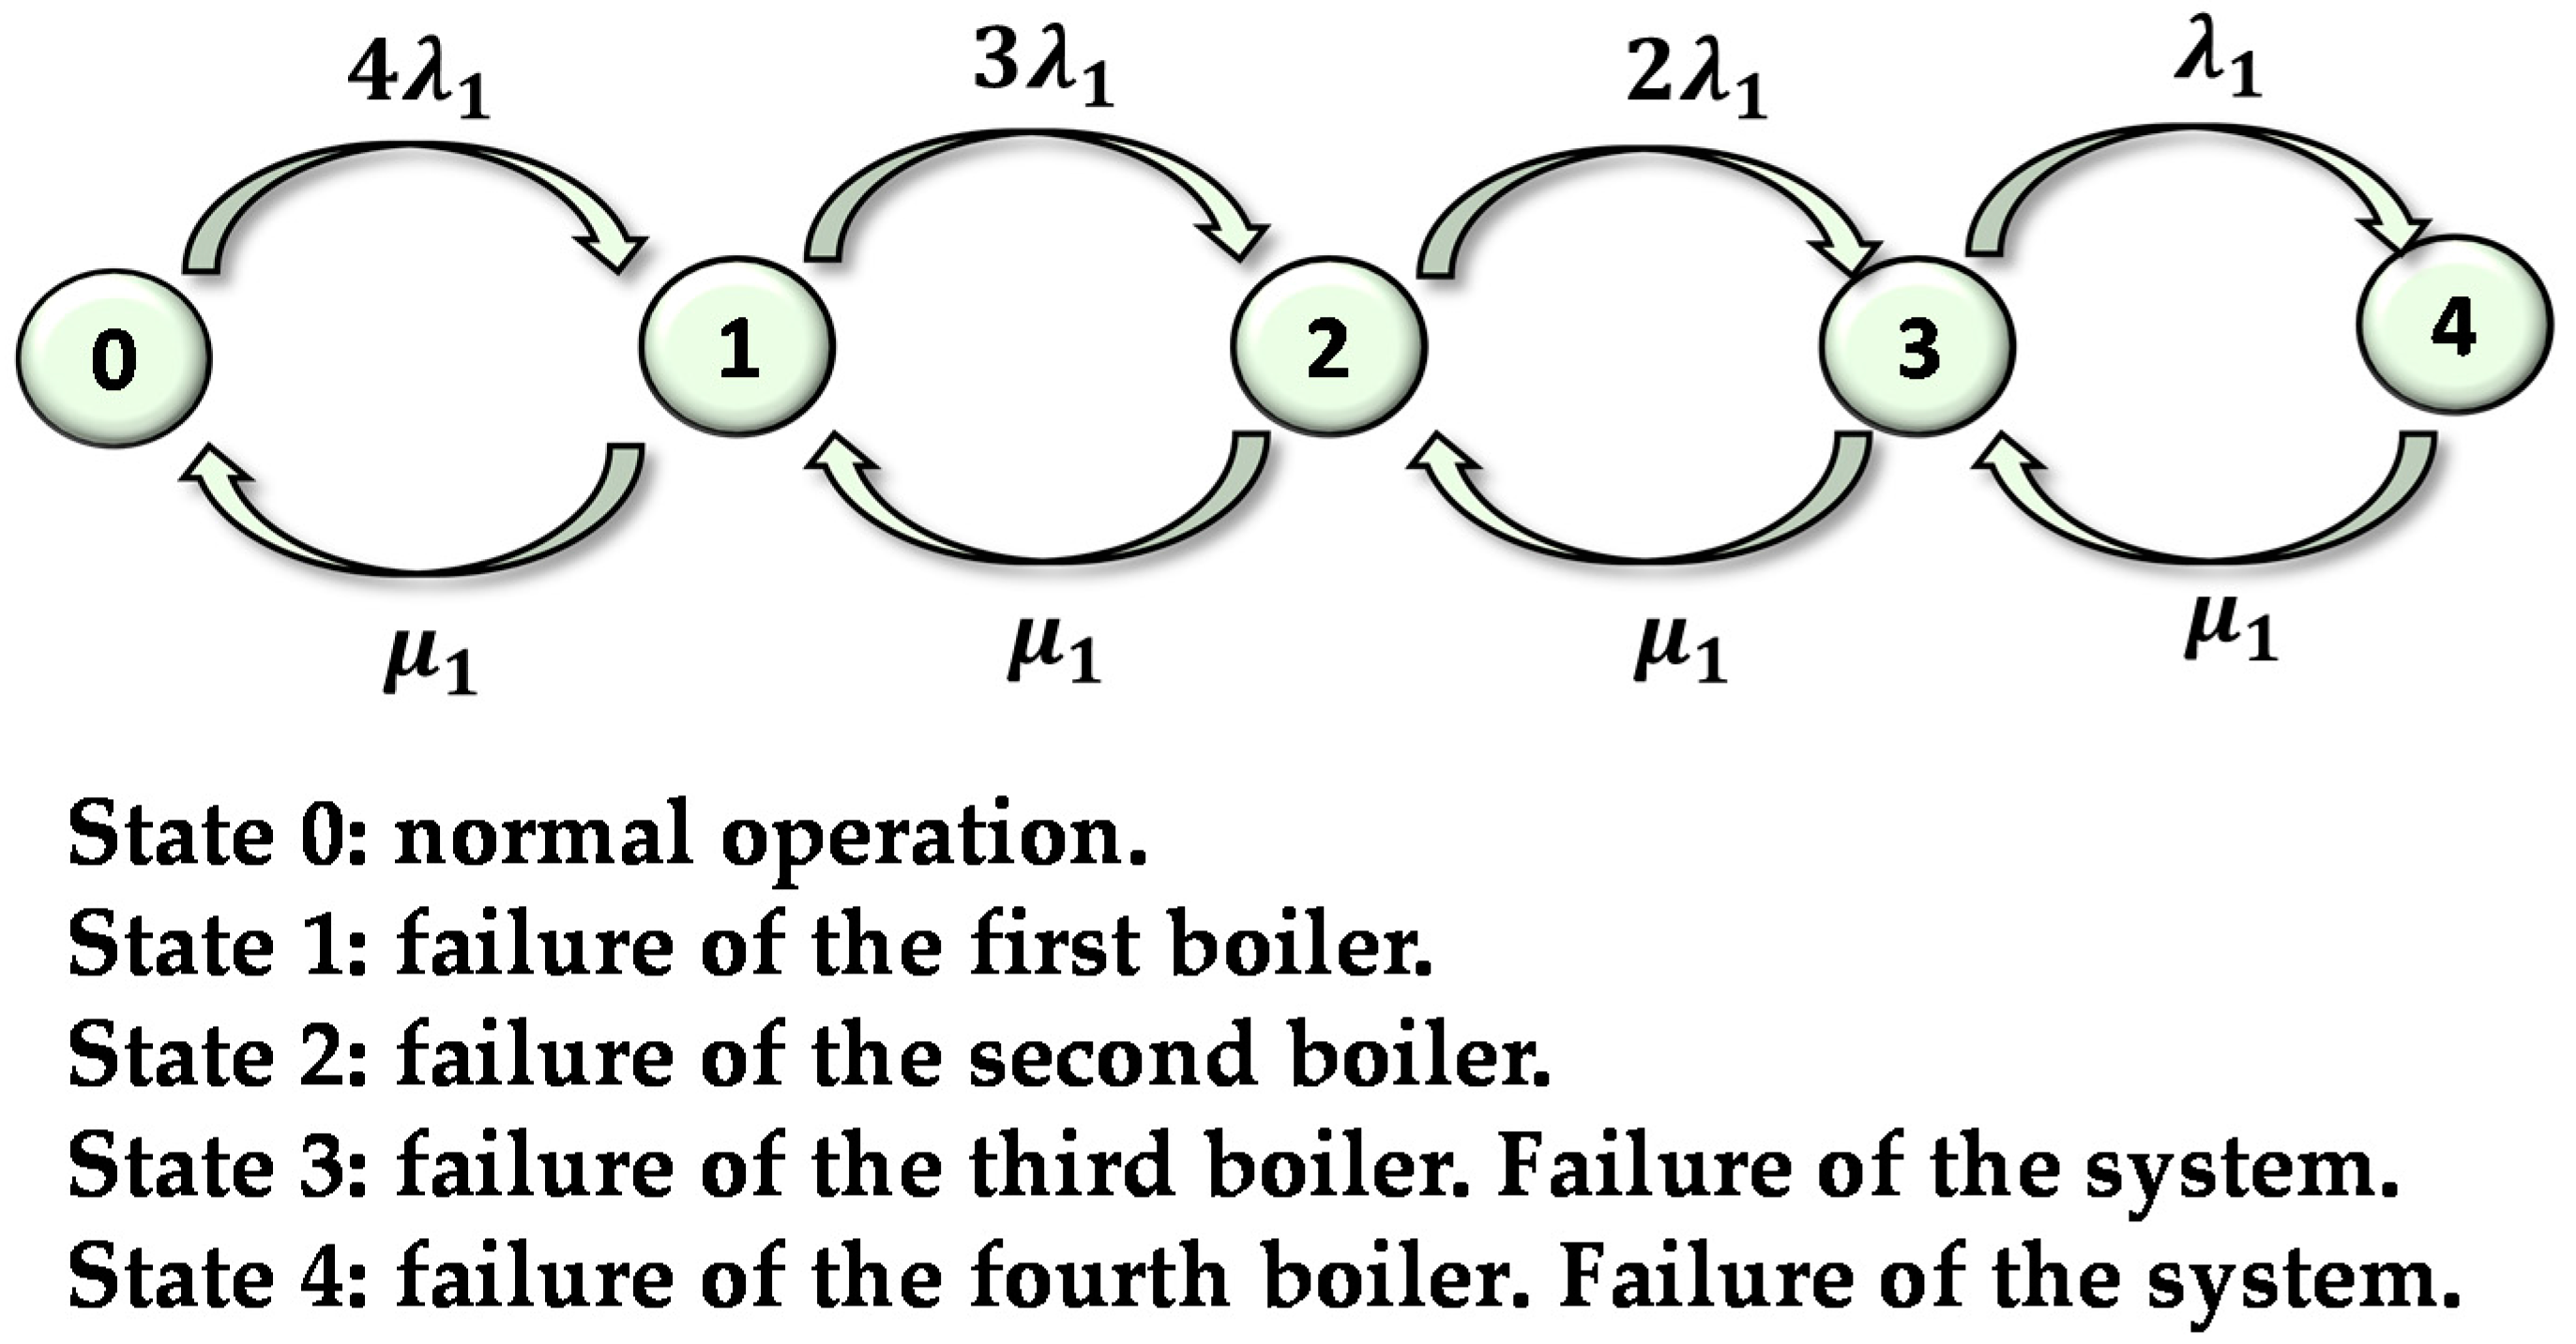
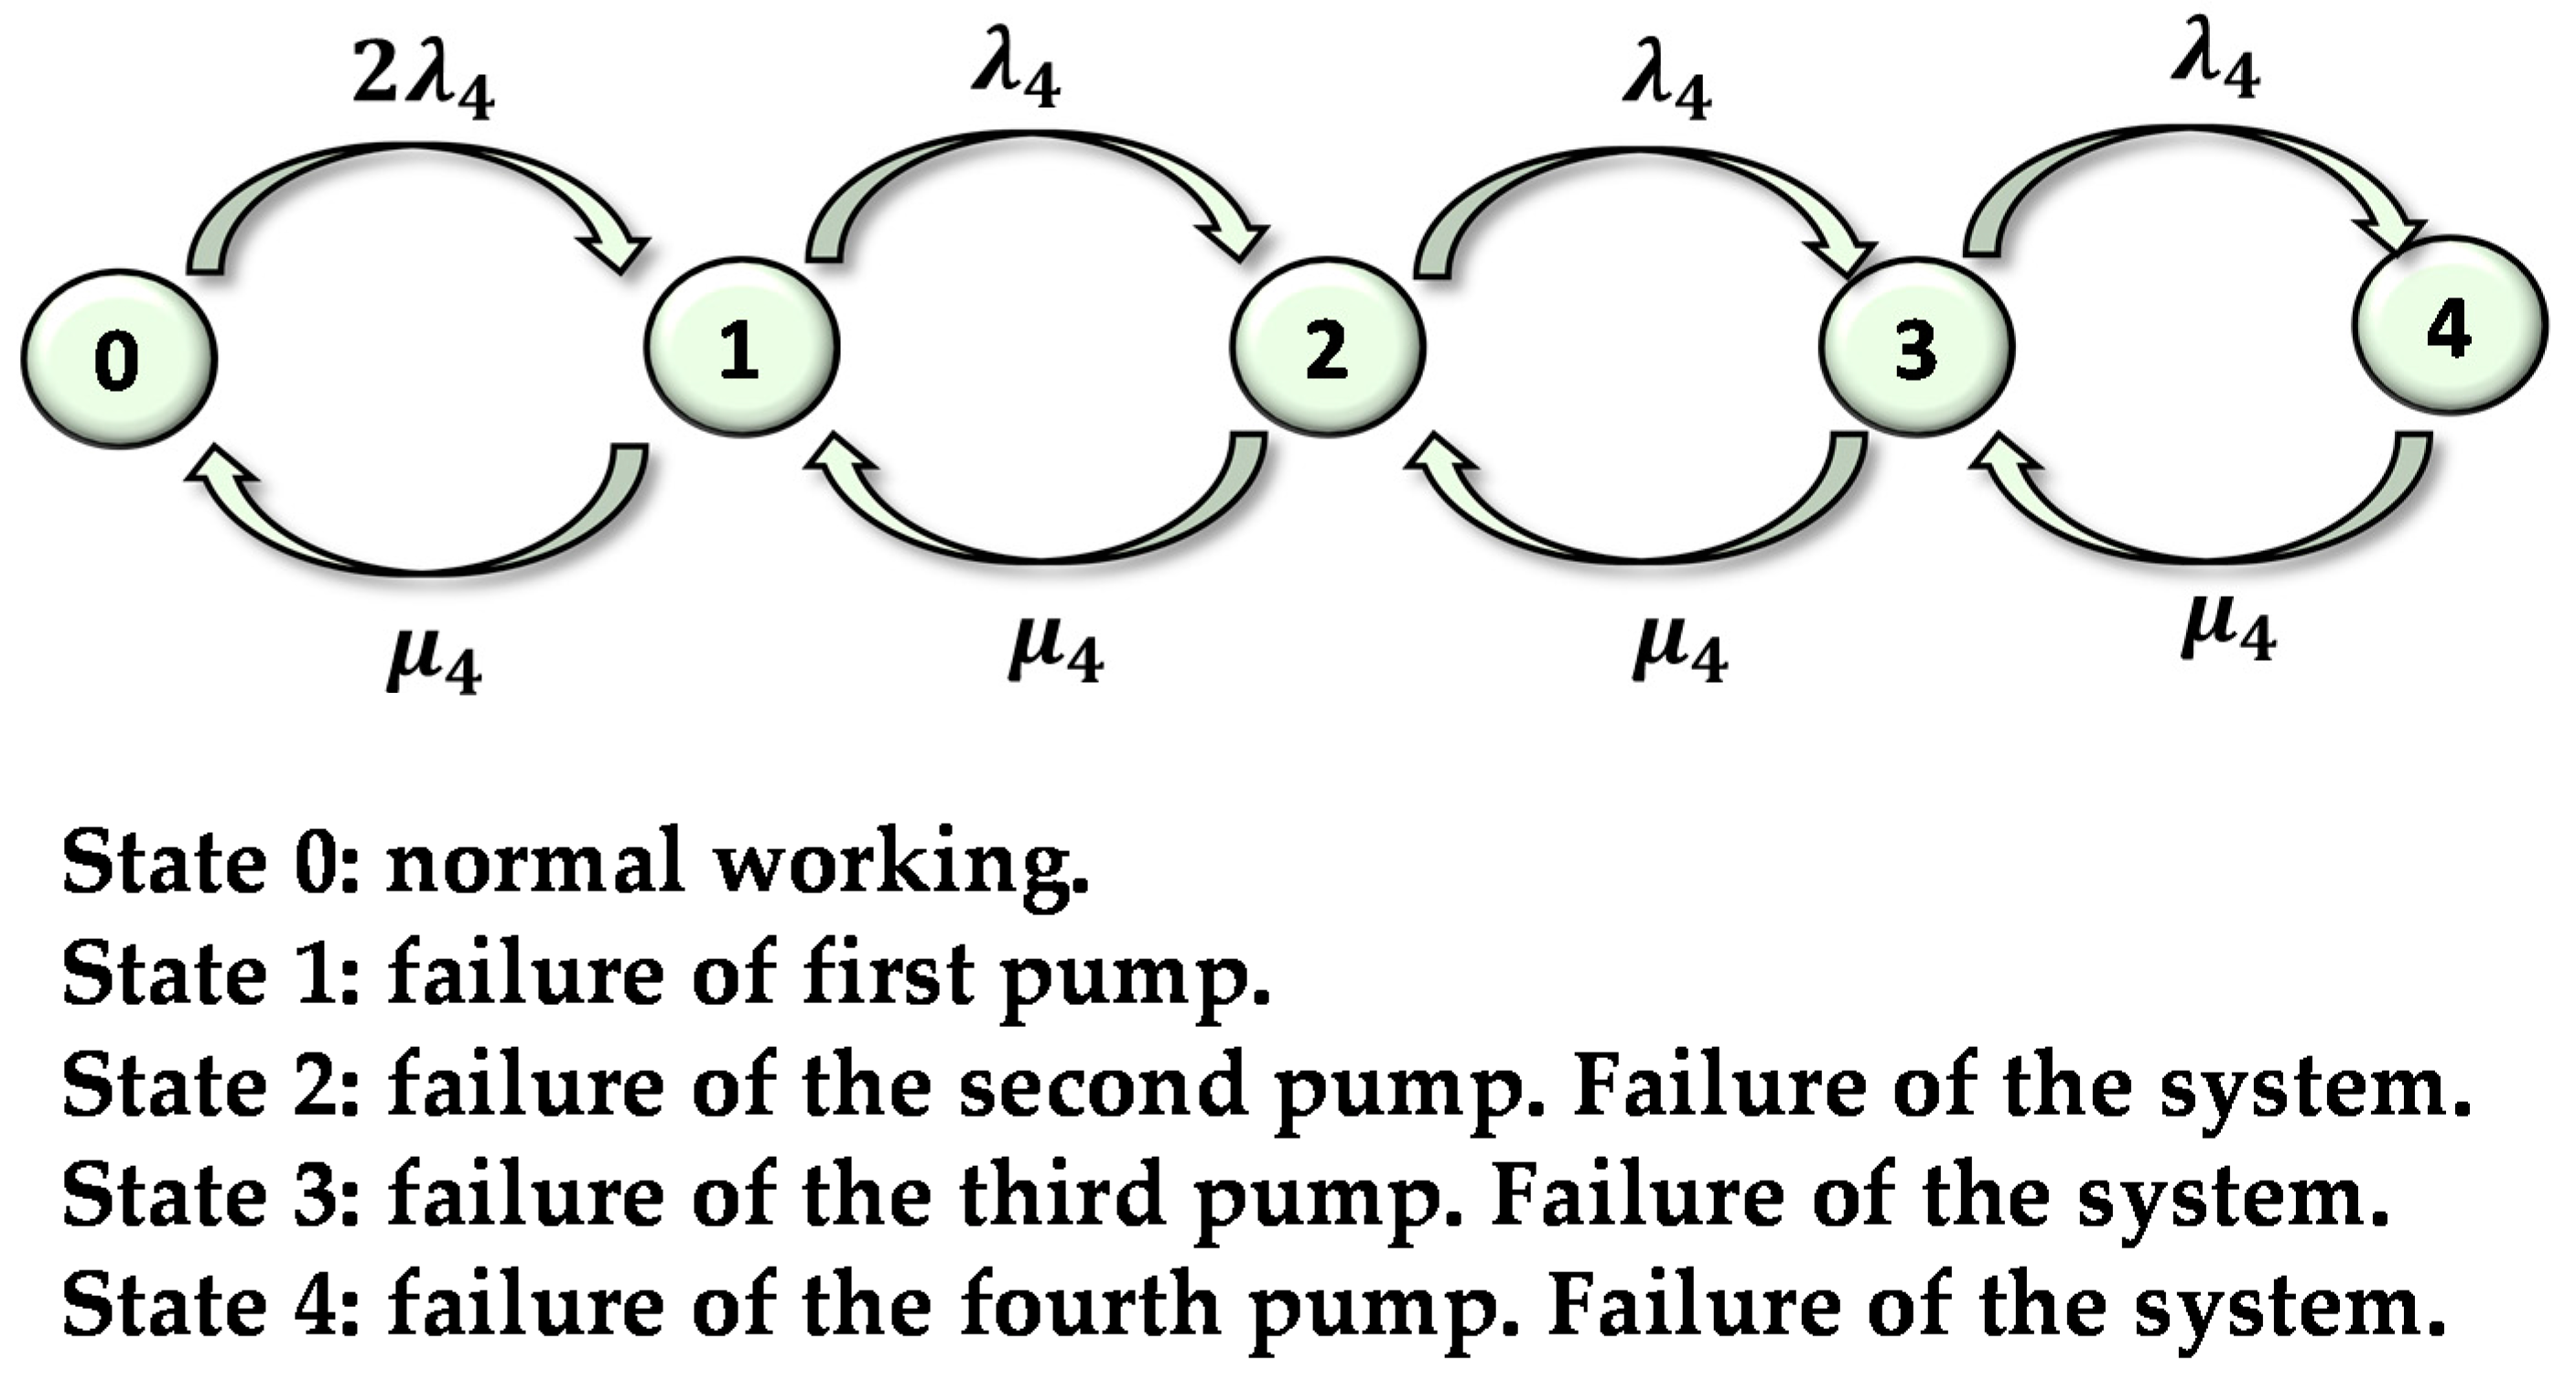
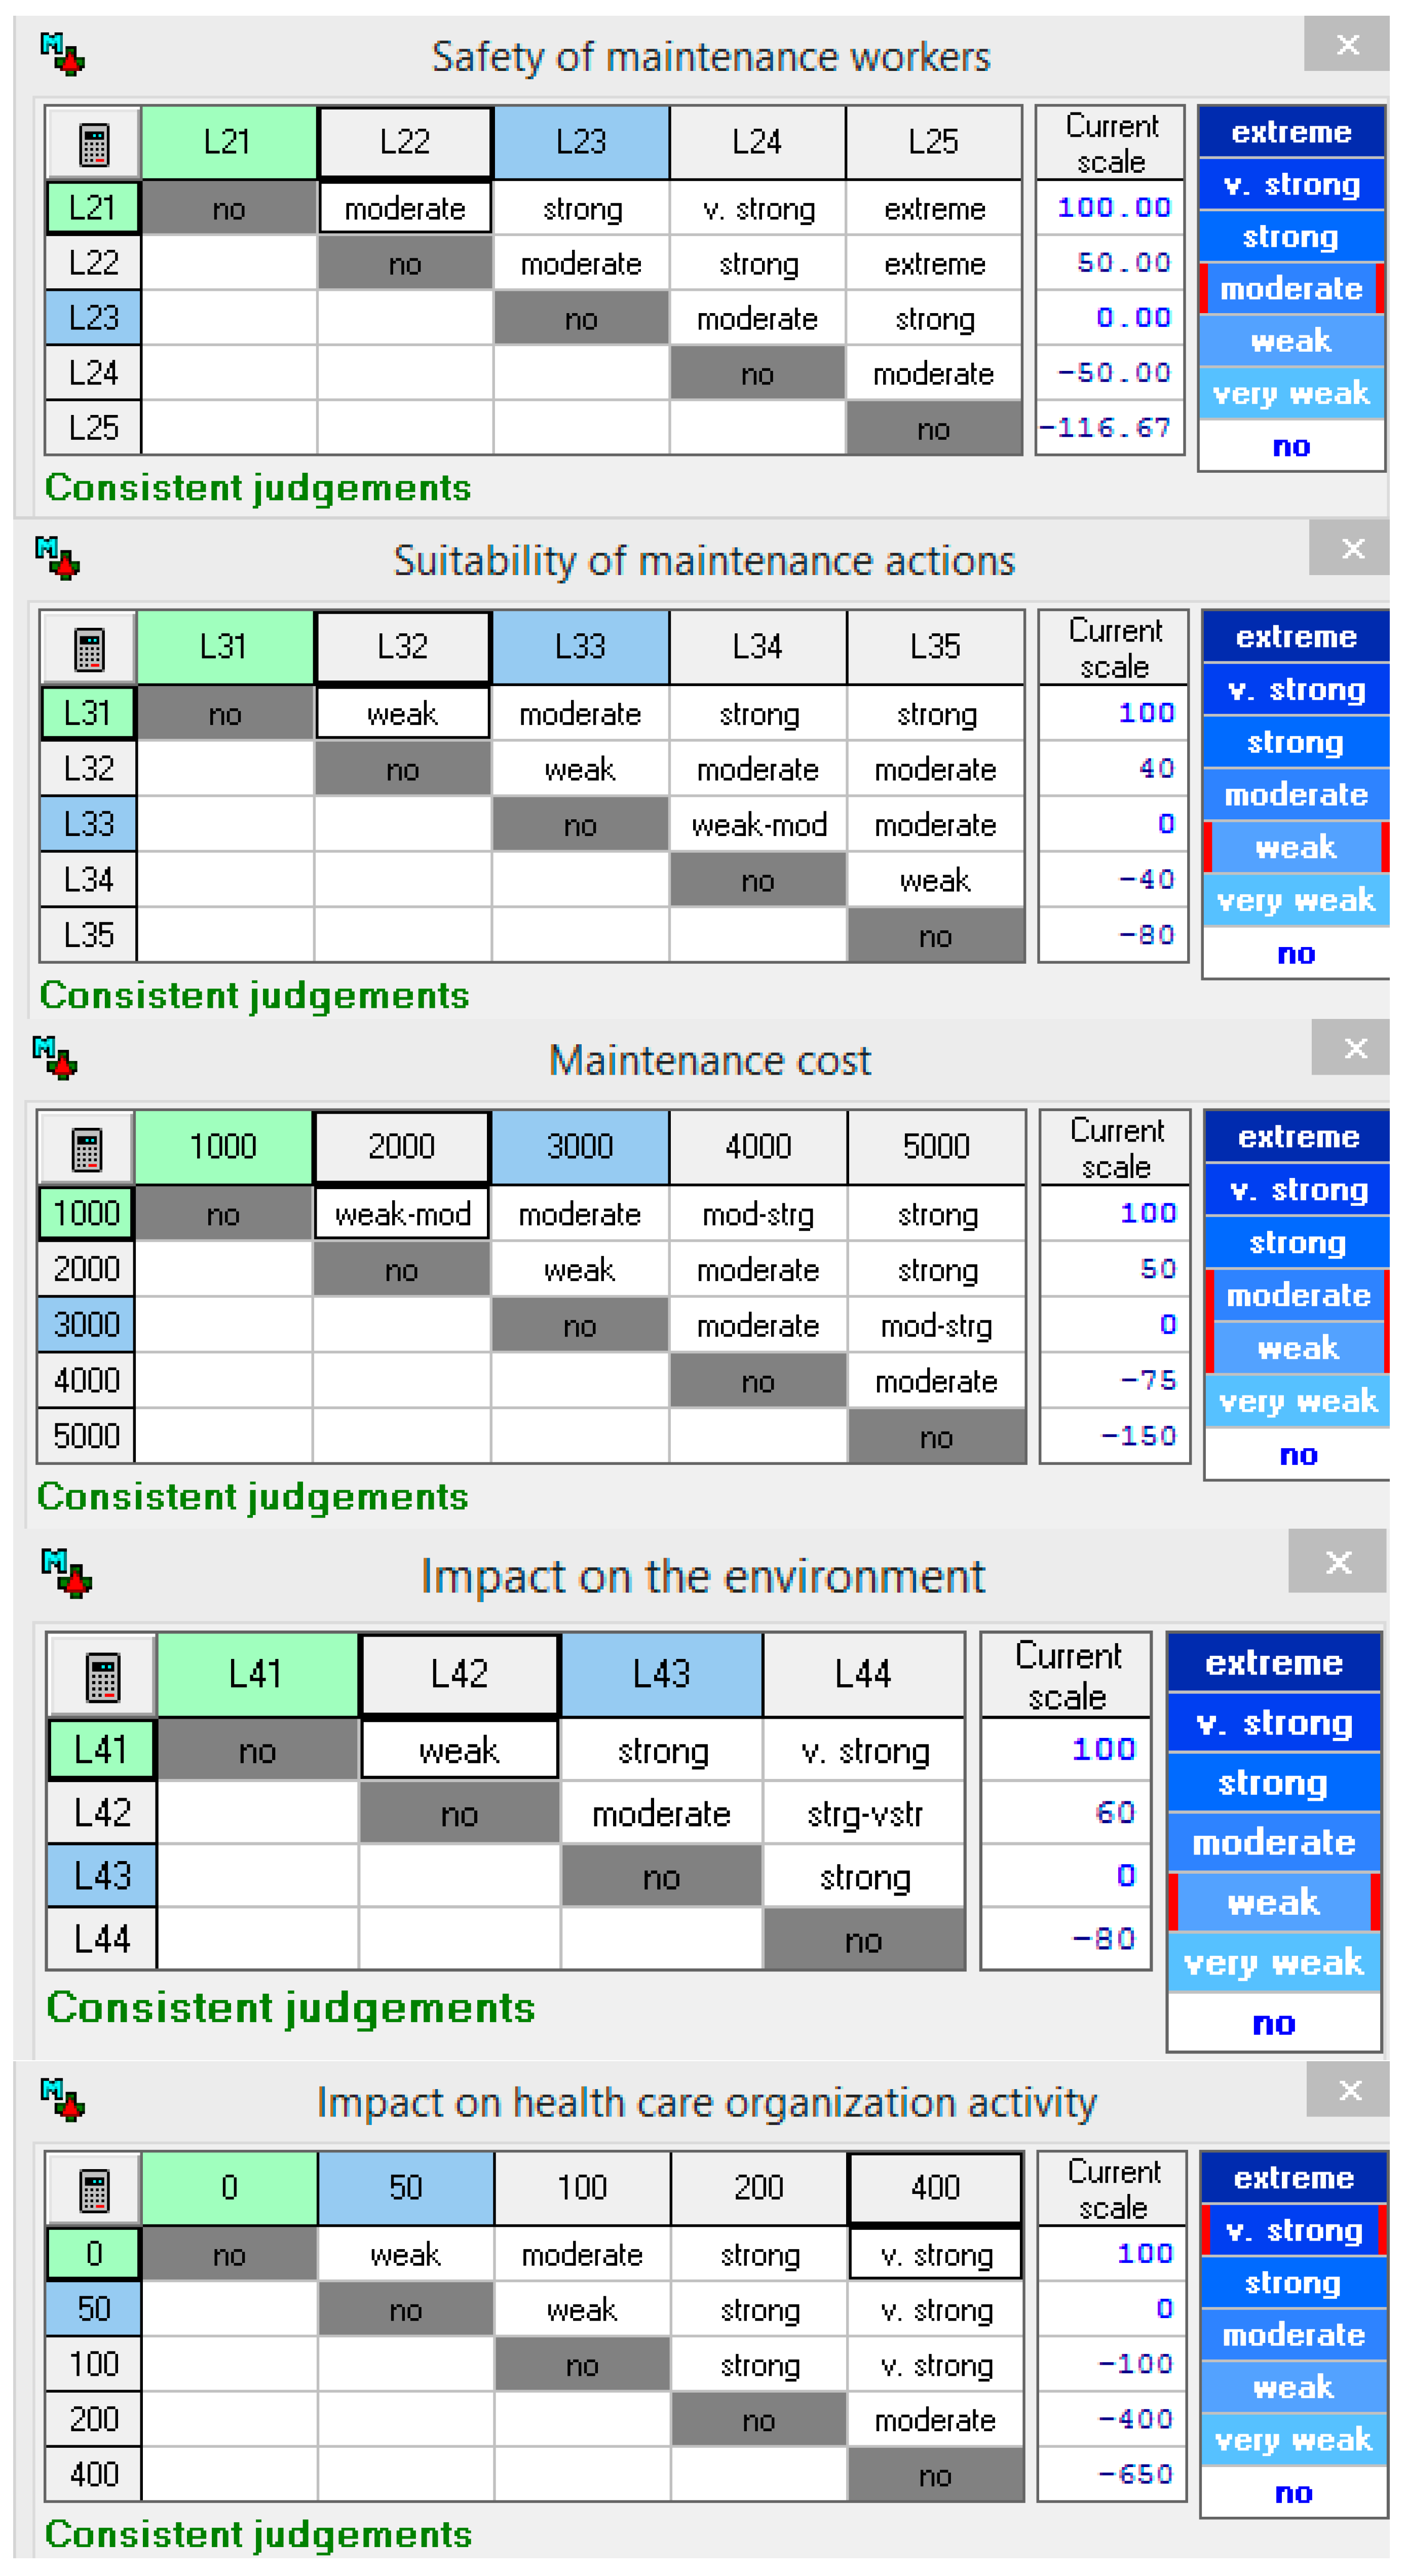
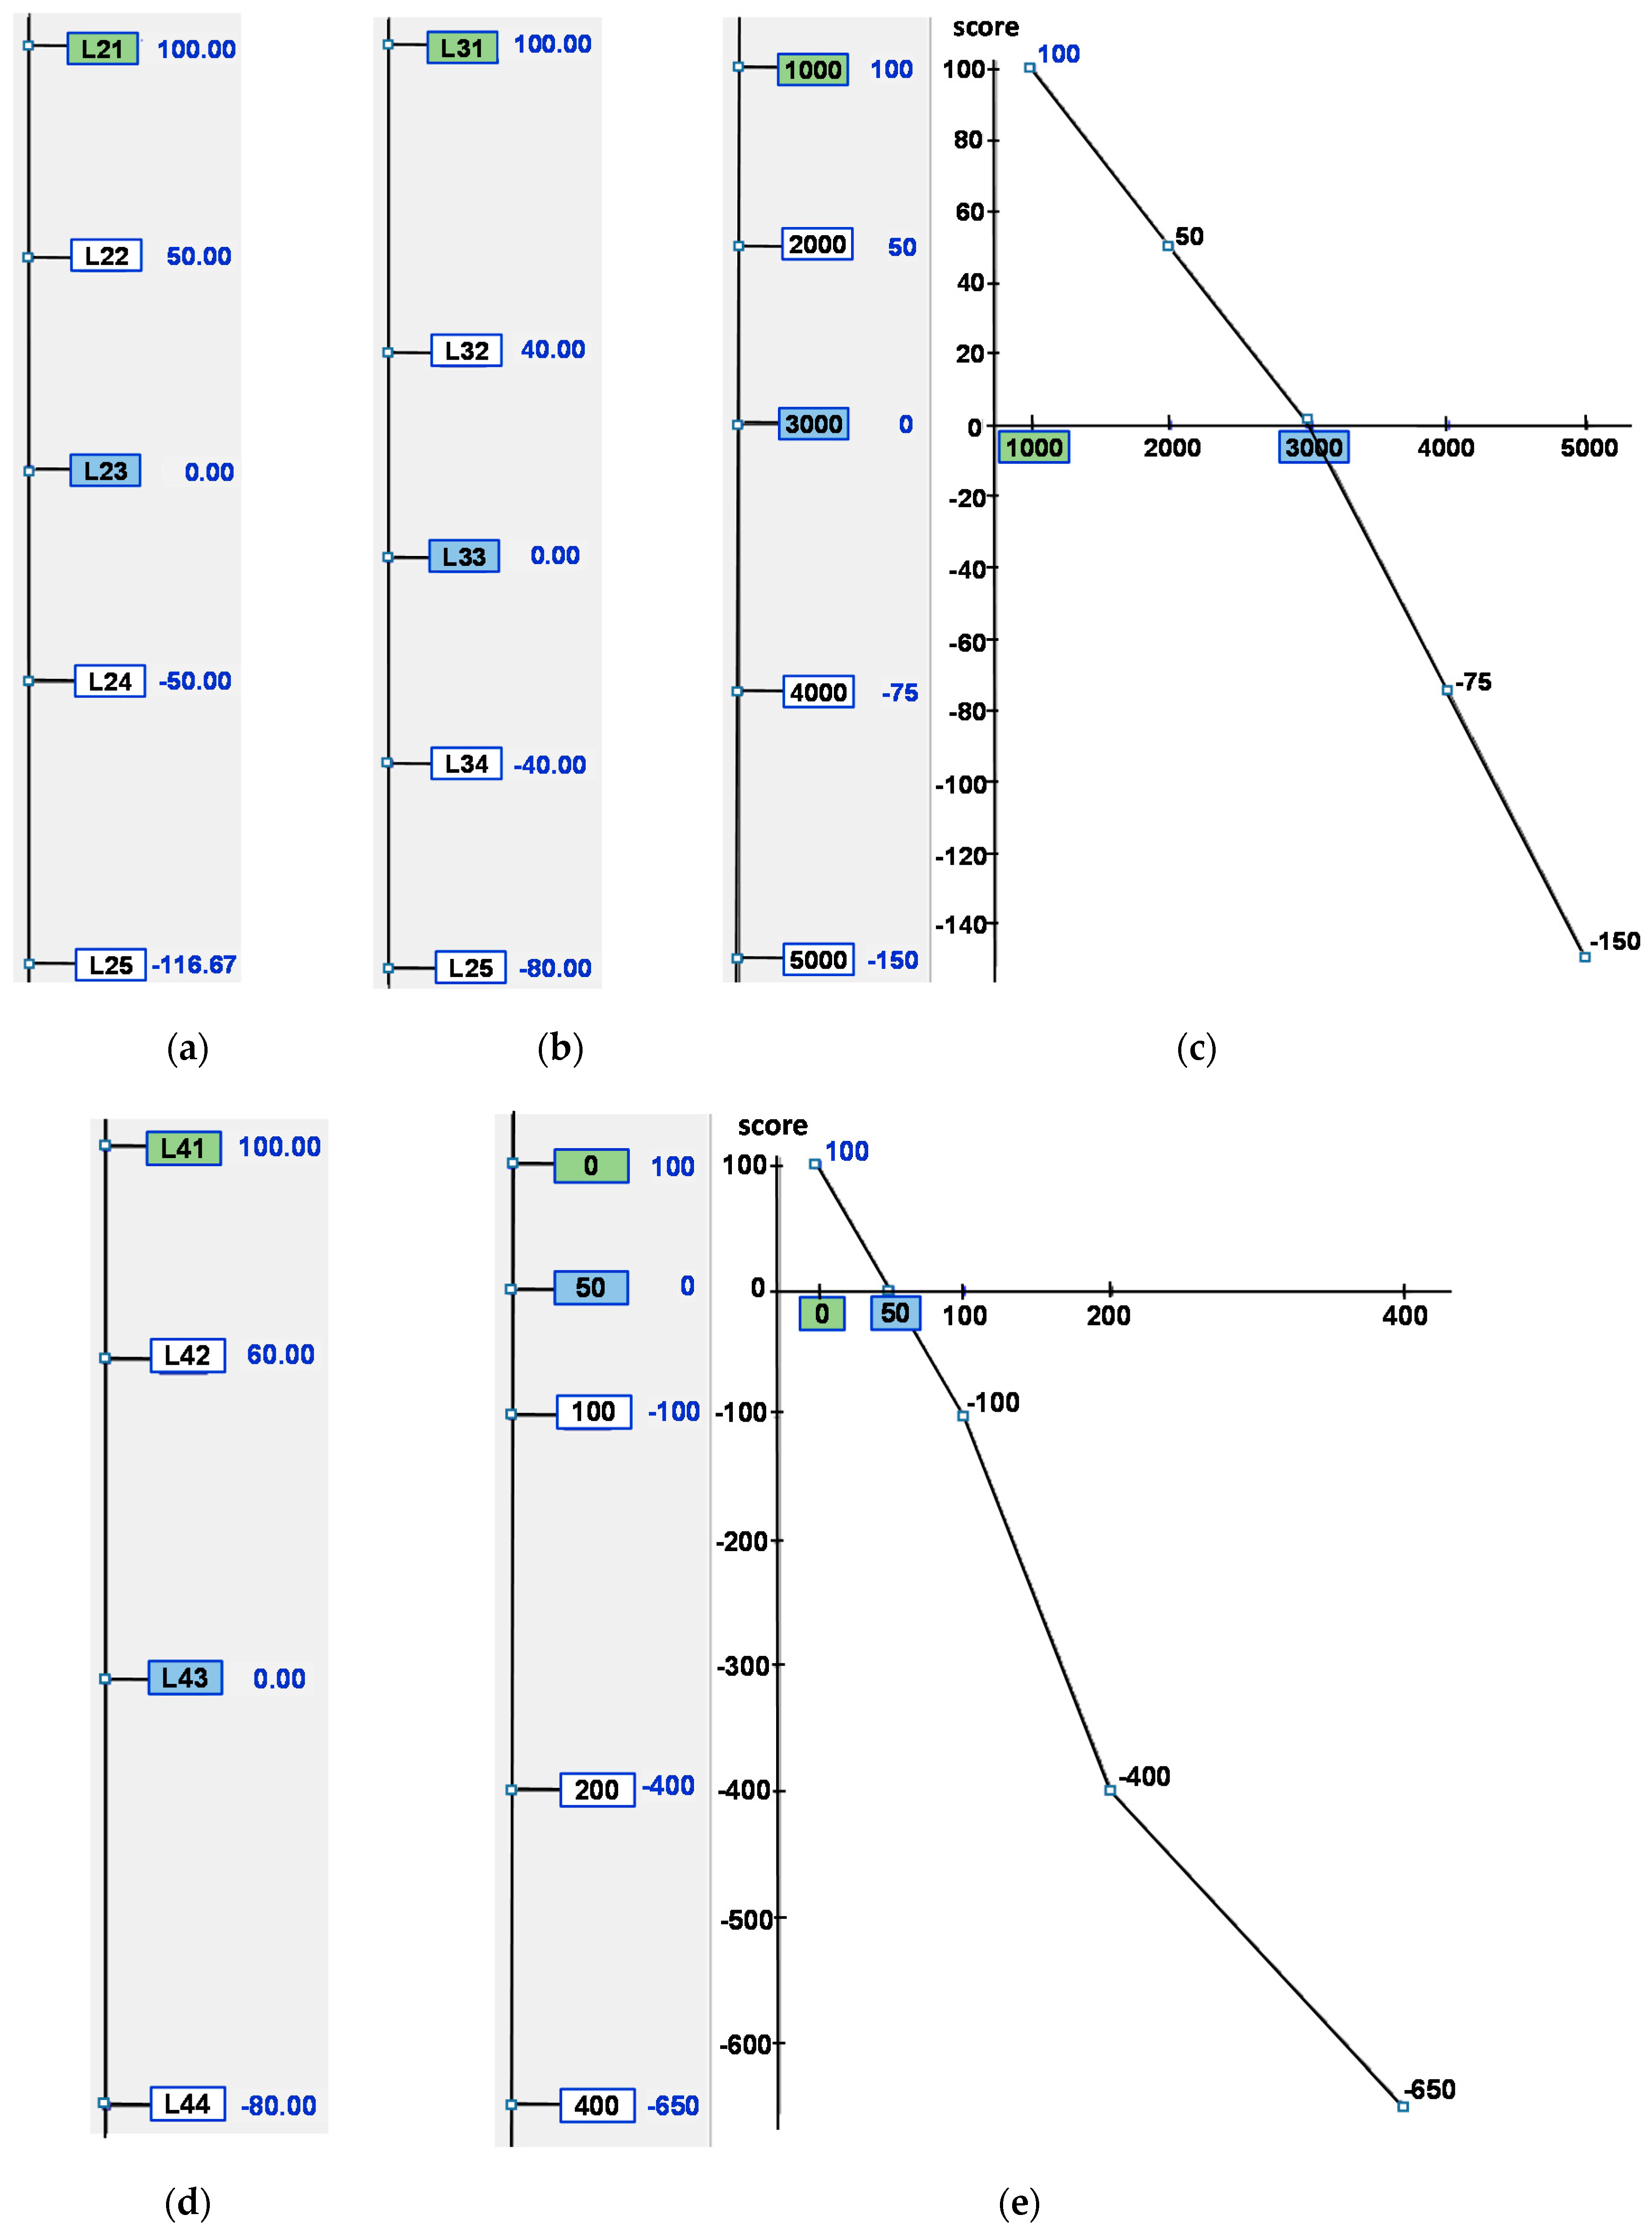
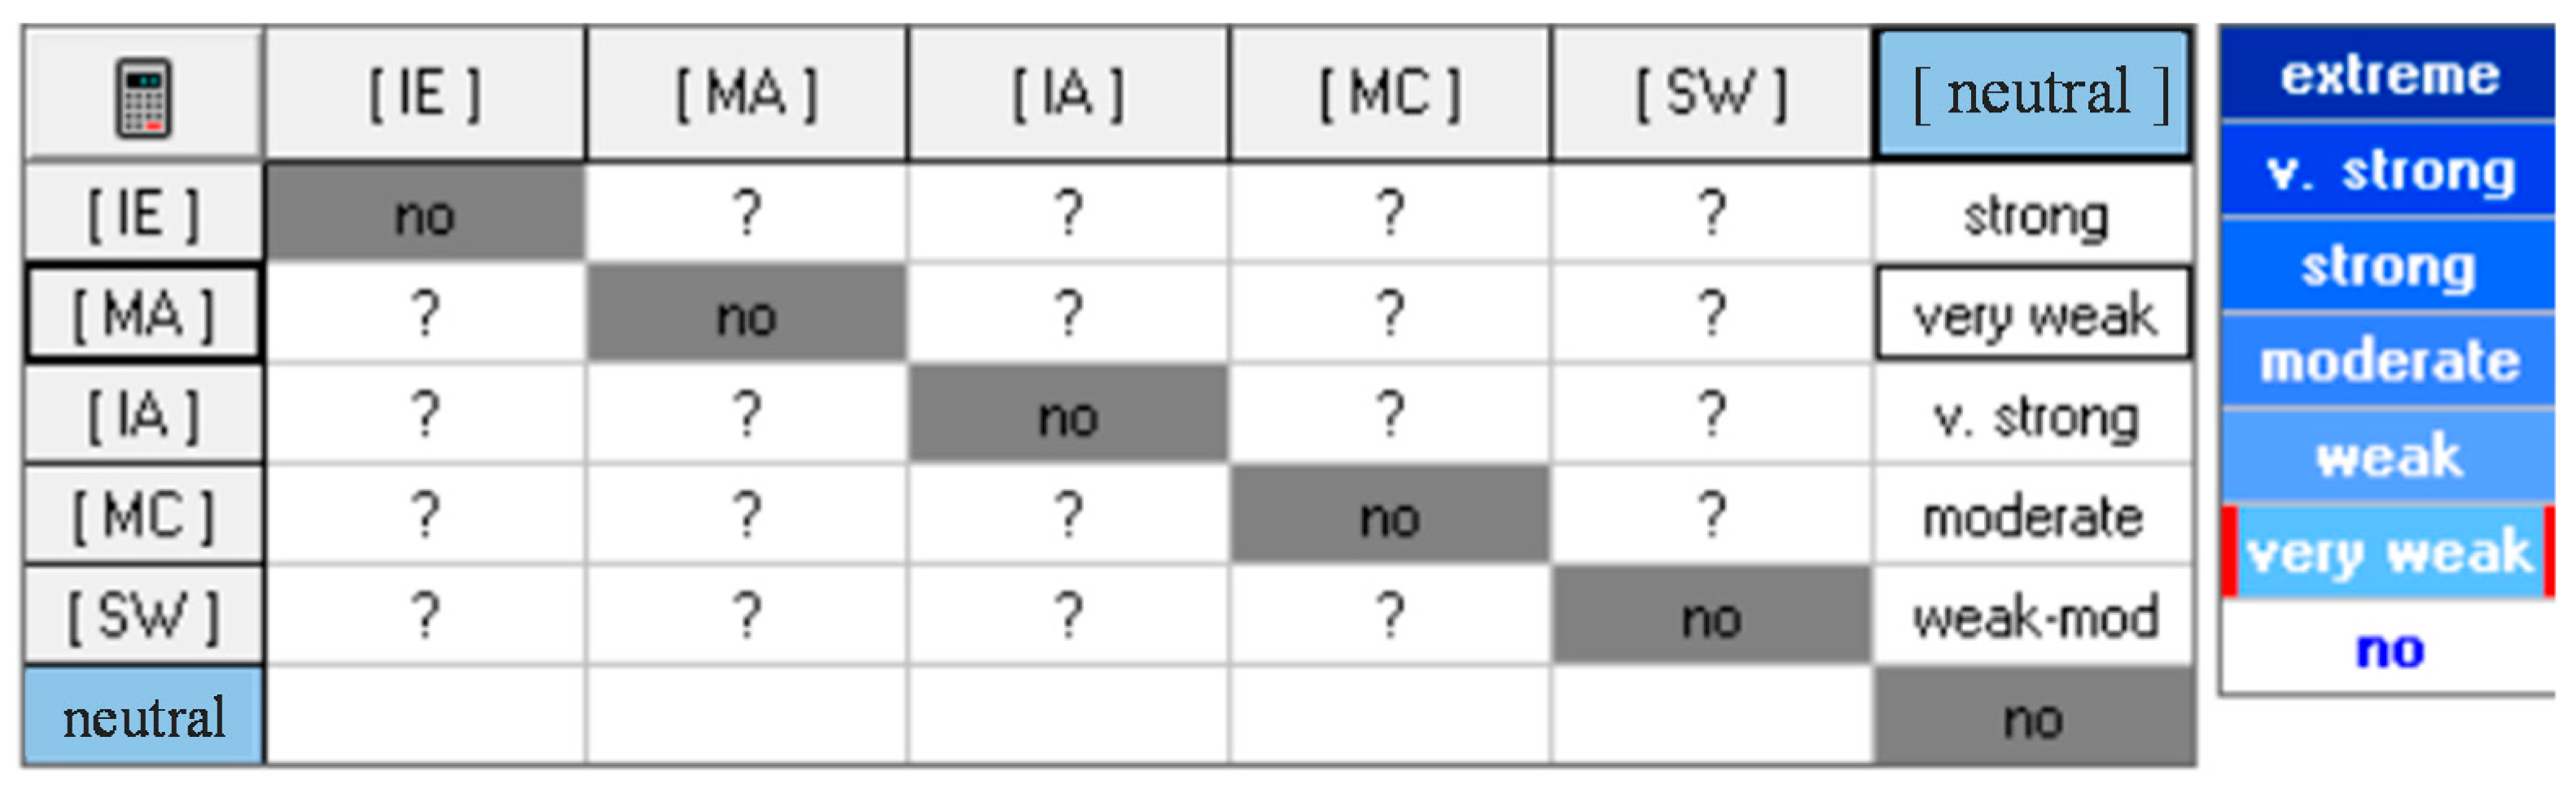
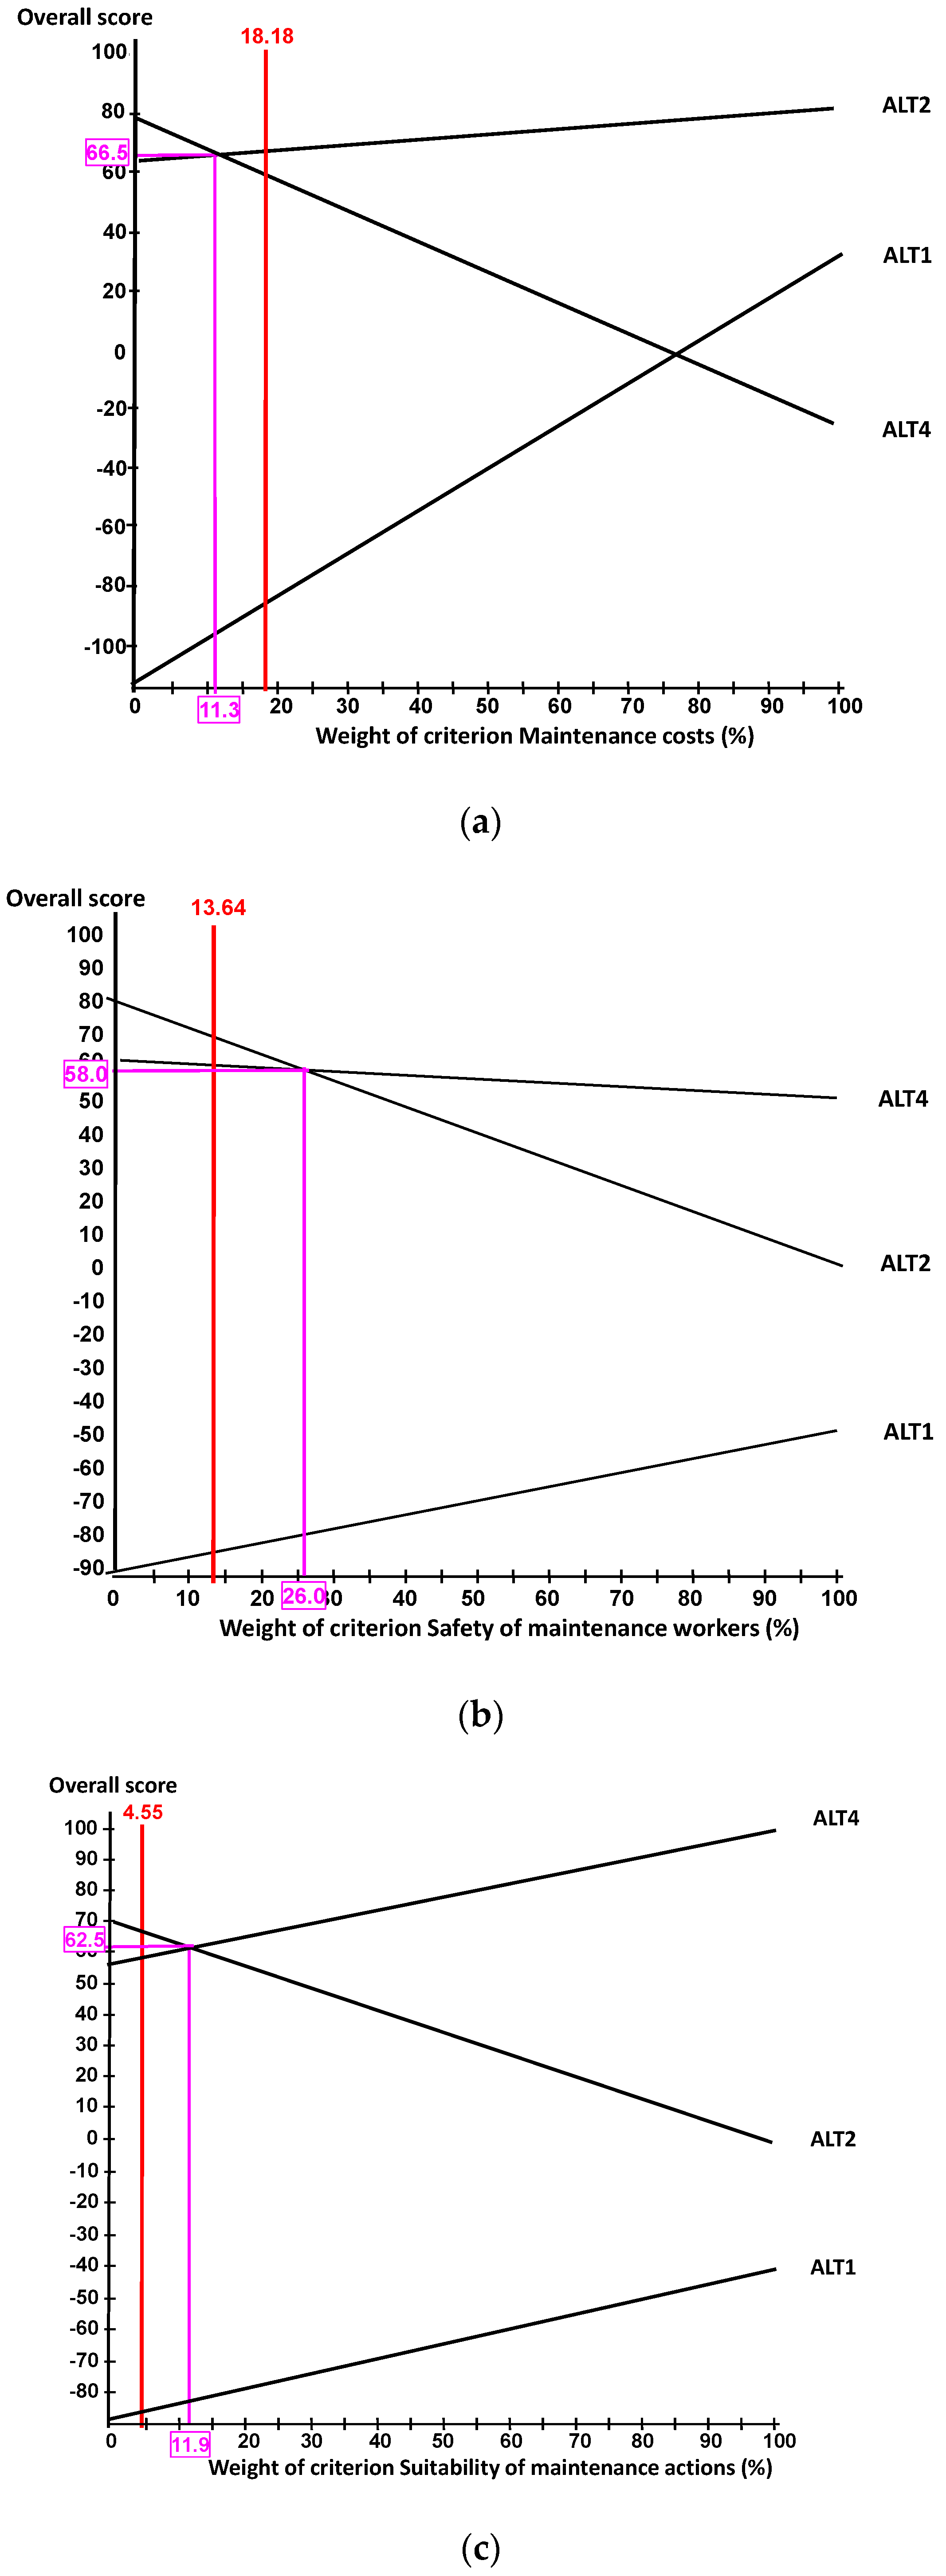
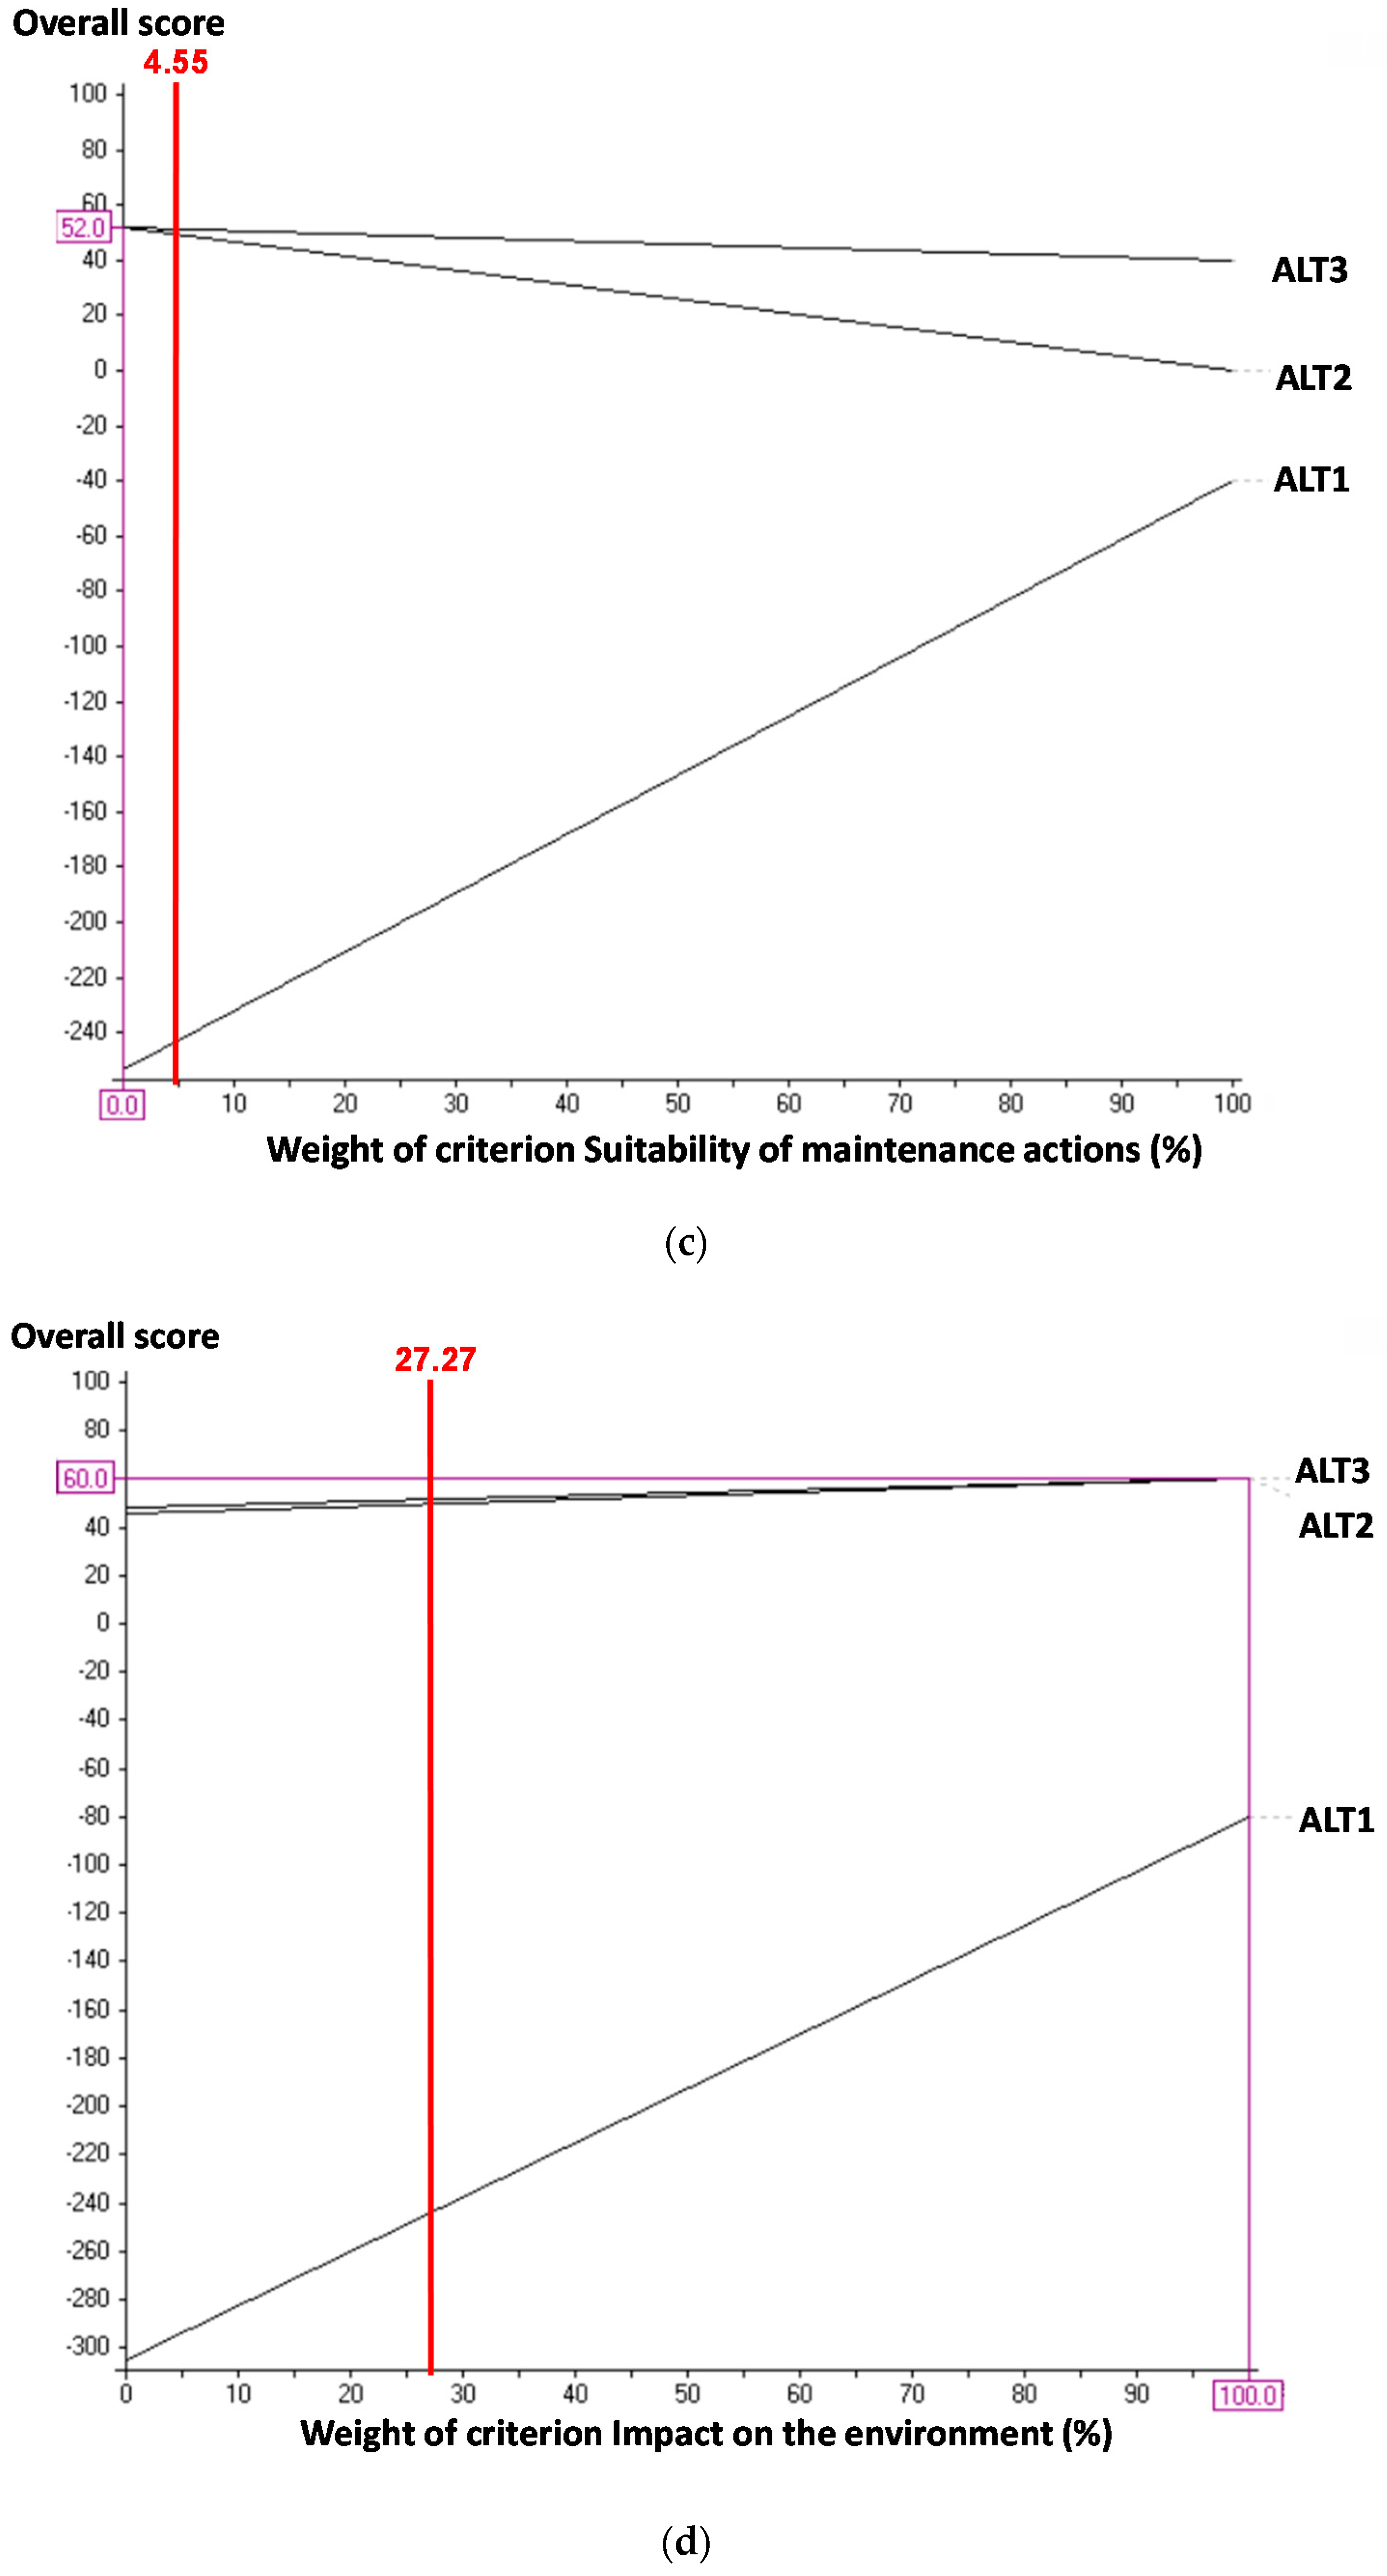
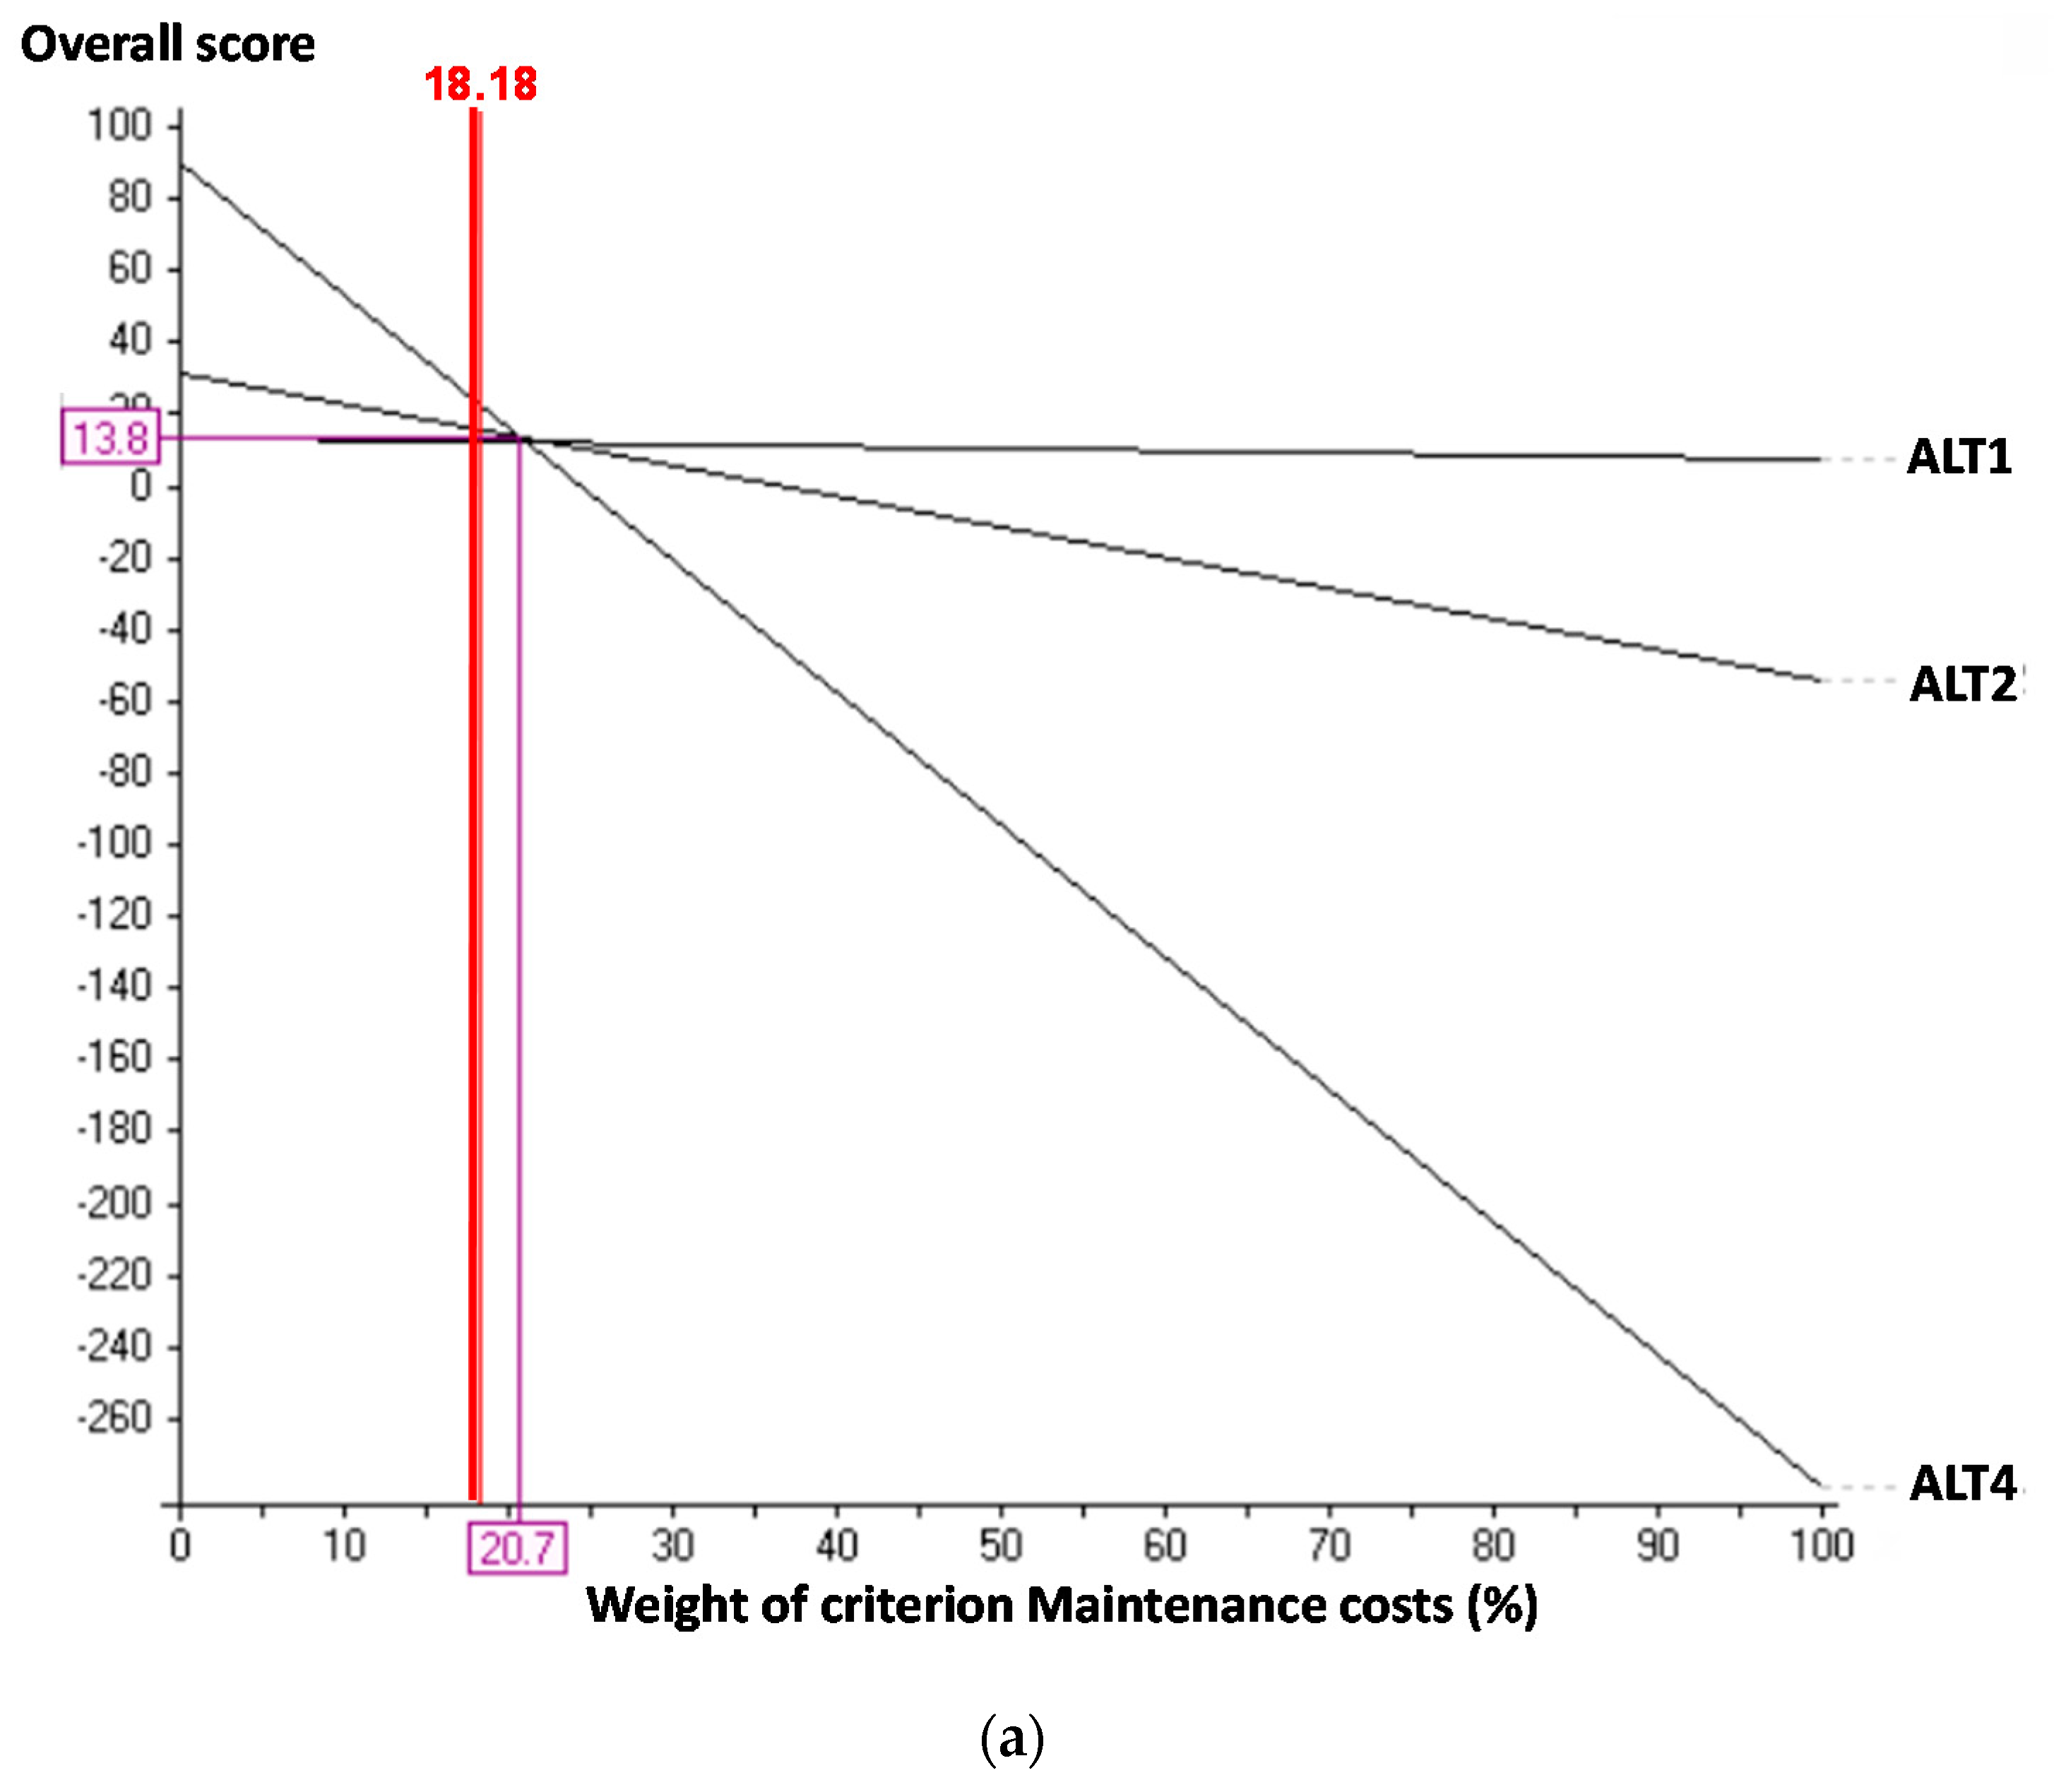
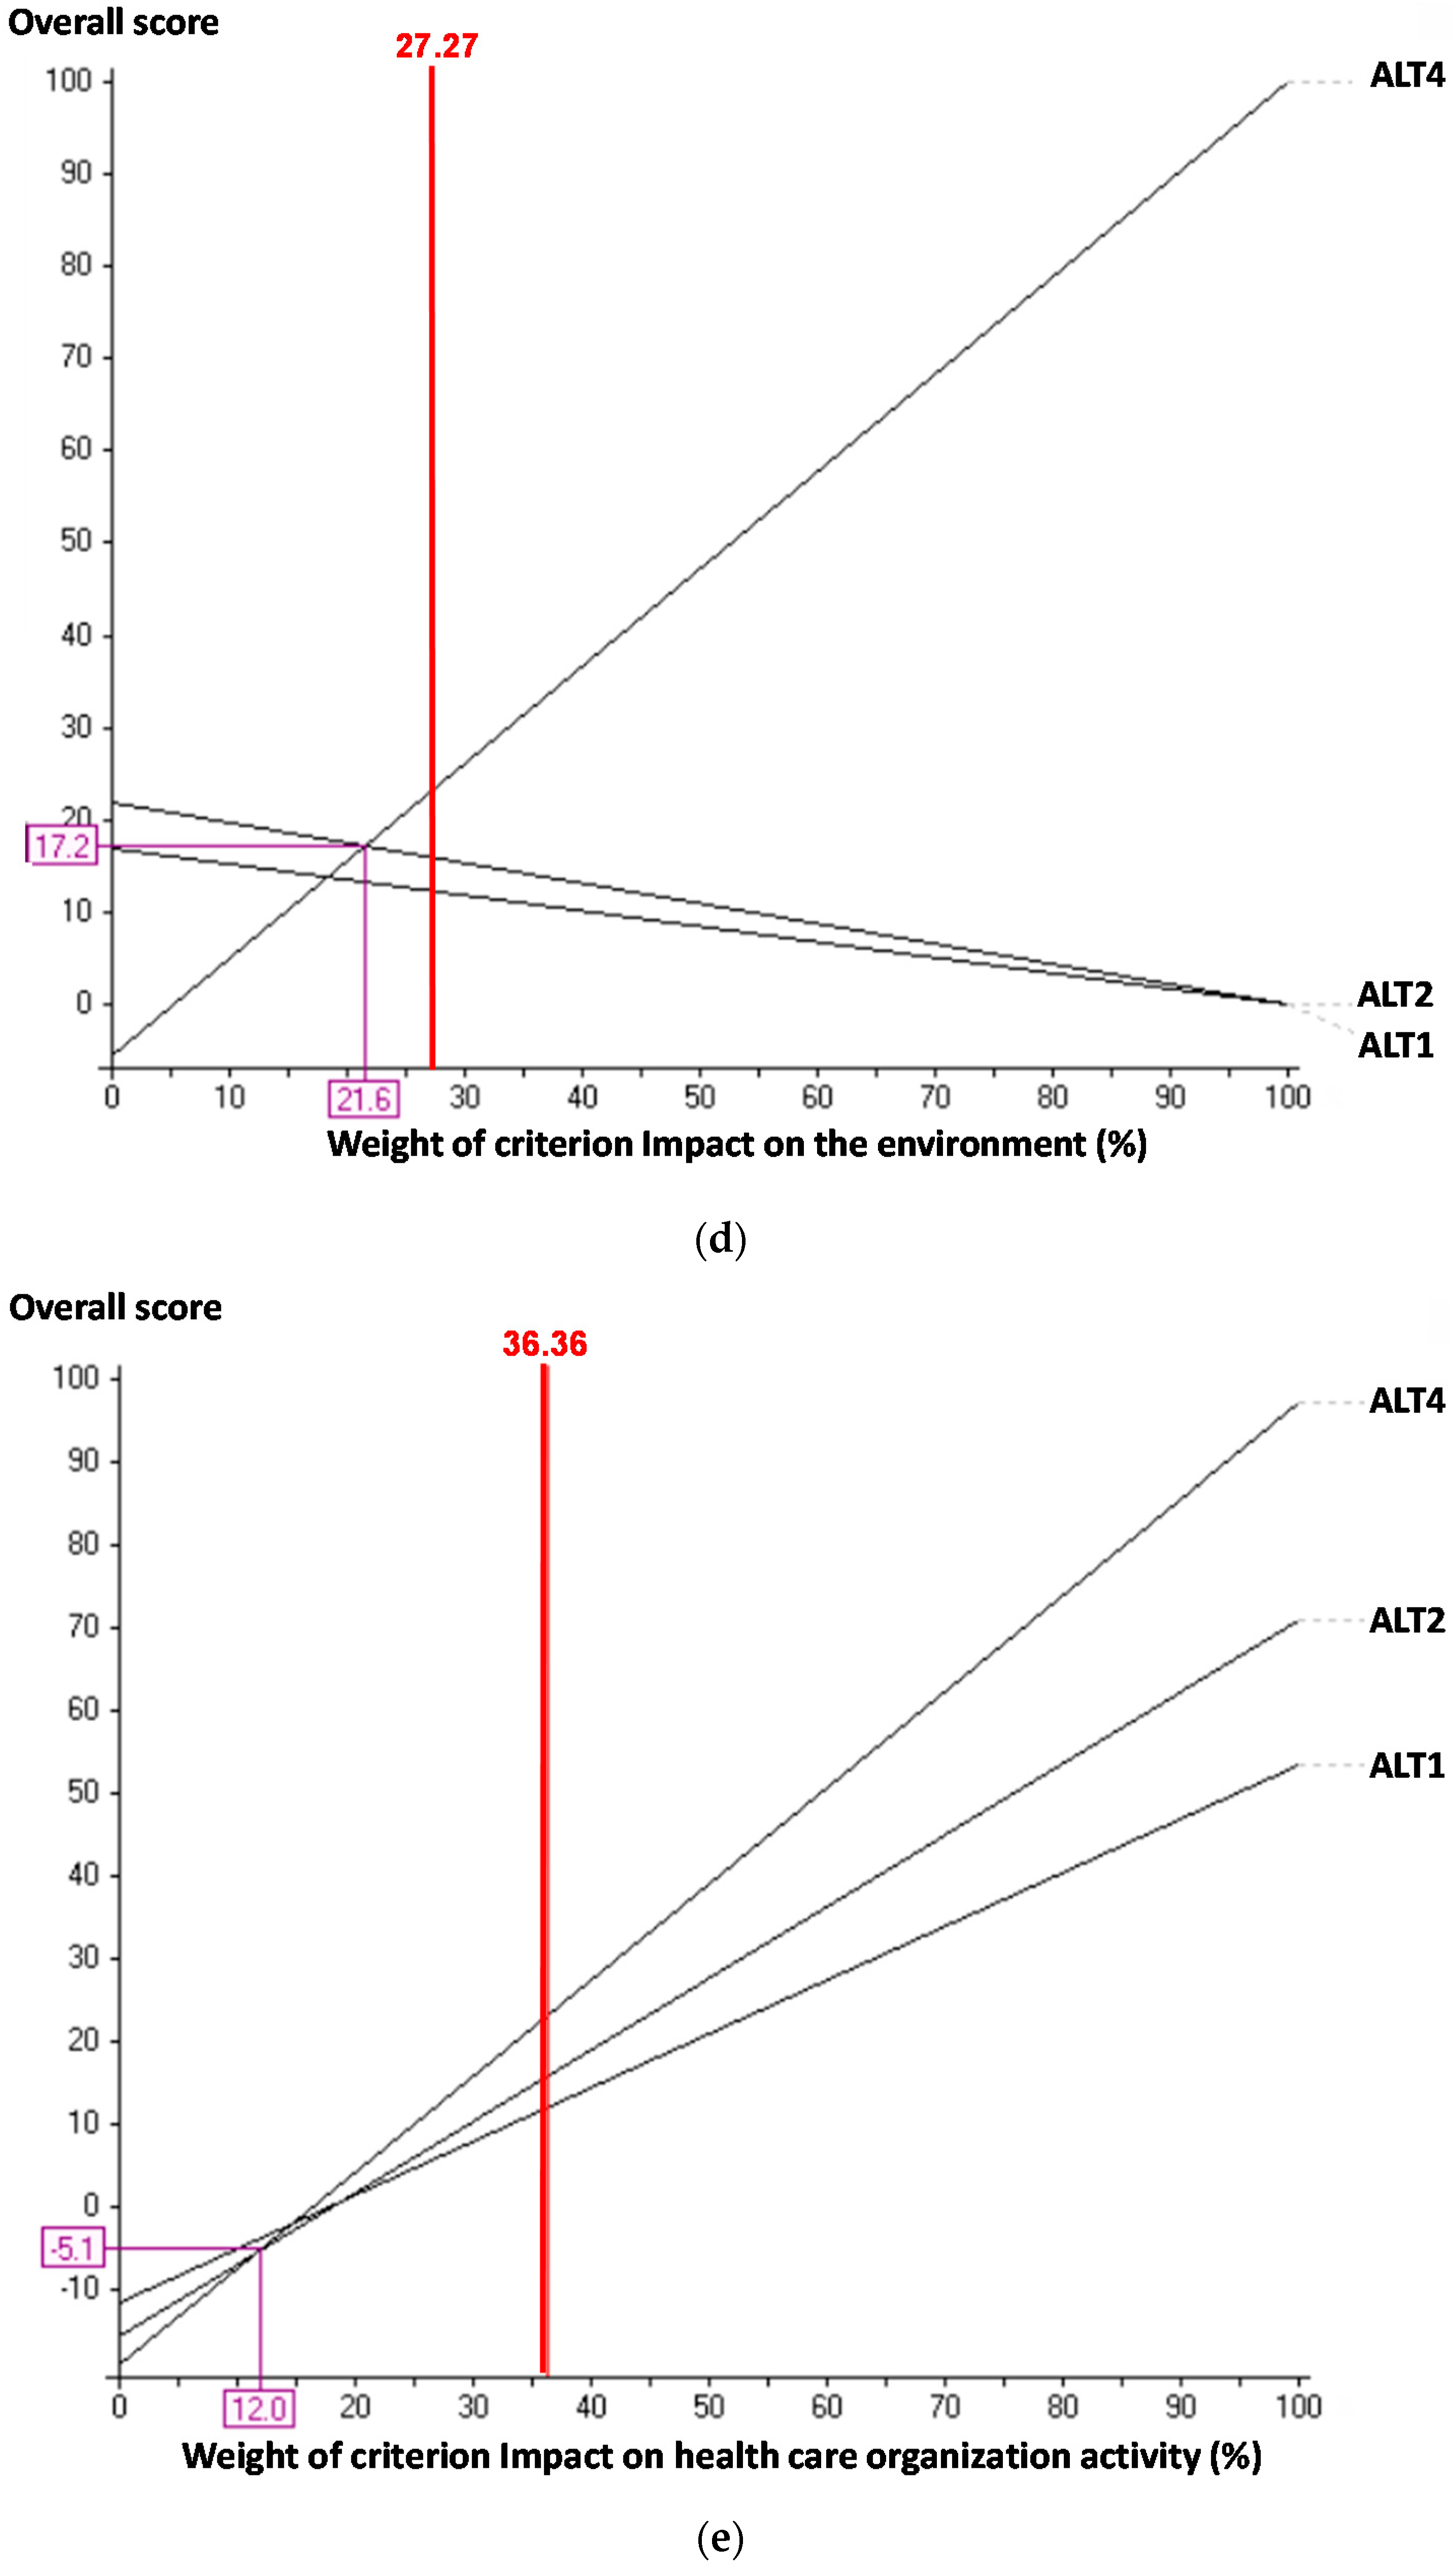
Table 1.
Preventive actions in hot domestic water facilities [3].
Table 1.
Preventive actions in hot domestic water facilities [3].
| Action | Frequency |
|---|---|
| Checking of expansion vessel | monthly |
| Checking of water treatment systems | monthly |
| Checking of water levels in circuits | monthly |
| Checking of circuit sealing in pipes | annual |
| Checking of seals in interception valves | biannual |
| Checking of weight of safety devices | monthly |
| Checking and cleaning of water filters | biannual |
| Checking of thermal exchange batteries | annual |
| Checking of pumps and ventilators | monthly |
| Checking of the preparation system for hot domestic water | monthly |
| Checking of the condition of thermal insulation | annual |
| Checking of the automatic control system | biannual |
Table 2.
Failure and repair rates for the burner-boiler unit.
| Alterna-Tives | Burner | Boiler | Burner-Boiler Unit | |||
|---|---|---|---|---|---|---|
| λ11 | µ11 | λ12 | µ12 | λ1 | µ1 | |
| ALT1 | 0.002804 | 0.041000 | 0.000166 | 0.014000 | 0.002970 | 0.037010 |
| ALT2 | 0.000228 | 0.025298 | 0.000114 | 0.041000 | 0.000342 | 0.029000 |
| ALT4 | 0.000228 | 0.025298 | 0.000114 | 0.041000 | 0.000342 | 0.029000 |
Table 3.
Failure and repair rates of the coolers.
| Alterna-Tives | Compressor Centrifuge | Motor Electric | Start-Stop Unit | Cooler | ||||
|---|---|---|---|---|---|---|---|---|
| λ21 | µ21 | λ22 | µ22 | λ23 | µ23 | λ2 | µ2 | |
| ALT1 | 0.000200 | 0.005003 | 0.000006 | 0.00595 | 0.000057 | 0.021 | 0.000263 | 0.006210 |
| ALT2 | 0.000200 | 0.005694 | 0.000005 | 0.00595 | 0.000057 | 0.125 | 0.000262 | 0.007200 |
| ALT4 | 0.000200 | 0.013263 | 0.000005 | 0.00595 | 0.000057 | 0.125 | 0.000262 | 0.016000 |
Table 4.
Failure and repair rates for each cooling tower.
| Anti-Legionella Dosing System | Mechanical and Filter System | Ventilation and Mechanical Transmission System | Cooling Tower | ||||
|---|---|---|---|---|---|---|---|
| λ31 | µ31 | λ32 | µ32 | λ33 | µ33 | λ3 | µ3 |
| 0.000280 | 0.573572 | 0.000114 | 0.573572 | 0.000023 | 0.200000 | 0.000417 | 0.520000 |
Table 5.
Failure and repair rates for each pump.
| Alterna-Tives | Axle-Bearing Unit | Mechanical Closure | Motor | Pump | ||||
|---|---|---|---|---|---|---|---|---|
| λ41 | µ41 | λ42 | µ42 | λ43 | µ43 | λ4 | µ4 | |
| ALT1 | 0.000114 | 0.001851 | 0.000114 | 0.041000 | 0.000023 | 0.013000 | 0.000251 | 0.003940 |
| ALT2 | 0.000112 | 0.126104 | 0.000114 | 0.500000 | 0.000023 | 0.013000 | 0.000249 | 0.086300 |
| ALT3 | 0.000096 | 0.374525 | 0.000094 | 0,900000 | 0.000023 | 0.013000 | 0.000213 | 0.100000 |
Table 6.
Mean availability of each system for each alternative.
| System | Alternatives | |||
|---|---|---|---|---|
| ALT1 | ALT2 | ALT3 | ALT4 | |
| Pracal | 0.9905 | 1 | - | 1 |
| Prafcd | 0.9680 | 0.9990 | 0.9990 | - |
| Prafri | 0.9984 | 0.9990 | - | 0.9999 |
| Pacbom | 0.9968 | 0.9999 | 0.9999 | - |
| Pafbom | 0.9968 | 0.9999 | 0.9999 | - |
Table 7.
Number of critical, important and normal systems that depend on each system.
| System | Number of Dependent Critical Systems | Number of Dependent Important Systems | Number of Dependent Normal Systems | |
|---|---|---|---|---|
| Pracal | 15 | 20 | 50 | 150 |
| Prafcd | 15 | 9 | 40 | 118 |
| Prafri | 15 | 15 | 55 | 145 |
| Pacbom | 15 | 9 | 41 | 119 |
| Pafbom | 15 | 9 | 41 | 119 |
Table 8.
Table of performance of alternatives in the different systems.
| Alterna-Tives | Mainte-Nance Costs (€) | Safety of Maintenance Workers | Suitability of Maintenance Actions | Impact on the Environment | Impact on Health Care Organization Activity |
|---|---|---|---|---|---|
| Pracal | |||||
| ALT1 | 2340 | L24 | L34 | L43 | 150 × (1 − 0.9905) × 100 = 142.50 |
| ALT2 | 1345 | L23 | L33 | L42 | 150 × (1 − 1) × 100 = 0 |
| ALT4 | 3345 | L22 | L31 | L42 | 150 × (1 − 1) × 100 = 0 |
| Prafcd | |||||
| ALT1 | 1578 | L24 | L34 | L44 | 118 × (1 − 0.9680) × 100 = 377.60 |
| ALT2 | 2398 | L23 | L33 | L42 | 118 × (1 − 0.9990) × 100 = 11.80 |
| ALT3 | 3389 | L23 | L32 | L42 | 118 × (1 – 0.9990) × 100 = 11.80 |
| Prafri | |||||
| ALT1 | 2852 | L24 | L34 | L43 | 145 × (1 − 0.9984) × 100 = 23.20 |
| ALT2 | 3720 | L23 | L33 | L43 | 145 × (1 − 0.9990) × 100 = 14.80 |
| ALT4 | 6720 | L22 | L31 | L41 | 145 × (1 − 0.9999) × 100 = 1.45 |
| Pacbom | |||||
| ALT1 | 762.6 | L24 | L33 | L42 | 119 × (1 − 0.9968) × 100 = 38.08 |
| ALT2 | 902 | L23 | L33 | L41 | 119 × (1 − 0.9999) × 100 = 1.19 |
| ALT3 | 1894 | L23 | L32 | L41 | 119 × (1 − 0.9999) × 100 = 1.19 |
| Pafbom | |||||
| ALT1 | 762.6 | L24 | L33 | L42 | 119 × (1 − 0.9968) × 100 = 38.08 |
| ALT2 | 902 | L23 | L33 | L41 | 119 × (1 − 0.9999) × 100 = 1.19 |
| ALT3 | 1894 | L23 | L32 | L41 | 119 × (1 − 0.9999) × 100 = 1.19 |
Table 9.
Maintenance policies currently applied at University General Hospital of Ciudad Real (UGHCR) and the best combination of maintenance policies as assessed by the model.
Table 9.
Maintenance policies currently applied at University General Hospital of Ciudad Real (UGHCR) and the best combination of maintenance policies as assessed by the model.
| System | Alternative Currently Applied | Alternative Provided by this Research | ||||||
|---|---|---|---|---|---|---|---|---|
| Alternative (Value) | Costs (€) | Consequences for Care | Availa-bility | Alternative (Value) | Costs (€) | Consequences for Care | Availa-bility | |
| Prafcd | ALT2 (49.61) | 2398 | May have serious consequences for the normal working of care for a short time. | 0.9990 | ALT3 (51.52) | 3389 | Guarantees the normal working of care at all times. Improves maintenance programming, safety of care and maintenance workers, increasing the availability of maintenance workers to perform maintenance activities of greater added value to the organization | 0.9990 |
| Prafri | ALT2 (16.00) | 3720 | May have serious consequences for normal working of care for a short time. | 0.9990 | ALT4 (23.22) | 6720 | Guarantees the normal working of care at all times. Improves maintenance programming, safety of care and maintenance workers, increasing the availability of maintenance workers to perform maintenance activities of greater added value to the organization. | 0.9999 |
© 2017 by the authors. Licensee MDPI, Basel, Switzerland. This article is an open access article distributed under the terms and conditions of the Creative Commons Attribution (CC BY) license (http://creativecommons.org/licenses/by/4.0/).
Share and Cite
MDPI and ACS Style
Carnero, M.C.; Gómez, A. A Multicriteria Model for Optimization of Maintenance in Thermal Energy Production Systems in Hospitals: A Case Study in a Spanish Hospital. Sustainability 2017, 9, 493. https://doi.org/10.3390/su9040493
AMA Style
Carnero MC, Gómez A. A Multicriteria Model for Optimization of Maintenance in Thermal Energy Production Systems in Hospitals: A Case Study in a Spanish Hospital. Sustainability. 2017; 9(4):493. https://doi.org/10.3390/su9040493
Chicago/Turabian StyleCarnero, María Carmen, and Andrés Gómez. 2017. "A Multicriteria Model for Optimization of Maintenance in Thermal Energy Production Systems in Hospitals: A Case Study in a Spanish Hospital" Sustainability 9, no. 4: 493. https://doi.org/10.3390/su9040493
Note that from the first issue of 2016, this journal uses article numbers instead of page numbers. See further details here.