
Using Fuzzy DEA for Green Suppliers Selection Considering Carbon Footprints


Department of Business Administration, National Kaohsiung University of Applied Sciences, Kaohsiung City 807, Taiwan
*
Author to whom correspondence should be addressed.
Sustainability 2017, 9(4), 495; https://doi.org/10.3390/su9040495
Submission received: 4 January 2017
/
Revised: 24 March 2017
/
Accepted: 24 March 2017
/
Published: 25 March 2017
(This article belongs to the Special Issue Sustainability of Economic and Management Systems: Perspectives of Uncertainty and Data Driven Optimization)
Abstract
:Due to increasing global environmental awareness, supply chains that consider environmental protection tend to be favored by green-minded customers. In addition to adapting to the technology required for green supply chains and developing contingency plans, organizations must consider reducing their carbon footprint to meet corporate objectives and reducing their carbon footprint. To address this issue, this paper aims at establishing a decision-making process for buyers with sustainability in mind. A fuzzy data envelopment analysis (FDEA) model was developed to select the most suitable supplier. Production costs, lead time, and supply chain carbon footprints were used as the input criteria, and quality and demand quantity were used as the output criteria. Buyer-seller supply chains and non-cooperative and cooperative models were employed separately to calculate associative efficiency. Sensitivity analysis was conducted to understand the effects carbon footprints have on efficiency. This study found that suppliers with low carbon footprints exhibited poor efficiency, which may be attributed to the additional effort required to select raw materials. Additionally, suppliers with different supply chain operation models exhibited differing efficiencies. Therefore, suppliers must consider the balance between carbon footprint reduction and costs, and buyers must consider environmental criteria when selecting green suppliers.
1. Introduction
Recently, scientists have reported a gradual decline in the Arctic ice fields and dramatic changes in global temperatures caused by greenhouse effects. Countries worldwide have experienced constant flooding and droughts, such as the severe flooding caused by continuous rainstorms in Southern Thailand and the severe droughts throughout the United States. These natural disasters not only cause serious losses for the agricultural and livestock industries, which ultimately increase food prices, but also gravely affect and disrupt global industry supply chains. Thus, such disasters pose tremendous threats to human safety and have a ripple effect on the global economy.
Carbon footprint reduction has become a leading method for global supply chains to mitigate their impacts on the environment and climate change [1]. Contrary to traditional supply chain selections that focus on cost, quality, and price, green supply chain selections consider additional factors, such as environmental pollution and protection, and carbon emissions. With rising global environmental awareness, supply chains that do not follow environmental protection trends and reduce their carbon footprint tend to be eliminated. In addition to adapting to the technology of green supply chains and developing contingency plans, organizations must also select the best suppliers that meet corporate objectives and mitigate climate change. Therefore, selecting the best suppliers has become a crucial task for organizations. This research mainly focuses on investigating the impact of carbon footprint on the supplier selection decision.
Wiedmann and Barrett [2] defined carbon footprint as “a measure of the exclusive total amount of CO2 emissions that is directly and indirectly caused by an activity or accumulated over the life stages of a product”. These activities include those performed by people, groups, governments, companies, organizations, manufacturing processes, and industrial sectors, and the products include goods and services. This definition indicates that the assessment of carbon footprints is no longer limited to one activity or production stage, but the entire supply chain is included. The Carbon Trust [3] defined a carbon footprint as a measure of the total amount of CO2 equivalent to the greenhouse gases that are directly and indirectly generated by people, organizations, or products. The six major greenhouse gases listed in the Kyoto Protocol [4] that are believed to contribute to global warming are CO2, methane (CH4), nitrous oxide (N2O), hydrofluorocarbons (HFCs), perfluorocarbons (PFCs), and sulfur hexafluoride (SF6).
Huang et al. [5] asserted that a carbon footprint is derived from three pollution types:
- Type 1: Direct emissions, which refers to the greenhouse gas emissions generated by the item itself.
- Type 2: Indirect energy emissions, which refers to the greenhouse gas emissions created when purchasing external electricity or steam.
- Type 3: Other emissions, which refers to all other emissions not included in Types 1 and 2. These emissions account for all greenhouse gases generated by the supply chain.
For the industrial sector, an average of 75% of the carbon footprint is derived from Type 3 emissions [5]. If the carbon footprint of suppliers can be further understood, these organizations can better control the supply chain carbon footprint. These organizations can then develop effective carbon footprint reduction plans to minimize their negative effects on the environment.
Unlike traditional supplier selections, green supplier selections are not merely cost-oriented but, to an even larger extent, environment-oriented. Supplier selection has a significant role in green supply chains; the positive relationship between green supplier selection and green supply chains has attracted considerable attention [6]. Although different industries, products, and organizations have varying concerns, they all emphasize the environment as the key focus. However, Genovese et al. [7] identified that the implementation of green criteria during the supplier selection process remains a challengeable task.
Noci [8] introduced a green retailer ranking framework to assess the environmental performance of suppliers. The primary assessment criteria included green ability, green image, and the costs and environmental efficiency of the overall product lifecycle. Humphreys et al. [9] suggested using a knowledge-based system to assess the environmental performance of suppliers. The measurement criteria included costs, management abilities, green image, green design, environmental management system, and environmental ability. Lee et al. [10] proposed an integrated model for high-tech industries, and recommended using six factors for selecting suppliers. These six factors were quality, technical ability, pollution control, environmental management, green production, and green ability. Büyüközkan [11] developed a green assessment tool by implementing a fuzzy analytic network process (FANP) approach to cope with green logistics and green organizational activities. Similarly, Dey and Cheffi [12] used analytic hierarchy process (AHP) to construct a green chain performance measurement framework. Amindoust [13] found that the assessment criteria most frequently adopted were quality, price/cost, and delivery for the economic dimension, and environmental management systems and environmental ability for the environmental dimension.
This study takes into consideration a supplier’s carbon footprint as an evaluation criterion to develop a green supplier selection model. The data envelopment analysis (DEA) method is utilized by integrating the fuzzy theory to address the bias caused by inaccurate criteria. The rest of this paper is organized as follows. Section 2 presents the development of the fuzzy DEA (FDEA) model. Section 3 illustrates a numerical example to demonstrate the applicability of the proposed model. Section 4 presents the sensitivity analysis. Section 5 concludes the research.
2. Model Development
DEA has been proven to an effective method in measuring the relative efficiency of peer decision-making units when multiple criteria are present. However, DEA cannot be applied directly to measure the efficiency of the suppliers. Liang et al. [14] proposed a revised DEA model based on cooperative and non-cooperative games. This study used the supply chain performance assessment model developed by Liang et al. [14] combined with the FDEA method proposed by Kao and Liu [15] to produce a FDEA model that considers the supply chain carbon footprint. The fuzzy ranking method was used to select the most suitable suppliers.
2.1. Selecting Input and Output Criteria
Quantifiable attributes were used as the supplier selection criteria in this study. Amindoust [12] investigated the results reported in sustainable supplier selection literature, and found that the assessment criteria most commonly used were quality and price/cost. The supplier selection method introduced by Kuo et al. [16] also provided valuable information. Therefore, this study used quality, production cost, and carbon footprint as the supplier selection assessment criteria. Concerning production cost, the total costs invested by the production unit were used as the assessment criteria. Carbon footprint was selected as the key assessment criterion because it directly reflects the environmental impact an organization has on the environment. Production cost and carbon footprint are utilized as input criteria due to their “the less the better” behavior. Yield of quality, on the other hand, is used as output criterion for its “the more the better” attribute. However, because carbon footprints involve a level of uncertainty and cannot be accurately measured, they were represented as triangular fuzzy numbers. The fuzzy numbers are defuzzified by applying α-cut.
2.2. Developing a FDEA Model
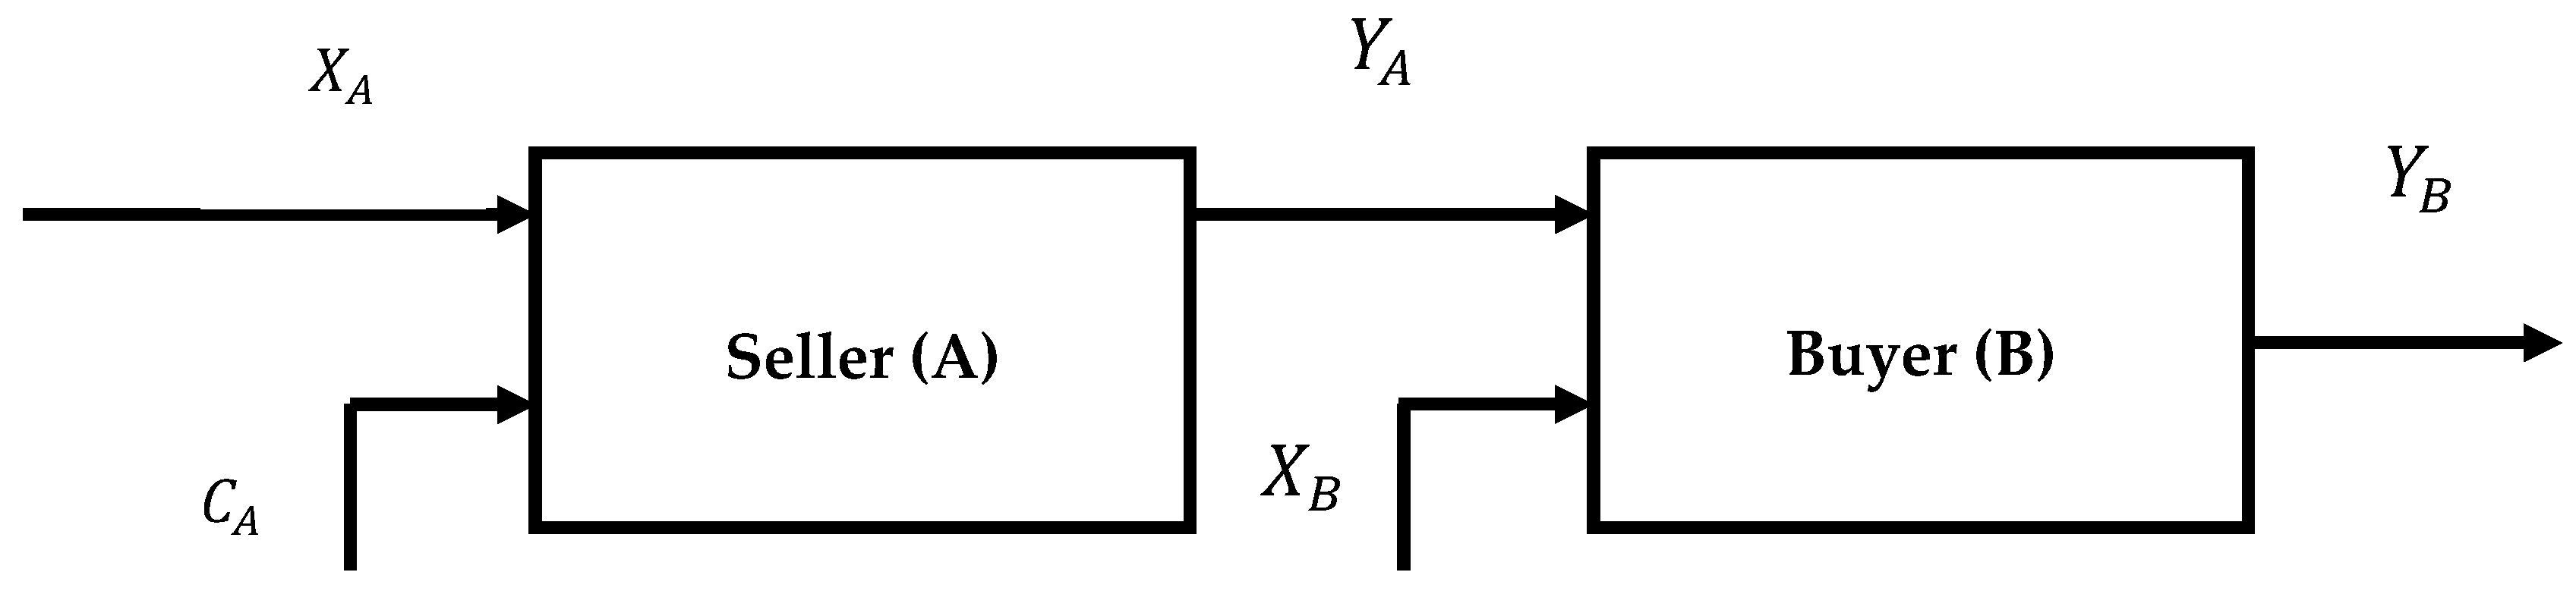
This study referred to the model used by Liang et al. [14] to measure supply chain efficiency (as shown in Figure 1) and simultaneously considered the supply chains of buyers and sellers. represents the carbon footprint input of Seller A, represents the other outputs of Seller A, and represents the output of Seller A and the input of Buyer B. Conversely, represents the input of Buyer B, and represents the output of Buyer B.
This model uses cooperative and non-cooperative concepts to assess the efficiency of a supply chain and its members. The non-cooperative concept was developed based on the structural concept of leader-follower and requires a “seller leads and buyer follows” or “buyer leads and seller follows” framework. The concept of the non-cooperative model features one party acting as the leader and controlling the strategies of the other party. The leader also determines the optimal strategy. Conversely, in a cooperative model, the buyer and the seller have the same right to control the entire supply chain.
The decision variables for the mathematical programming model that were used to calculate the supply chain carbon footprint, input-output parameters, and input-output symbols are defined as follows:
Decision variables:
- : Weight of seller inputs
- : Weight of buyer inputs
- : Weight of seller outputs
- : Weight of buyer outputs
- : Weight of buyer outputs in a non-cooperative model where the buyer leads
- : Weight of seller outputs in a non-cooperative model where the buyer leads
- : Weight of seller outputs in a cooperative model
- : Weight of seller inputs that generate a carbon footprint
- : Weight of buyer inputs that generate a carbon footprint
- : Seller efficiency in an environment where the seller leads
- : Buyer efficiency in an environment where the seller leads
- : Seller efficiency in an environment where the buyer leads
- : Buyer efficiency in an environment where the buyer leads
- : Average seller efficiency in a cooperative environment
Input and output criterion
- : Carbon footprint generated by seller j
- : Carbon footprint generated by the buyer from using seller j
- : Seller j’s production inputs
- : Buyer input from using seller j
- : Seller j’s production outputs
- : Buyer output from using seller j
Parameters:
Descriptions of the integrated FDEA models are as follows:
Non-cooperative model where the seller leads: Seller efficiency:
Non-cooperative model where the seller leads: Buyer efficiency:
Non-cooperative model where the buyer leads: Seller efficiency:
Cooperative model: Joint efficiency:
2.3. Solution of Fuzzy DEA
Kao and Liu [15] was utilized to solve the proposed Fuzzy DEA model by calculating the upper and lower bound of the fuzzy efficiency.
Calculation of upper bound of fuzzy efficiency:
Calculation lower bound of fuzzy efficiency:
2.4. Using Fuzzy Ranking Techniques to Select Suppliers
Since the efficiency values calculated using the FDEA may remain fuzzy, these values must be ranked to identify the optimal or alternative suppliers. This study used the index designed by Chen and Klein [17] to rank the fuzzy numbers.
where and . Therefore, the fuzzy efficiency value obtained can be inputted into Equation (7) to determine the fuzzy index and rank the efficiencies.
3. Numerical Example
To demonstrate how this FDEA supplier selection model can be applied, a major 3C (computer, communication, and consumer electronics) company in Taiwan, Company A, was selected to verify the model’s feasibility. Company A primarily sells consumer electronics products. In 2011, Company A reported a revenue of USD$10 billion. The company continues to emphasize environmental protection, sustainable resource use, and ecology-related issues, in addition to vigorously endorsing green design, green procurement, green production, and green marketing. They lead by example and drive the industry to continue promoting sustainable management. Concurrently, they collaborate with suppliers to promote green supply chains, enhance green design, develop green products, and endorse green product recycling and energy-saving product designs. Company A not only adheres to international environmental regulations, such as the Waste Electrical and Electronic Equipment Directive, Restriction of Hazardous Substances Directive, Registration, Evaluation, Authorization, and Restriction of Chemical Substances (REACH) regulation, and Energy Using Products Directive, but has also received numerous environmental awards. One of its notebook computers even becomes the world's first notebook to receive both Environmental Product Declaration (EPD) and carbon footprint (PAS 2050:2008) certificates. In this study, Company A selected a supplier of LCD monitor display modules by implementing the proposed decision model.
The ISO 14067 carbon footprint assessment standards were used to estimate the carbon footprint of the suppliers. During the product life cycle, one unit of a notebook computer produced by Company A generated 15 kg of CO2, 8 kg of CH4, 3 kg of N2O, 2 kg of HFCs, 1 kg of PFCs, and 1 kg of SF6, all of which, when converted using the assessment conversion level of 2011, produced a CO2 equivalent (CO2e) of 60,899 kg.
Due to varying product demands, Company A produced three notebook computer series with varying specifications, of which the largest differences were notebook size and monitor performance. The input and output criteria utilized assessment criteria recommended by Amindoust [12] and included carbon footprints as well to preserve environmental awareness. Assembly of the LCD panels of varying specifications incurred varying lead times, carbon footprints, and production quantities. For sellers, panel production also incurred varying production costs, carbon footprints, and quality. The inputs and outputs for buyers and sellers regarding the various notebook computer series are shown in Table 1, Table 2 and Table 3.
The proposed FDEA model was implemented to determine a suitable supplier of the LCD monitor display modules. The results are presented in Table 4, Table 5 and Table 6.
For Product Series A, Supplier 3 exhibits the best efficiency in a seller-led non-cooperative environment. Supplier 4 demonstrates the best efficiency in a buyer-led non-cooperative environment and Supplier 3 shows the best efficiency in a cooperative environment.
Concerning Product B, Supplier 1 shows optimum efficiency for both the seller-led and buyer-led non-cooperative environments, followed by Supplier 2. Supplier 1 also exhibits optimum efficiency in a cooperative environment.
Regarding Product C, Supplier 4 exhibits optimum efficiency for both the seller-led and buyer-led non-cooperative environments, followed by Supplier 3. Supplier 4 demonstrates optimum efficiency in a cooperative environment.
From this information, the most suitable supplier can be selected. The second most efficient supplier can be selected as an alternative to minimize the risk of supply shortages.
These empirical results show that the FDEA model developed in this study can effectively calculate and rank the efficiency of suppliers. The results also indicate that for Product Series A and B, the LCD monitor display module suppliers that generated a low carbon footprint exhibited poor efficiency. This may be attributed to how suppliers must invest more to improve the production process or select environmentally friendly materials when pursuing low carbon footprints in production. Conversely, suppliers that do not consider environmental protection can avoid these additional investments, and focus solely on manufacturing products.
Concerning the production of the three product series, the empirical results show that the four LCD monitor display module suppliers exhibited different advantages. For example, when producing Product Series A, Supplier 4 should be selected in a buyer-led non-cooperative environment, whereas Supplier 3 should be selected in a seller-led non-cooperative environment. However, in a cooperative environment where the buyer and seller jointly research and develop products, or a long-term partnership exists between the buyer and seller, Supplier 3 should be selected. Selecting Supplier 3 can enhance the efficacy and competitive advantage of the overall supply chain.
Generally, the fuzzy efficiency values in a cooperative model exceed those in a non-cooperative model. These results are identical to those reported by Liang et al. (2006) [14], where the cooperative model efficiency values either equal or exceed those of a non-cooperative model. However, the fuzzy efficiency values in the non-cooperative model that exceed those in the cooperative model may come from the differences in assessment standards or calculation models.
4. Sensitivity Analysis
This study used sensitivity analysis to understand the influences that changes in carbon footprints had on supplier efficiency to provide additional information for supplier selection.
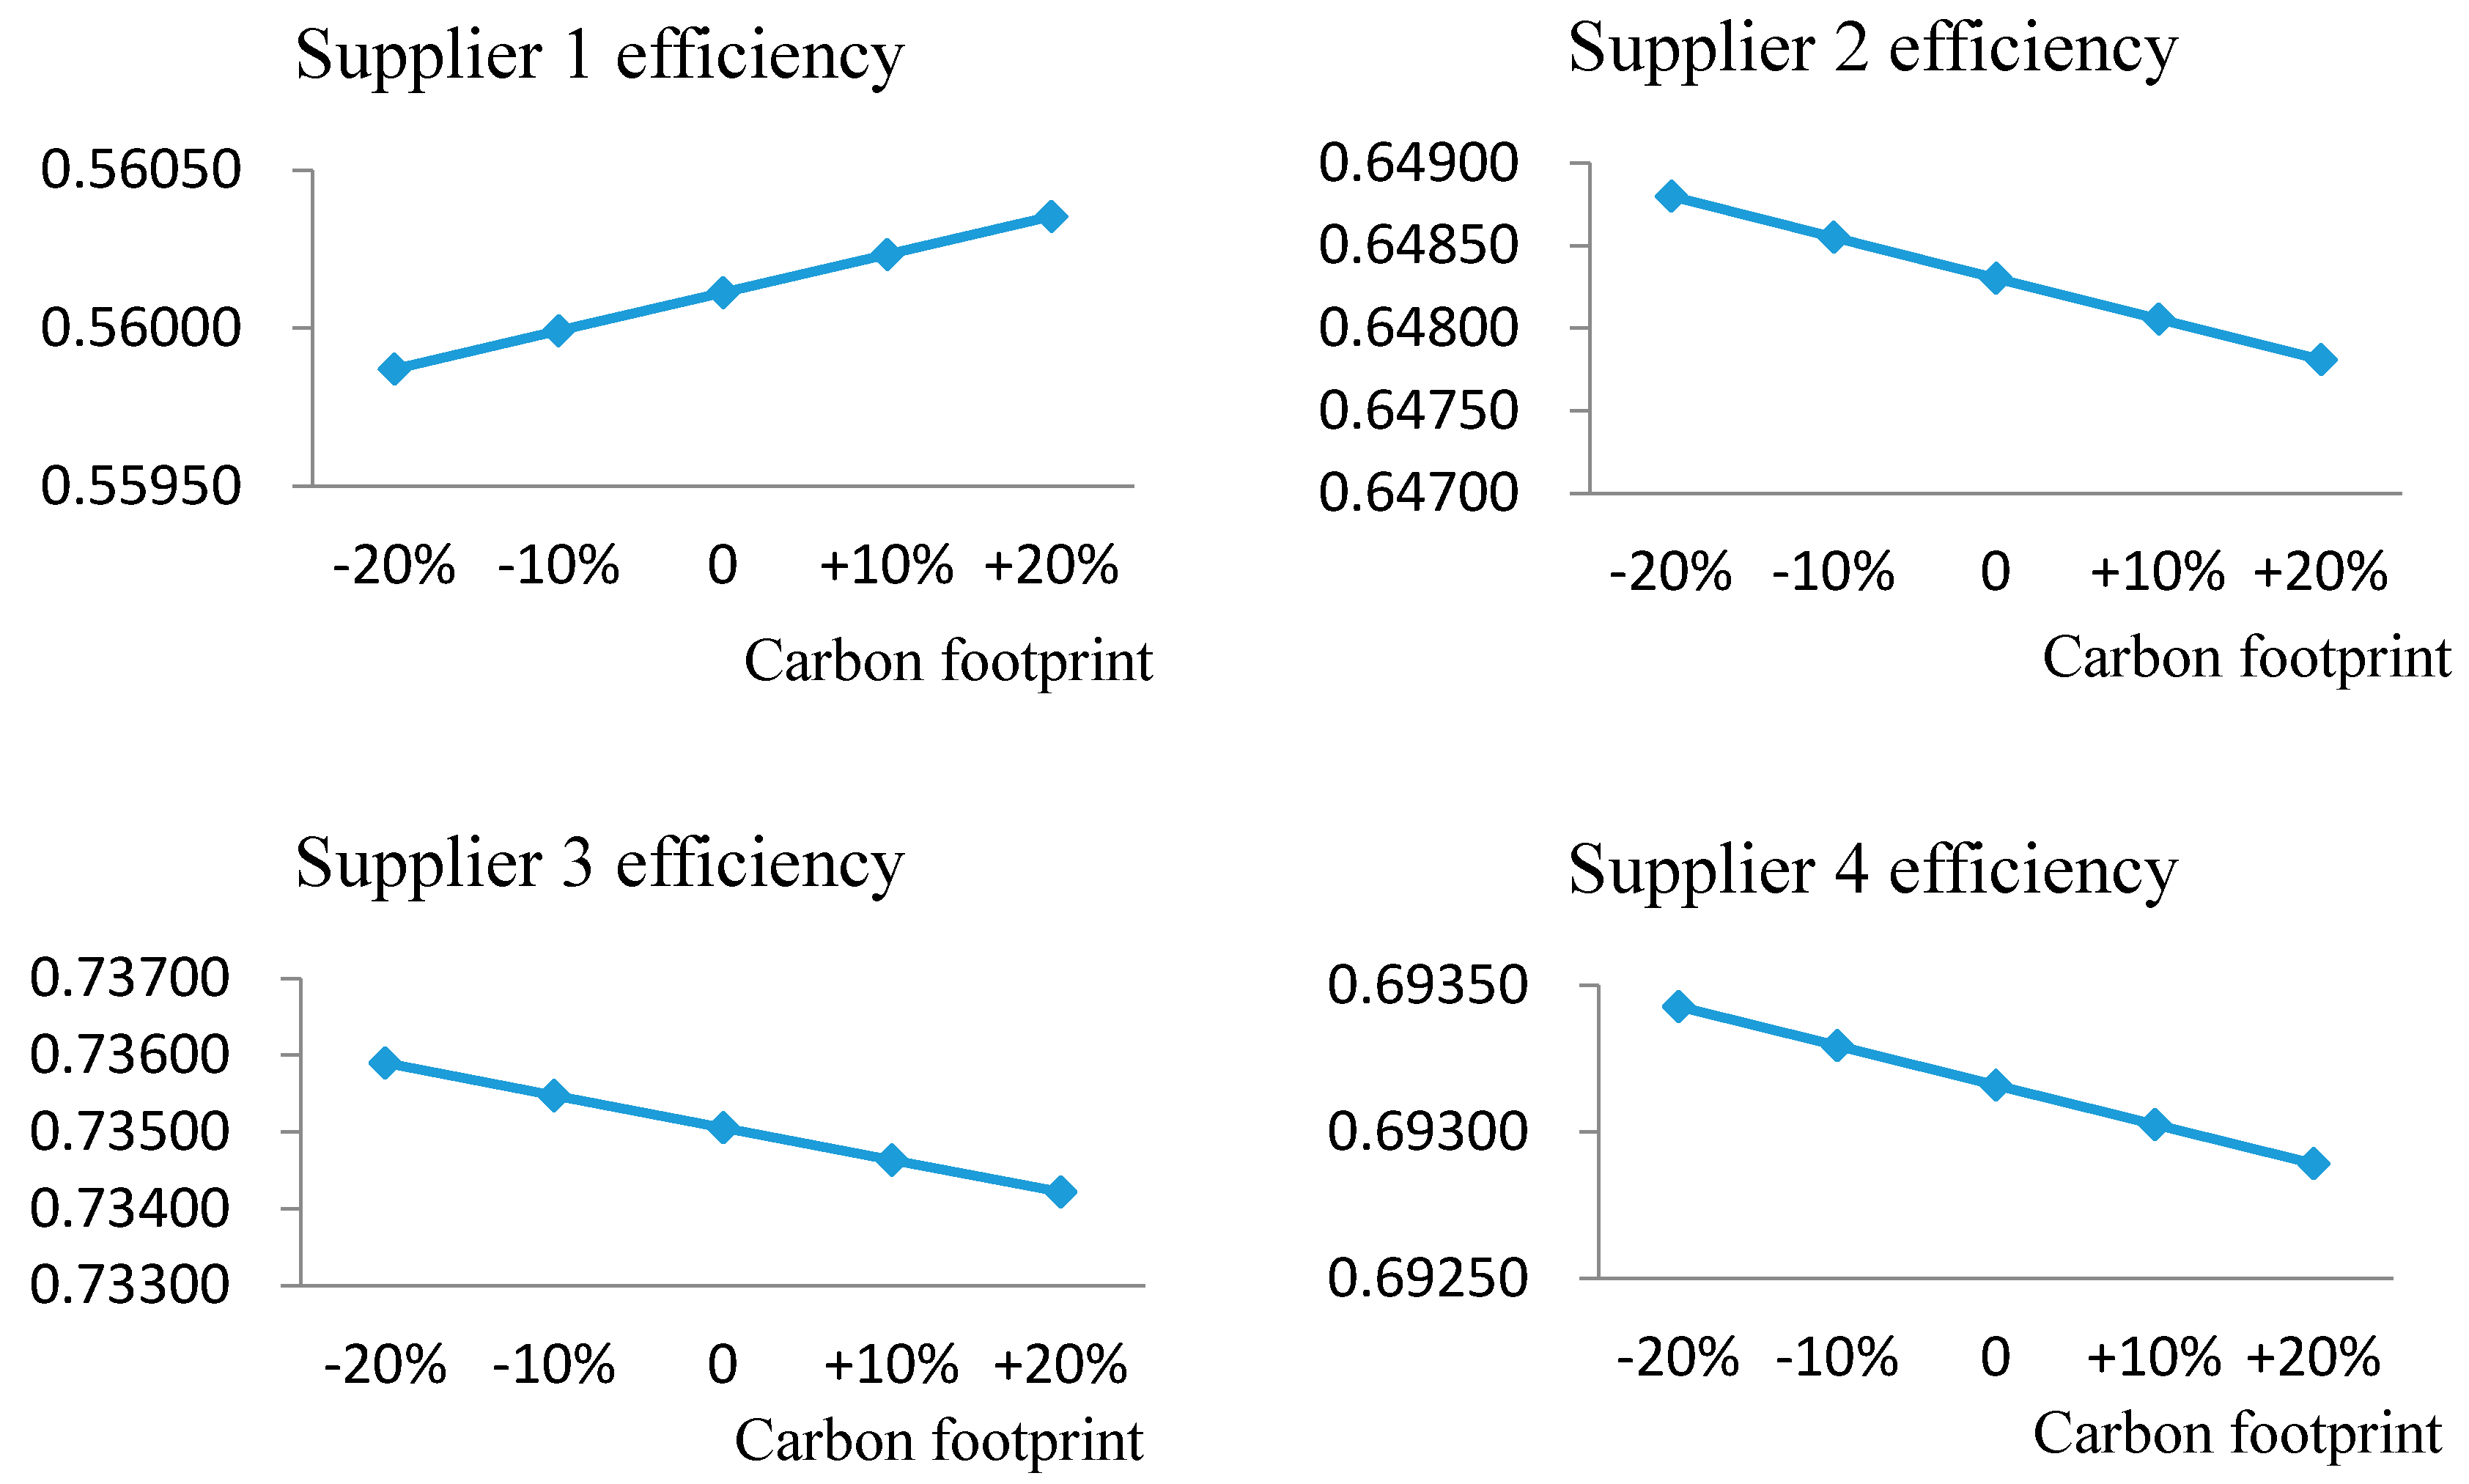
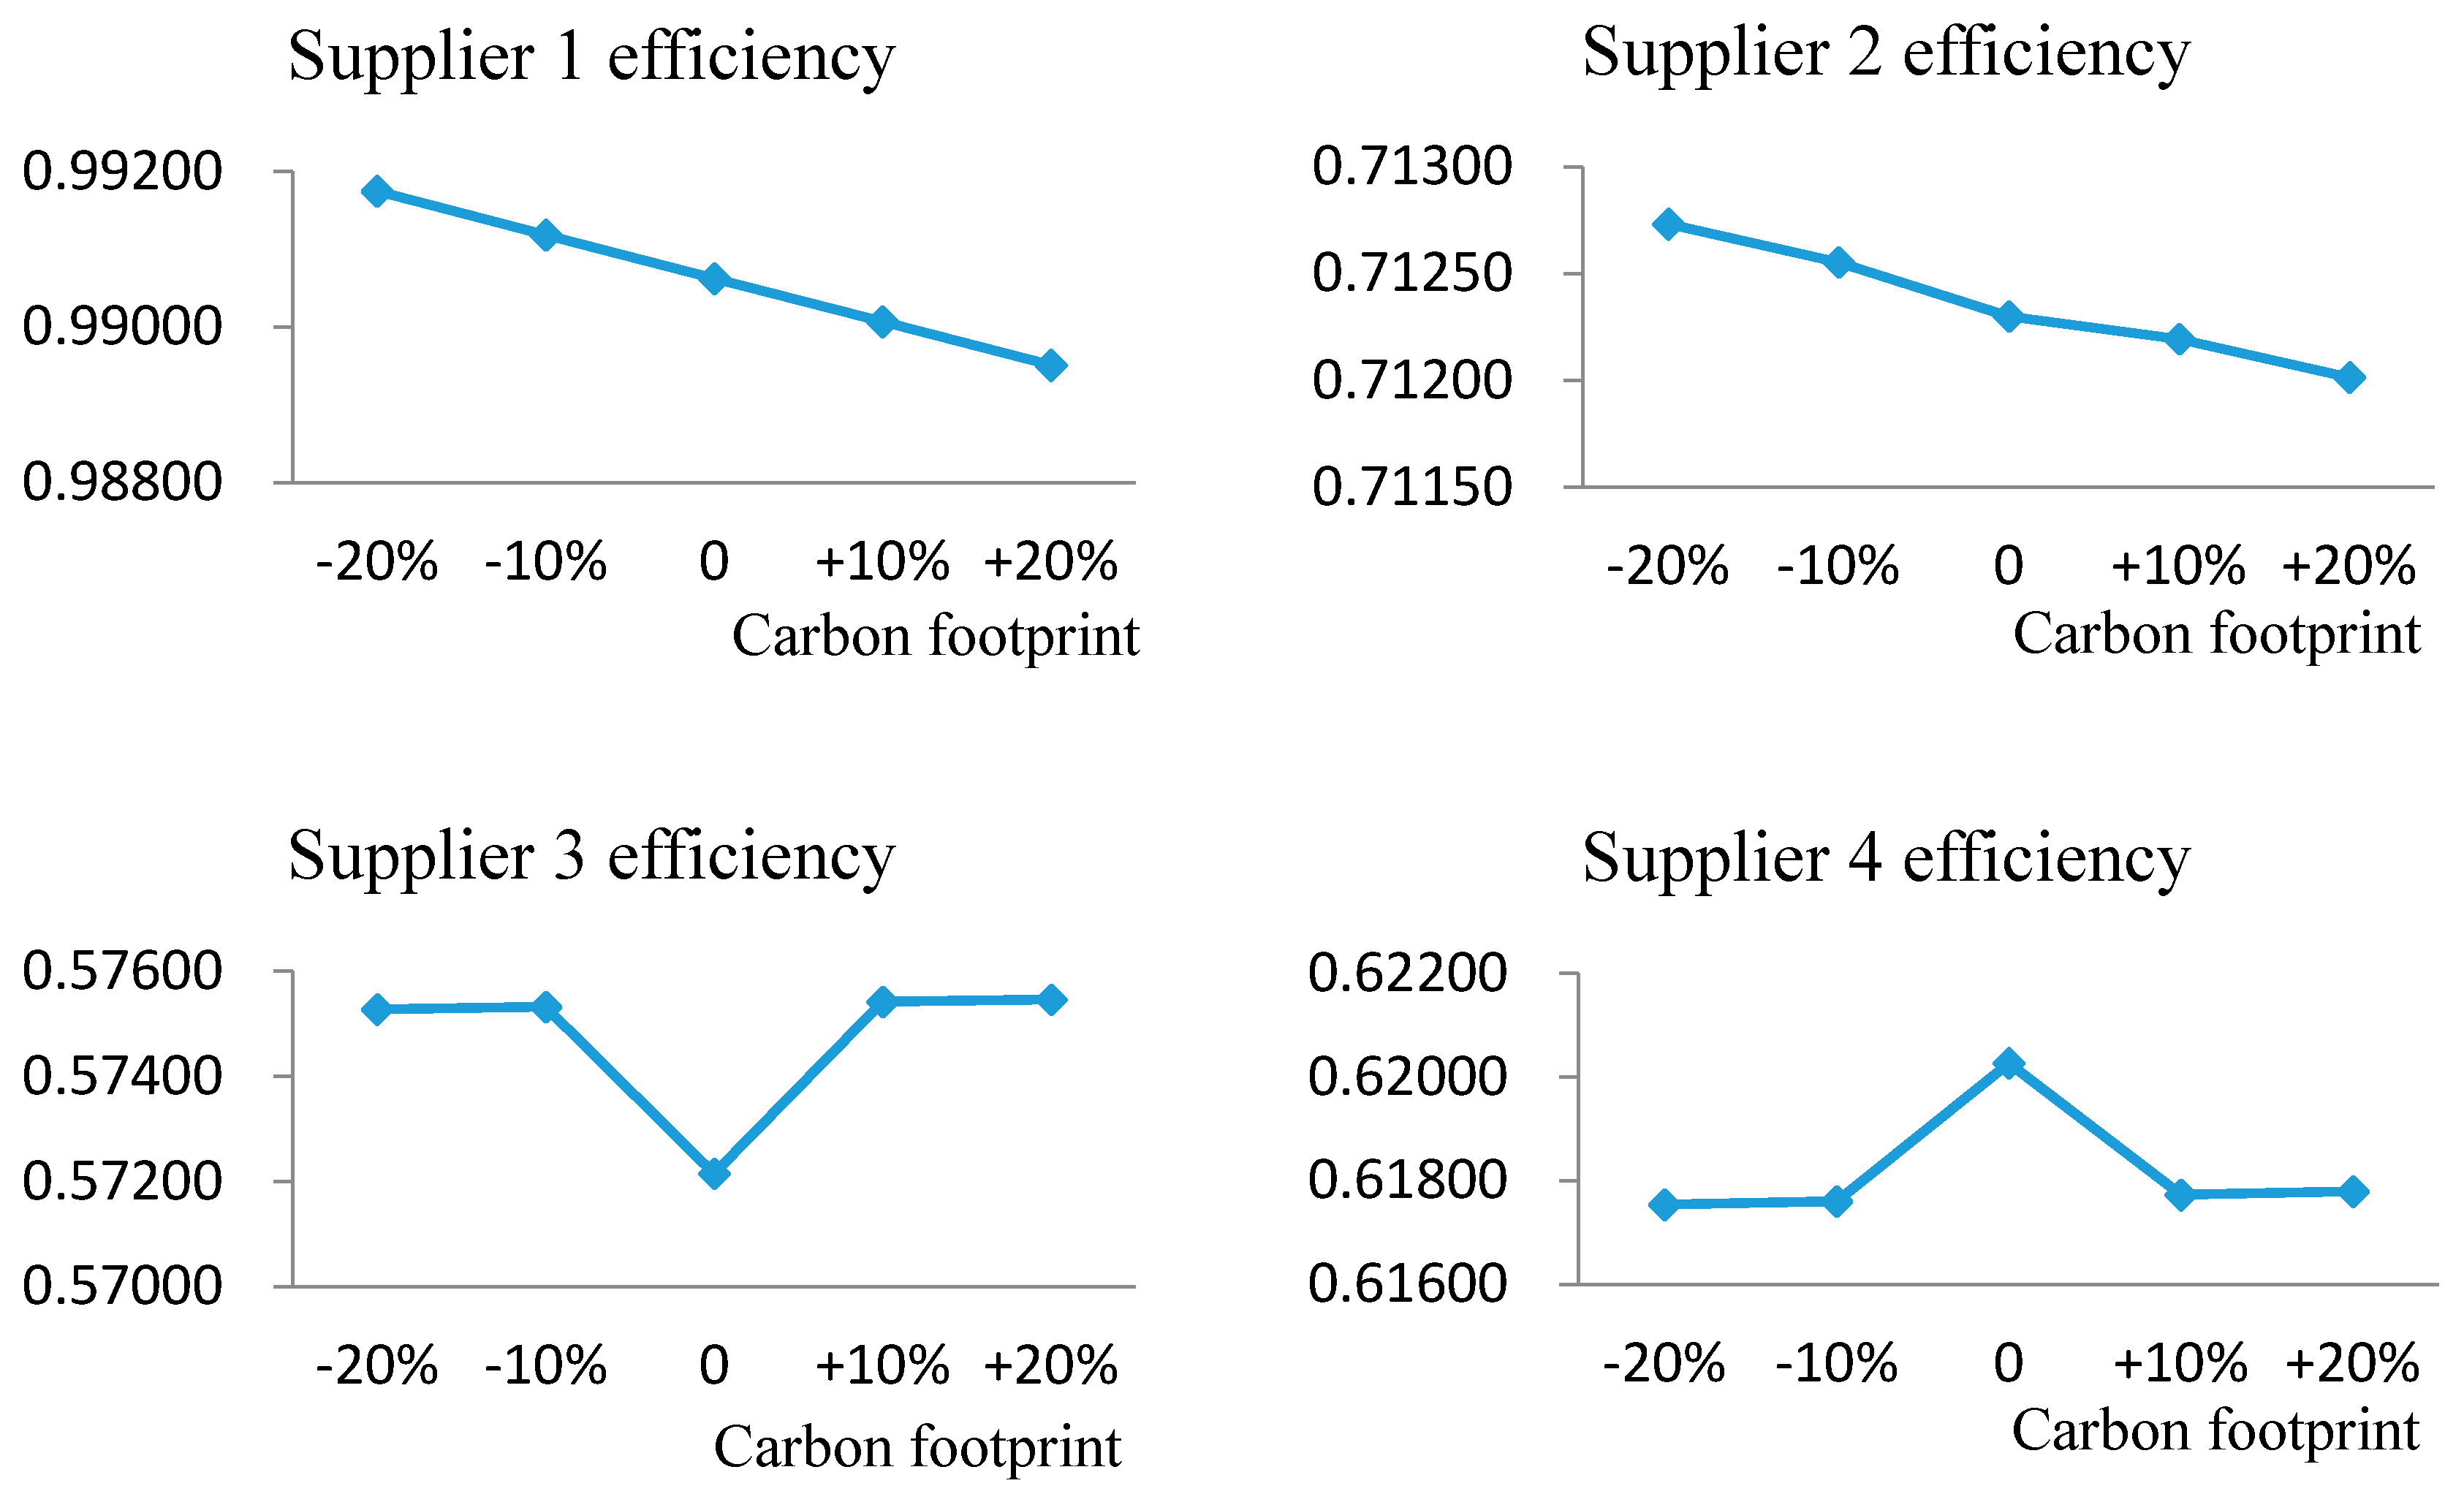
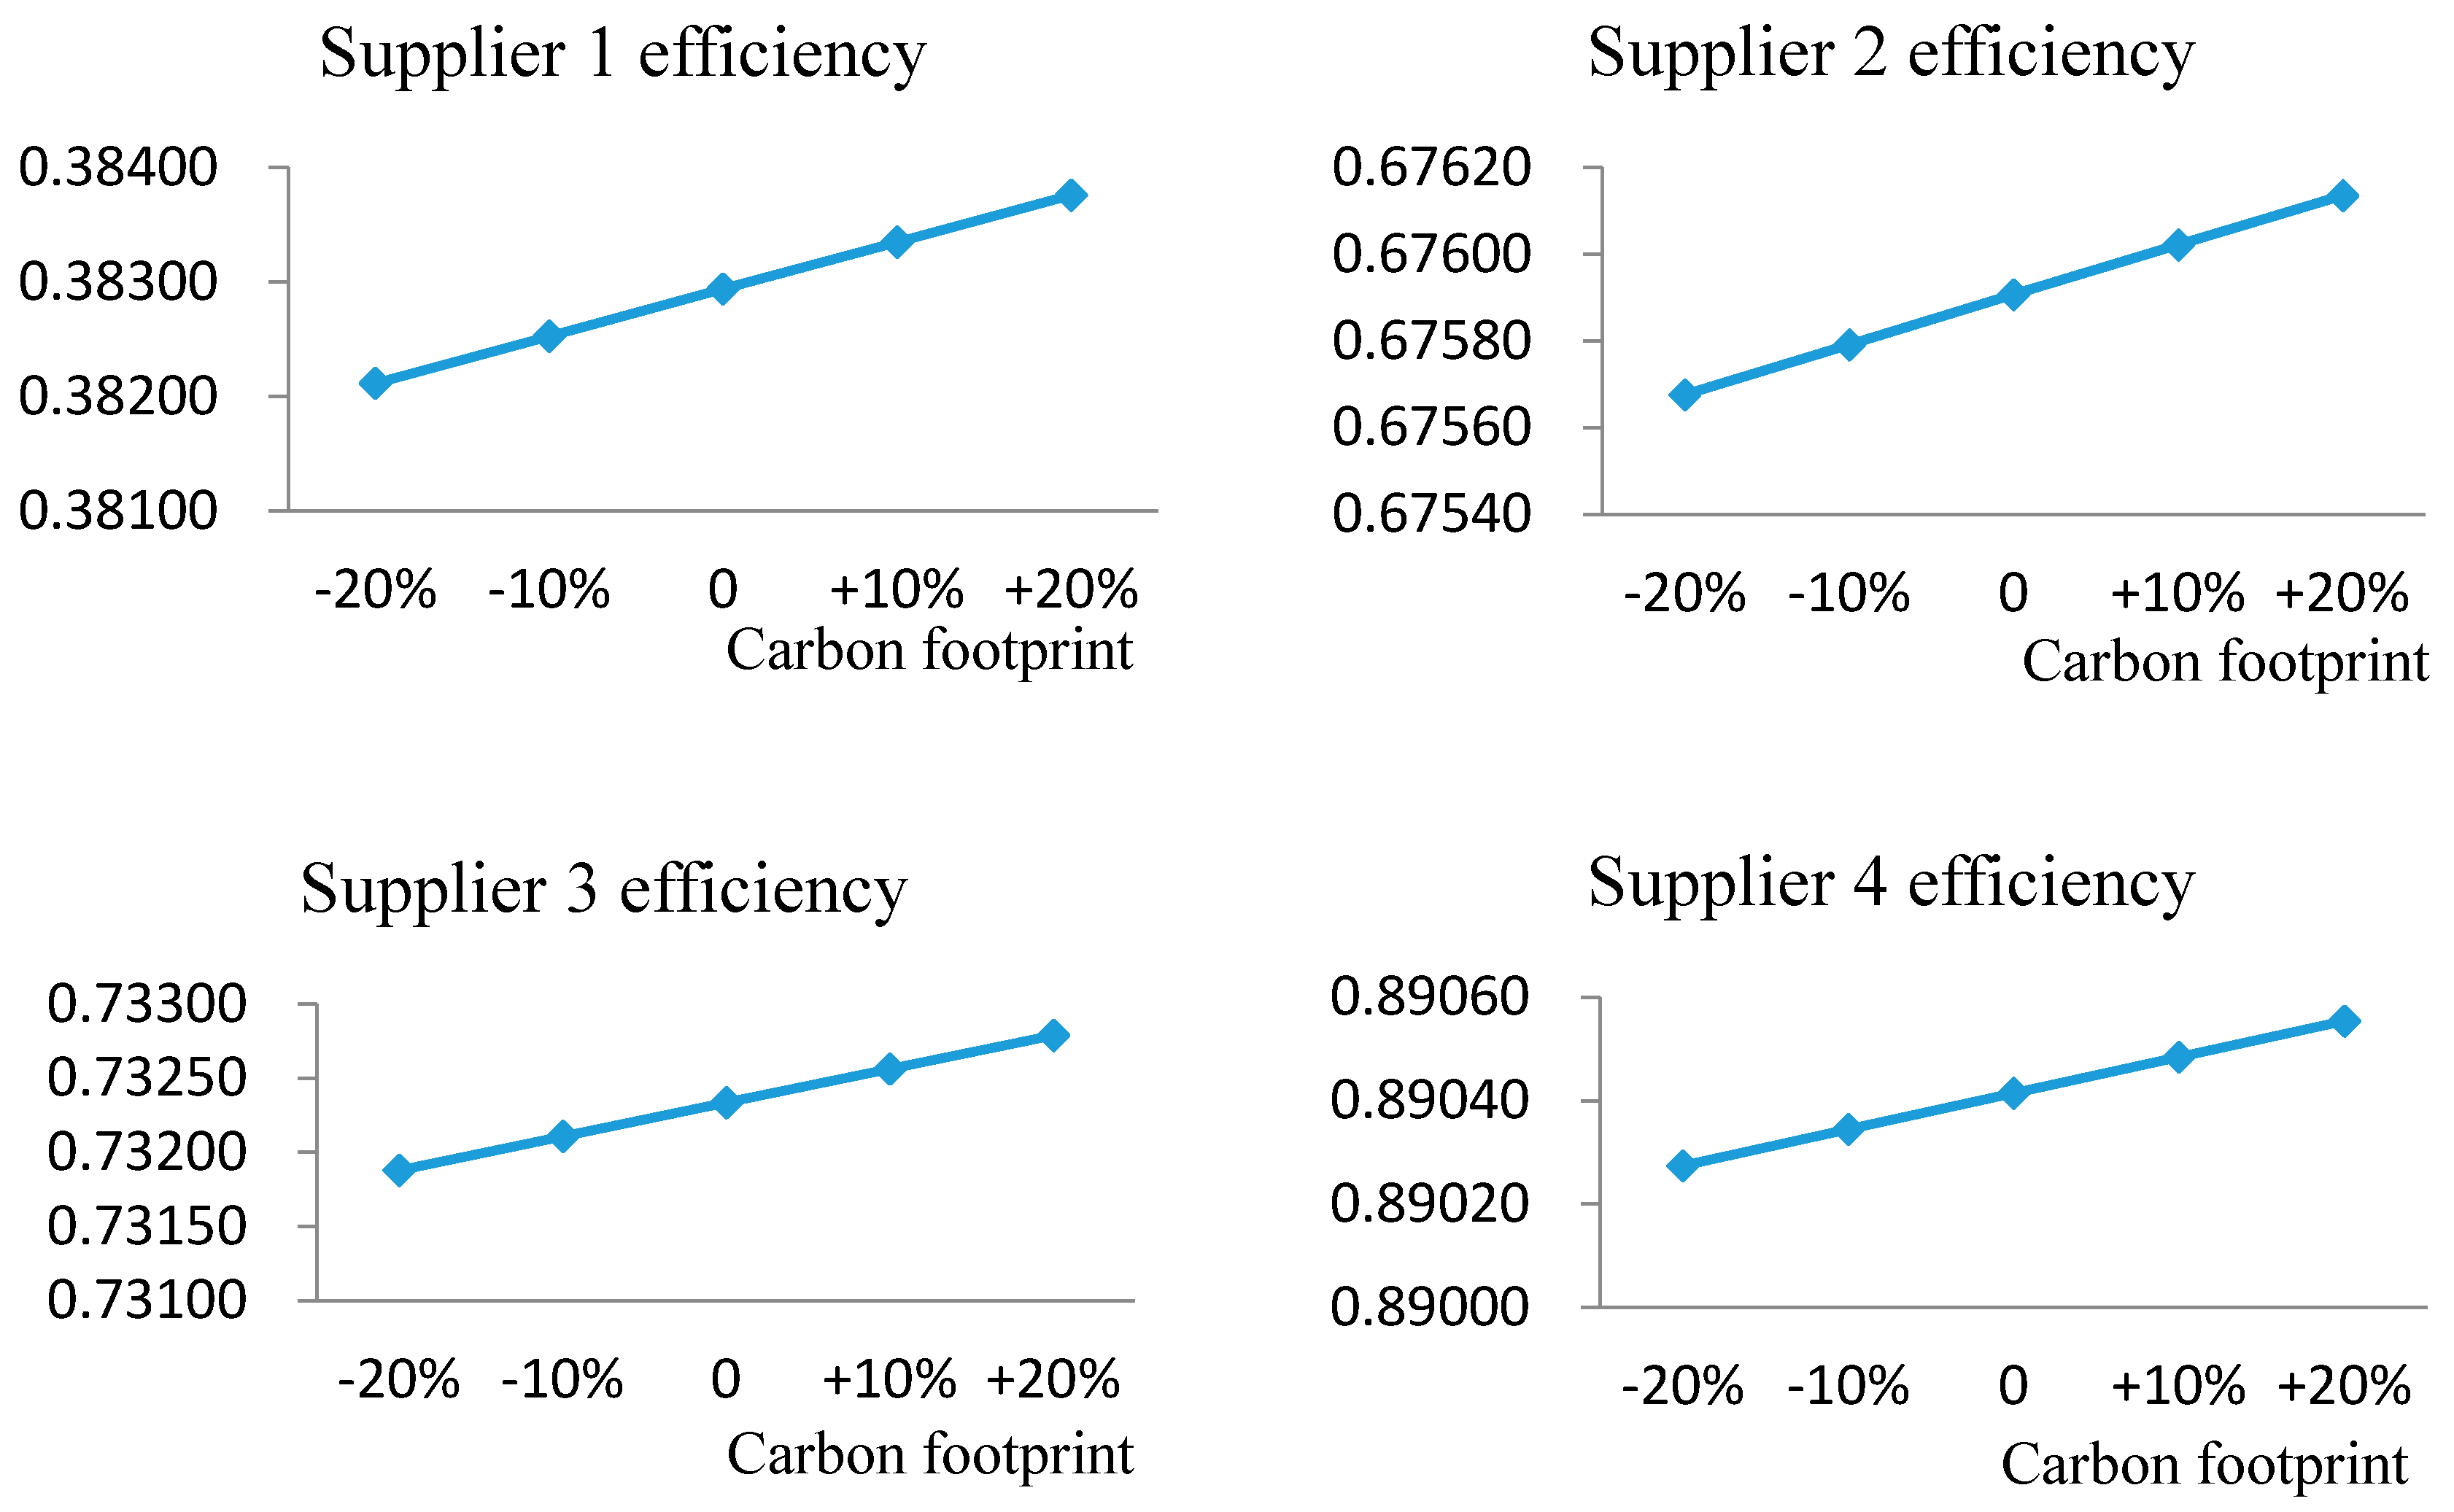
In a cooperative model, the carbon footprints of Product Series A were increased and decreased by 10% and 20%, respectively, to calculate supplier efficiency. Figure 2 shows that the efficiency of Suppliers 2, 3, and 4 declined as the carbon footprint increased. However, the efficiency of Supplier 1 increased. Concerning Product Series B, Figure 3 shows that the efficiency of Suppliers 1 and 2 declined as the carbon footprint increased. Additionally, the efficiency of Suppliers 3 and 4 fluctuated when the carbon footprint both increased and decreased. Regarding Product Series C, Figure 4 shows that the efficiency of all suppliers increased as the carbon footprint increased.
The sensitivity analysis results indicate that although changes in carbon footprint do not alter a suppliers’ ranking, supplier efficiency clearly changes. These changes are summarized into the following categories with the potential contributing factors.
For Product Series A, the supplier with the lowest carbon footprint exhibited increased efficiency as their carbon footprint increased. The reason for this may be that, to reduce carbon footprint emissions a supplier must invest additional resources, resulting in a decline in efficiency. Therefore, when the resources invested to reduce carbon footprint emissions decreased, the supplier’s efficiency increased. Concurrently, the relative efficiency of the other suppliers decreased.
Regarding Product Series B, irregular efficiency fluctuations were observed. This may be because DEA involves an objective efficiency measurement method, where the model determines and assigns a weight to the input and output items based on their importance. This may result in a greater change in weight, thereby causing irregular fluctuations in efficiency.
Concerning Product Series C, the efficiency of all suppliers increased as the carbon footprint increased. A possible reason for this is similar to Product Series A, in that a reduction in carbon footprint emissions necessitated suppliers to invest additional resources, resulting in a decline in efficiency. Therefore, when the resources invested to reduce carbon emissions decreased, supplier efficiency increased. The supplier with the lowest carbon footprint retained their competitive advantage and exhibited the optimum efficiency.
5. Conclusions
In an era of green supply chains, selecting a suitable supplier to achieve sustainable green management is crucial. Therefore, environmental protection-related assessment criteria must be considered. This study used the supply chain carbon footprint as the major criterion for supplier selection, and developed a mathematical programming model based on this concept. A fuzzy ranking method was introduced to rank the fuzzy indices and identify the most suitable green supply chain supplier.
This study modified the DEA model introduced by Liang et al [14]. that considers the supply chains of both buyers and sellers to create a FDEA model for supplier selection. Triangular fuzzy numbers were used to indicate carbon footprints, which resolved the issue of uncertainty when quantifying carbon footprints. Concurrently, buyer and seller performances were considered. Seller outputs were adopted as the buyer inputs to calculate the fuzzy efficiencies in cooperative and non-cooperative models to ensure that they closely reflected the buyer-seller relationships in actual supply chains.
Since previous studies have seldom considered using carbon footprints with other assessment criteria to select suppliers, and current supply chains consider the effects that carbon footprints have on the environment, this study examined the use of carbon footprints with other major assessment criteria. Only when these assessments are used in combination can the successful operation of green supply chains be realized.
The numeric example utilized a real world 3C company to demonstrate the implementation of the proposed model. Though restricted by lacking actual data, the input and output criteria are estimated by using market value obtained from online searches. The empirical test results and the practical findings that the cooperative concept is superior to the non-cooperative concept are similar to those reported by Liang et al. [14] and the majority of academic studies. This confirms that the cooperative model can improve the operational performance of supply chains.
The sensitivity analysis results highlight the influence that carbon footprints have on supplier efficiency as an input item and provide additional data for decision-makers. The efficiency results show that, although reducing carbon footprint emissions can lower the negative effects on the environment, organizations must invest additional resources to improve the production process and enhance the use of raw materials. Therefore, when selecting suppliers, organizations must carefully consider the balance between efficiency and environmental protection.
Author Contributions
Min-Chun Yu conceived the research idea and designed the mathematic model; Min-Hong Su collected the research data, and performed the implementation of the model.
Conflicts of Interest
The authors declare no conflict of interest.
References
- Lee, Y.J.; Peng, L.P. Taiwan’s Ecological Footprint (1994–2011). Sustainability 2014, 6, 6170–6187. [Google Scholar] [CrossRef]
- Wiedmann, T.; Barrett, J. A review of the ecological footprint indicator—Perceptions and methods. Sustainability 2010, 2, 1645–1693. [Google Scholar] [CrossRef]
- Carbon Trust. Carbon Footprinting; Carbon Trust: London, UK, 2012. [Google Scholar]
- Reilly, J.; Prinn, R.; Harnisch, J.; Fitzmaurice, J.; Jacoby, H.; Kicklighter, D.; Melillo, J.; Stone, P.; Sokolov, A.; Wang, C. Multi-gas assessment of the Kyoto Protocol. Nature 1999, 401, 549–555. [Google Scholar] [CrossRef]
- Huang, Y.A.; Weber, C.L.; Matthews, H.S. Categorization of Scope 3 Emissions for Streamlined Enterprise Carbon Footprinting. Environ. Sci. Technol. 2009, 43, 8509–8515. [Google Scholar] [CrossRef] [PubMed]
- Shaw, K.; Shankar, R.; Yadav, S.S.; Thakur, L.S. Supplier selection using fuzzy AHP and fuzzy multi-objective linear programming for developing low carbon supply chain. Expert Syst. Appl. 2012, 39, 8182–8192. [Google Scholar] [CrossRef]
- Genovese, A.; Lenny Koh, S.C.; Kumar, N.; Tripathi, P.K. Exploring the challenges in implementing supplier environmental performance measurement models: A case study. Prod. Plan. Control 2014, 25, 1198–1211. [Google Scholar] [CrossRef]
- Noci, G. Designing ‘green’ vendor rating systems for the assessment of a supplier’s environmental performance. Eur. J. Purch. Supply Manag. 1997, 3, 103–114. [Google Scholar] [CrossRef]
- Humphreys, P.; McIvor, R.; Chan, F. Using case-based reasoning to evaluate supplier environmental management performance. Expert Syst. Appl. 2003, 25, 141–153. [Google Scholar] [CrossRef]
- Lee, A.H.I.; Kang, H.Y.; Hsu, C.F.; Hung, H.C. A green supplier selection model for high-tech industry. Expert Syst. Appl. 2009, 36, 7917–7927. [Google Scholar] [CrossRef]
- Büyüközkan, G.; Çifçi, G. Evaluation of the green supply chain management practices: A fuzzy ANP approach. Prod. Plan. Control 2012, 23, 405–418. [Google Scholar] [CrossRef]
- Dey, P.K.; Cheffi, W. Green supply chain performance measurement using the analytic hierarchy process: A comparative analysis of manufacturing organisations. Prod. Plan. Control 2013, 24, 702–720. [Google Scholar] [CrossRef]
- Amindoust, A.; Ahmed, S.; Saghafinia, A.; Bahreininejad, A. Sustainable supplier selection: A ranking model based on fuzzy inference system. Appl. Soft Comput. 2012, 12, 1668–1677. [Google Scholar] [CrossRef]
- Liang, L.; Yang, F.; Cook, W.D.; Zhu, J. DEA models for supply chain efficiency evaluation. Ann. Oper. Res. 2006, 145, 35–49. [Google Scholar] [CrossRef]
- Kao, C.; Liu, S.T. Fuzzy efficiency measures in data envelopment analysis. Fuzzy Sets Syst. 2000, 113, 427–437. [Google Scholar] [CrossRef]
- Kuo, R.J.; Wang, Y.C.; Tien, F.C. Integration of artificial neural network and MADA methods for green supplier selection. J. Clean. Prod. 2010, 18, 1161–1170. [Google Scholar] [CrossRef]
- Chen, C.B.; Klein, C.M. A simple approach to ranking a group of aggregated fuzzy utilities. IEEE Trans. Syst. Man Cybern. Part B 1997, 27, 26–35. [Google Scholar] [CrossRef] [PubMed]
Figure 1.
The input-output process for the buyer-seller supply chain.

Figure 2.
Changes in supplier efficiency for Product Series A.

Figure 3.
Changes in supplier efficiency for Product Series B.

Figure 4.
Changes in supplier efficiency for Product Series C.


Table 1.
The inputs and outputs related to the production of Product Series A.
| Seller Input | Seller Output | Buyer Input | Buyer Output | |||||||
|---|---|---|---|---|---|---|---|---|---|---|
| Production Cost (USD) | Carbon Footprint (kg CO2e) | Yield (%) | Lead time (Weeks) | Carbon Footprint (kg CO2e) | Production Quantity | |||||
| 1 | 63 | 221 | 346 | 450 | 86 | 4.2 | 35 | 42 | 58 | 8000 |
| 2 | 57 | 286 | 413 | 631 | 78 | 3.8 | 38 | 49 | 66 | 8000 |
| 3 | 61 | 243 | 405 | 663 | 92 | 3.9 | 41 | 53 | 63 | 8000 |
| 4 | 59 | 224 | 394 | 515 | 82 | 3.6 | 43 | 62 | 75 | 8000 |
Table 2.
The inputs and outputs related to the production of Product Series B.
| Seller Input | Seller Output | Buyer Input | Buyer Output | |||||||
|---|---|---|---|---|---|---|---|---|---|---|
| Production Cost | Carbon Footprint (kg CO2e) | Yield (%) | Lead Time (Weeks) | Carbon Footprint (kg CO2e) | Production Quantity | |||||
| 1 | 33 | 289 | 356 | 443 | 82 | 3.5 | 43 | 56 | 65 | 12000 |
| 2 | 37 | 246 | 385 | 452 | 92 | 4.0 | 28 | 47 | 52 | 12000 |
| 3 | 40 | 197 | 286 | 394 | 85 | 3.8 | 35 | 53 | 61 | 12000 |
| 4 | 44 | 158 | 217 | 338 | 90 | 3.6 | 38 | 41 | 56 | 12000 |
Table 3.
The inputs and outputs related to the production of Product Series C.
| Seller Input | Seller Output | Buyer Input | Buyer Output | |||||||
|---|---|---|---|---|---|---|---|---|---|---|
| Production Cost | Carbon Footprint (kg CO2e) | Yield (%) | Lead Time (Weeks) | Carbon Footprint (kg CO2e) | Production Quantity | |||||
| 1 | 42 | 257 | 339 | 398 | 93 | 3.0 | 31 | 39 | 48 | 15000 |
| 2 | 39 | 224 | 288 | 335 | 88 | 2.9 | 34 | 45 | 51 | 15000 |
| 3 | 39 | 172 | 225 | 296 | 85 | 2.8 | 27 | 32 | 46 | 15000 |
| 4 | 41 | 183 | 215 | 288 | 91 | 2.8 | 24 | 30 | 41 | 15000 |
Table 4.
Fuzzy efficiency values for Product Series A.
| Supplier | Seller-Led Scenario | Rank | Buyer-Led Scenario | Rank | Cooperative Scenario | Rank |
|---|---|---|---|---|---|---|
| 1 | 0.5550351 | 4 | 0.6891192 | 4 | 0.5550350 | 4 |
| 2 | 0.6387158 | 3 | 0.7687421 | 2 | 0.6491178 | 3 |
| 3 | 0.7327959 | 1 | 0.7120873 | 3 | 0.7350671 | 1 |
| 4 | 0.6924375 | 2 | 0.8038066 | 1 | 0.6936324 | 2 |
Table 5.
Fuzzy efficiency values for Product Series B.
| Supplier | Seller-Led Scenario | Rank | Buyer-Led Scenario | Rank | Cooperative Scenario | Rank |
|---|---|---|---|---|---|---|
| 1 | 0.9892085 | 1 | 0.9906240 | 1 | 0.9906263 | 1 |
| 2 | 0.7105178 | 2 | 0.7105180 | 2 | 0.7122995 | 2 |
| 3 | 0.5727183 | 4 | 0.5728886 | 4 | 0.5734343 | 4 |
| 4 | 0.6202664 | 3 | 0.6202666 | 3 | 0.6202666 | 3 |
Table 6.
Fuzzy efficiency values for Product Series C.
| Supplier | Seller-Led Scenario | Rank | Buyer-Led Scenario | Rank | Cooperative Scenario | Rank |
|---|---|---|---|---|---|---|
| 1 | 0.3735674 | 4 | 0.3735674 | 4 | 0.3829401 | 4 |
| 2 | 0.6655603 | 3 | 0.6655603 | 3 | 0.6759069 | 3 |
| 3 | 0.7281456 | 2 | 0.7281456 | 2 | 0.7323346 | 2 |
| 4 | 0.8904159 | 1 | 0.8904159 | 1 | 0.8904148 | 1 |
© 2017 by the authors. Licensee MDPI, Basel, Switzerland. This article is an open access article distributed under the terms and conditions of the Creative Commons Attribution (CC BY) license (http://creativecommons.org/licenses/by/4.0/).
Share and Cite
MDPI and ACS Style
Yu, M.-C.; Su, M.-H. Using Fuzzy DEA for Green Suppliers Selection Considering Carbon Footprints. Sustainability 2017, 9, 495. https://doi.org/10.3390/su9040495
AMA Style
Yu M-C, Su M-H. Using Fuzzy DEA for Green Suppliers Selection Considering Carbon Footprints. Sustainability. 2017; 9(4):495. https://doi.org/10.3390/su9040495
Chicago/Turabian StyleYu, Min-Chun, and Min-Hong Su. 2017. "Using Fuzzy DEA for Green Suppliers Selection Considering Carbon Footprints" Sustainability 9, no. 4: 495. https://doi.org/10.3390/su9040495
Note that from the first issue of 2016, this journal uses article numbers instead of page numbers. See further details here.