
Rural Solid Waste Management in China: Status, Problems and Challenges
by
Aiqin Wang
1,2,3, 
Linxiu Zhang
4,
Yaojiang Shi
2,*,
Scott Rozelle
5,
Annie Osborn
5 and
Meredith Yang
5 1
School of Economic and Management, Northwest University, Xi’an 710127, China
2
Center for Experimental Economics in Education, Shaanxi Normal University, Xi’an 710119, China
3
School of Economics and Finance, Xi’an Jiaotong University, Xi’an 710061, China
4
Center for Chinese Agricultural Policy, Institute of Geographic Sciences and Natural Resources Research, Chinese Academy of Sciences, Beijing 100101, China
5
Freeman Spogli Institute of International Studies, Stanford University, Stanford, CA 94305-6455, USA
*
Author to whom correspondence should be addressed.
Sustainability 2017, 9(4), 506; https://doi.org/10.3390/su9040506
Submission received: 12 February 2017
/
Revised: 13 March 2017
/
Accepted: 23 March 2017
/
Published: 29 March 2017
(This article belongs to the Special Issue Resilient Economics and the Regional Sustainable Economic Growth)
Abstract
:This paper seeks to describe the overall state of Rural Solid Waste Management (RSWM) in China in three main areas: waste collection services, waste transportation services and waste disposal services. Given China’s urbanization, industrialization, and the subsequent improvement of household living standards, the amount of solid waste generated in rural China has increased rapidly. Based on primary data collected in 2016 from 100 villages across five provinces in China, we find that the proportion of villages with waste collection, waste transportation, and waste disposal services in 2015 is 80%, 55% and 22%, respectively. The differences in shares of villages with these services across provinces are statistically significant. Using descriptive and econometric analyses, the authors show that richer villages are more likely to provide rural solid waste (RSW) collection and transportation services. Villages with new (newly elected or appointed) village leaders are more likely to supply RSW disposal services. While the majority of villages report that they offer waste collection services (installing waste collection facilities and employing waste collection workers), the vast majority of villages do not transport their waste to treatment plants. Even fewer villages report using centralized disposal methods to dispose of waste, as required by law or regulation. This study represents the first effort to describe the state and determinants of waste management services in rural China in the wake of increased investment in and new policies regarding RSWM released in 2015. Additionally, we provide evidence-based suggestions that might be useful for policy makers interested in improving RSWM in China. These suggestions include increasing investments in waste collection facilities and worker services; encouraging local residents to classify and recycle waste; designing optimal waste transportation networks and routes; and improving on-site waste disposal technology.
1. Introduction
An increasingly serious consequence of China’s rapid industrialization is the generation of solid waste. As household living standards in rural China have improved, rural solid waste (RSW) generation has increased rapidly [1]. In 2010, the total annual quantity of waste from rural areas in China reached about 234 million kg per year, exceeding the quantities of urban RSW (157 million kg/year) for the first time [2]. The annual growth rate of RSW is estimated to be about 8–10% in rural China [3]. Daily per capita quantities of RSW in rural China (1.07 kg) are now comparable to per capita solid waste produced in some developed countries (e.g., Japan: 1.08 kg; Czech Republic: 0.72 kg; Romania: 0.9 kg; Bulgaria: 1.2 kg) [4,5,6,7,8]. However, even in urban regions, China lacks advanced waste management facilities, waste management firms, and other institutions—effective, high-quality management systems like those in other developed countries [9,10,11]. This lag has recently garnered some public attention and government support [12,13,14,15,16,17,18,19,20,21,22,23].
While RSW generation grew considerably during the 2000s, RSW management (RSWM)—a term used to describe the collection, transport, and proper disposal and treatment of RSW—was neither standardized nor systematic [24,25]. Several pilot programs using the model of “village collection, township transfer, and county treatment” did show initial success [26]; however, in poorer, less developed rural areas, many villages struggled to implement any system of effective waste management services in China. There were a number of reasons that villages had trouble implementing such systems. One was insufficient RSW facilities, including dumpsters, waste pits, and waste storage buildings. Another was an absence of RSW workers, who collect RSW and are charged with keeping villages clean and waste-free. A third was an overall lack supervision by upper-level authorities. In addition, many villages report being unable to afford the transportation of waste to townships, which is the first step that RSW must undergo before being shipped to and treated at county-level facilities. As a result, after being collected, RSW is often discarded randomly, illegally burned, or dumped on riverbanks and roadsides [27,28]. A government survey found that only 5.2% of RSW was safely disposed of in 2006 [29]. The absence of RSWM has not only led to water, soil, and air pollution in rural and more populous downstream areas, it has also led to practices that pose serious health risks for local residents [30,31,32,33].
In acknowledging this problem, the government has since issued a series of laws and regulations to standardize RSWM and has also increased investment into RSWM [15,16,17,18,19,20,21,22,23]. Among a number of new initiatives, these regulations included the revised “Law on the Prevention and Control of Environmental Pollution by Solid Waste” in 2005 [15]. This law brought RSWM under the directive of public management for the first time. From 2006–2013, the government developed and implemented various policies meant to help enforce RSWM laws and more effectively undertake RSWM [15,16,17,18,19,20,26]. When it became clear that there were still problems with RSWM, in 2015, ten different departments in China’s national government issued the first “Guidance on RSWM” (the ten department include the MHURD [Ministry of Housing and Urban-Rural Development), the CRWLG [Central Rural Work Leading Group), the CGCBSC [Central Guidance Commission for Building Spiritual Civilization), the NDRC [National Development and Reform Commission), the MOEP [Ministry of Environmental Protection), the MOF [Ministry of Finance), the MOA [Ministry of Agriculture), the MOFCOM [Ministry of Commerce), the PHCCO [Patriotic Health Campaign Committee Office), and the ACWF [All-China Women’s Federation]). In this document, the technical specifications were created for the construction of a series of RSW institutions (building RSW collection facilities and transportation stations) [21]. Another document, the “Evaluation standards for the inspection of RSWM”, was also subsequently released in order to introduce greater accountability of policy implementation [22].
Importantly, the new set of standards and policy statements were also accompanied by new commitments of government investment funds [19,23]. For example, from 2008 to 2015, the setup of the Rural Environmental Protection Special Fund saw the investment of 5.95 billion dollars towards building waste management systems and improving the quality of rural environments [34]. While investment in waste management has certainly risen in China, this may not be unequivocally positive: some developed countries, for instance Portugal, have seen that overinvestment in waste management without economic regulation can decrease overall efficiency in management systems [35]. China currently has little economic regulation of its RSWM programs. Unfortunately, limited research has been done to comprehensively examine the state of RSWM in China after these recent efforts by policymakers [15,16,17,18,19,20,21,22,23].
Even before the most recent wave of policy and investment attention, there had not been much research done. Of the few studies conducted on this topic, several indicated that RSWM services in rural China are currently insufficient [36,37]. Some studies have documented that current RSWM methods are actually harmful to the environment [36,37]: for example, one paper reported on the findings of a survey conducted in 22 villages in southwestern regions in China and found that about 45% of RSW was burned or illegally dumped on river banks or in open dumpsites [36]. Another study conducted in five Tibetan villages concluded that complete RSWM services (including all the necessary components like collection, transportation and treatment services) were rare [37]. The study found that 71% of RSW was incinerated illegally each year. While of interest, these studies rely on small samples, limiting results to a small geographic area, and were all based on data collected before 2015.
In fact, there have been only a few studies that describe the state and determinants of RSWM on a national scale. The most recent study we could find was conducted in 2011 using a sample of 101 villages in five provinces. In this study, Wang et al. found that only 50% of villages had waste collection services, 45% of villages had waste transportation services and only 10% of villages used a centralized disposal service to dispose of their waste [38]. The study also showed that there was an uneven distribution of RSWM services across China that economic factors were the main determinants of waste collection and transportation services. Meanwhile, a village’s distance from the township government determined whether it supplied waste disposal services. Coastal provinces had better RSWM services than western regions, with central regions performing the worst. According to Wang et al., the unequal implementation of RSWM across China is associated with an unequal distribution of resources across regions [38].
The overall goal of this paper is to examine the current state of RSWM in rural China across three critical stages: RSW collection, RSW transportation, and RSW treatment and determinants. To meet this overall goal, we have two specific objectives: first, we conduct both a descriptive and multivariable analysis of the current state of RSW collection services (including RSW collection facilities and RSW collection workers), waste transportation, and waste treatment services. Second, we discuss our results and provide policy suggestions based on our empirical findings. We believe that by using a large, nationally-representative sample spanning five provinces—100 villages from 50 townships in 25 counties located in five provinces—our study represents the most recent and one of the most comprehensive analyses of the state of RSWM services in rural China today. Our data was collected in 2016 and asked about 2015 practices (see methods section for more discussion). Though the situation has greatly improved over the past decade, the government still needs to design and implement more appropriate policies to make RSWM more efficacious; encourage local residents to classify and recycle waste; reduce the generation of solid waste; increase the resource utility of solid waste; and, finally, benefit the sustainable development of rural regions in China.
2. Approach and Methods
2.1. Case Studies
The data used in this paper are from a nearly nationally representative survey in rural China conducted by the Center for Chinese Agricultural Policy in 2016 (data for 2015). We surveyed 100 villages from 50 townships in 25 counties located in five provinces (in total, 101 villages were randomly selected from 50 townships in 25 counties located in five provinces in 2012; our final sample included 100 villages, as two of the original villages in Jiangsu had merged before 2015). We designed the stratified random sampling procedure and final survey instrument with the village as the unit of analysis. The fieldwork team, made up of five teachers and one hundred graduate students and research fellows, chose the sample and implemented the survey in five provinces and 25 counties in a nationally-representative sample.
To select sample villages, survey teams implemented a uniform process in each of the sample provinces. First, five provinces were randomly selected to represent China’s five major agro-ecological zones: Jiangsu represents the eastern coastal areas (Jiangsu, Shandong, Shanghai, Zhejiang, Fujian, and Guangdong); Sichuan represents the southwestern provinces (Sichuan, Guizhou, and Yunnan) plus Guangxi; Shaanxi represents the provinces on the Loess Plateau (Shaanxi and Shanxi), Inner Mongolia, and the rest of the provinces in the northwest (Gansu, Ningxia, Qinghai, and Xinjiang); Hebei represents the north and central provinces (Hebei, Henan, Anhui, Hubei, Jiangxi, and Hunan); and Jilin represents the northeastern provinces (Jilin, Liaoning, and Heilongjiang). After these five provinces were selected, the second step of the sample selection involved choosing the counties, towns, and villages. Five counties were selected from each province, one from each quintile of per capita Gross Value of Industrial Output (GVIO) (Figure 1). GVIO was used because Rozelle shows that it is one of the best predictors of both standard of living and development potential, and is often more reliable than net rural per capita income [39]. Within each county, the survey team chose two townships, one township with a per capita GVIO above the county median and one township with a per capita GVIO below the county median. Finally, within each township, two villages were chosen with the same procedure used to select townships.
2.2. Data Collection
The survey collected information at the village level in April 2016. The questionnaire was completed by the village head who provided information on three critical stages of the RSWM process: waste collection, waste transportation, and waste disposal.
In order to determine the most recent state of waste collection services, we asked the village head to describe whether or not waste collection facilities and equipment (e.g., dumpsters, garbage pits or garbage storage buildings) had been built in their village (the question in the survey was, “Did your village have or construct waste collection facilities [i.e., dumpsters, garbage pits or garbage storage buildings) to collect and store RSW in 2015?”] and whether or not the village committee employed waste collection workers (“Did your village employ staff for the express purpose of regularly collecting trash in 2015?”). We use these two main outcome variables to indicate the extent to which waste collection takes place in each village. We also solicited detailed information about the costs associated with and human resources involved in executing waste collection services. The survey teams collected information on the presence of waste collection facilities and equipment in the village (the question in the survey was, “How many solid waste collection facilities are there in the village?”); the total costs expended in employing waste collection workers (“How much did the village committee spend on employing waste collection workers in 2015?”); and the main sources (village committee or upper-level government) of funding used to pay for waste collection workers (“What are the main channels of funding used to employ waste collection workers to collect waste?” Responses include village committee or upper level governments [township, county, or prefecture)].
The survey teams also asked whether each village had transported waste to a waste disposal facility (the question in the survey was, “Did your village transport waste to a treatment plant in 2015?”). The village leader was asked to estimate the distance between the village committee office and the nearest waste disposal facility (“What is the distance between the village committee office and the waste disposal factory?”), as well as the main sources (village committee or upper-level government) of funding used to pay for waste transportation services (“What are the sources of funds for transporting waste?” The sources include village committee or upper level governments [township, county, or prefecture)].
Finally, we asked each village leader to categorize the dominant method of waste disposal in their village (the question in the survey was, “How is solid waste disposed?” Methods include unregulated dumping [in pits or in water); buried in landfills; incinerated; or others [e.g., centralized disposal methods, recycling, or decomposed]). Based on their responses, we report the number of villages that used “centralized waste disposal” methods. In our survey, RSW was “centrally disposed” if the waste was transported to a centralized treatment plant by government personnel rather than disposed of in surrounding areas by individual residents. RSW was also considered centrally disposed if a centralized treatment plant was responsible for appropriately classifying and disposing of the waste. Centralized waste disposal methods present the least harm to the environment and are thus acknowledged as one of the best waste disposal methods in rural areas.
In addition, we also collected village and township characteristics. Village characteristics included net per capita annual income; number of small hamlets (the number of groups within each village); total population; distance from town (the distance from the village committee to the township government); new leader (whether the village head in 2015 was newly elected or appointed); and direct election (whether the village head was directly elected). A similar set of characteristics were collected for townships, and were used for a descriptive analysis that can be found in the Appendix A (see Table A4 for more details).
2.3. Statistical Model
We used both descriptive and multivariate analysis to evaluate the determinants of whether or not villages provided a given RSWM service. We used a Probit model to analyze different determinants, with the following equation to examine each RSWM service separately:
where Wi, indicates whether village i provides the corresponding RSW services (waste facilities and waste workers, waste transportation and centralized waste treatment). Wi is a binary variable. When a village has the corresponding RSWM services, Wi is equal to 1; otherwise, it is equal to 0). Vi is a vector of village characteristics, including net per capita annual income (thousand dollars/year); number of small hamlets; total population; distance from town; new leader, and direct election. Pi is a dummy variable for controlling province effect. The symbol α is constant term, and the symbols β and γ are the coefficients to be estimated. εi is the error term.
Wi = α + βVi + γPi + εi,
To show the marginal effects of every variable, we also used Dprobit, an alternative model to Probit. Both models have the same maximum-likelihood estimation property. The Dprobit model reports the marginal effect of a variable, whereas the Probit model reports the raw coefficients. Dprobit can also show discrete changes in probability for dummy variables. Thus, the model allows us to show the increased or decreased possibility that a village provides RSWM services when any one of the characteristics of villages is changed by one unit (Table 3).
3. Results
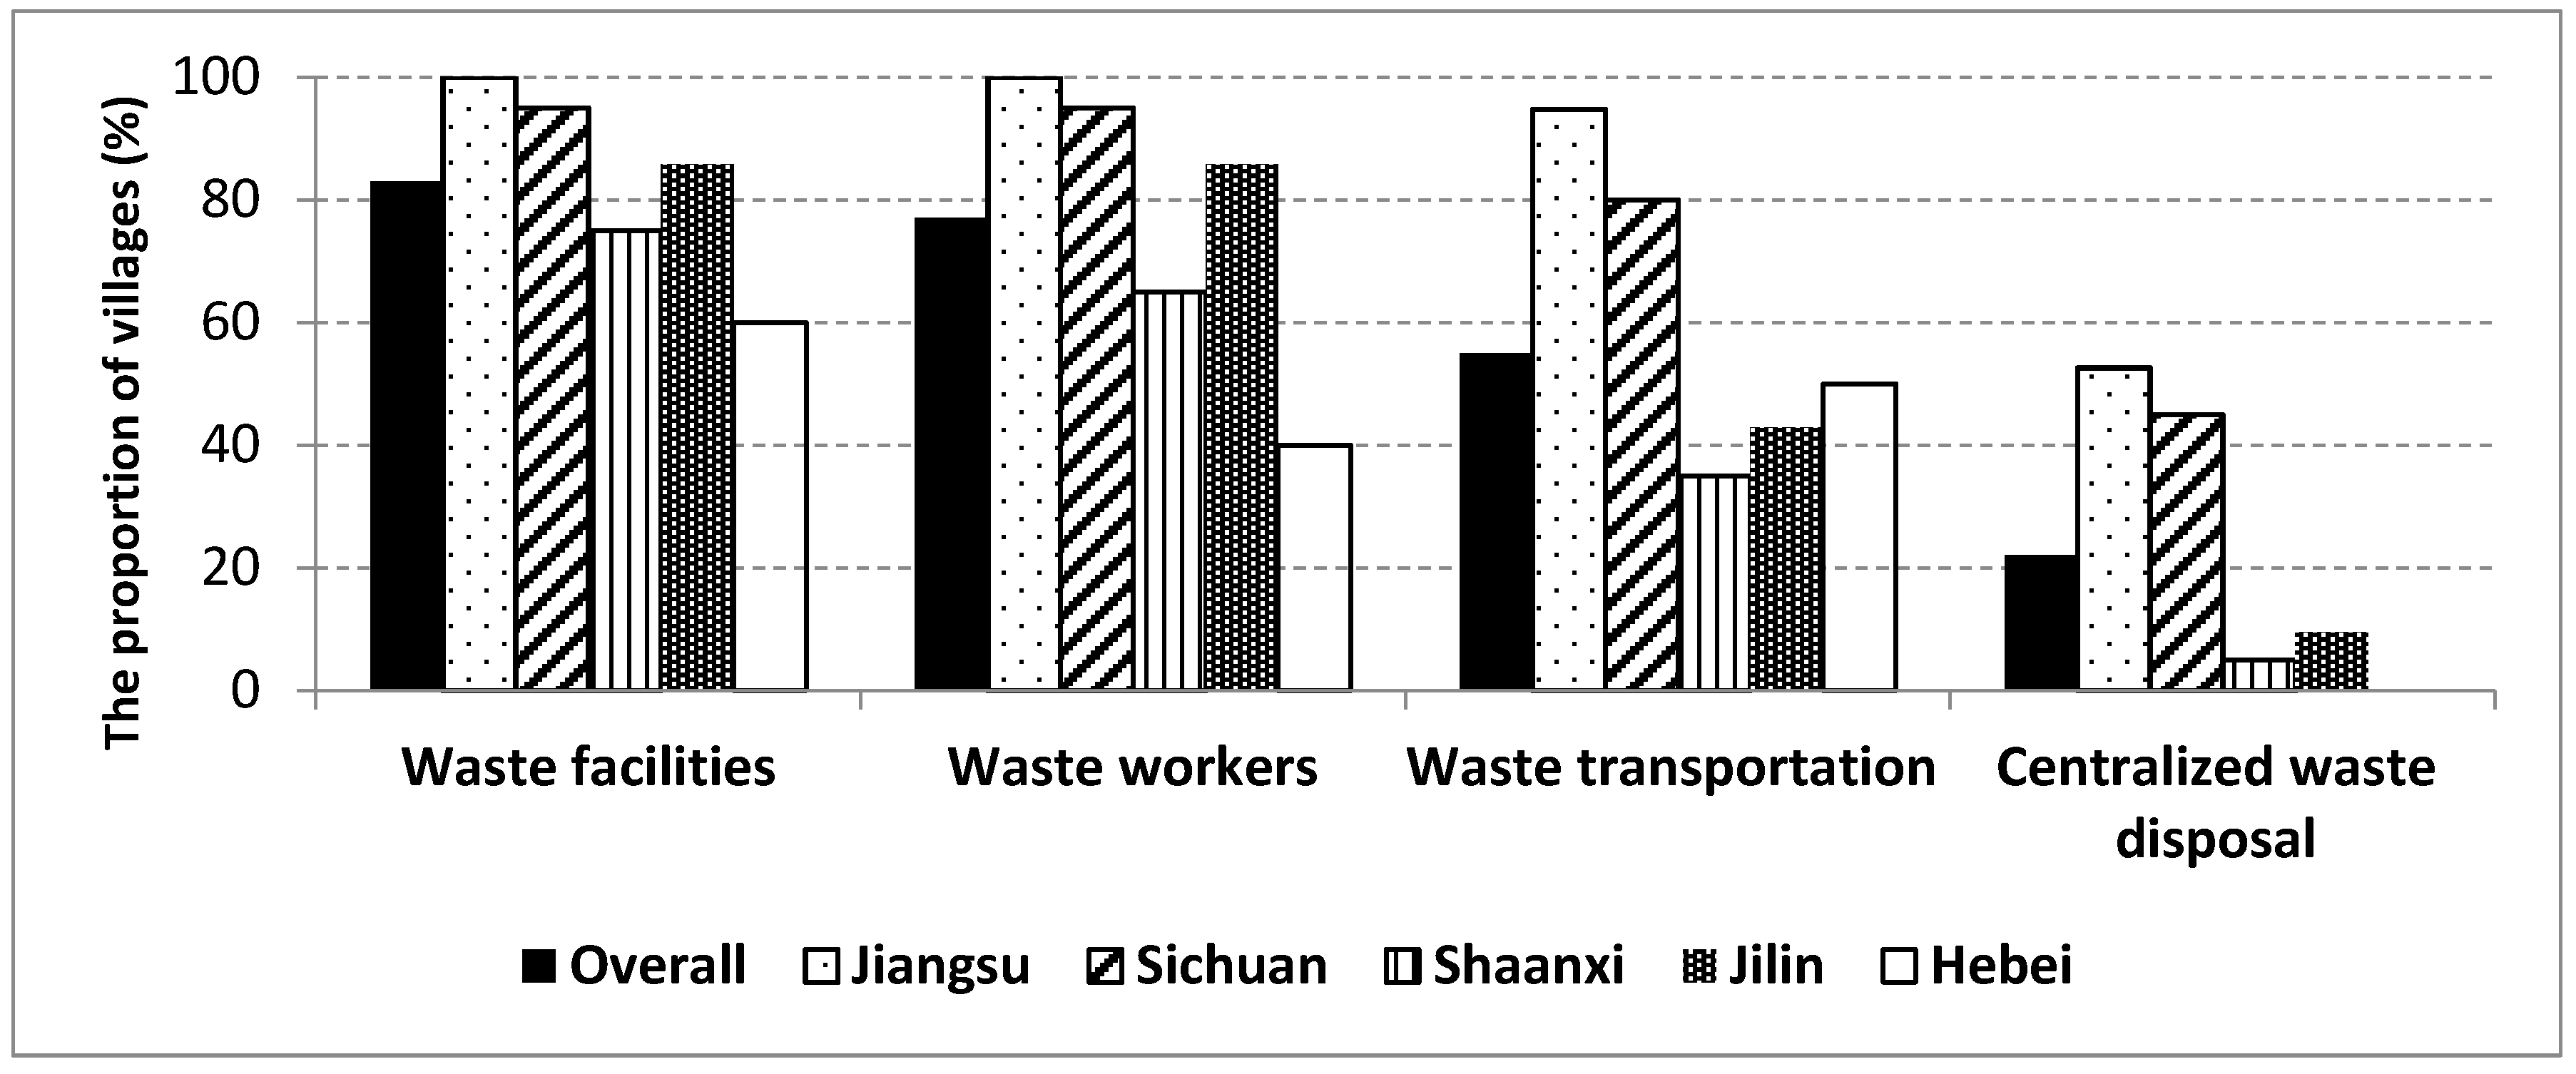
Overall, we can see that the share of villages with some types of waste collection services (including waste collection facilities or equipment, and workers) reached about 80% in 2015. Nearly 60% of villages reported having waste transportation services. Only 22% of villages used centralized waste disposal methods to dispose of waste (Figure 2).
3.1. The Overall State of RSWM Services
3.1.1. RSW Collection Services
RSW Collection Facilities
More villages had waste collection facilities or equipment than waste collection workers. On average, 83% of villages in our sample have waste collection facilities or equipment (Figure 2). There is a wide range of significant regional variation. All villages (100%) in Jiangsu Province have waste collection facilities and equipment, whereas in Hebei, only 60% of villages have waste collection facilities or equipment (Figure 2). In Sichuan, Jilin and Shaanxi, 95%, 85%, and 75% of villages, respectively, have waste collection facilities or equipment.
In addition, we find that the number of waste collection facilities or equipment in villages is relatively low. There are, on average, 41 waste collection facilities or pieces of equipment in each village (including dumpsters, waste pits, and waste storage buildings) from all samples. However, this result is due to the large regional differences across provinces (Table A1). Villages in Jiangsu province have on average 141 waste collection facilities or equipment per village, far outnumbering the other four provinces. Omitting Jiangsu brings the average number of waste collection facilities or pieces of equipment to only 7.5 per village.
RSW Collection Workers
Waste collection workers are employed to make sure waste ends up either in waste collection facilities of local villages or in centralized waste collection facilities. Our data show that on average 77% of villages in our sample employ waste collection workers (there are two methods of waste collection: door-to-door waste collection, and collection from local waste facilities. In our sample, there were only two villages that provided door-to-door waste collection. We therefore did not consider specific waste collection methods in our analysis). Again, a disparity between regions in China still exists (Figure 2). Furthermore, 100% of villages in Jiangsu province employ waste collection workers, whereas only 40% of villages in Hebei province do. In Sichuan, Jilin and Shaanxi provinces, 95%, 85% and 65% of villages in our sample employ waste collection workers, respectively. The average village with waste collection workers spends about 4377 dollars employing them. The annual cost of employing workers is more than twice as much in Jiangsu province (6701.5 dollars) as in Shaanxi province (2699.4 dollars) (Table A2).
Research has shown that after a “Rural Tax Reform” in 2005, some village committees’ tax income was too low to provide RSWM services; subsequently, in response to environmental pressures, upper-level governments began subsidizing some waste collection services and transportation [30]. It has therefore been unclear whether RSWM funding should be the provision of upper-level government or whether it should be secured by the active work of village committees. We found that funding to pay for waste collection workers came from both upper-level government (township, county, and prefecture) and village committees. On average, 47% of the villages in our sample reported receiving funding from upper level government, and 39% of villages received funding from village committees. The majority of villages in Sichuan and Jilin (58% and 67%, respectively) reported that village-level committees bore the cost of paying for waste collection workers. In contrast, more support from upper-level government was evident in Jiangsu: only 11% of villages reported village-level committees as main sources of funding, while 63% of the villages reported upper-level government as the main source of funding.
3.1.2. RSW Transportation Services
Overall, the number of villages with waste transportation services is lower than those with waste collection services. Our survey shows that 55% of surveyed villages will transport waste to a waste disposal and treatment plant (Figure 2). There were also significant differences across provinces, with 95% of villages in Jiangsu transporting waste compared to just 35% of villages in Shaanxi province. In Sichuan, the proportion of villages that report transporting waste is slightly higher, around 80%. More villages in Hebei province report transporting waste compared to Jilin and Shaanxi provinces.
Previous studies have shown that waste transportation costs represent the largest share of costs in RSWM processes [6]. For this reason, we report the average distance between villages and the nearest waste treatment plant, as well as the main source of funding for waste transportation services. On average, the distance between villages and waste disposal treatment plants is 9.92 km (Table A3). Villages in Sichuan are furthest from waste disposal and treatment plants, reporting an average distance of 17.86 km. In contrast, villages in Hebei are located an average of 2.21 km from a waste disposal and treatment plant. This could be one potential reason behind higher rates of waste transportation services in villages of Hebei province.
Moreover, we also asked about the sources of funding for waste transportation services. On average, 55% of villages reported that waste transportation costs were being borne by the upper government. The level of upper government support for waste transportation varies across provinces. In Jiangsu, Shaanxi, and Hebei provinces, costs for waste transportation services were mainly borne by upper-level government. In contrast, 66% of our sample villages in Jilin reported that costs for waste transportation services were borne by the village-level committees.
3.1.3. RSW Disposal and Treatment Services
Even though safe disposal is the ultimate goal of waste management, only 22% of villages in our sample reported using centralized waste disposal services in 2015. Rural areas in China often lack a standard waste treatment plant. Such plants should direct seepage water to safe underground channels that do not pollute the soil; are located downstream of villages; or are otherwise situated in such a way as to minimize environmental pollution [18]. These plants should also have the technology to dispose of waste safely. Our survey found that rates of centralized disposal are low and common alternative methods of disposal include unregulated dumping, burying waste in local landfills, and burning waste (In the sample villages, there are two methods for burying waste. In the first, villagers or waste workers bury waste in open sites. In the second, a village’s waste is transported to local landfills, and then buried. In addition, 39% of the villages in our sample used the first method; 61% used the second. Similarly, there are two methods for burning waste: one in which villagers or waste workers burn their waste in open sites, another in which a village’s waste is transported to an incineration plant, and then burned. 43% of the villages in our sample used the first method; and 57% used the second). Low rates of centralized disposal may indicate high rates of unsafe waste disposal practices in rural China.
In our sample, an average of 23% of villages reported unregulated dumping of waste. In addition, 39% of villages reported burying waste in landfills; and 16% of villages reported burning waste. Less than a quarter (22%) of villages reported using centralized waste disposal methods (Figure 3). Over half of the villages in Jiangsu and Sichuan provinces reported using centralized disposal methods. By contrast, in Shaanxi province, nearly 65% of villages in our sample reported burying waste in landfills. This may be associated with the geographical environment of Shaanxi province, which was located on the Loess Plateau that provide convenient and accessible sites (such as ditches and pits) to bury RSW in the field.
3.2. Determinants of RSWM Services
We find that all RSWM services have a positive relationship with per capita net annual income (Table 1). Table 2 shows the same results: as villagers become richer, their village provides more RSWM services (Row 1).
Aside from villager income, several other village and village head characteristics were also linked to the provision of RSWM services. Table 2 shows that RSWM services are more likely to be provided in villages with larger populations, villages with more small hamlets, and villages with a new leader in 2015 (Rows 2, 4 and 5). Distance from town is not significantly linked to a decreased likelihood of providing centralized waste disposal services (Table 2, Row 3, Column 7). Direct election had neither a positive nor a negative relationship with the supply of RSWM services (Table 2, Row 6). We use a Dprobit model to further analyze these relationships in the following context.
The results of the multivariable analysis are basically consistent with our general findings from the descriptive analysis. The richer a village, the higher the probability it provides waste collection and transportation services (Table 3, Row 1, Column 1–3). One difference between the two analyses is that, in the multivariable analysis, centralized waste disposal services no longer have a significant relationship with income (Table 3, Row 4, Row 1, Column 4). Table 3 shows that when the net per capita annual income increases by one thousand dollars, the possibility of providing waste facilities services increases by only 0.20 percent (Row 1, Column 1); the possibility of employing waste workers increases by only 0.17 percent (Row 1, Column 2); and the possibility of providing waste transportation increases by 2.50 percent (Row 1, Column 3). This means that, in 2015, villages with higher net annual income provided more waste transportation services, but did not provide more waste collection services or employ more workers.
Our multivariate analysis also found that villages with a larger population are more likely to employ waste workers (Table 3, Row 2, Column 2). Villages with waste transportation services were generally closer to the township government (Table 3, Row 3, Column 3). This analysis also verified that transportation cost is the main cost of RSWM services. Furthermore, when a new village leader begins to manage a village, villages are more likely to provide centralized waste disposal services (Table 3, Row 5, Column 4).
To better understand the determinants of RSWM services provision, we also describe RSWM at the township level and the relationship between town characteristics and RSWM services. Just as we find significant differences in service provision among villages, we find significant differences among townships (Table A4). Nevertheless, our descriptive analysis does not link any town characteristics significantly with the supply of RSWM services (Table A5); characteristics at the village level are more relevant.
4. Discussion and Proposals
In this paper, we have used a nationally-representative dataset to describe the state of RSWM processes in rural China in 2015. In our results, we report that the share of villages with waste collection facilities and equipment generally outnumber the share of villages with waste collection workers, waste transportation services, and centralized disposal methods. Government investment in RSWM has therefore been partly successful. However, our results also suggest that the gap in prevalence of different processes in RSWM remains large. In other words, while the majority of the villages in our sample provided waste collection services (providing waste collection workers as well as facilities), half of the villages didn’t transport waste to a waste disposal factory, and four out of every five villages did not use centralized disposal methods. Without the latter two steps (waste transport and safe disposal practices), RSWM is ultimately ineffective, with unregulated treatment and disposal practices leading to environmental pollution. Given recent government investment and regulatory efforts to improve RSWM processes, we find that RSWM services have improved greatly since 2005 [40,41]. However, growth across the different stages of RSWM varies [39,40]. For example, the number of villages with waste collection and waste transportation services increased 7.5-fold over four years since 2011, but the proportion of villages using centralized waste disposal methods increased more slowly, by a factor of 2.5 [40].
At the same time, the proportion of villages providing RSWM services varies by province. Jiangsu had the highest proportion of villages providing all services. Villages in Shaanxi, Sichuan and Jilin provide RSWM services at about the same rate. Hebei villages have the worst RSWM services. The biggest difference lies in the provision of waste disposal services: in Jiangsu, about 50 percent of villages provide these services, compared with no villages in Hebei.
According to the results of the descriptive and multivariable analyses, income is the main determinant of waste collection and waste transportation provision. This may suggest that as local residents become wealthier, they may begin to advocate for a cleaner and more livable village environment, which requires better supply of RSWM services. In addition, having a new village leader also positively affects the supply waste disposal services. New leaders may have more of a tendency to bring in new ideas (as an old Chinese saying goes, “a new broom sweeps clean”).
Moreover, compared with Wang et al., we find that the marginal effect of waste collection services decreased and the marginal effect of waste transportation and waste disposal services increased [28]. This also suggests that the government has begun to improve comprehensive RSWM services. Research on the state of RSWM and its impact in China are still at an inception phase. Many problems, barriers, and challenges remain.
4.1. Waste Collection Services
While a large share of villages in our sample report having rural solid waste collection services, waste collection facilities and equipment are often low quality. In general, unsustainably high costs and inconsistent employment of waste collection workers hinder the overall quality of waste collection services [26]. Through fieldwork, we also observed that the rate of proper RSW classification and recycling is very low at the village level. Other studies have also noted this reality in rural China [26].
These are serious issues, but they are not unsolvable. Continuous investment is needed to sustainably improve the quality of waste collection services, including workers and facilities. In particular, waste classification systems should be improved. As Zarate et al. suggests, more needs to be done in terms of training waste collection workers to not only collect but also classify RSW correctly [42]. International research in both rural and urban regions in other countries reveals that classification and recycling are among the main means of effectively reducing the quantity of RSW produced [43,44,45]. It is possible that certain new technologies can also be utilized in RSWM services so as to better optimize waste collection. Some developed countries and cities now use Web-GIS oriented systems and vacuum waste collection systems [46,47]. Early classification of waste leads to safer disposal and treatment based on specific waste characteristics.
The government can also use economic incentives and subsidy tools to encourage people to collect, separate and recycle RSW in the home [48,49,50,51]. A commercial recycling company can also be hired to support the local government in its efforts [52,53]. Efforts should also be made to increase villager environmental awareness by advertising safe and acceptable practices of RSW collection and classification. Public positive participation has been shown to be one of the most important methods to reduce the amount of RSW [42]. Local “village environment committees” can be established to better manage and enforce RSWM according to the local economic and geographic context [54].
4.2. Waste Transportation Services
Only 55% of the villages in our sample reported transporting waste. This is very low and indicates that much of the RSW that is collected is still being dumped, buried in a ditch, or burned illegally. These behaviors pollute the environment, including the soil, water and surrounding ecosystem.
From our initial observations, one of the main reasons that waste is not transported is the high costs of waste transportation services. One method that might cut down on waste transportation costs is to build waste transfer stations in more convenient locations (such as township government centers or another central location in a township) among villages based on the Cost Optimal Principle [55,56]. Efforts can also be made to establish optimal transportation routes and networks for minimum transportation costs based on amount of RSW in different villages of a township [57,58].
County and township governments should develop optimal waste transportation logistics networks and routes. It may be possible to moderately decrease costs by regulating the quantities of waste that come from different villages. Other effective methods of improving waste transportation services include classifying types of waste and, in larger villages, safely disposing of waste on-site in order to reduce the quantity of waste transported.
4.3. Waste Treatment Services
In our study, we find that dumping waste in a landfill is one of the most popular methods of waste disposal for many villages. Only one-fifth of all villages in our sample (22%) report using centralized disposal methods. Other studies have also confirmed low rates of centralized disposal and classification. Given that 70% of China’s population live in rural areas, we believe that the need to increase the efficiency of RSW disposal is urgent.
Why are rates of centralized disposal in rural China so low? One reason is that villages in remote areas often cannot afford to pay for the transport of waste to a centralized facility in the first place. Villages also represent a low-benefit market for centralized disposal centers. While one of the benefits of centralized disposal facilities is greater cost-effectiveness for larger units, the amount of waste collected in each village is not necessarily enough to outweigh the costs of collecting the trash. Poor roads, long distances, and the inability to fill transport vehicles each trip lessen the disposal center’s willingness to pick up the waste [59]. Villages located in remote areas may be better suited for on-site disposal [60,61].
Research shows that it is feasible for China to bring in other relatively low-cost and environmentally friendly technologies for safer waste disposal on-site, rather than transporting it off-site [1,61]. Experiences from Iran, the US, and India highlight the effectiveness of disposing of biodegradable waste on-site using relatively low-cost composting technology [62,63,64,65]. Vermicomposting, which uses earthworms to turn organic wastes into very high-quality compost, is another cost-effective option that can be practiced on-site [65]. Anaerobic digestion is yet another on-site waste disposal technology involving the biological decomposition of organic materials in the absence of oxygen to produce a biogas. This biogas can then be used for fuel (e.g., for cooking dinner or heating a home), while the residue from the decomposition process can be spread like fertilizer on agricultural fields [66,67].
Rural regions lack both the capital and the latest technology for waste treatment. As a consequence, the government might want to consider investing in on-site technology and capital in rural regions [68].
4.4. Disparity across Provinces
In our results, we find that Jiangsu and Sichuan perform the best across all three stages of RSWM, while Shaanxi and Hebei provinces lag behind. Given enormous differences across provinces, we believe that more attention should be focused on China’s central and western regions. Aside from increasing financial investments to improve RSWM processes and implement different models based on the natural characteristics of villages.
Sichuan serves as an example of a province with limited resources that still performs very well due to increased local government attention and investment. Since 2008, Sichuan has served as the demonstration area of the Rural Environmental Protection Special Fund program from the Central Government [69], promoting successful practices for other provinces for nearly 10 years. In rural Sichuan, government officers and local NGOs often encourage and educate waste collection workers and villagers about environmental protection, how to separate waste and why to not dump waste illegally [70,71,72,73,74,75,76,77].
In rural Sichuan, different models for RSWM are practiced according to the type of land. In flat areas, RSW is mainly managed by an environmental company. In the hillside, waste collection services are mainly managed by the environmental center in the village located in the township. In the mountainous areas, the model promoted is “village classification, storage, and transportation; and township treatment”. Some villages make use of a “waste management fee system” wherein each village pays 0.14 dollar towards a community-wide waste management fund. Some villages used biogas ecological cycle technology to dispose of organic waste (80% of RSW) and make waste become new energy for rural residents. These are all experiences that can be used in villages in other provinces.
On the basis of these discussions, we note that different levels of government should generally play different roles in the provision of different RSWM services. For all RSWM services, all levels of government can implement more appropriate, effective policies. For waste collection services, lower-level governments should be more involved in making sure local residents learn about the dangers that poor waste management poses to health and the environment. Once local attitudes become more concerned with/accepting of waste management, local officials may be more incentivized to improve waste collection methods (because of support and pressure from local residents).
For waste transportation and disposal services, township or counties governments should seek to better optimize the distribution of waste management resources, including human and physical capital. Transportation routes may also to be able to be more optimized. In general, leaders at the county government level should balance long and short term interests in order to incentivize sustainable development in rural regions.
Acknowledgments
This study was supported by the National Natural Science Foundation of China (71333012) and the 111 Project (B16031).
Author Contributions
Linxiu Zhang, Yaojiang Shi and Scott Rozelle conceived and organized the study. Linxiu Zhang and Aiqin Wang contributed to the gathering of all the necessary data. Aiqin Wang analyzed the data and wrote the paper, under the supervision of Scott Rozelle. Annie Osborn and Meredith Yang revised the paper with appropriate English language. All authors have read and approved the final manuscript.
Conflicts of Interest
The authors declare no conflict of interest.
Appendix A

Table A1.
Number of waste collection facilities per village across provinces.
| Regions | Sample Size | Mean | Std. Dev. | Min | Max |
|---|---|---|---|---|---|
| Overall | 77 | 40.95 | 78.60 | 1 | 350 |
| Jiangsu | 19 | 141.26 | 108.83 | 1 | 350 |
| Sichuan | 19 | 9.11 | 5.15 | 2 | 21 |
| Shaanxi | 13 | 6.62 | 5.47 | 1 | 22 |
| Jilin | 18 | 9.44 | 9.43 | 1 | 40 |
| Hebei | 8 | 5.00 | 1.77 | 1 | 7 |
Note: Waste collection facilities are dumpsters, garbage pits or garbage storage buildings to collect and store RSW.
Table A2.
Annual costs of waste collection workers and sources of funds on waste collection.
| Regions | Sample Size | Mean | Std. Dev. | Min | Max | Sources of Fund on Waste Collection | ||
|---|---|---|---|---|---|---|---|---|
| Villages | Villages and Upper Government | Upper Government | ||||||
| Overall a | 70 | 4376.96 | 5180.00 | 144.74 | 27,500.76 | 39 | 14 | 47 |
| Jiangsu | 19 | 6701.50 | 6759.50 | 868.45 | 27,500.76 | 11 | 26 | 63 |
| Sichuan | 17 | 2969.79 | 3815.24 | 144.74 | 11,043.73 | 58 | 0 | 42 |
| Shaanxi | 12 | 2699.42 | 3113.05 | 521.07 | 8684.45 | 31 | 23 | 46 |
| Jilin | 17 | 4401.86 | 5453.31 | 289.48 | 18816.31 | 67 | 6 | 28 |
| Hebei | 5 | 4269.85 | 3298.22 | 723.70 | 9263.41 | 13 | 25 | 63 |
Note: 1 dollar = 6.9089 yuan. a In some villages, nearby county government or town government, there is no cost for employing waste collection workers.
Table A3.
Distance between villages and waste disposal factory and sources of fund.
| Regions | Sample Size | Mean | Std. Dev. | Min | Max | Sources of Fund on Waste Transportation | ||
|---|---|---|---|---|---|---|---|---|
| Villages | Villages and Upper Government | Upper Government | ||||||
| Overall | 55 | 9.13 | 9.92 | 0.15 | 40 | 36.36 | 9.09 | 54.55 |
| Jiangsu | 18 | 5.54 | 4.32 | 0.3 | 15 | 22.22 | 16.67 | 61.11 |
| Sichuan | 16 | 17.86 | 12.99 | 0.7 | 40 | 43.75 | 12.5 | 43.75 |
| Shaanxi | 7 | 8.14 | 7.03 | 3 | 20 | 28.57 | 0 | 71.43 |
| Jilin | 9 | 5.39 | 6.41 | 1 | 20 | 66.67 | 0 | 33.33 |
| Hebei | 5 | 2.21 | 2.39 | 0.15 | 6 | 20 | 0 | 80 |
Table A4.
The proportion of RSWM services at the township level.
| RSWM Services | Provinces a | Percentage of Sample Villages in a Township Providing a RSWM Service | p-Value | ||
|---|---|---|---|---|---|
| Neither Village b | One Village c | Both Villages d | |||
| Waste facilities | Jiangsu | 0 | 0 | 100 | 0.171 |
| Sichuan | 0 | 10 | 90 | ||
| Shaanxi | 10 | 30 | 60 | ||
| Jilin | 10 | 20 | 70 | ||
| Hebei | 30 | 20 | 50 | ||
| Waste workers | Jiangsu | 0 | 0 | 100 | 0.016 |
| Sichuan | 0 | 1 | 90 | ||
| Shaanxi | 20 | 30 | 50 | ||
| Jilin | 10 | 20 | 70 | ||
| Hebei | 50 | 20 | 30 | ||
| Waste transportation | Jiangsu | 0 | 10 | 90 | 0.009 |
| Sichuan | 10 | 20 | 70 | ||
| Shaanxi | 50 | 30 | 20 | ||
| Jilin | 40 | 30 | 30 | ||
| Hebei | 50 | 30 | 20 | ||
| Centralized waste disposal | Jiangsu | 30 | 30 | 40 | 0.009 |
| Sichuan | 40 | 30 | 30 | ||
| Shaanxi | 90 | 10 | 0 | ||
| Jilin | 80 | 20 | 0 | ||
| Hebei | 90 | 10 | 0 | ||
Note: a The sample number of township is 50 and there are 10 sample villages in every province; b In other words, in a given township, neither village provided the following services. Thus, in 10% of townships, neither village provided waste facilities, etc.; c In other words, in a given township, only one village provided the following services; d In other words, in a given township, both villages provided the following services.
Table A5.
Town characteristics and the proportion of town with RSWM services a.
| Town Characteristics | Group b | Mean | Sample Size | Waste Facilities | Waste Workers | Waste Transportation | Centralized Waste Disposal |
|---|---|---|---|---|---|---|---|
| (1) Net annual per capita income | Low c | 7149.9 | 16 | 56.25 | 43.75 | 12.50 | 6.25 |
| Middle | 10,787.3 | 16 | 75.00 | 75.00 | 50.00 | 6.25 | |
| High | 17,107.6 | 18 | 83.33 | 77.78 | 61.11 | 22.22 | |
| (2) Total Population | Few d | 11,903.7 | 16 | 75.00 | 68.75 | 37.50 | 0.00 |
| Middle | 26,742.4 | 17 | 64.71 | 52.94 | 29.41 | 11.76 | |
| Many | 62,523.8 | 17 | 76.47 | 76.47 | 58.82 | 23.53 | |
| (3) Furthest distance between two villages | Small e | 7.9 | 16 | 68.75 | 50.00 | 25.00 | 6.25 |
| Middle | 16.2 | 17 | 76.47 | 76.47 | 64.71 | 17.65 | |
| Big | 31.8 | 17 | 70.59 | 70.59 | 35.29 | 11.76 | |
| (4) Distance from county government | Near f | 3.2 | 13 | 92.31 | 76.92 | 53.85 | 7.69 |
| Middle | 15.9 | 20 | 75.00 | 75.00 | 45.00 | 15.00 | |
| Far | 34.5 | 17 | 52.94 | 47.06 | 29.41 | 11.76 |
Note: a The proportion of townships with RSWM services is the percentage of townships in which both villages provide the corresponding services; b All groups are divided based on town characteristic values in 2015; c We divide net per capita annual income into three groups (1 dollar = 6.9089 yuan). We define a town as part of the “Low” income group if net per capita annual income is less than 1390 dollars, the “Middle” group if income ranges between 1390 and 1751 dollars, and the “High” group if income is 1751 dollars or more; d We divide total population into three groups. We define a town to be in the “Few” group if the total population is less than 17,500 people, the “Middle” group if the total village population ranges from 17,500 to 42,000 people, and the “Many” group if a village has more than 42,000 people; e We divide furthest distance between two villages into three levels. We define a town in the “Small” group if the distance is less than 10 km, the “Middle” group if the distance ranges between 10 and 20 km, and the “Big” group if the village is more than 20 km; f We divide distance from town government to the county government into three levels. We define a town in the “Near” group if the distance is less than 10 km, the “Middle” group if the distance ranges between 10 and 21 km, and the “Far” group if the town is more than 21 km.
References
- Wu, D.; Zhang, C.Y.; Lü, F.; Shao, L.M.; He, P.J. The operation of cost-effective on-site process for the bio-treatment of mixed municipal solid waste in rural areas. Waste Manag. 2014, 34, 999–1005. [Google Scholar] [CrossRef] [PubMed]
- Huang, K.X.; Wang, J.X.; Bai, J.F.; Qiu, H.G. Production of rural domestic solid waste and policy countermeasures. China Soft Sci. 2012, 9, 72–79. (In Chinese) [Google Scholar]
- Pan, D.; Ying, R.Y.; Huang, Z.H. Determinants of Residential Solid Waste Management Services Provision: A Village-Level Analysis in Rural China. Sustainability 2017, 9, 110. [Google Scholar] [CrossRef]
- Li, Y.M.; Bai, J.F.; Wang, J.X.; Qiu, H.G. Disposal of domestic solid wastes and determinants in rural China. China Popul. Resour. Environ. 2012, 22, 63–68. (In Chinese) [Google Scholar]
- Organization for Economic Co-Operation and Development (OECD). OECD Factbook 2009: Economic, Environmental and Social Statistics; OECD: Paris, France, 2013. [Google Scholar] [CrossRef]
- Mimra, M.; Kavka, M.; Renfus, R. Analysis and evaluation of the waste management in the municipality. Agron. Res. 2016, 14, 1180–1190. [Google Scholar]
- Ciuta, S.; Apostol, T.; Rusu, V. Urban and rural MSW stream characterization for separate collection improvement. Sustainability 2015, 7, 916–931. [Google Scholar] [CrossRef]
- Scheinberg, A.; Wilson, D.C.; Rodic-Wiersma, L. Solid Waste Management in the World’s Cities: Water and Sanitation in the World’s Cities. 2010, Volume 50. Available online: https://thecitywasteproject.files.wordpress.com/2013/03/solid_waste_management_in_the_worlds-cities.pdf (accessed on 12 March 2017).
- Ferreira, S.; Cabral, M.; da Cruz, N.F.; Simões, P.; Marques, R.C. The costs and benefits of packaging waste management systems in Europe: The perspective of local authorities. J. Environ. Plan. Manag. 2017, 60, 773–791. [Google Scholar] [CrossRef]
- Rada, E.C.; Zatelli, C.; Mattolin, P. Municipal solid waste selective collection and tourism. WIT Trans. Ecol. Environ. 2014, 180, 187–197. [Google Scholar]
- Ranieri, E.; Montanaro, C.; Ranieri, A.C.; Campanaro, V.; Cioca, L.I. Municipal solid wastes in the South-Eastern Mediterranean region: Quality, quantity and management Quality. Calitatea 2017, 18, 162–169. [Google Scholar]
- Wen, Z.G.; Wang, Y.J.; De Clercq, D. Performance evaluation model of a pilot food waste collection system in Suzhou City. China. J. Environ. Manag. 2015, 154, 201–207. [Google Scholar] [CrossRef] [PubMed]
- Dong, S.H.; Tong, K.W.; Wu, Y.P. Municipal solid waste management in China: Using commercial management to solve a growing problem. Util. Policy 2001, 1, 7–11. [Google Scholar] [CrossRef]
- Chen, X.; Geng, Y.; Fujita, T. An overview of municipal solid waste management in China. Waste Manag. 2010, 30, 716–724. [Google Scholar] [CrossRef] [PubMed]
- National People’s Congress of the People’s Republic of China. Law on the Prevention and Control of Environmental Pollution by Solid Waste. 2005. Available online: http://www.zhb.gov.cn/gzfw_13107/zcfg/fl/201605/t20160522_343380.shtml (accessed on 22 May 2016).
- Ministry of Environmental Protection of the People’s Republic of China. National Rural Well-off Environmental Action Plan. 2006. Available online: http://www.zhb.gov.cn/gkml/zj/wj/200910/t20091022_172416.htm (accessed on 22 May 2016).
- Ministry of Environmental Protection of the People’s Republic of China. Opinion of Enhancing Rural Environmental Protection. 2007. Available online: http://www.zhb.gov.cn/gkml/zj/wj/200910/t20091022_172461.htm (accessed on 22 May 2016).
- Ministry of Housing and Urban-Rural Development of People’s Republic of China (MOHURD). Technique Code for Village Rehabilitation (GB50445-2008). 2008. Available online: http://www.jshb.gov.cn/JSHBW/gsgg/xmzj/200909/P020090901800618523821.pdf (accessed on 22 May 2016).
- Ministry of Environmental Protection and Ministry of Finance of the People’s Republic of China. Implementation Plan about Promoting Solutions to Prominent Rural Environmental Problems. 2009. Available online: http://www.gov.cn/zwgk/2009–03/03/content_1249013.htm (accessed on 22 May 2016).
- Ministry of Housing and Urban-Rural Development of People’s Republic of China (MOHURD). Technical Specifications of Domestic Pollution Control for Town and Village (HJ574-2010). 2010. Available online: http://kjs.mep.gov.cn/hjbhbz/bzwb/other/hjbhgc/201007/W020130204568422920510.pdf (accessed on 22 May 2016).
- MHURD (Ministry of Housing and Urban-Rural Development); the CRWLG (Central Rural Work Leading Group); the CGCBSC (Central Guidance Commission for Building Spiritual Civilization); the NDRC (National Development and Reform Commission); the MOEP (Ministry of Environmental Protection); the MOF (Ministry of Finance); the MOA (Ministry of Agriculture); the MOFCOM (Ministry of Commerce); the PHCCO (Patriotic Health Campaign Committee Office); the ACWF (All-China Women’s Federation). Guidance on Rural Solid Waste Governance. 2015. Available online: http://www.mohurd.gov.cn/wjfb/201511/t20151113_225575.html (accessed on 22 May 2016).
- MHURD (Ministry of Housing and Urban-Rural Development); the CRWLG (Central Rural Work Leading Group); the CGCBSC (Central Guidance Commission for Building Spiritual Civilization); the NDRC (National Development and Reform Commission); the MOEP (Ministry of Environmental Protection); the MOF (Ministry of Finance); the MOA (Ministry of Agriculture); the MOFCOM (Ministry of Commerce); the PHCCO (Patriotic Health Campaign Committee Office); the ACWF (All-China Women’s Federation). Evaluation Standards for Inspection of Rural Solid Waste Management. 2015. Available online: http://www.mohurd.gov.cn/wjfb/201512/t20151210_225900.html (accessed on 22 May 2016).
- Ministry of Environmental Protection and Ministry of Finance of the People’s Republic of China. Interim Measures for the Management of Special Funds for Environmental Protection in Rural Areas. 2009. Available online: http://www.zhb.gov.cn/gkml/hbb/bwj/200910/t20091022_174623.htm (accessed on 22 May 2016).
- He, P.J. Municipal solid waste in rural areas of developing country: Do we need special treatment mode? Waste Manag. 2012, 32, 1289–1290. [Google Scholar] [CrossRef] [PubMed]
- Zhen, H.; Liang, C.H. Study of status and management strategy of rural domestic waste. North. Hortic. 2010, 19, 223–226. (In Chinese) [Google Scholar]
- Zeng, C.; Niu, D.; Zhao, Y. A comprehensive overview of rural solid waste management in China. Front. Environ. Sci. Eng. 2015, 9, 949–961. [Google Scholar] [CrossRef]
- Liu, Y.; Huang, J.K. Rural domestic waste disposal: an empirical analysis in five provinces of China. China Agric. Econ. Rev. 2014, 6, 558–573. [Google Scholar] [CrossRef]
- Zeng, C.; Niu, D.; Li, H.; Zhou, T.; Zhao, Y. Public perceptions and economic values of source-separated collection of rural solid waste: A pilot study in China. Resour. Conserv. Recycl. 2016, 10, 166–173. [Google Scholar] [CrossRef]
- Qiu, B.X. Rural Planning and Construction in an Era of Ecological Civilization. 2009. Available online: http://www.mohurd.gov.cn/jsbfld/200903/t20090316_187287.html (accessed on 18 February 2009). (In Chinese)
- Cointreau, S. Occupational and Environmental Health Issues of Solid Waste Management: Special Emphasis on Middle and Lower-Income Countries; The World Bank, Urban Solid Waste Management: Washington, DC, USA, 2006; Available online: http://www.ircwash.org/resources/occupational-and-environmental-health-issues-solid-waste-management-special-emphasis (accessed on 12 March 2017).
- Hoornweg, D.; Bhada-Tata, P.; Kennedy, C. Waste production must peak this century. Nature 2013, 502, 615–617. [Google Scholar] [CrossRef] [PubMed]
- Giusti, L. A review of waste management practices and their impact on human health. Waste Manag. 2009, 29, 2227–2239. [Google Scholar] [CrossRef] [PubMed]
- Liu, J.G.; Diamond, J. China’s environment in a globalizing world. Nature 2005, 435, 1179–1186. [Google Scholar] [CrossRef] [PubMed]
- Ministry of Environment Protection of the People’s Republic of China (2008–2015). Report on the Status of the Environment in China; Ministry of Environment Protection of the People’s Republic of China: Beijing, China, 2008–2015.
- Simões, P.; Marques, R.C. Influence of regulation on the productivity of waste utilities. What can we learn with the Portuguese experience? Waste Manag. 2012, 32, 1266–127. [Google Scholar] [CrossRef] [PubMed]
- Han, Z.; Liu, D.; Lei, Y.; Wu, J.; Li, S. Characteristics and management of domestic waste in the rural area of Southwest China. Waste Manag. Res. 2015, 33, 39–47. [Google Scholar] [CrossRef] [PubMed]
- Han, Z.; Dan, Z.; Shi, G.; Shen, L.; Xu, W.; Xie, Y. Characteristics and management of domestic waste in a rural area of the Tibetan Plateau. J. Air Waste Manag. Assoc. 2015, 65, 1365–1375. [Google Scholar] [CrossRef] [PubMed]
- Wang, A.Q.; Gao, Q.F.; Shi, Y.J.; Liu, C.F.; Zhang, L.X. The Situation of Rural Solid Waste Management and Determination: Empirical Analysis Based on Field Surveys of 101 Villages in 5 Provinces. Issues Agric. Econ. 2016, 4, 30–38. (In Chinese) [Google Scholar]
- Rozelle, S. Stagnation without equity: Patterns of growth and inequality in China’s rural economy. China J. 1996, 35, 63–92. [Google Scholar] [CrossRef]
- Wang, A.Q.; Shi, Y.J.; Gao, Q.F.; Liu, C.F.; Zhang, L.X.; Rozelle, S.; Johnson, N. Trends and determinants of rural residential solid waste collection services in China. China Agric. Econ. Rev. 2016, 8, 698–710. [Google Scholar] [CrossRef]
- Ye, C.; Qin, P. Provision of residential solid waste management service in rural China. China World Econ. 2008, 16, 118–128. [Google Scholar] [CrossRef]
- Zarate, M.A.; Slotnick, J.; Ramos, M. Capacity building in rural Guatemala by implementing a solid waste management program. Waste Manag. 2008, 28, 2542–2551. [Google Scholar] [CrossRef] [PubMed]
- Palmer, K.; Sigman, H.; Walls, M. The cost of reducing municipal solid waste. J. Environ. Econ. Manag. 1997, 33, 128–150. [Google Scholar] [CrossRef]
- Jun, T.; Zhang, W.Q.; Che, Y.; Feng, D. Municipal solid waste source-separated collection in China: A comparative analysis. Waste Manag. 2011, 31, 1673–1682. [Google Scholar]
- Luo, R. Present condition and strategies of rural waste management. Environ. Manag. China 2006, 4, 23–26. (In Chinese) [Google Scholar]
- Rada, E.C.; Ragazzi, M.; Fedrizzi, P. Web-GIS oriented systems viability for municipal solid waste selective collection optimization in developed and transient economies. Waste Manag. 2013, 33, 785–792. [Google Scholar] [CrossRef] [PubMed]
- Ciudin, R.; Isarie, C.; Cioca, L.; Petrescu, V.; Nederita, V.; Ranieri, E. Vacuum waste collection system for an historical city centre. UPB Sci. Bull. Ser. D 2014, 76, 215–222. [Google Scholar]
- Yang, H.L.; Innes, R. Economic incentives and residential waste management in Taiwan: An empirical investigation. Environ. Resour. Econ. 2007, 37, 489–519. [Google Scholar] [CrossRef]
- Stretz, J. Economic Instruments in Solid Waste Management; Case Study Maputo, Mozambique; Federal Ministry for Economic Cooperation and Development: Bonn/Berlin, Germany, 2012.
- Ren, D.; Ge, D. Rural waste classification and resource utilization in Tonglu: From ‘City sieged by waste’ to ‘green industry’. Hangzhou Wkly. 2015, 18–19. (In Chinese) [Google Scholar]
- Xiong, Y. The survey of Rural waste classification and disposal in Xiangtan. Environ. Sustain. 2016, 2, 128–130. (In Chinese) [Google Scholar]
- Yu, X.; Guan, H.; Xu, M. PPP model of rural solid disposal with household acceptance. Mark. Technol. Econ. 2016, 6, 5–7. (In Chinese) [Google Scholar]
- Zhuang, D. Two win-environmental and economic benefit: The case of Ningxia. Guangming Daily, 14 July 2008; 1. (In Chinese) [Google Scholar]
- Zhou, J.; Lu, X.; Chen, K.; Li, S. The role of rural social organization in the rural localities government: A survey of the council of elites in Yunxian. South Rural 2015, 6, 55–59. (In Chinese) [Google Scholar]
- Cao, Y.; Yang, J.; Zhu, Y.; Wang, Z. The performance evaluation of solid waste classification and management model. Anhui Agric. Sci. 2014, 42, 12266–12269. (In Chinese) [Google Scholar]
- Gerald, A.D.; Joseph, F.S.; Kyle, G.; Gordon, S.; Dave, C. A Guidebook for Rural Solid Waste Management Services; Oklahoma Cooperative Extension Service, Division of Agricultural Sciences and Natural Resources, Oklahoma State University: Stillwater, OK, USA, 1993; Available online: http://srdc.msstate.edu/publications/archive/174.pdf (accessed on 22 May 2016).
- William, M.P. An Overview of Solid Waste Management Issues Facing Rural Communities. 1992. Available online: http://citeseerx.ist.psu.edu/viewdoc/download?doi=10.1.1.404.8719&rep=rep1&type=pdf (accessed on 22 May 2016).
- Li, Y.; Zhao, L.; Xu, S. The design of rural solid waste collection and transportation model. J. Agric. Environ. Dev. 2007, 5, 32–34. (In Chinese) [Google Scholar]
- Liu, Y.; Wang, F. Analysis on waste disposal methods of household. Chin. Rural Econ. 2012, 3, 88–96. (In Chinese) [Google Scholar]
- Pruss, A.; Giroult, E.; Rushbrook, P. (Eds.) Safe Management of Wastes from Healthcare Activities; World Health Organization: Geneva, Switzerland, 1999. [Google Scholar]
- Li, W.B.; Yao, J.; Tao, P.P.; Hu, H.; Fang, C.R.; Shen, D.S. An innovative combined on-site process for the remote rural solid waste treatment—A pilot scale case study in China. Bioresour. Technol. 2010, 102, 4117–4123. [Google Scholar] [CrossRef] [PubMed]
- Goodwin, K.; Sloggett, G.; Doeksen, G.A.; Fitzgibbons, J. Rural Community Yard Waste Composting Systems; Oklahoma Cooperative Extension Services: Stillwater, OK, USA, 2006; pp. 5–12. [Google Scholar]
- Abduli, M.A.; Samieifard, R.; Zade, M. Rural solid waste management. Int. J. Environ. Res. 2009, 1, 425–430. [Google Scholar]
- Golabi, M.H.; Kirk, J.; Takeshi, F.; Eri, I. Transforming Municipal Waste into a Valuable Soil Conditioner through Knowledge-Based Resource-Recovery Management. Int. J. Waste Resour. 2014, 4, 140. [Google Scholar] [CrossRef]
- Aalok, A.; Tripathi, A.K.; Soni, P. Vermicomposting: A better option for organic solid waste management. J. Hum. Ecol 2008, 24, 59–64. [Google Scholar]
- Mohee, R.; Mauthoor, S.; Bundhoo, Z.M.; Somaroo, G.; Soobhany, N.; Gunasee, S. Current status of solid waste management in small island developing states: A review. Waste Manag. 2015, 43, 539–549. [Google Scholar] [CrossRef] [PubMed]
- Rada, E.C.; Istrate, I.A.; Panaitescu, V.; Ragazzi, M.; Cirlioru, T.M.; Apostol, T. A comparison between different scenarios of Romanian municipal solid waste treatment before landfilling. Environ. Eng. Manag. J 2010, 9, 589–596. [Google Scholar]
- Shen, S.L. Rural waste management: from fragmentation to collaboration. Spec. Zone Econ. 2014, 5, 156–158. (In Chinese) [Google Scholar]
- Rural environment government program benefit 4.69 millions households. Sichuan Daily. 15 August 2014, p. 1. Available online: http://epaper.scdaily.cn/shtml/scrb/20140815/72275.shtml (accessed on 15 August 2014). (In Chinese).
- Xiong, Y. Sichuan experience in rural solid waste government. Urban Rural Constr. 2016, 3, 32–33. (In Chinese) [Google Scholar]
- Guo, J.; Kun, D. Rural waste disposal model in Luojiang county of Sichuan province. J. Chengdu Text. Coll. 2013, 1, 4–7. (In Chinese) [Google Scholar]
- Carry out the activity of environmental protection about rural areas. China Environmental News, 18 October 2013. (In Chinese)
- Ye, Y. Rural environmental protection of Sichuan province during the 11th five-year. Sichuan Economic Daily, 1 March 2010. (In Chinese) [Google Scholar]
- Ye, Y. Environmental education in Sichuan province. Environ. Prot. 2011, 2, 68–70. (In Chinese) [Google Scholar]
- Sichuan achieved the evaluation standards in the first. Xinhua New. 22 December 2015. Available online: http://news.xinhuanet.com/fortune/2015–12/22/c_1117546357.htm (accessed on 15 August 2014). (In Chinese).
- The models of rural waste disposal in Sichuan province. China Construction News. 11 February 2011. Available online: http://www.gxcic.net/htmlfile/2011–02/shownews_141936.html (accessed on 15 August 2016). (In Chinese).
- Yang, X.; Du, M.; Ye, Y. The current state and solution of rural environmental protection in Sichuan. J. Sichuan Prov. Party Sch. 2009, 2, 52–54. (In Chinese) [Google Scholar]
Figure 1.
Location of the counties sampled in the provinces of Jiangsu, Hebei, Jilin, Shaanxi, Sichuan in China.
Figure 1.
Location of the counties sampled in the provinces of Jiangsu, Hebei, Jilin, Shaanxi, Sichuan in China.
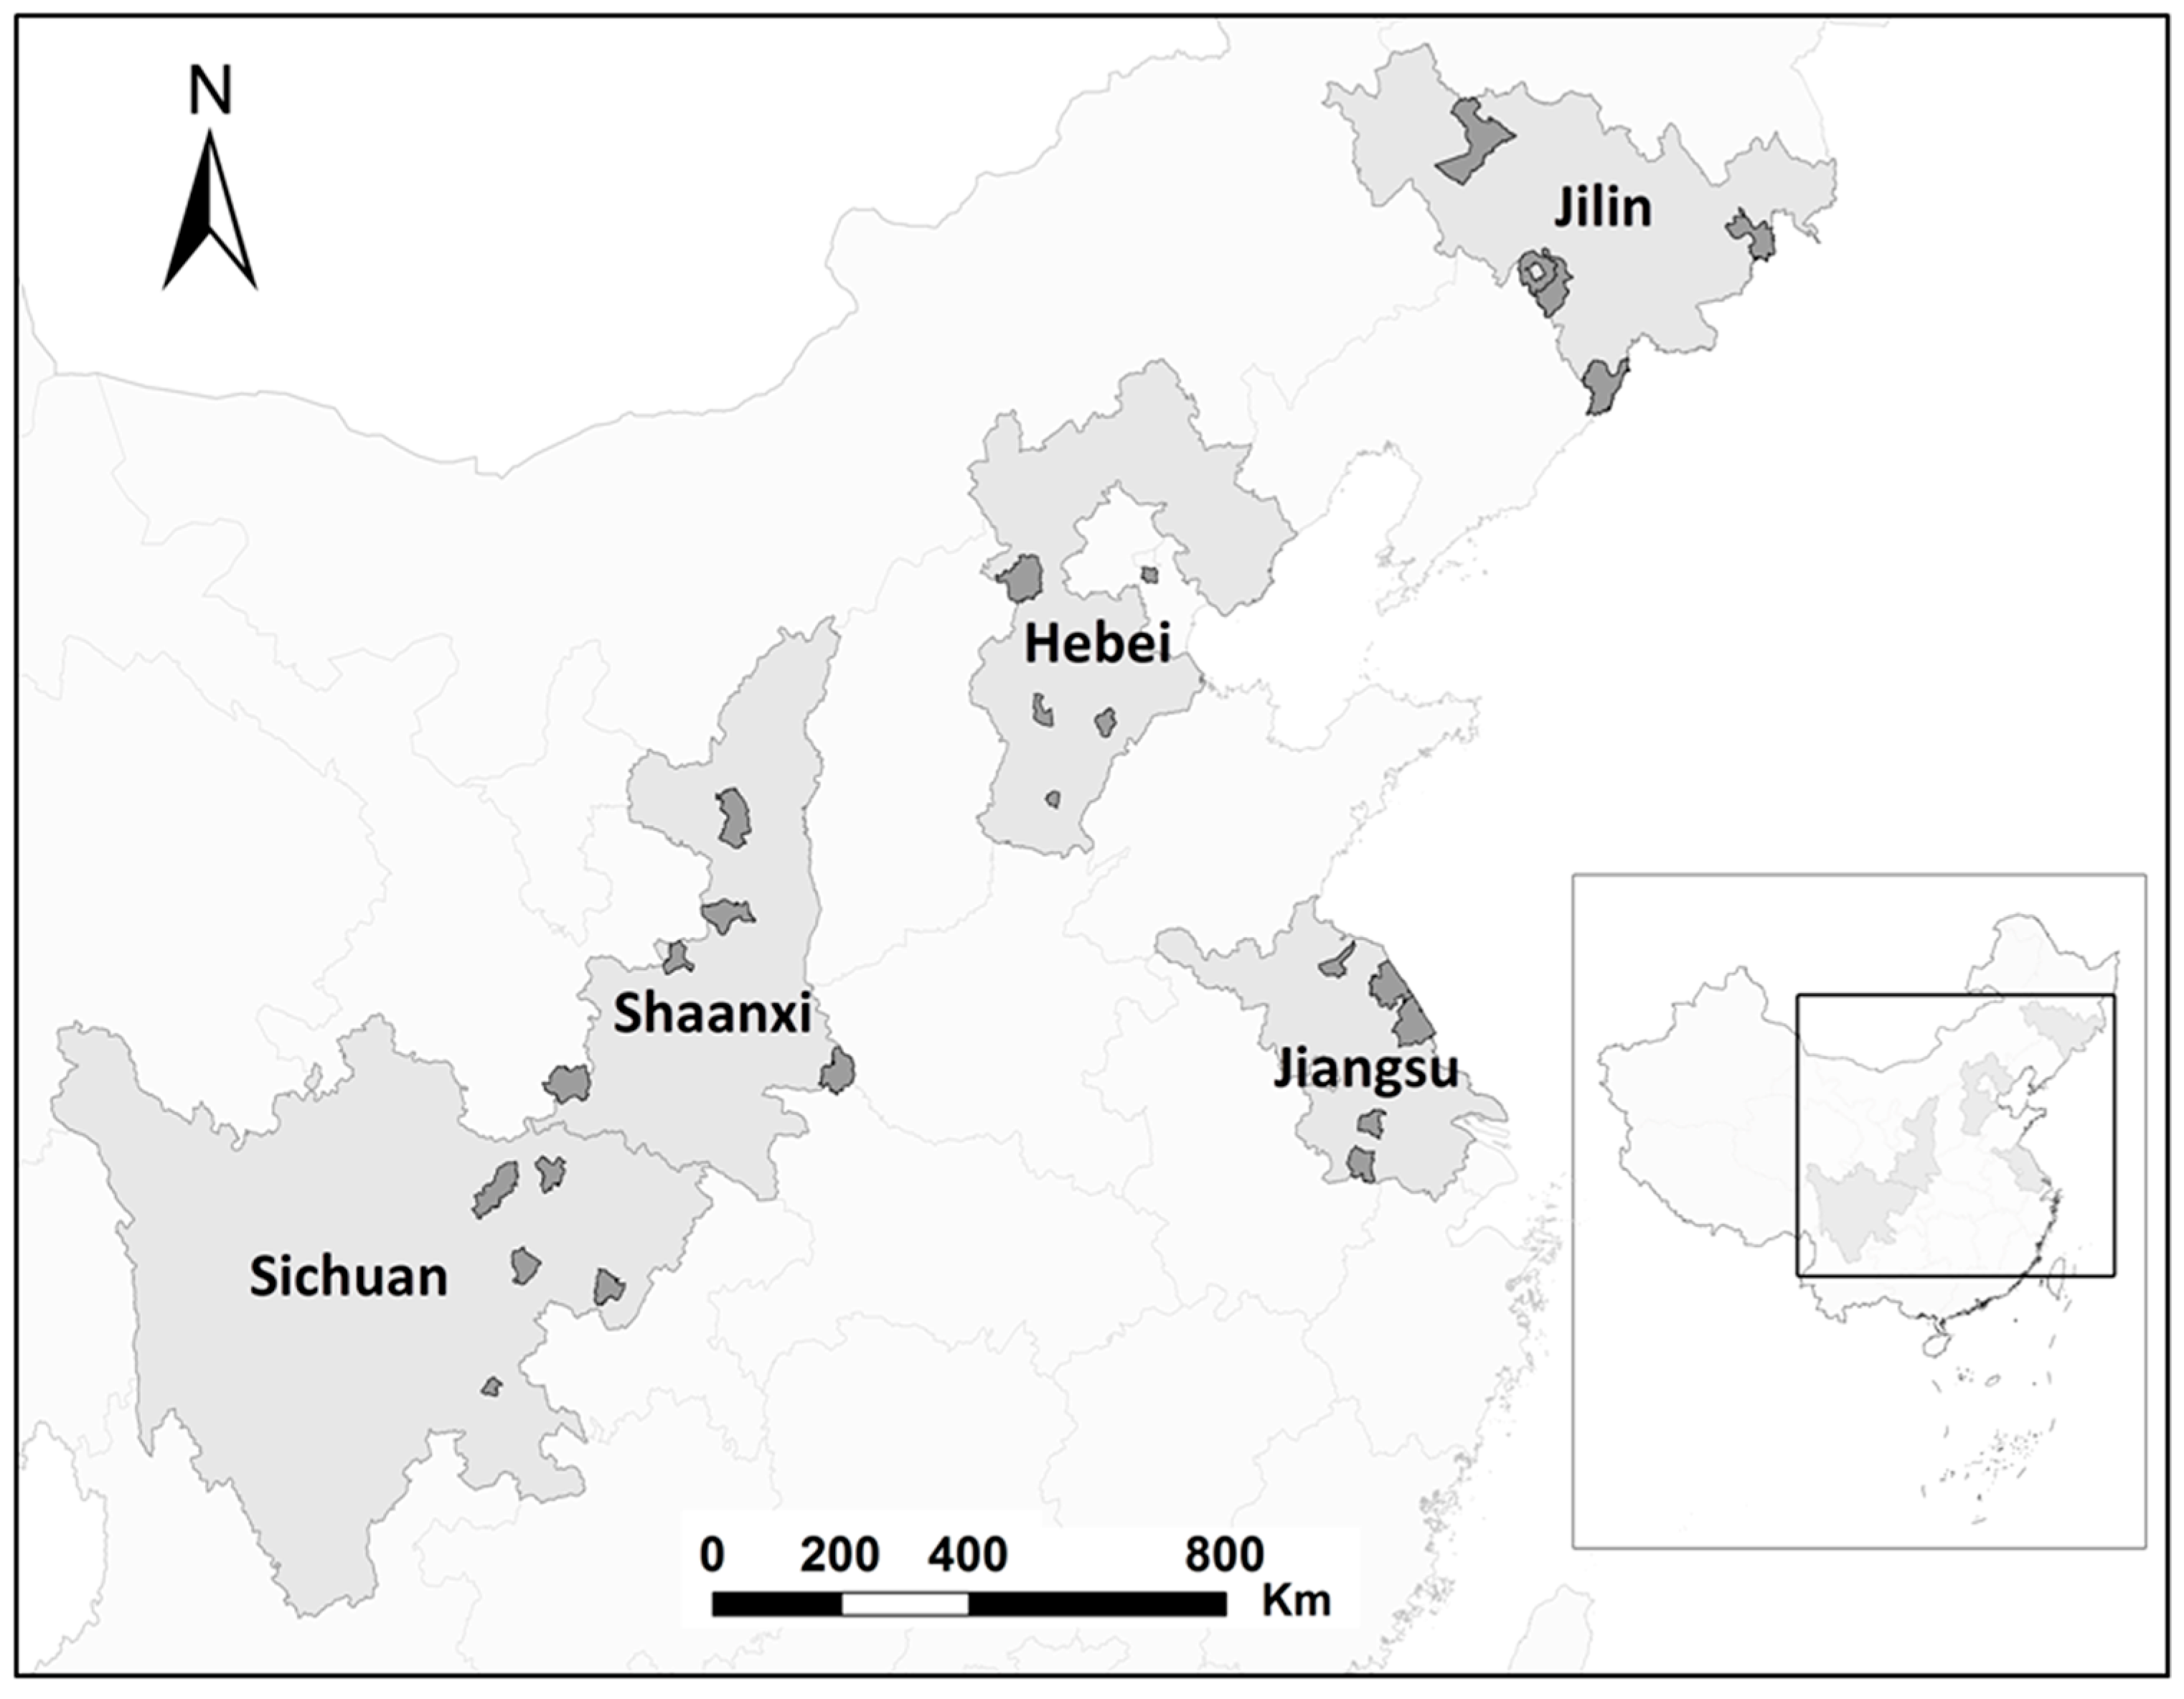
Figure 2.
The situation of rural solid waste management services.

Figure 3.
RSW treatment and disposal methods.
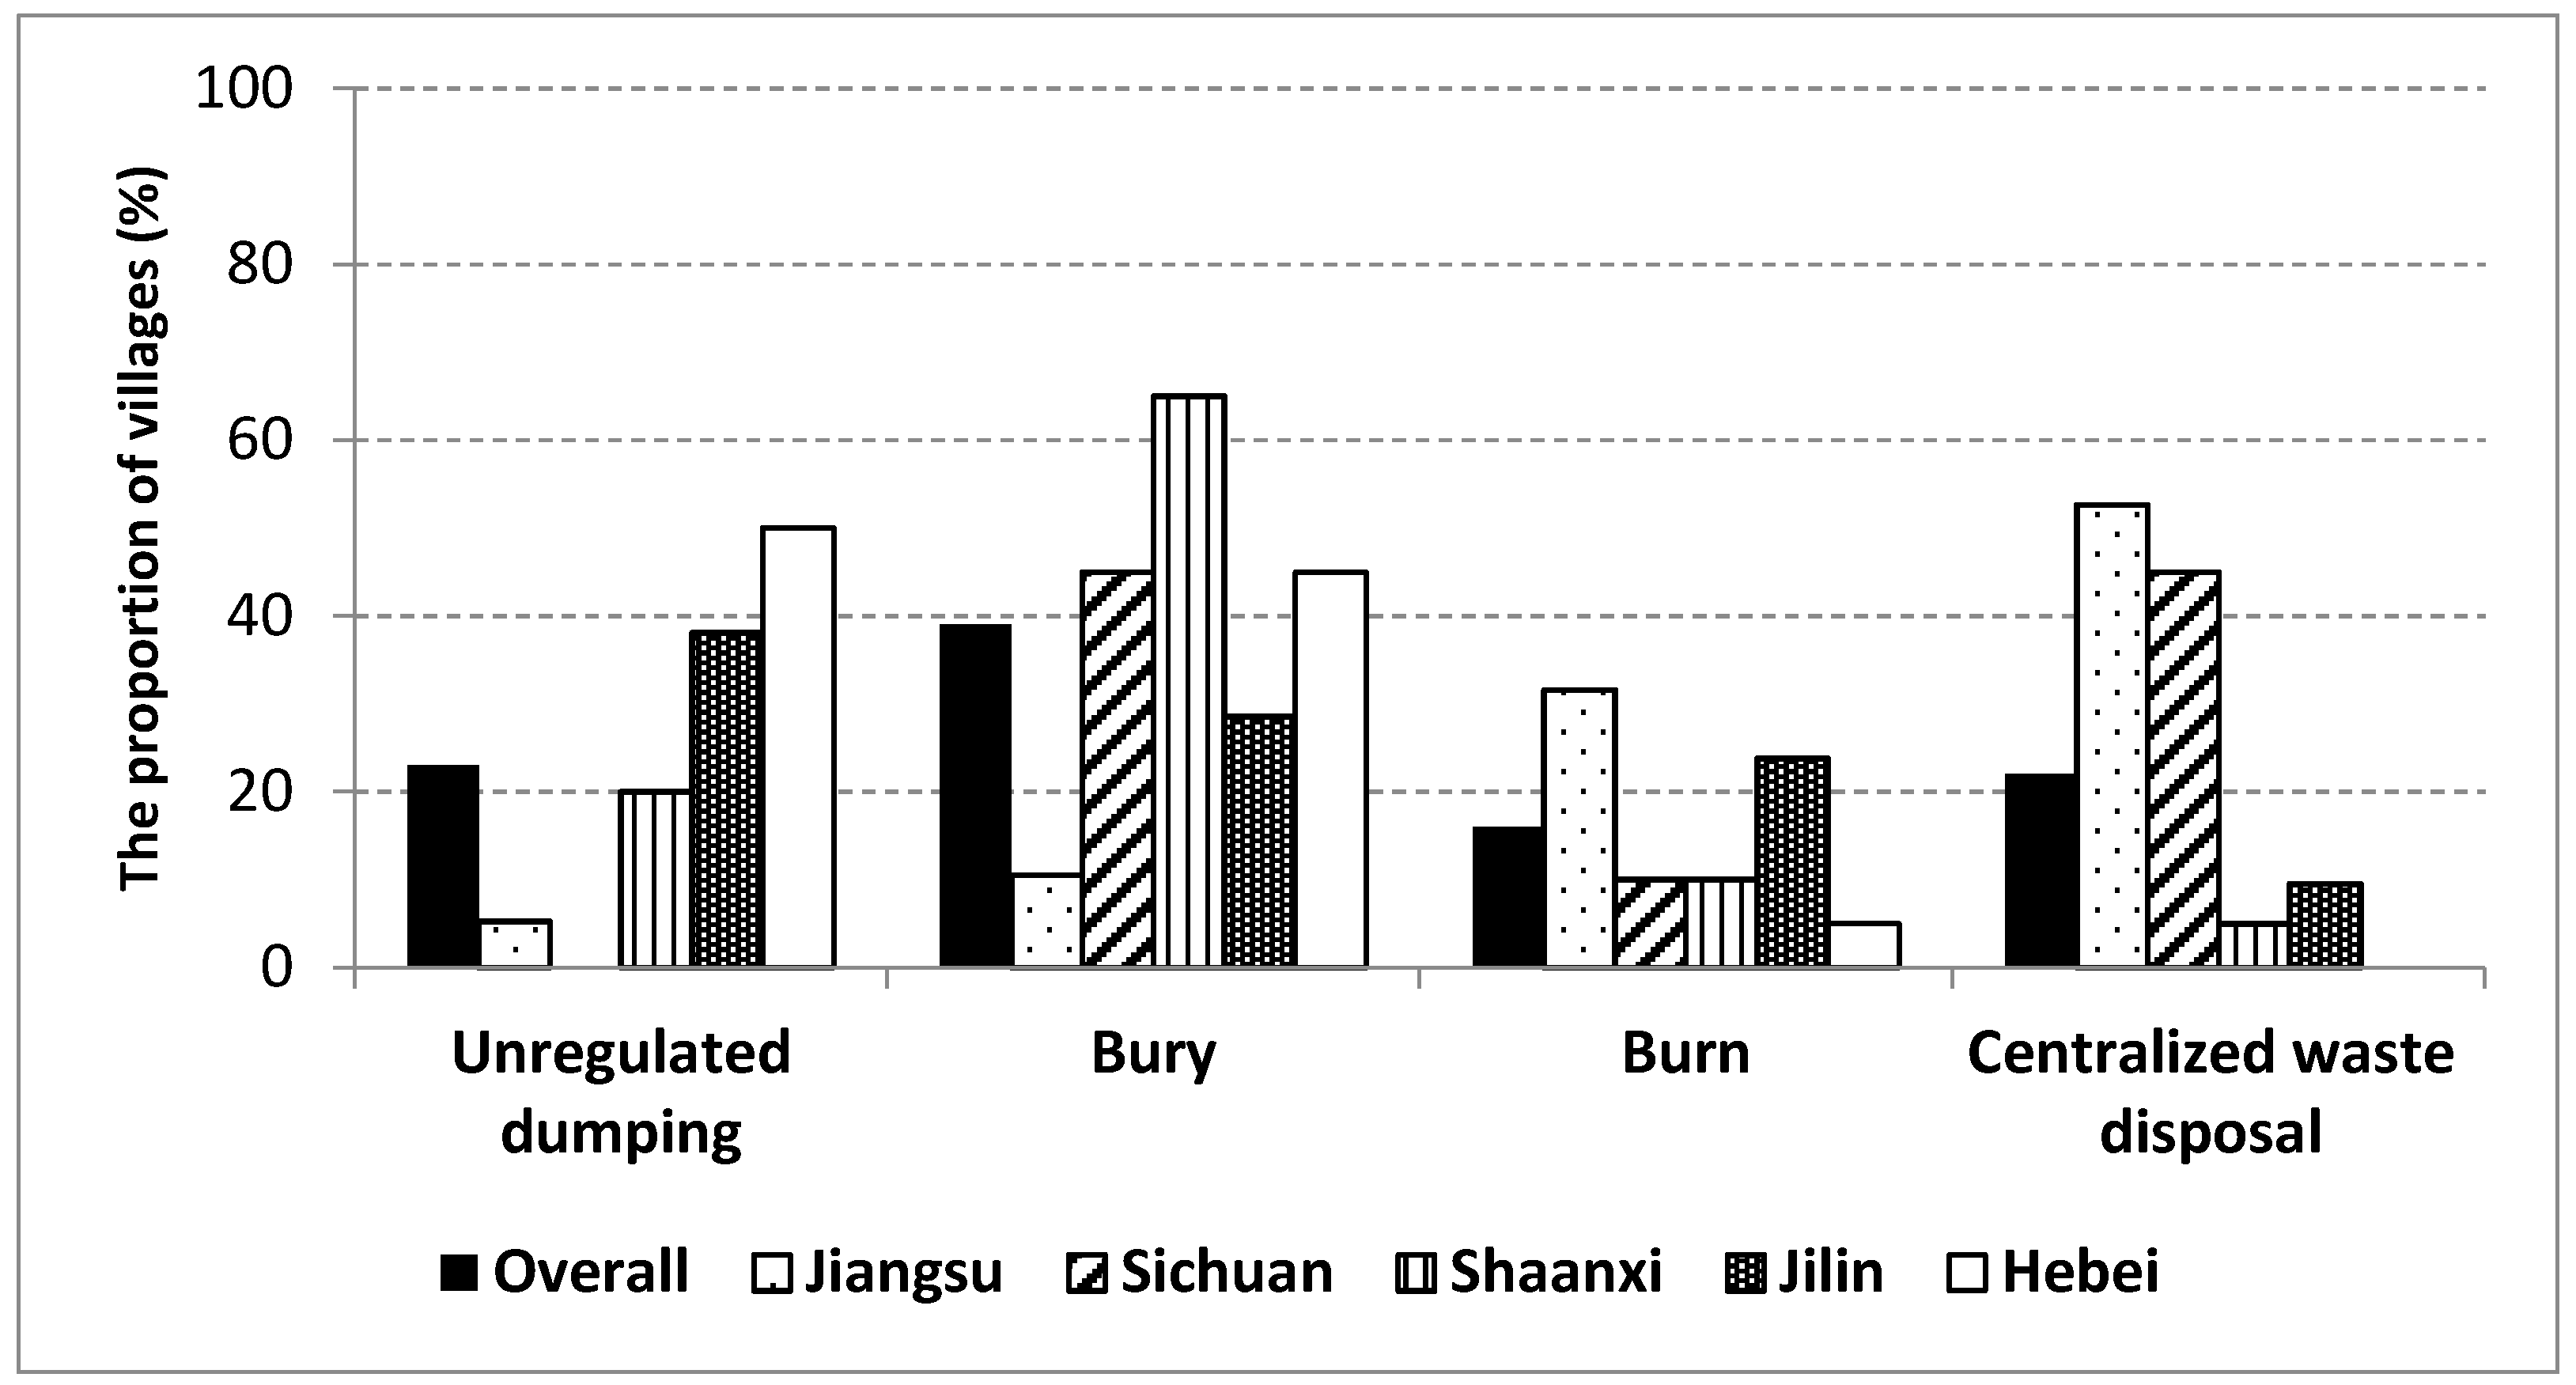
Table 1.
The relationship between the supply of RSWM services * and income.
| Net Per Capita Annual Income (Dollars) | Sample Size | Waste Facilities | Waste Workers | Waste Transportation | Centralized Waste Disposal |
|---|---|---|---|---|---|
| 289.5–390.8 | 4 | 50.00 | 50.00 | 25.00 | 0.00 |
| 390.8–680.3 | 23 | 56.52 | 47.83 | 13.04 | 4.35 |
| 680.3–969.8 | 13 | 84.62 | 76.92 | 53.85 | 15.38 |
| 969.8–1259.2 | 19 | 94.74 | 89.47 | 57.89 | 21.05 |
| 1259.2–1548.7 | 7 | 100.0 | 85.71 | 71.43 | 42.86 |
| 1548.7–4033.3 | 34 | 94.12 | 91.18 | 82.35 | 35.29 |
Note: 1 dollar = 6.9089 yuan. * The data show the proportion of villages providing these RSWM services based on net per capita annual income level.
Table 2.
Village characteristics and the proportion of villages with RSWM services.
| Independent Variables a | Group a | Mean | Sample Size | Waste Collection Services | Waste Transportation | Centralized Waste Disposal | |
|---|---|---|---|---|---|---|---|
| Waste Facilities | Waste Workers | ||||||
| (1) | (2) | (3) | (4) | (5) | (6) | (7) | |
| (1) Net annual per capita income (dollar) | Low b | 3491.7 | 29 | 58.62 | 51.72 | 17.24 | 3.45 |
| Middle | 7378.4 | 37 | 91.89 | 83.78 | 59.46 | 24.32 | |
| High | 15537.2 | 34 | 94.12 | 91.18 | 82.35 | 35.29 | |
| (2) Total Population | Few c | 662.2 | 33 | 63.64 | 48.48 | 33.33 | 9.09 |
| Middle | 1428.9 | 33 | 87.88 | 84.85 | 42.42 | 15.15 | |
| Many | 3143.5 | 34 | 97.06 | 97.06 | 88.24 | 41.18 | |
| (3) Distance from town (km) | Few d | 1.16 | 25 | 100.00 | 96.00 | 72.00 | 28.00 |
| Middle | 4.01 | 39 | 82.05 | 74.36 | 61.54 | 23.00 | |
| Many | 11.24 | 36 | 72.22 | 66.67 | 36.11 | 16.67 | |
| (4) Number of small hamlets | Near e | 2.88 | 26 | 76.92 | 57.69 | 30.77 | 7.69 |
| Middle | 5.71 | 38 | 76.32 | 76.32 | 52.63 | 18.42 | |
| Far | 14.42 | 36 | 94.44 | 91.67 | 75.00 | 36.11 | |
| (5) New leader | No f | 0 | 75 | 89.33 | 84.00 | 61.33 | 28.00 |
| Yes | 1 | 25 | 64.00 | 56.00 | 36.00 | 4.00 | |
| (6) Direct leader | No g | 0 | 2 | 50.00 | 50.00 | 50.00 | 0.00 |
| Yes | 1 | 98 | 83.67 | 77.55 | 55.10 | 22.45 | |
Note: n = 100. a All groups are divided based on village characteristic values in 2015; b We divide net per capita annual income into three groups (1 dollar = 6.9089 yuan). We define a village as part of the “Low” income group if net per capita annual income is less than 695 dollars, the “Middle” group if income ranges between 695 and 1549 dollars, and the “High” group if income is 1549 dollars or more; c We divide total population into three groups. We define a village to be in the “Few” group if the total population is less than 985 people, the “Middle” group if the total village population ranges from 985 to 2050 people, and the “Many” group if a village has more than 2050 people; d We divide distance from village committee to the township government into three levels. We define a village in the “Near” group if the distance is less than 2.5 km, the “Middle” group if the distance ranges between 2.5 and 6 km, and the “Many” group if the village is more than 6 km from the nearest township; e We divide “number of small hamlets” into three groups. A village is considered to be in the “Few” group if the village has less than five hamlets, the “Middle” group if the village has between five to eight hamlets, and the “Many” group if the village has eight or more hamlets; f Village heads are either new (in the “Yes” group) or not (in the “No” group); g Village heads are either directly elected (in the “Yes” group) or not (in the “No” group).
Table 3.
Determinants of RSWM services a.
| Dprobit Model | ||||
|---|---|---|---|---|
| Dependent Variables | Waste Collection Services | Waste Transportation | Centralized Waste Disposal | |
| Waste Facilities | Waste Worker | |||
| Independent Variables | (1) | (2) | (3) | (4) |
| (1) Net annual per capita income (thousand dollars) | 0.1976 ** | 0.1671 * | 2.5049 * | 0.952 |
| (2.473) | (1.675) | (1.655) | (0.0937) | |
| (2) Total population | 0.0000 | 0.0000 ** | 0.0001 | 4.20 × 10⁻⁶ |
| (1.555) | (2.136) | (1.206) | (4.40 × 10⁻⁵) | |
| (3) Distance from town (km) | −0.0004 | −0.0005 | −0.0397 ** | −0.00831 |
| (−0.679) | (−0.466) | (−2.398) | (0.00770) | |
| (4) Number of small hamlets | −0.0009 | −0.0021 | 0.0085 | −0.00282 |
| (−0.948) | (−1.233) | (0.395) | (0.00744) | |
| (5) New leader (1 = yes, 0 = no) | −0.0139 | 0.0024 | 0.1403 | 0.964 *** |
| (−0.793) | (0.168) | (1.045) | (0.0255) | |
| (6) Direct election (1 = yes, 0 = no) | 0.0190 | −0.0035 | −0.1900 | __ |
| (0.853) | (−0.221) | (−1.002) | __ | |
| (7) Province (dummy) | Yes | Yes | Yes | Yes |
| (8) Observations | 100 | 100 | 100 | 79 b |
Note: z-Statistics in parentheses. * p < 0.1; ** p < 0.05; *** p < 0.01, a Each number indicates the marginal effect of a change of +1% in the variable considered; b 21 observations were omitted due to lack of central waste disposal or lack of a directly elected leader.
© 2017 by the authors. Licensee MDPI, Basel, Switzerland. This article is an open access article distributed under the terms and conditions of the Creative Commons Attribution (CC BY) license (http://creativecommons.org/licenses/by/4.0/).
Share and Cite
MDPI and ACS Style
Wang, A.; Zhang, L.; Shi, Y.; Rozelle, S.; Osborn, A.; Yang, M. Rural Solid Waste Management in China: Status, Problems and Challenges. Sustainability 2017, 9, 506. https://doi.org/10.3390/su9040506
AMA Style
Wang A, Zhang L, Shi Y, Rozelle S, Osborn A, Yang M. Rural Solid Waste Management in China: Status, Problems and Challenges. Sustainability. 2017; 9(4):506. https://doi.org/10.3390/su9040506
Chicago/Turabian StyleWang, Aiqin, Linxiu Zhang, Yaojiang Shi, Scott Rozelle, Annie Osborn, and Meredith Yang. 2017. "Rural Solid Waste Management in China: Status, Problems and Challenges" Sustainability 9, no. 4: 506. https://doi.org/10.3390/su9040506
Note that from the first issue of 2016, this journal uses article numbers instead of page numbers. See further details here.