
CO2 Emissions Reduction and Energy Efficiency Improvements in Paper Making Drying Process Control by Sensors


1
Departamento de Ingeniería Mecánica, Energética y Materiales, Universidad Pública de Navarra, Ctra. Tarazona, 31500 Navarra, Spain
2
Departamento de Ingeniería de Construcción y Fabricación, Universidad Nacional de Educación a Distancia (UNED); C/Juan del Rosal 12, 28040 Madrid, Spain
*
Author to whom correspondence should be addressed.
Sustainability 2017, 9(4), 514; https://doi.org/10.3390/su9040514
Submission received: 29 December 2016
/
Revised: 25 March 2017
/
Accepted: 27 March 2017
/
Published: 29 March 2017
Abstract
:The drying process of paper has many production parameters that can influence both the energy consumed and the characteristics of paper produced. It was found that most of the previous studies conducted on this process assume that the conditions of the facilities are always appropriate. The control of the variables associated with air circulating inside the drying hood is essential to obtain a paper with adequate quality and obtain low ratios of energy consumption and CO2 emissions. This article proposes a new indirect method based on the study of the enthalpy of the airflows inside the production hall and thermographic images that helps to analyze the maintenance state of the enclosure hood drying section in a general process, whereby it can also estimate the emissions and energy losses. The combined use of sensors and equipment has helped to identify energy losses and potential savings in CO2 emissions. The developed method is applied to a paper manufacturing plant that has ratios of energy consumption and CO2 emissions very close to the product benchmark set by the European Authorities. The study corroborates that it can be identified as a significant energy loss in paper making drying process. Analyzing facilities that are in apparently good maintenance conditions, leaks are evident. These energy losses are very significant compared with the theoretical energy consumption, and it can affect the paper moisture profile.
1. Introduction
Greenhouse gas (GHG) emissions have become very important in today’s world scene. Currently, there are no doubts about the influence of GHG on global warming and the environmental consequences that this warming has on our planet. GHG can be divided according to Kyoto Protocol into carbon dioxide (CO2), methane (CH4), nitrogen oxide (N2O), hydro fluorocarbons (HFC), per fluorocarbons (PFC) and Sulfur hexafluoride (SF6) [1]. GHG can count aggregated in CO2 equivalent (CO2-eq) units. Countries are trying to reduce these emissions by analyzing their relationship with different production variables in industrial environments [2,3].
According to the International Energy Agency [4], around 29.7% of total energy consumption was due to industries and 36% of CO2 emissions are derived from industrial processes such pulp and paper, chemical cement, iron, steel and petrochemicals. The pulp and paper industry is the fourth largest industrial energy user, consuming about 6% of the total industrial energy used in the world.
Energy has also become one of key cost portions of the pulp and paper production sector, to which we have to add the cost of CO2 emissions associated with this energy use.
Reducing emissions in industrial processes in general and in papermaking in particular can be approached in different ways. It should always be borne in mind that industrial processes should reduce the total amount of direct and indirect emissions and should not change direct emissions due to fuel uses by indirect ones such as electrical energy.
Del Río-González [5] indicates the difficulty in the papermaking industry to introduce new technologies, Best Available Technologies (BAT) or cleaner ones, due to the large investments and technical complexity associated with the papermaking process.
Kong et al. [6] and Laurijssen et al. [7] study reduction of energy use and GHG emissions, evaluating various emerging technologies. There are many drying technologies (impulse drying, impingement, condensing belt, microwaves drying or infrared) that are poorly implemented in around 95% of total paper mill facilities [7], where the steam is used to heat multi-cylinder system to dry paper (excluding pulp dryers) that is still the dominant method in papermaking. Thermal paper drying uses from 70% up to 100% of total steam consumption in the facility, depending of paper machine installation and paper grade. Due to a paper machine being updated usually every 15 years, conventional multi-cylinder dryers will be the predominant drying method in the next years.
Papermaking is a very technological sector, but reluctant to make changes in its machinery and manufacturing structure if the result of their implementation is not sufficiently proven [5]. This fact means that, in most papermaking plants, equipment in general and the dryer section in particular, has a significant age (more than 15 years in most cases). This can cause the deterioration of the facilities and consequently a loss of performance, as well as an increase in the consumption of energy and CO2 emissions associated with the drying process.
Dryer sections in European paper manufacturing uses mainly natural gas as primary energy, according to CEPI [8] and Aspapel [9], to obtain the steam in a steam generator, needed to heat a multi-cylinder section to dry paper. As we explain above, direct CO2 emissions associated to paper manufacturing, mainly comes from the consumption of this thermal energy and has become a problem of global dimensions for two main reasons: environmental pollution caused by fuel consumption and its economic value due to the acquisition cost of the fuel itself.
1.1. Background
Paper drying is a complex process affected by many factors. These factors affect both the energy consumption required to dry the paper and the quality of it. CO2 emissions are affected by both, energy consumption and the type of the paper produced. The relationship between drying section and CO2 emissions has been studied by various authors with different perspectives. Karlsson [10] laid the fundamentals of drying paper process using multi-cylinders’ facilities. Their analysis is taken as the basis for further studies and ideas for improvement, by both scientists and industry.
Drying section was identified by Laurijssen et al. [7] as a large energy consumer in paper mill, mainly due to heating. They also identify optimization measures that can be carried out to reduce energy use and consequently CO2 emissions, such as increasing the dew point temperature inside dryer enclosure hood or increasing the amount of heat recovery in the exhaust airflow to pre-heat incoming air. These authors also establish the heat saving potential in this section at nearly 32% of total energy used. Taking into account that they identify 50% of total energy in paper mill is used to dry paper, the savings potentials may be around 15% of total energy consumed to make paper. According to this analysis, Kong et al. [11] identified the drying section as three of the eight areas in paper production (enclosure hood dryer section, heat recovery from exhaust airflow and humidity control of air contained inside enclosure hood), as the greatest potential areas for reducing energy consumption and CO2 emissions.
For a proper analysis of process performance, it is necessary to identify variables that relate to the efficiency of the process, the energy consumption and emissions produced with product quality. Bhutani et al. [12] establish and quantify energy flows for benchmarking energy uses in the drying section and suggest the use of several indicators as “t steam/t product”, “t steam/t water evaporated”, condensate ratio return, dew point in the hood, sheet consistency after press section, performance of the machine, and OEE (Overall Equipment Efficiency). Kong et al. [11] and Thollander and Ottosson [13] indicate that periodic energy audits on facilities may help in achieving improved energy efficiency of the plant. Calvo and Domingo [14,15] made an approach to assess ”t CO2/t product” as an indicator of process efficiency.
Paper drying parameters also influence CO2 emissions. Barber [16] and Calvo and Domingo [17] analyze the most important operating parameters of the paper production process. Barber [16] finds that the same quality targets can be obtained using different amount of energy and Calvo and Domingo [17] determine the combination of parameters values that can minimize emissions of CO2 and maximize production.
Laurijssen et al. [7] established that energy used for paper web heating from incoming temperature to the hood, and the loss due to heat transfer (convection and radiation), can be between 5% and 10% of total thermal energy used.
Energy efficiency influenced significantly by reusing the energy lost in the drying process. Rouhonen et al. [18] focused on the analysis of uses of secondary heat sources in a paper mill to improve energy efficiency using pinch analysis. One of these uses is to condition the air in the production hall. The study shows the difficult issue to recover heat because heat exchangers are non-linear when condensing flows with condensing components. The study assumes that the relative moisture content of the outlet air remains constant at 100% and finds that the reduction of steam consumption affects the process efficiency, and consequently CO2 emissions.
Air-conditioning inside enclosure hood significantly affects the paper drying process. Tanasic et al. [19] use airflow measures (temperature, pressure and velocity) to understand the mechanics of the movement of hot air inside the production hall. Air temperature varies considerably from section to section along the hall. Vertical temperature distribution is characterized by high temperature gradient and noticeable temperature stratification. Higher temperature gradients are located in areas with significant heat sources, such as drivers, steam pipes and discharge air ducts and found a close correlation between the air temperature and the surrounding air temperature. The airflow patterns in the hall governed by vertical convection flows due to air buoyancy and mechanical ventilation. Air velocity is low, except near windows and roof open areas.
The state of the installed thermal facility, process control operating parameters of thermal energy consumption, and heat recovery of these industrial processes significantly affect CO2 emissions. Enclosure hood is one of the main components of the dryer section. The hood is a facility that covers and isolates from outside the drying area of the paper. According to enclosure hood construction, there are three main types of dryer section: open (almost in disuse), semi-open and closed hood. The latter uses between 15% and 20% less thermal energy in the form of steam to the semi-open [11] and reduces up to 40% of the total energy used for air demand, considering exhaust and blown air and the necessary energy to warm it.
The enclosure hood usually consists of a rectangular shape volume built with removable panels; it has access doors to monitor performance, used by machine operators, and removable panels for full access in case of paper breakdown. Due to the materials that make up the enclosure hood, the process of assembling and disassembling, the hood may lose tightness. This damage causes significant energy losses, which affect the analyzed indicator “t CO2/t product”. The lack of tightness between the panels of the hood makes unwanted airflows. Laurijssen et al. [7] explain that an important variable in the hood system is dew point, which means that no water condensation in the air inside the hood at temperatures above the dew point. Higher dew point means the air can contain more vapor, thus less air is needed to remove evaporated water and higher heat from exhaust air can be recovered. To increase dew point, it is necessary that the enclosure hood is in good condition, otherwise fresh airflow entering the hood through openings between the panels may cause local air temperature to drop and consequently water to condense in the air.
The influence of incoming fresh airflow mixed with the air inside the hood can cause local condensation, which may affect the final moisture content profile of the paper. Mraovic et al. [20] evidenced the high hygroscopic paper capacity, using paper as a substrate to develop low cost and accurate electric capacitive sensors to measure humidity for general applications in different sectors such as agriculture, medical and semiconductor industries to prevent material failure and material fatigue. Hygroscopicity of bound paper with localized condensation can lead to affect the moisture profile of the paper and make necessary additional energy consumption to correct them.
Dew point is a main factor to control; Laurijssen et al. [7] established that increasing it from 55 °C to 70 °C would decrease energy use per kg of water evaporation by more than 8%. One of the main problems for raising the dew point is the isolation of the drying section enclosure hood. Insulation loss, especially to outdoor air supplies, causes local saturated air mixture inside the enclosure and produces localized condensation of water vapor contained in the air, which affects the air humidity in that area and may even fall onto the sheet of paper.
The entropy production in a cylinder was analyzed by Koper et al. [21], who showed the importance of conditioning the air blown into the enclosure hood and the point at which to inject this hot air. Enclosure conditioning and the sealing of leakages affect air circulation inside the hood by the uncontrolled air entry.
Clearly, there are many factors affecting the drying process; most have important effects on energy consumption and CO2 emissions. To limit CO2 emissions, as proposed by the current Kyoto Protocol, adopted by the European Union, the use of energy sources is restricted and the production process is significantly affected. At the launch of the third phase of the Kyoto Protocol, which generally eliminates free emission allowances, makes the monitoring and control of CO2 emissions becomes even more necessary.
1.2. Objectives
This study focuses on analyzing the state of the infrastructure used in thermal drying of the papermaking, called the enclosure hood of dryer section. It will try to determine what percentage of the CO2 emissions produced in the process of thermal drying of paper can be reduced by improving the state of the panels, doors and other elements that comprise the enclosure hood.
The objective also is to validate a method for finding insulation failures through measuring different variables using sensors, which allow improving the efficiency of the process. Indirectly, it must be determined what amount of emissions can be reduced, and how this reduction affects the indicator “t CO2/t product”.
2. Materials and Methods
This study aims to establish a new method of calculating the loss of global energy in an industrial plant through the calculation of the enthalpy added to the airflows, which cross the production hall. We can measure energy losses through the enthalpy added to the airflow, measured as difference enthalpy between inlet and outlet air streams.
As the starting point of study, we have to first identify the incoming and outgoing air from the production hall. The difference in enthalpy between air currents, relating measures to heat sources, enable us to identify the amount of lost energy and apply appropriate reduction techniques to each source.
2.1. Calculation of Airflows
The basis for the study may describe production hall, dimension and volume. It is necessary to locate and measure all inlet and outlet airflows. We distinguish between two types of outgoing flows: due to convection or thermosiphon effect and due to the forced air extraction.
To determinate the first flow through openings due to thermosiphon phenomenon, it is necessary to take into account all facility gaps for inlet and outlet airflows and their relative level (relative height of each one) in order to calculate the differential pressure (ΔP Pa) due to thermal fusion. This effect depends of the difference density of air, related to their different temperatures (inside and outside the hall) (K), and the difference of height between these gaps (Δh). This follows Equation (1):
The calculated airflow through the holes will be the theoretical case of a thin plate (m2), and the flow rate Q (m3/s) given by Equation (2):
To determinate the flow due to force air extraction, it is necessary to known, for each fan, their performance characteristics and their electrical energy consumption to calculate the outgoing flow. We will also measure the main variables of this airflow, as its temperature (Ti) and relative moisture (RH). A Mollier diagram will be used [22] to determine the rest of the features of airflow. The main objective is to determine its enthalpy (kJ/kg), which is used as the basis for calculating the energy provided by facility.
2.2. Calculation of Air Enthalpy
Measuring temperature (Ti) and relative humidity (RH) of the air incoming and outgoing to the hall and in each flow source, we obtain the enthalpy of the airflow. The difference between both enthalpies determined by the Mollier diagram [22] was used to determine the energy provided to the airstream within manufacturing facility. In this way, sources of heat in the installation, as heat airflows, can be identified. In our case, the most significant source of energy, airflows, mainly generates losses of energy in the enclosure that isolate the dryer section.
2.3. Calculation of Thermal Energy Losses, Conventional Manner
To calculate the energy lost by conventional means, convection and conduction, the outside temperature of the closure panels of the hood is determined using thermography images. As a preliminary step of the study, the thermal emissivity of the panels with the value obtained with the digital contact thermometer has been calibrated. For a precise adjustment, thermo-grams with color temperature scale to adjust the average temperatures has been used, and there does not seem to be large differences in the areas provided. Emissivity of aluminum panels and ducts was established as 0.9 using thermograph images and thermometer.
With temperature information provided in thermo-grams, and the thermal map of parts of the enclosure hood, we establish the follow average temperatures for external side:
- Roof hood zone, 45.6 °C;
- Closure panels, 56 °C; and
- Airflow ducts, 75 °C.
To calculate losses in roof hood and side closure panels, heat transfer convection and radiation formulas, according to Aislam [23], specific software developed by Atecyr and Polytechnic University of Valencia and sponsored and distributed by Institute for Diversification and Saving of Energy (IDAE) under Ministry of Industry, Energy and Tourism of Spain was used. With data from the surface temperature of each panel and Aislam software, the TJ of heat loss are determined.
2.4. Calculation of the “CO2 Emissions”, Associated with Consumption and Energy Losses
To calculate the energy added to airflows, we take into account the enthalpy of the air at the entrance of the production hall, with its specific characteristics of temperature (Ti) and relative humidity (RH), and enthalpy of the air in each of their outputs and their characteristics of temperature (Ti) and relative humidity (RH). The difference between the enthalpy of input and output corresponds to the energy added, mainly due to energy losses.
The data used in the study have been compiled with a suitable frequency, and will be compared with those measured according to current Spanish legislation [24,25,26], which mainly correspond to those relating to production and emissions. CO2 emissions associated with energy loss are calculated through the TJ of energy provided to the hot airflows that are extracted forcefully by extractors and fans and lost due to thermosiphon by the openings in the roof of the production hall. Losses of energy/emissions in the exhaust airflows of the hall with the established indicator defined by Calvo and Domingo [14,15] “t CO2/t product” are subsequently calculated to determine the relevance of losses of airflows regarding the defined indicator.
The indicator established by Calvo and Domingo [14,15], “t CO2/t product”, is obtained as a ratio between CO2 emissions verified in each considered period and tons of paper produced in the same period. In this case, we consider the emissions associated with the average annual production of paper, in normal operation, with the emissions associated with the warming of air extraction in the same period.
To quantify CO2 emissions through energy consumed/lost, the methodology referred to in “Calculation of emissions and emission factors” from GHG inventory report [27] for the application of the emissions trading directive, reflected in Equation (3), is followed.
To calculate the data activity (Ad), in the case of global emissions from the plant, we consider:
- The flow of steam supplied in the period and the difference in enthalpy between the supplied steam to the dryer section (provided at the (Tv) temperature and pressure (Pv)); and
- The enthalpy of the condensates returned from dryer section (at temperature (Tc) and pressure (Pc)).
Factor of emission (Ef), oxidation factor (Of) and Activity Data (Ad) from GHG inventory report–8 Annex [27] allow to obtain CO2 emissions,
where Ad (Activity Data) corresponds to the energy consumed (TJ) by the dryer section in the period concerned in the case of direct emissions, and the net energy provided to the extraction airflows in the case of energy losses; Ef (Emission factor) is used as indicated by Spain in the latest national inventory submitted to the Secretariat of the Convention of the United Nations framework on climate change; and Of (Oxidation factor) with the value 1 is used.
2.5. Description of Paper Production Process
The production of paper in the facility has five phases, as shown in Figure 1:
- (1)
- Stock preparation: Recycled paper is mixed with water and chemical products to reach the desirable characteristics both in the quality of the fibers, and flow density.
- (2)
- Sheet forming: The sheet is formed by depositing the stock on a fabric mesh, which removes the water from it first by gravity and subsequently by progressive vacuum means (fourdrinier vacuum system), leaving this section with 75% water content.
- (3)
- Presses section: The water is removed by mechanical means (pressing) reaching at the end of this section a water content of approximately 55%.
- (4)
- Drying section: Thermal processes remove the remaining water, until reaching the final drying target (6.5%). This factor limits production capacity. The machine speed value (Ms) varies in order to achieve the moisture set point of the paper at the end of the current section.
- (5)
- Finishing section: The moisture content of the paper does not change, only superficial characteristics (e.g., smoothness, etc.).
The dryer section removes water from sheet by thermal means. The analyzed dryer section is composed of 38 steam-heated cylinders. The energy contained in steam is transmitted to the sheet in contact with the cylinder dryers. Heating the sheet and water contained causes water evaporation and drying of the paper web. The elimination of the evaporated water from the sheet of the dryer section is done by a ventilation system that controls the variables associated with circulating airflow inside the enclosure. Extraction hood air has a system of heat recovery which minimizes the use of power, and which directly affects the process emissions.
We will focus on this section; the steam to heat the cylinders, in the studied installation, comes from one boiler that uses natural gas as fuel to generate the steam needed to dry paper. The combustion of this natural gas is responsible for CO2 emissions. In this particular case, these CO2 emissions are the only ones subjected to the emission-trading scheme, and correspond to the total direct emissions produced by the factory. Emissions have been checked and compared with annual declaration to environmental authorities by this industrial plant.
This study is based on data from production in 2012, during which the condition of the machines were not changed, and no reforms that alter the production capacity took place.
2.6. Paper Production
The calculation of sub-installation output production to set the indicator in reference periods will be based on the following guidelines indicated in methodological guidelines for ECOFIS for the European Commission [28,29]. The following parameters and variables were collected to determine the amount of paper produced and energy consumption:
- Paper production (Pp, t);
- Machine speed (Ms, m/min);
- Manufactured paper density (Pd, g/m2) (area density, according to ISO 536 [30]); and
- Paper width when entering the drying section (Pwi, mm).
The following paper conditions were obtained, at the entrance and exit of the drying section:
- Water temperature at entrance to the drying section (Twt, °C);
- Paper temperature when entering the drying section (Pti, °C);
- Moisture content of paper when entering the drying section (Pmi, %);
- Paper temperature when leaving the drying section (Pto, °C); and
- Moisture of paper when leaving the drying section (Pmo, %).
The following drying section conditions were obtained:
- Drying section feed steam flow rate (Sf, kg);
- Drying section feed steam temperature (St, °C);
- Drying section feed steam pressure (Sp, bar);
- Temperature of condensates extracted from the drying section (Ct, °C);
- Pressure of condensates extracted from the drying section (Cp, bar);
- Temperature of exhaust air (Eat, °C);
- Moisture content of exhaust air (Eam, % saturation);
- Temperature of the blown-air (Ebt, °C);
- Moisture content of the blown-air (Ebm, % saturation); and
- Outside temperature (Ot, °C).
The parameters indicated above were used in this work, as follows:
Ms, Pwi and Pd were used to calculate sub-facility output Pp in a period and later to calculate the indicator under study.
Sf, St, Sp, Ct and Cp were used to calculate Data of Activity (Ad) (Equation (3)).
2.7. Sensors and Equipment
To perform this analysis, we have used the machine’s control instrumentation based on Beckhoff hardware with a SCADA Wonderware display system, “Smart Control” Quality Control System (QCS) and Process Control System. This is equipped with the sensors indicated in Table 1 and Table 2.
Endress + Hausser TT RTD Pt100 sensors for measuring the temperature at various points around the paper machine, and Endress + Hausser PT EL 2610 sensors for measuring pressure, an Optris CT-LT for measuring the temperature and MCT 360 infrared moisture transmitter to determine moisture content of the paper incoming to drying section were used.
To measure temperature and moisture content of the paper leaving the drying section, Scampro DS-30 infrared sensor with a Scampro SA-150 signal processor and an Optris CT-LT temperature sensor were used. This sensor is used to determine Twt, Pti, Pmi, Pto, and Pmo, and paper produced (Pp) characteristics to ensure that thy comply with the moisture specifications.
To determine Ad (Activity Data), steam flow rate and energy measures (Sf, St, Sp, Ct, and Cp), Spirax Sarco FM Giflo ILVA DN150 flowmeter, with M280 signal processor, which compensates for pressure and temperature, was used.
Temperature and moisture content of hood air extraction (Eat, Eam, Ebt, and Ebm) are measured using Spirax Sarco thermo/hygrometer.
The Scada is equipped with a system for measuring the energy consumed by the boiler burner composed of a G-250 Elster TRZ2 turbine and an Elster EK-230 volume converter (with pressure and temperature compensation).
The production data were gathered continuously by the Scada system with a built-in sensor that continually measures the density of the paper with its KR NER-8170 sensor, equipped with a radioactive source of krypton 85. A sensor continuously measures the moisture content of the paper length- and cross-wise, and encoder gauges determine the width of the sheet (Pwi) and the speed of the machine (Ms), which together with the density (Pd) enables calculating the paper production (Pp).
We also used the following portable instruments: an anemometer Almemo 2590-3S, to measure speed flow of air in open areas (windows and roof openings); a thermo-hygrometer Almemo 2090-1 to measure moisture content; atmospheric conditions and pressure were determined using a digital manometer Comark C9553; temperature was determined using the digital thermometer Almemo 2390-3; athermal Imaging Camera FLIR E60 was used to obtain thermal images of enclosure hood; an Almemo 2390-3 was used to calibrate the emissivity of thermal images taken by FLIR 60; and, using thermal images, the superficial temperature of each of the areas of the hood panels was determined by Aislam software [23] to estimate the energy losses due to conduction and convection by conventional methods, and transfer to the airflow.
2.8. Study Airflows
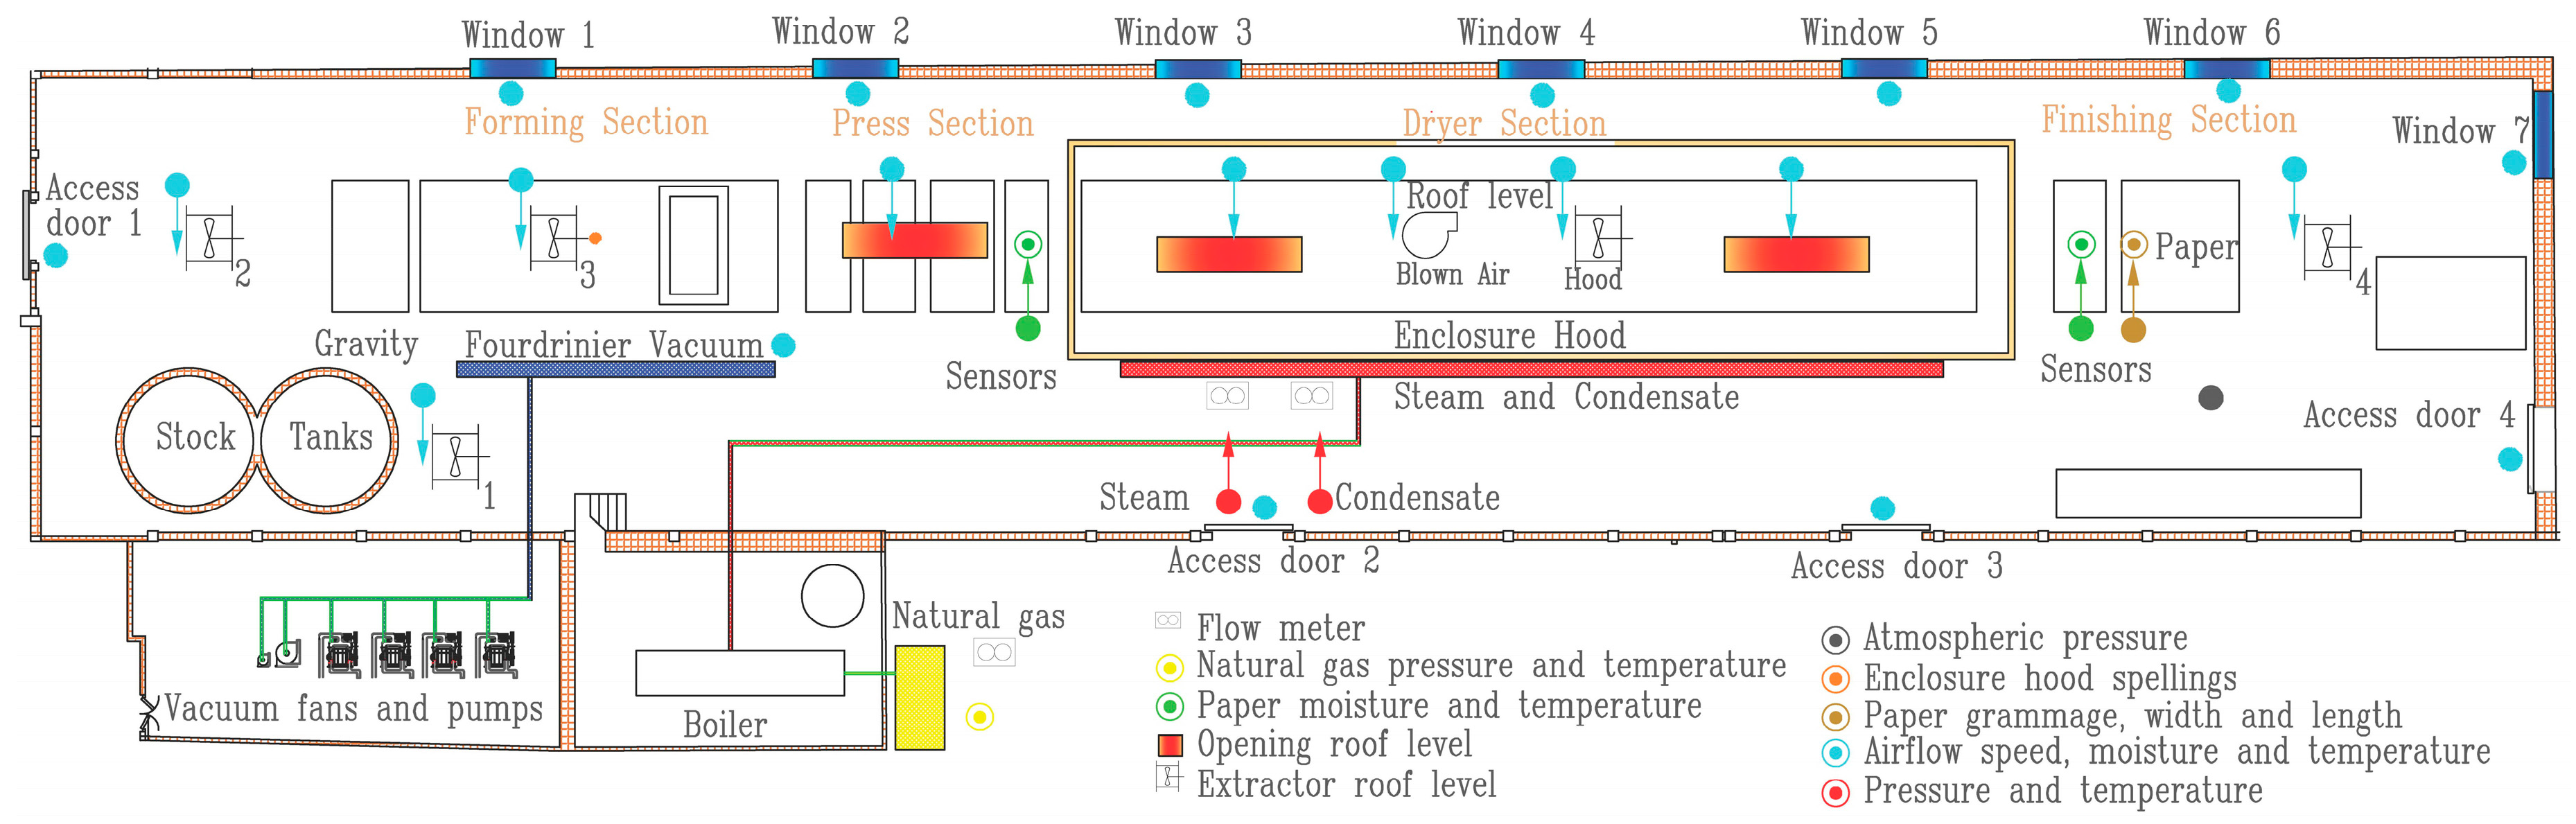
The production hall is rectangular shape, 142 m long and 17 m wide. It has a gabled roof in which the ridge is located in the center, and total height from the ground is 9 m. The total volume of the facility is 18,126 m3. This building has next air extracting flows: four exhaust fans located on the roof and ceiling openings responsible for thermosiphon.
A detailed plan of the installation and the sampling points can be seen in Figure 2. Indicated exhausts have known characteristic curves, electrical energy consumptions, and all other data necessary to determine the operating point of the fan airflow rate (in m3).
Air temperature in the production hall, measured at 1.5 m in height from the ground, remains constant and independent of the outside temperature. Several measures were taken for several days, along the inside perimeter of the production hall to compare them with the outside temperature; the temperature inside is kept at 20 ± 2 °C while outside temperature varies from −2 to 20 °C. Air temperature is increased inside significantly above this temperature.
Air density is significantly affected by temperature. All calculations refer to an outside temperature of 13.5 °C in the geographical area where the plant is located. The operation of the mill remains unchanged throughout the year. According to the methodology explained in Section 2.1, the exhaust flow due to extractors and vacuum system is obtained (Table 3).
To determine the thermosiphon flow through openings, we first have to identify all intake air gaps at different levels (Table 4). This effect depends on difference of the density air, related to the different temperatures of the air (inside and outside the hall, considering average temperature in the geographical area) (K), and the height difference between these gaps (Δh). This follows Equation (1). Using Equations (1) and (2) a flow rate of 6.72 m3/s through the holes is obtained.
Other airflows to consider are the inputs of the drying enclosure hood. The enclosure hood has two hot air exhausts from inside and a fan that blows hot air, which is heated using the energy contained in the exhaust airflow stream. The extractors, the fan blowing, and all technical features, including curves of airflow consumption (in m3), are indicated. The airflow must be determined based on the power electric consumption of the motor and the own characteristic curve of the fan operation. The difference between extracted air and blown air is determined as 7.08 m3/s. This airflow is used in the process and is not taken into account in the calculation of the emissions associated with it. Analysis of the internal conditions of the enclosure hood and the flows of air and heat energy supplied in the form of steam are outside the scope of this study.
The dryer section, as shown in Figure 3, is insulated from the outside by an enclosure hood built with panels composed of two layers of 0.7 mm aluminum, with rock wool inside and mounted on a fixed structure. For monitoring operations, it has automatic doors in the area called control or supervision and other manual doors on the opposite side. It also has side panels and removable closure ceilings for maintenance operations.
This study analyzes all airflows in the production hall, where the drying section of the paper enclosure hood is located. With psychrometric Mollier diagram [22], we determine the total enthalpy (Et), from the known variables of dry bulb temperature (Ti) and relative humidity (RH), for each workflow. The facility where the dryer section is located does not have heating system, so the energy source, which varies with outgoing currents of air enthalpy, comes from heat loss of the drying enclosure hood.
Moreover, the enclosure hood (long 38.9 m × width 5.2 m × height 4.9 m) is located in the production hall. This hood is built with aluminum insulated panels. To estimate insulation hood spellings by conduction and convection means, we taken into account:
- The total area of the enclosure hood (432.18 m2 lateral and 202.18 m2 of roof surface); and
- The surface of the exhaust air ducts to the exchanger and ducts through hot air is blown into the hood (long 27.7 m × width 1.5 m × height 1.0 m); both of them are located in the production hall (total surface area: 136.5 m2).
Temperature measurements have been taken at various points in the production hall, when the activity is stopped, when the outside temperature is below and above average. In all cases, the temperature inside, due to the large number of open holes and airflow, is the same as the outside; thus, we consider the production hall has the same average air temperature as outside.
3. Calculations and Results
The theoretical study is applied to calculate the heat losses of a manufacturing paper plant. Paper machine has a capacity of 55,000 t per year, uses as raw material 100% recycled post-consumer paper, and produces paper called Uncoated Core board with weights between 200 and 650 g/m2 according to ISO 536 [30], the standard reference in the field of paper manufacturing.
The study analyzes the status of an enclosure hood to quantify energy losses in the installation due to faulty insulation, loose panels of enclosure hood due to improper adjustments of parts, and deterioration of access systems such as automatic doors, manual doors, panels, etc.
Energy Added to Airflows
With data considered, losses of insulation were obtained in the hood 571.2 kWh (2056.3 MJ) and ducts 99.45 kWh (325.62 MJ) MJ thermal. If the performance of heat generation is applied, total losses of 838.31 kWh (2570.35 MJ) in primary energy, natural gas in our case, are found.
Other factors to be taken into account and that generate heat in the production hall constitute the operation of the paper machine itself and fluid transfer pumps. For each drive, electrical power, load and type of service (continuous or not) are considered. Total power installed is 1286.5 kW and consumption is 975 kWh (3510 MJ). According to manufacturer data, the contribution of thermal energy to the air currents is set to 60.90 kWh (219.24 MJ).
Following Section 2, Table 5 shows the departure for each airflow, while Table 6 shows the results of the calculations of the energy for each of the outgoing production hall airflows as well as the energy of the air inlet to compensate these outputs.
Airflows corresponding to vacuum fourdrinier or inputs of enclosure hood are not the object of study. As can be seen, the production hall is in a state of deep depression, which causes strong currents of cold air coming from the outside. The information contained in Table 5 shows a total airflow deficit of 43.33 m3/s.
Taking into account the enthalpy of each flow, energy, added to the air inlet to the facility and leaving it by the extractors and the opening of the ceiling, is 3302.3 MJ. These MJ originate from the losses of isolation of the enclosure hood. The energy of the enclosure hood comes from the energy produced in the steam generation boiler and supplied steam to the drying section. This steam generation boiler only uses natural gas as energy source. Emissions can then be calculated using Equation (3), which takes into account the contributed TJ of energy to the air and emission factors associated with the consumption of natural gas, needed to heat the air.
The average production of paper of the analyzed factory is 5.75 t/h. The steam generated in a single boiler is the only source of energy used for thermal drying of the paper. The factory has a single supply of natural gas and one boiler to generate steam for the drying section.
In Table 7 and Table 8, the minimum period considered is an hour because the machine in paper production under study refers its production to one-hour periods. For annual emissions calculation associated with the process and lost, 8040 h, the time that the factory was working during 2012, is considered. We will not estimate the energy of vacuum system airflow in the balance because the temperature of the stock at the entrance to the forming section is 29 °C, similar to the extraction temperature of the air in this section.
Considering the balance of exhaust airflow from the production hall, the total energy added to these airflows comes from the difference between energy contained in inputs and the outputs by extractors and roof openings. Airflow ejected from the inside of the hood to atmosphere by extractors is outside the scope of this study. The heat added to the airflows comes mainly from the steam supplied to the dryer section and not by the loss of insulation of the closure panels of enclosure hood.
The average consumption of energy to produce one ton of paper in this paper mill is 4284 MJ. Comparing these data with energy losses in the exhaust air (see Table 7) corresponds to 12.51% of the total energy used in thermal drying of the paper. To validate this new method, Table 6 shows the results obtained by calculating thermal energy losses in conventional manner, in which losses are calculated for only conduction and convection, as explained in section 3.3. If we compare these data again with total drying paper energy consumption, the energy lost by isolation accounts for 12.97% of the total energy supplied to the dryer section. The numerical difference between the two methods is small enough to consider this method of analysis valid.
The airflow evacuated by extractors 1–4 and roof openings are offset by air incoming from the outside of production hall by the gaps described in Section 2. The energy to heat these airflows comes from the losses of the dryer section hood insulation.
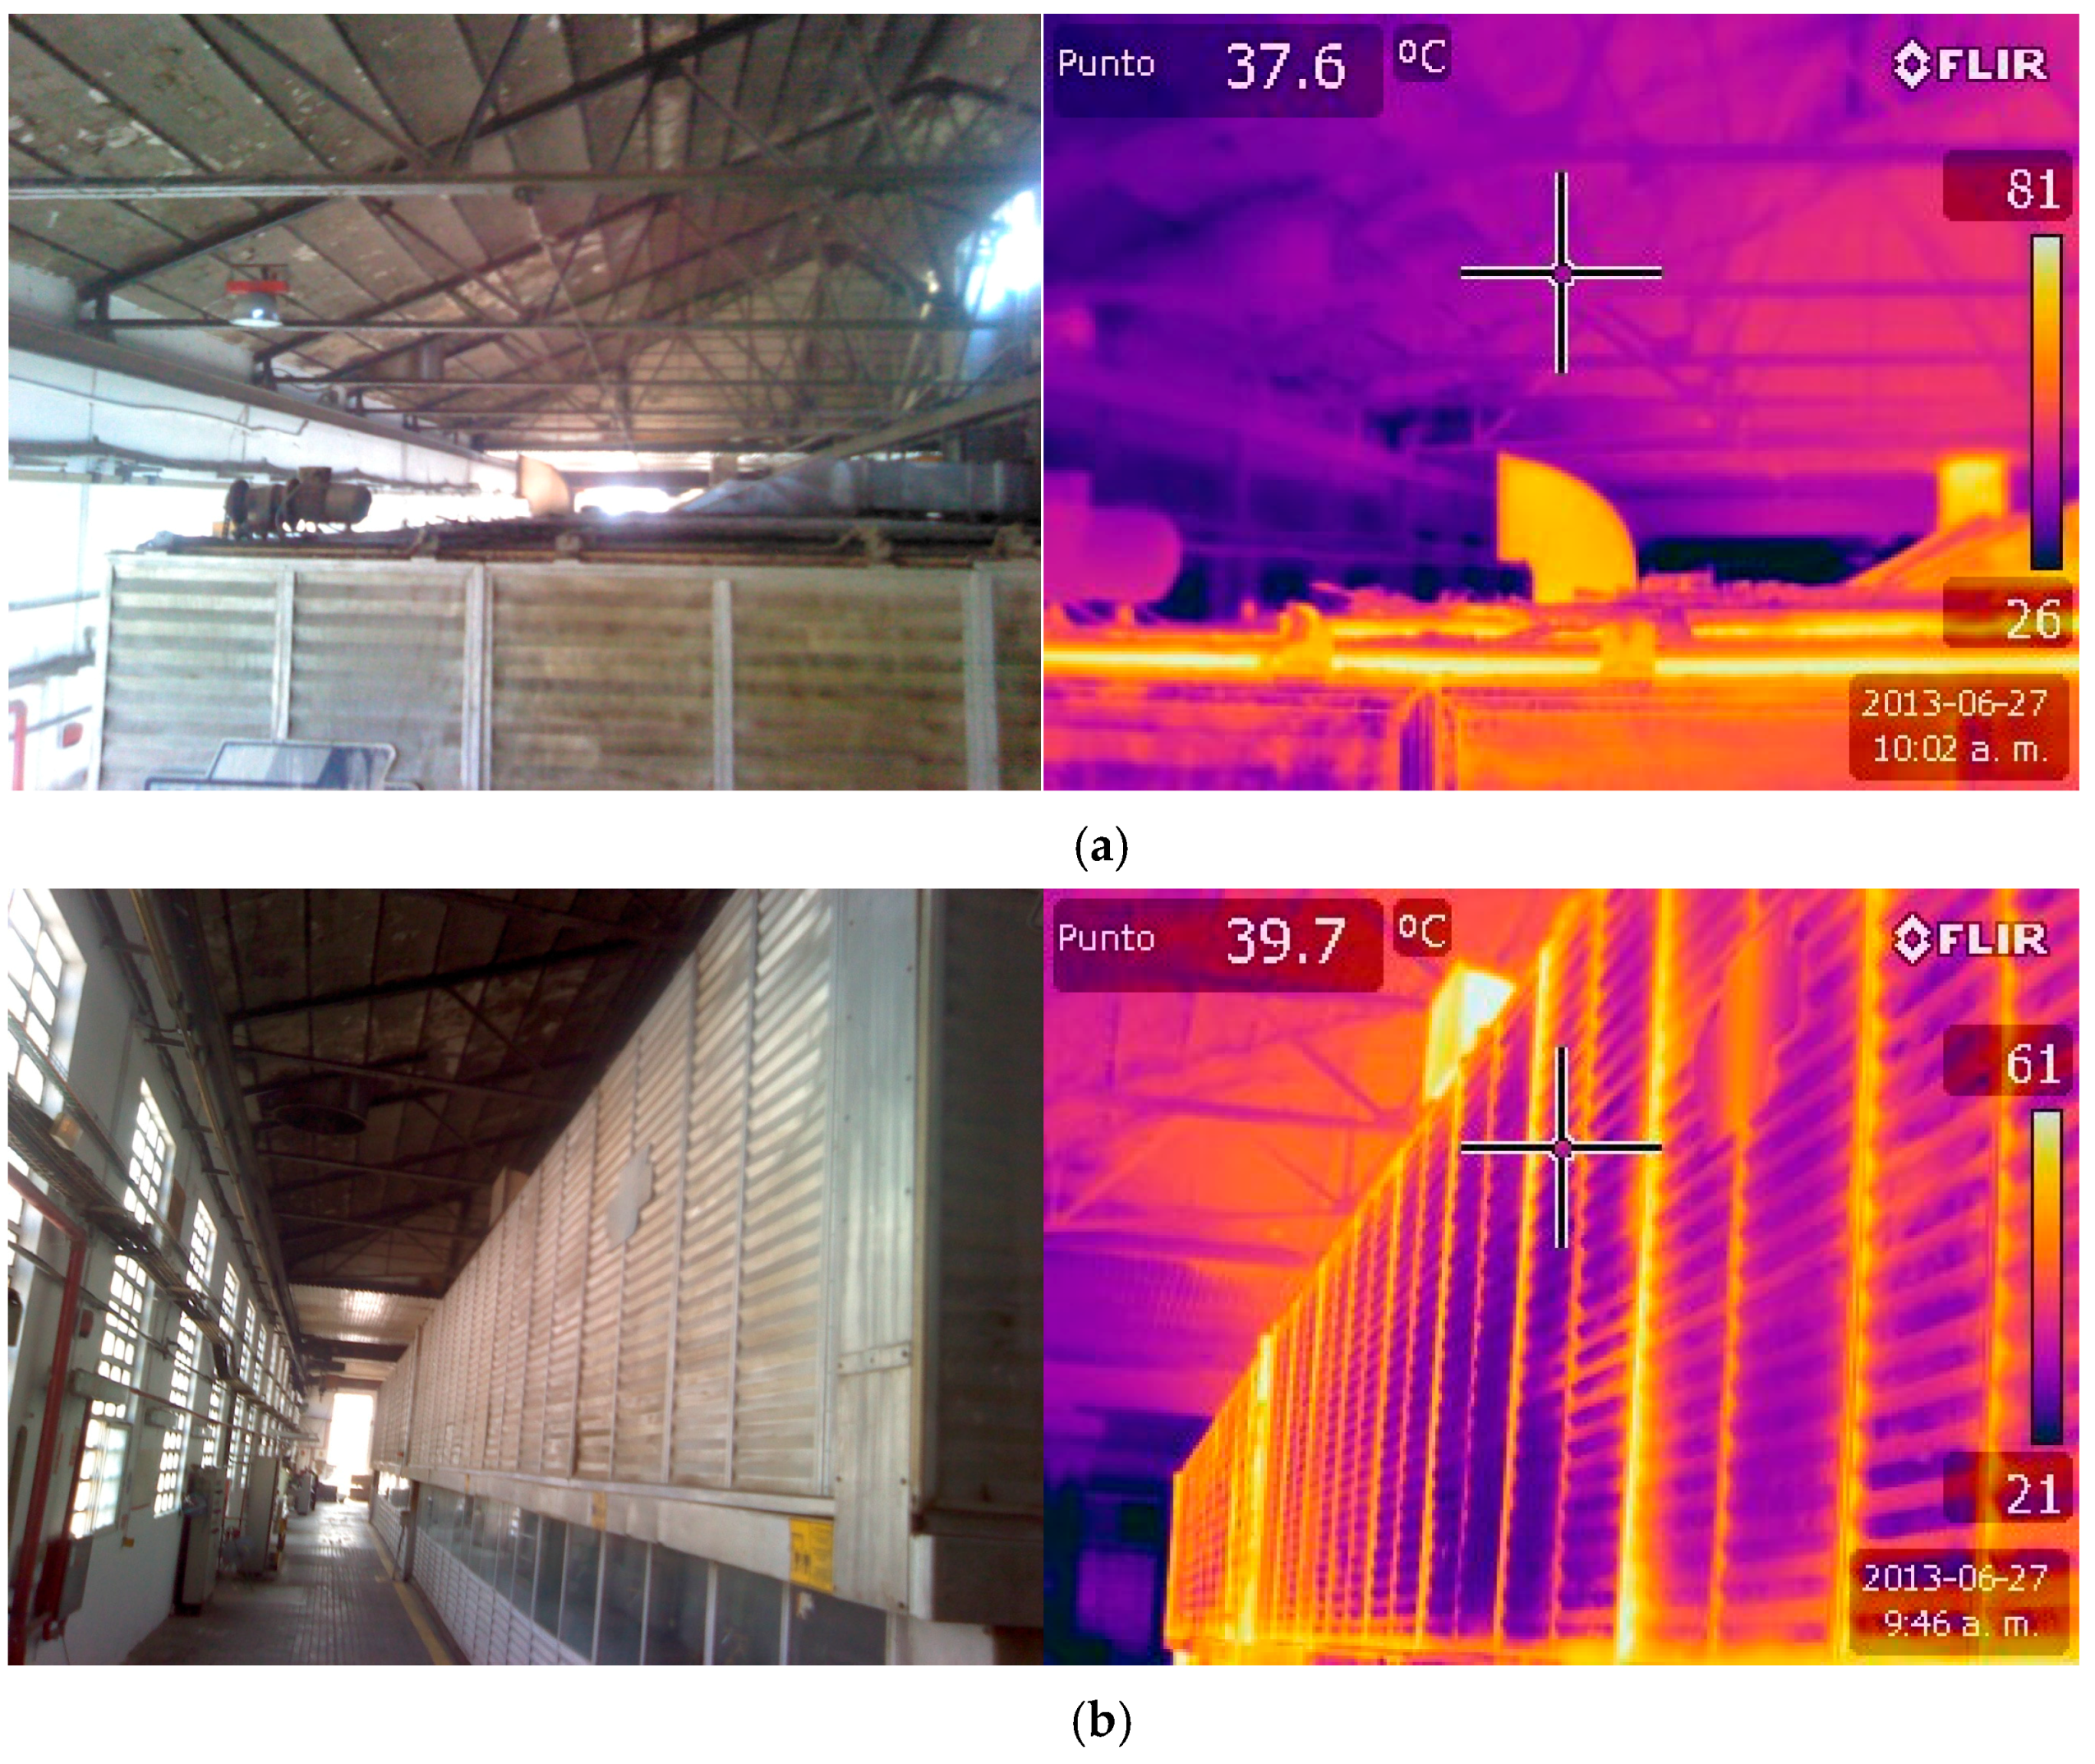
We use thermographic images to determine the temperature of panels and enclosure hood loss openings, mainly located in doors and roof of enclosure hood. In Figure 3 can be seen the outdoor status of hood, which is seemingly correct. In Figure 3, we can also see the thermo-graphic images in the upper area of the enclosure hood and the area next to the number 4 exhaust. This technique could identify areas of major losses of energy, which may allow planning an adequate maintenance of the system to reduce the losses quantified in Table 7.
4. Discussion
The relationship between the “t CO2/t Production” indicator with efficiency and sustainability of the continuous production process plant has been sought from various aspects such as related to a manufactured product, operating production parameters, maintenance issues, management information and performance indicators of the process [14,15,17]. It has been found that the outside temperature (Ot) [14,15] affects input airflows and the indicator “t CO2/t Production”. The state of enclosure hood systems sealing maintenance also affects variables such as dew point, air temperature blown (Ebt) onto the hood and the amount of air required to evacuate the removed moisture of the paper itself.
Air temperature of manufacturing facility is around 20–21 °C, and is independent of the outside temperature (Ot) because the analyzed production hall, where the production process is located, does not have an air conditioning system (heating or cooling air system). The heat supplied to the air production hall inputs mainly comes from the heat losses of the drying enclosure hood and to a lesser extent of losses of heat evacuated by electric motors, lighting, etc. In Table 5 and Table 6, it can be seen that the energy added to the airflow entering the production hall and exiting flows by exhausts and openings of the roof has a significant value compared to the total energy used in the drying process of paper.
In Table 7, it is clear that these losses, calculated by the method of added energy to the airflows correspond to 12.51% of the total energy used in the thermal drying of paper. This value was also validated by traditional methods: in Table 8, the results of calculating the thermal energy losses by conventional method, conduction and convection, is 12.97% of the total energy supplied to the drying section. The difference between these methods is 3.6%, small enough to consider the calculation using the new airflow method valid.
In Figure 3, we can see that, in the non-thermal images, the general state of the enclosure hood, apparently, is not evidence of significant deficiencies that can make us sense the magnitude of these losses. Looking in detail at the thermal images of the same points, insulation faults are detected. Losses are located mainly in the doors and roof of the drying enclosure hood elements, which are used for process control and maintenance operations. It can be appreciated in Figure 3a, which shows the image of the top of the enclosure hood and air extraction ducts, with a temperature at the top of the roof similar to the exhaust ducts and, in Figure 3b, corresponding to supervisions side of the enclosure hood, the front panel output paper of the drying section.
5. Conclusions
Energy efficiency significantly affects the current production processes, both in economic terms, due to the cost of energy, and in the environmental aspect, as the associated emissions. Industrial production plants need to find ways to improve their efficiency, and this process should not stop when major reforms are undertaken on the plant.
This article has used an indirect method of thermal energy, adding the airflows circulating in the production hall, to assess the losses of thermal energy in the papermaking drying section. The method, when compared to the traditional system of calculating energy loss by conduction and convection, obtained similar results.
Once the lost energy is known, heat sources are located. To carry out this, we use a system widely used in other sectors, but not used for this type of maintenance. Based on the study of thermal imaging of the various sections of the enclosure hood images, we reveal failures of closure and damage in the facility due to operation and maintenance activities to machinery located inside the enclosure hood.
The use of thermo-graphic imaging has had a dual purpose in this method. First, it has served to establish the average temperature of the insulation panels of the hood, and then as a tool to find major gaps or damaged insulation areas in the enclosure hood dryer section. Maintenance personnel can also use these images to find major loss areas and to prioritize repairs to reduce energy consumption. This identification also revealed the main losses of the enclosure hood, for example the area near extractors and holes in the roof (see Figure 3). Thermo-graphic images show the status of the enclosure hood. With these images, the repair actions can be prioritized according to the area and temperature difference between the section and temperature of the production hall area. This method identifies areas where the insulation is not in good condition or is even non-existent, resulting in measurable energy losses transmitted from inside the enclosure hood to outside.
These losses quantified and compared with total thermal energy consumption account for 12.51% of total plant emissions, so the impact on the concerned indicator is very significant. The combined use of sensors and equipment has helped to identify energy losses and potential savings in CO2 emissions, as well as to improve the drying hood design (shape and size) and to reconsider the material used for the drying hood manufacturing.
Acknowledgments
The authors would like to acknowledge the financial support of the Spanish Ministry of Economy and Competitiveness, Project DPI2014-58007-R.
Author Contributions
All authors contributed equally to this work. All authors have read and approved the final manuscript.
Conflicts of Interest
The authors declare no conflict of interest.
References
- Intergovernmental Panel on Climate Change (IPCC). The Fifth Assessment Report. Intergovernmental Panel on Climate Change; IPCC: Geneva, Switzerland, 2014. [Google Scholar]
- Aguado, S.; Alvarez, R.; Domingo, R. Model of efficient and sustainable improvements in a lean production system through processes of environmental innovation. J. Clean Prod. 2013, 47, 141–148. [Google Scholar] [CrossRef]
- Domingo, R.; Aguado, S. Overall Environmental Equipment Effectiveness as a Metric of a Lean and Green Manufacturing System. Sustainability 2015, 7, 9031–9047. [Google Scholar] [CrossRef]
- International Energy Agency. Key World Energy Statistics; IEA: Paris, France, 2016. [Google Scholar]
- Del Río-González, P. Analysing the factors influencing clean technology adoption: A study of the Spanish pulp and paper industry. Bus. Strateg. Environ. 2005, 14, 20–37. [Google Scholar] [CrossRef]
- Kong, L.B.; Hasanbeigi, A.; Price, L. Emerging Energy-Efficiency and Green-House Gas Mitigation Technologies for the Pulp and Paper Industry; Lawrence Berkeley National Laboratory: Berkeley, CA, USA, 2014. [Google Scholar]
- Laurijssen, J.; Gream, F.J.; Worrell, E.; Faaij, A. Optimizing the energy efficiency of conventional multi-cylinder dryers in the paper industry. Energy 2010, 35, 3738–3750. [Google Scholar] [CrossRef]
- Confederation of European Paper Industries (CEPI). Sustainability Report 2013; CEPI: Brussels, Belgium, 2013. [Google Scholar]
- ASPAPEL. Pulp and Paper Sector’s Sustainability Report. Spanish Asociation of Pulp; Paper and Board Manufacturers (Asociación Española de Fabricantes de Pasta, Papel y Carton): Madrid, Spain, 2014. [Google Scholar]
- Karlsson, M. Papermaking Part 2, Drying. Papermaking Science and Technology Series, 9. Finnish Paper Engineers Association; Tappi Press: Atlanta, GA, USA, 2000. [Google Scholar]
- Kong, L.; Price, L.; Hasanbeigi, A.; Liu, H.; Li, J. Potential for reducing paper mill energy use and carbon dioxide emissions through plant-wide energy audits: A case study in China. Appl. Energy 2013, 102, 1334–1342. [Google Scholar]
- Bhutani, N.; Lindberg, C.; Starr, K.; Horton, R. Energy assessment of Paper Machines. Energy Procedia 2012, 14, 955–963. [Google Scholar] [CrossRef]
- Thollander, P.; Ottosson, M. Energy management practices in Swedish energy intensive industries. J. Clean. Prod. 2010, 18, 1125–1133. [Google Scholar] [CrossRef]
- Calvo, L.M.; Domingo, R. A first approach to the use of CO2 emissions as a maintenance indicator in industrial plants. In Proceedings of the Manufacturing Engineering Society International Conference, Zaragoza, Spain, 26–28 June 2013. [Google Scholar]
- Calvo, L.M.; Domingo, R. CO2 emissions and its relationship with the product quality and process availability. In Proceedings of the 17th International Congress on Project Management and Engineering, Logroño, Spain, 17–19 July 2013. [Google Scholar]
- Barber, E. Xerium Dryer Fabric Cleaning; Xerium: Kentville, NS, Canada, 2011. [Google Scholar]
- Calvo, L.; Domingo, R. Influence of process operating parameters on CO2 emissions in continuous industrial plants. J. Clean. Prod. 2015, 96, 253–262. [Google Scholar] [CrossRef]
- Rouhonen, P.; Hippinen, I.; Tuomaala, M.; Athila, P. Analysis of alternative secondary heat uses to improve energy efficiency-Case: A Finish mechanical pulp and paper mill. Resour. Conserv. Recycl. 2010, 54, 326–335. [Google Scholar] [CrossRef]
- Tanasic, N.; Jankes, G.; Skistad, H. Cdf analysis of air flow measurements to approach large industrial halls energy efficiency: A case study of a cardboard mill hall. Energy Build. 2011, 43, 1200–1206. [Google Scholar] [CrossRef]
- Mraović, M.; Muck, T.; Pivar, M.; Trontelj, J.; Pleteršek, A. Humidity Sensors Printed on Recycled Paper and Cardboard. Sensors 2014, 14, 13628–13643. [Google Scholar] [CrossRef] [PubMed]
- Koper, G.J.M.; Kjelstrup, S.; van de Ven, T.; Sadeghi, M.; Douglas, W.J.M. Entropy production for cylinder drying of linerboard and newsprint. Heat Mass Transf. 2007, 50, 1344–1355. [Google Scholar] [CrossRef]
- Mollier, R. The i/x-chart for steam-air mixtures. (Das i/x-diagramm für Dampfluftgemische. Zeitschrift des Vereins Deutscher Ingenieure.). J. Assoc. Ger. Eng. 1929, 73, 1009–1013. [Google Scholar]
- AISLAM. Insulation Calculation Software; Atecyr and Polytechnic University of Valencia: Valencia, Spain, 2013. [Google Scholar]
- Royal Decree 1315/2005. Establishing the Bases of the Greenhouse Gas Emissions Monitoring and Verification Systems in Facilities; BOE (Spanish Official State Bulletin): Madrid, Spain, 2005.
- Law 1/2005. Regulating the Greenhouse Gas Emissions Trading Scheme; BOE (Spanish Official State Bulletin): Madrid, Spain, 2005.
- Decision 2007/589/EC. Establishing Guidelines for the Monitoring and Reporting of Greenhouse Gas Emissions Pursuant to Directive 2003/87/EC of the European Parliament and of the Council; OJEU L 229; Official Journal of the European Union: Brussels, Belgium, 2007.
- Ministry of the Environment. GHG Inventory Report May 2011, Appendix 8, Reference of the Inventory for the Application of the Royal Decree 1315/2005, Establishing the Bases of the Greenhouse Gas Emissions Monitoring and Verification Systems in Facilities Ministry of the Environment; Ministry of the Environment: Madrid, Spain, 2011.
- ECOFIS. European Commission—Climate Action. Methodological Guidelines; ECOFIS IT Services GmbH: Dortmund, Germany, 2011. [Google Scholar]
- ECOFIS. European Commission. Benchmarks for Free Allocation; ECOFIS IT Services GmbH: Dortmund, Germany, 2013. [Google Scholar]
- International Organisation for Standardisation. ISO 536. Paper and Board—Determination of Grammage; International Organisation for Standardisation: Geneva, Switzerland, 2012. [Google Scholar]
Figure 1.
Process scheme.
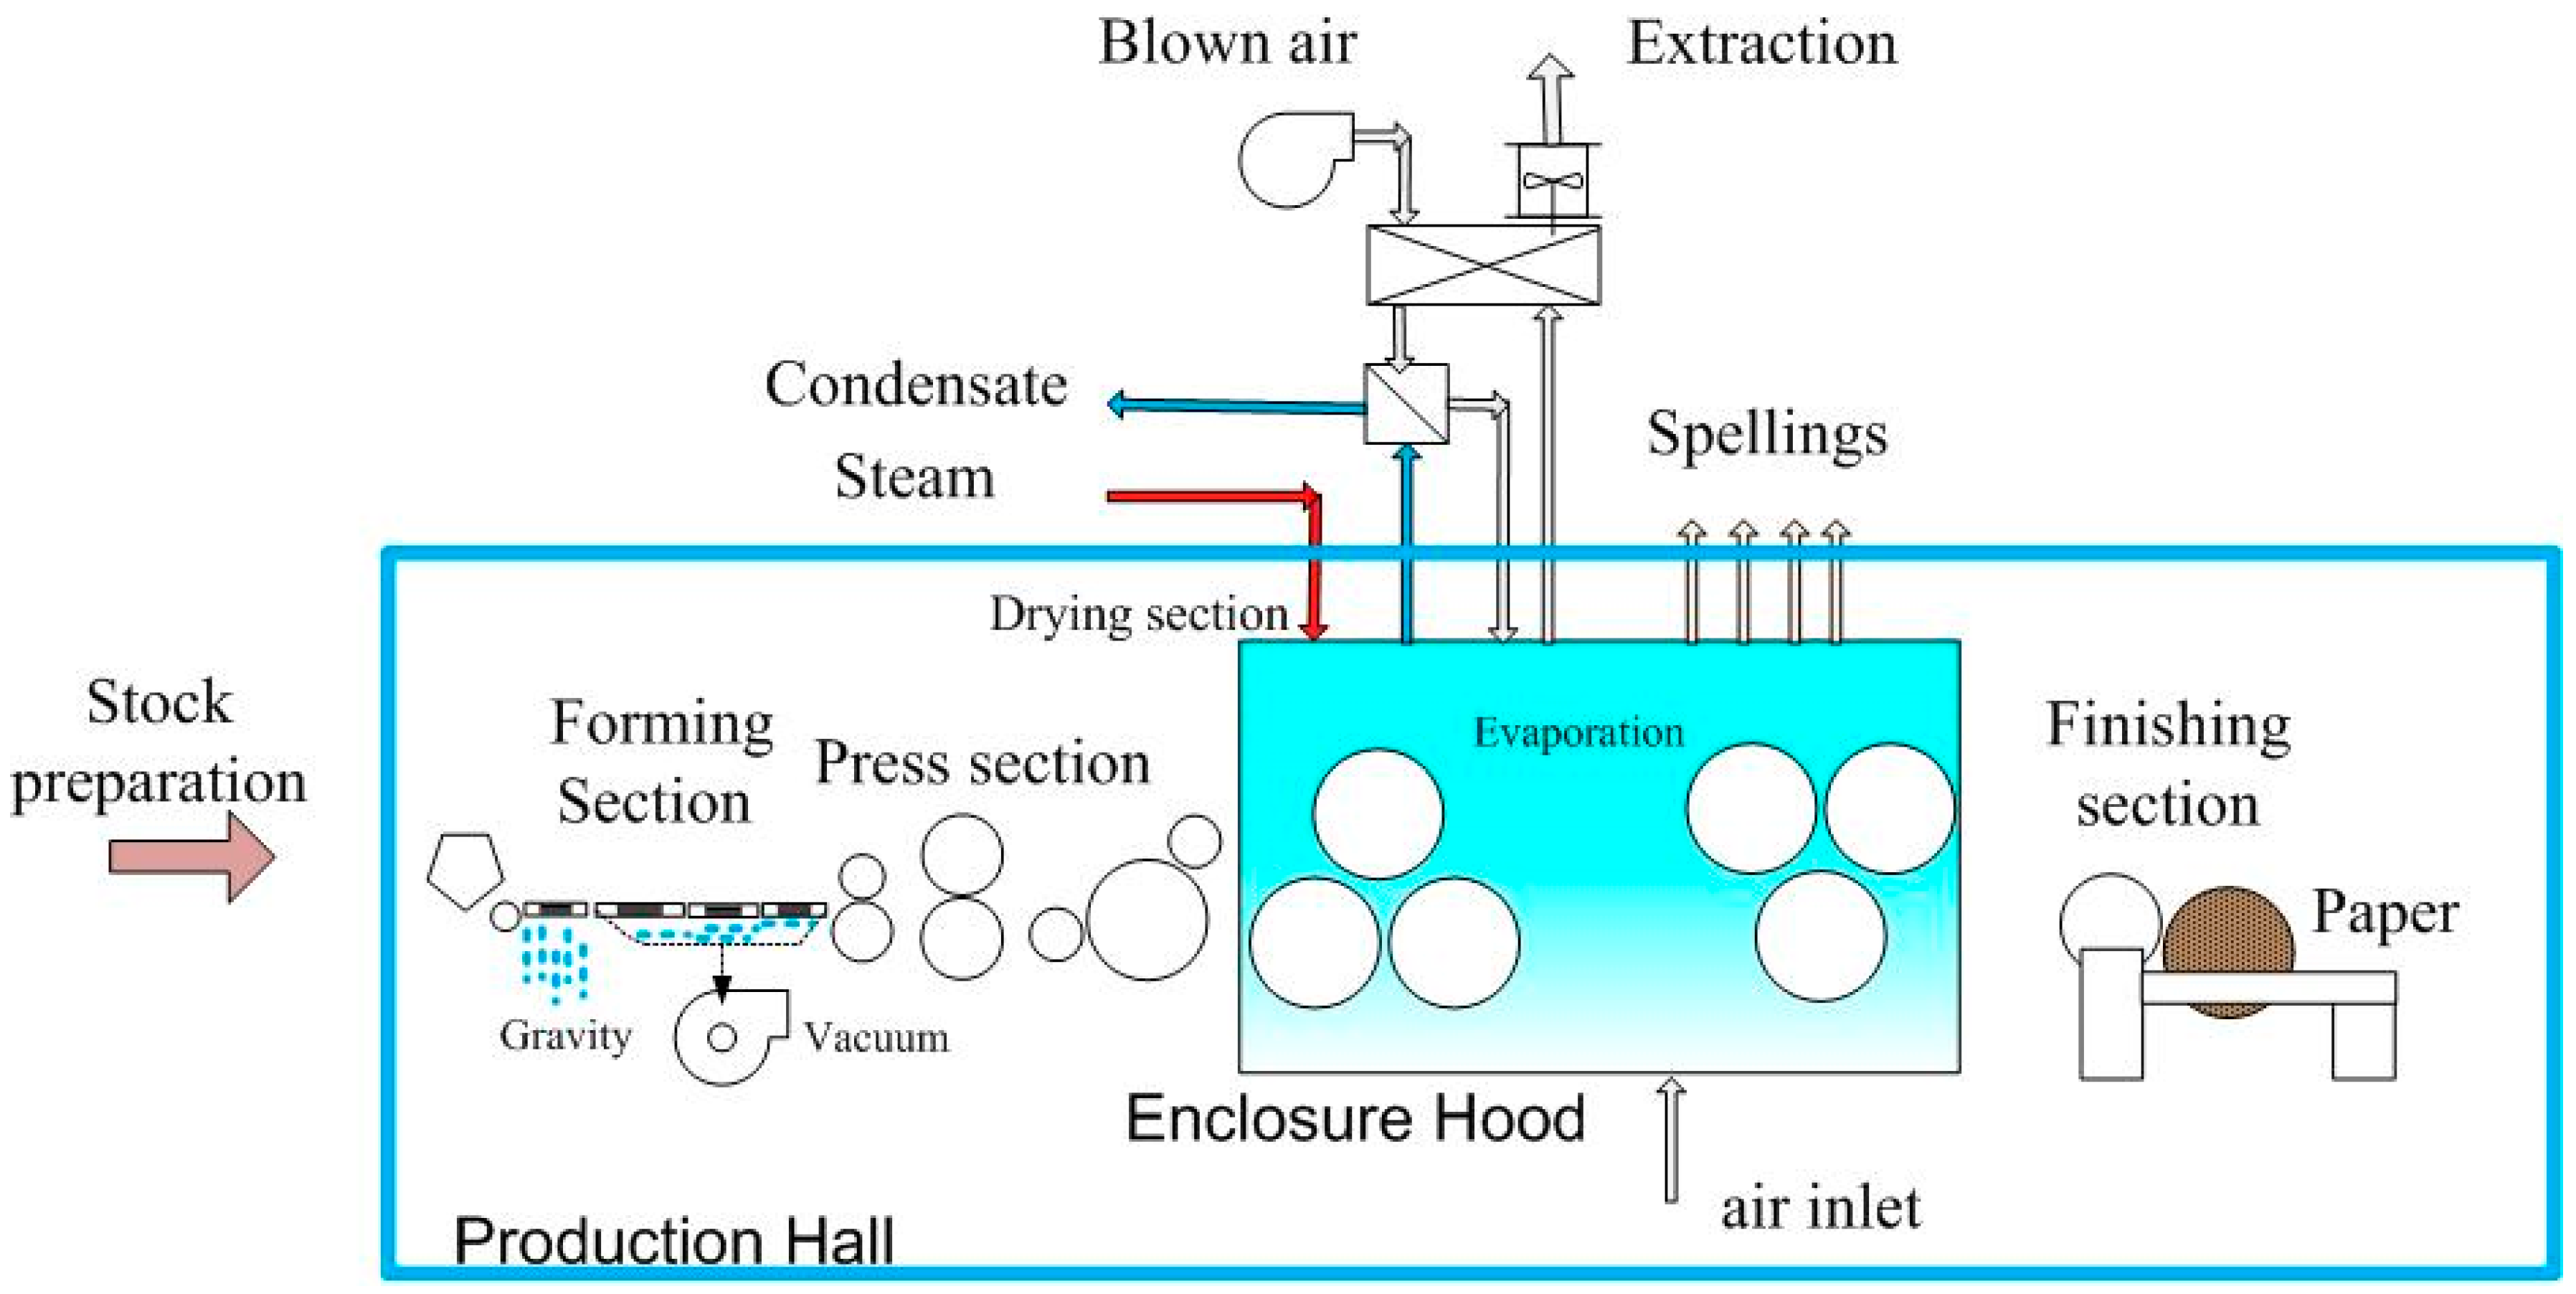
Figure 2.
Plan of the installation and the sampling points.

Figure 3.
Normal and thermal images: (a) normal and thermal image of enclosure hood roof; and (b) normal and thermal image of top enclosure hood panels.
Figure 3.
Normal and thermal images: (a) normal and thermal image of enclosure hood roof; and (b) normal and thermal image of top enclosure hood panels.

Table 1.
Sensors.
| Manufacturer | Sensor | Magnitude |
|---|---|---|
| Process Sensors Europe Corby, Northants NN17 5JG (United Kingdom) | MTC 360 With Optris CT-LC | Paper moisture Paper temperature |
| Lorentzen&Wettre Box 4 SE 16493 KISTA (Sweden) | ScamproDS-30 + SA-150 with Optris CT-LC | Paper moisture Paper temperature |
| Eckert & Zieger Isotope products Valencia, CA 91355 (USA) | KR NER-8170 + Krypton 85 | Paper grammage |
| Leine&Linde AB Strängnäs (Sweden) | 800 Series | Paper width and length |
| SpiraxSarco Lake Villa, IL 60046-6457 (USA) | Hygrotec 200 | Extracted airflow moisture, temperature |
| Endress + Hausser S.A. Sant Just Desvern, Barcelona (Spain) | TT RTD pt 100 | Blown airflow temperature |
| Endress + Hausser S.A. Sant Just Desvern, Barcelona (Spain) | PT EL 2610 | Condensate pressure |
| FLYR Systems Wilsonville, Oregon (USA) | Thermographic Flir E60 Built-in digital lens data FOV 53° × 41° | Enclosure hood panels thermal images |
Table 2.
Equipment and portable instruments.
| Type | Manufacturer | Equipent | Magnitude |
|---|---|---|---|
| Flowmeter | Spirax Sarco Lake Villa, IL 60046-6457 (USA) | FM GIFLO ILVA + M280 P,T Easytemp TMR31 | Steam flow, temperature Steam pressure |
| Flowmeter | Elster GmbH Wien (Germany) | TRZ-2 + EK-230 P,T | Natural gas flow, pressure, temperature |
| Flowmeter | Siemens AG KARL SRUE (Germany) | SITRANS FM Mag 3000 | Condensate flow |
| Pressure meter | Endress + Hausser S.A. S. Just Desvern, Barcelola (Spain) | PT EL 2610 | Condensate pressure |
| Flowmeter | Ahlborn Mess-Und Regelungstechnic GmbH Hoizkirchen (Germany) | Almemo AMR 2590-3S | Airflow speed |
| Temperature meter | Ahlborn Mess-Und Regelungstechnic GmbH Hoizkirchen (Germany) | Almemo 2090-1 + K-termopar | Airflow moisture |
| Pressure meter | Comarkinstruments Norwich, Norfolk NR6 6JB (United Kingdom) | Coromark C9553 | Atmospheric pressure |
| Temperature meter | Ahlborn Mess-Und Regelungstechnic GmbH Hoizkirchen (Germany) | Almemo AMR 2390-3 | Enclosure hood panels temperature |
Table 3.
Exhaust airflows.
| Element | Type | Flow m3/s |
|---|---|---|
| No. 1 | Extractor | 6.89 |
| No. 2 | Extractor | 6.81 |
| No. 3 | Extractor | 5.53 |
| No. 4 | Extractor | 2.81 |
| No. 5 | Fourdrinier vacuum system | 7.50 |
Table 4.
Openings or gaps in production hall.
| Element | Number | Level (m) | Open Area (m2) |
|---|---|---|---|
| Access door 1 | 1 | 0 | 3.0 |
| Access door 2 | 1 | 0 | 12.5 |
| Access door 3 | 1 | 0 | 2.4 |
| Access door 4 | 1 | 0 | 2.4 |
| Open windows | 7 | 0 | 4.9 |
| Opening 1 | 1 | 9 | 2.5 |
| Opening 2 | 1 | 9 | 6.0 |
| Opening 1 | 1 | 9 | 7.5 |
Table 5.
Airflow characteristics and data in production hall.
| Outlets/Inlets | Type | Temperature (°C) | HR (%) | G H2O/Kg Dry Air | Atmospheric Pressure (Pa) | Density (kg/m3) | Flow (m3/s) |
|---|---|---|---|---|---|---|---|
| Extractor 1 | Output | 30 | 20 | 5 | 101,325.0 | 1.0 | 6.89 |
| Extractor 2 | Output | 30 | 20 | 5 | 101,325.0 | 1.0 | 6.81 |
| Extractor 3 | Output | 35 | 20 | 7 | 101,325.0 | 1.0 | 5.53 |
| Extractor 4 | Output | 35 | 10 | 4 | 101,325.0 | 1.0 | 2.81 |
| Opening roof | Output | 60 | 10 | 13 | 101,325.0 | 1.0 | 6.72 |
| Vacuum System | Output | 30 | 80 | 22 | 101,325.0 | 1.0 | 7.5 |
| Enclosure hood | Output | 85 | 20 | 77 | 101,325.0 | 1.1 | 7.08 |
| Outside air | Input | 13.5 | 12 | 2 | 101,325.0 | 1.0 | 43.33 |
Table 6.
Energy for each airflow.
| Outputs/Inputs Air | Flow (m3/s) | Enthalpy (kJ/kg) | Energy (MJ) |
|---|---|---|---|
| Extractor 1 | 6.89 | 44 | 1091.2 |
| Extractor 2 | 6.81 | 44 | 1078.0 |
| Extractor 3 | 5.53 | 44 | 875.6 |
| Extractor 4 | 2.81 | 45 | 454.5 |
| Opening roof | 6.72 | 95 | 2299.0 |
| Vacuum System | 7.5 | 85 | 2295.0 |
| Enclosure hood | 7.08 | 240 | 6120.0 |
| Outside air | 43.33 | 16 | 2496.0 |
Table 7.
Airflow method, and balance of emissions due to isolation losses using airflow method.
| Emissions CO2 | ||||
|---|---|---|---|---|
| MJ/h | t CO2/h | Total Year | % | |
| Losses by extraction | 3302 | 0.16751 | 1346.8 | |
| Thermal energy contributed by drives | 219 | 0.01111 | 89.3 | |
| Energy added by isolation losses | 3083 | 0.15640 | 1257.5 | 12.51 |
| Total thermal energy consumption | 24,418 | 1.23868 | 9958.9 | 100.00 |
Table 8.
Traditional method, and balance of emissions due to isolation losses using traditional method.
Table 8.
Traditional method, and balance of emissions due to isolation losses using traditional method.
| Emissions CO2 | ||||
|---|---|---|---|---|
| MJ/h | t CO2/h | Total Year | % | |
| Losses due to enclosure hood | 2570 | 0.13037 | 1048.1 | |
| Losses due to air ducts | 407 | 0.02065 | 166.0 | |
| Thermal energy contributed by drives | 219 | 0.01111 | 89.3 | |
| Energy added by isolation losses | 3196 | 0.16212 | 1303.5 | 12.97 |
| Total thermal energy consumption | 24,418 | 1.23868 | 9958.9 | 100.00 |
© 2017 by the authors. Licensee MDPI, Basel, Switzerland. This article is an open access article distributed under the terms and conditions of the Creative Commons Attribution (CC BY) license (http://creativecommons.org/licenses/by/4.0/).
Share and Cite
MDPI and ACS Style
Calvo, L.M.; Domingo, R. CO2 Emissions Reduction and Energy Efficiency Improvements in Paper Making Drying Process Control by Sensors. Sustainability 2017, 9, 514. https://doi.org/10.3390/su9040514
AMA Style
Calvo LM, Domingo R. CO2 Emissions Reduction and Energy Efficiency Improvements in Paper Making Drying Process Control by Sensors. Sustainability. 2017; 9(4):514. https://doi.org/10.3390/su9040514
Chicago/Turabian StyleCalvo, Luis Miguel, and Rosario Domingo. 2017. "CO2 Emissions Reduction and Energy Efficiency Improvements in Paper Making Drying Process Control by Sensors" Sustainability 9, no. 4: 514. https://doi.org/10.3390/su9040514
Note that from the first issue of 2016, this journal uses article numbers instead of page numbers. See further details here.