
Industry Interdependence Dynamics and Structure Change Causal Analysis: An Empirical Study on China’s Shipbuilding Industry


School of Economics and Management, China University of Petroleum, Qingdao 266580, China
*
Author to whom correspondence should be addressed.
Sustainability 2017, 9(4), 517; https://doi.org/10.3390/su9040517
Submission received: 2 January 2017
/
Revised: 23 March 2017
/
Accepted: 26 March 2017
/
Published: 29 March 2017
(This article belongs to the Special Issue Sustainability of Economic and Management Systems: Perspectives of Uncertainty and Data Driven Optimization)
Abstract
:Based on empirical evidence from Yangtze River Delta, Pearl River Delta and Circum-Bohai-Sea region, this study applies the Input-Output (I-O) model and ArcGIS to analyze the interdependence and its dynamic evolution of the shipbuilding industry. In order to study the change cause of shipbuilding industrial structure, we decompose the I-O model to obtain the influential factors including domestic final demand, overseas export demand, intermediate input, intermediate demand import and final demand import. The results indicate that (1) the shipbuilding industry has a significant interdependence, which has showed the characteristics of high integration and interaction. Among the three different regions, the degree of interdependence of the Yangtze River Delta is most significant, followed by the Pearl River Delta and the Circum-Bohai region. (2) The interaction and integration of the shipbuilding industry have the trend of synchronous development. From the initial S-shapes of coastal distribution, the interaction gradually expands to inland cities radially. (3) The dependence of the shipbuilding industry has reduced but the self-supporting effect continuously strengthened, and industrialization is accelerating, which indicates the shipbuilding industry will further promote the optimization of industrial structure. (4) Shipbuilding industry has been expanding a lot, the main causes of changes in industrial structure are different, and the effect of intermediate inputs change plays a significant role in the Yangtze River Delta. In the Pearl River Delta, it is the changes effect of foreign export demand that counts. However, it is the effect of the final demand that makes contribution to the industrial structure change in Circum-Bohai-Sea region.
1. Introduction
With the continuous progress of science and technology, the process of industrialization is accelerating. The rapid development of economy has caused serious ecological and environmental development problems [1]. Chinese government has put forward the scientific development view, and its essence is sustainable development, which is the development trend of future economic [2]. Sustainable development requires the industry to optimize its industrial structure, improve resource utilization efficiency and maximize the overall industrial efficiency through technological innovation [3]. It emphasizes the coordinated development of population, resources, environment and ecology, economy and society from the industrial level [4]. Scientific and rational industrial structure is the prerequisite of sustainable development [5].
As one of the pillar industries of the national economy, the shipbuilding industry is an important component of the marine economy, which undertakes the design, construction and maintenance of military and civilian ships and floating tools [6]. Shipbuilding industry and its associated upstream and downstream industries stretch across the secondary and tertiary industry. It is involved in various kinds of industrial sectors, which have a strong impetus to the development of its upstream and downstream industries [7]. It is a challenge for the shipbuilding industry to maintain a leading position under the circumstances of slow recovery of the world economy and slowdown of the domestic economic growth [8]. In the process of economic operation, it also reveals that China’s shipbuilding industry still has such problems that lack of development potential, difficulty in earning profits and low utilization rate of production capacity, which seriously restricts the process of sustainable development of the shipbuilding industry [9]. Therefore, the State Council has promulgated a number of policies to ensure the coordinated development of shipbuilding industry and regional economy, such as “the implementation of the program of the shipbuilding industry to speed up restructuring and promote transformation and upgrading”, “Made in China 2025” and so on. The sustainable development of shipbuilding industry is of great significance to the economy development and strategic deployment [10].
However, due to the impact of the post-financial crisis, the international shipping market has shrunk severely, leading to fierce international competition. China’s shipbuilding industry faces a new round of industrial adjustment cycles and has the problem of industrial homogeneity, overcapacity and irrational industrial layout [11]. How to actively adjust the industrial structure and promote the sustainable development of the shipbuilding industry has become a hot topic in the academic research. In order to promote the sustainable development of regional economy and ensure the development of the shipbuilding industry to adapt to the regional economic stage change and achieve economic recovery, it is necessary to analyze the interdependence of the industry and explore the influencing factors of shipbuilding industrial structure [12]. Thus, we can take measures to optimize the industrial structure orderly.
In this study, we offer three main contributions to the literature. First, sustainable development is the inevitable requirement of industrial development and the shipbuilding industry is an important carrier of economic development. It is of great significance to study the sustainable development of shipbuilding industry and economic construction and reform in China. The second contribution is to use the input-output model and decompose the factors of industrial structure change, measure the industrial interdependence and the change of industrial structure in a new perspective, and the quantitative analysis method makes the research result more accurate. The third contribution is that the dynamic interdependence between shipbuilding industry and regional economy is important, and the change trend of industrial interdependence is the key basis to reflect the inherent law of industrial economic linkage, and its evolution path has important value for the transformation and upgrading of industrial structure and policies making.
The rest of the paper is arranged as follows: Section 2 briefly reviews the previous studies; Section 3 introduces the methods and research area. Section 4 analyzes the industry interdependence, and the impacts produced by shipping industry to economic development. Section 5 analyzes the influence factors of the industrial structure change, mainly from the aspects of final domestic demand, overseas export demand, intermediate input, intermediate import demand and final import demand. Section 6 draws a conclusion and presents feasible suggestions, hoping regional shipbuilding industry would develop better.
2. Literature Review
From the aspect of techno-economic, industry correlation refers to a certain economic and technological contact formed by the input and output relationship among each department [13]. It is important for analyzing the interdependence of shipbuilding industry to strengthen the capability of industrial resource dispatching, but also the core issue to optimize industrial path and structure [14,15]. Many previous scholars research the interdependence between industries and economic systems by using the Spatial Econometric Model, Input-output Model and Grey Correlation Model, etc. [16,17,18]. Combined with input and output data to analyze its impetus to economic development and the impact on related industries. One subfield of the industry sustainable development studies focus on the measurement of industrial interdependence. Zeng et al. [19], Liu et al. [20], Peng et al. [21] by using the Grey relational Analysis and Spatial Econometric Model to do an empirical research on the relationship between industrial structure and economic development. Spatial metering needs to collect large amounts of economic data, otherwise there will be pseudo-regression phenomenon. Although the data samples of Gray Correlation model are not so complicated, its subjectivity is too prominent. The input-output method can effectively reveal the quantitative proportional relationship of technical and economic links between industries. Therefore, most scholars applied the I-O model and data to perform empirical measurement the interdependence between economic system and the shipbuilding industry, iron and steel industry, agricultural industry, logistics industry, and the real estate industry. For example, Ying [22], Ji [23], Xie et al. [24], Liu et al. [25], Heringa et al. [26], Zhang et al. [27], Luo et al. [28] and Bekhet et al. [29], and their research strongly supported the industrial interdependence in various scenarios. In addition, Chen et al. [30], Fan et al. [31], Guevara et al. [32], Ocampo et al. [33] proposed the improved input-output model to study the industrial development and industry-related effects, which made the research method more targeted.
Another subfield is the study of the causes of the industrial structure change. In order to discuss the change of industrial structure essentially, it is extremely important to analyze the causes of the industrial structure change. Many scholars analyze the influence factors of industrial structure change from different perspectives. Gao et al. [34] based on a theoretical analysis on the immanent mechanism of industrial structure upgrade, develops a spatial econometric model to analyze mainly from social demands, human resource supply, technological innovation and institutional impact. Zhang et al. [35], Lu et al. [36] by using the spatial autocorrelation analysis method and spatial panel econometric model, reveals that foreign direct investment, physical capital investment, energy investment, resident consumption, urbanization and technology advance all give impetus to the upgrading of industrial structure. Sun et al. [37] by using the Error Correction Model and the Chow Test to makes an empirical analysis on the economic data, and revels that the change of the industrial structure has long-term equilibrium relationship with economic development level, the degree of technological progress, investment demand, consumer demand, international trade structure and utilization of foreign capital. However, Zhao et al. [38], Han et al. [39] decomposed the main factors of the changes in the total output of various industries in China’s economy, mainly from the total consumption, import and export, technology structure and investment structure.
Based on the above literatures analysis, both the qualitative analysis and the quantitative analysis are available in the existing research. However, qualitative analysis is lack of empirical support, while the quantitative analysis mainly uses the spatial measurement model or static input-output model, cannot dynamically reflect the evolution of industry interdependence. According to the above literature review, we can find that most scholars by using the spatial econometric model and input-output model to analyze the influence factors of industry structure change mainly from the aspects of consumption, investment, import and export and so on. However, it is difficult to distinguish the specific manifestations of consumption, investment, import and export. In order to analyze the changes of industrial structure specifically, this paper will further decompose the factors into five aspects as follows, the domestic final demand, foreign export demand, intermediate inputs, intermediate import demand, final imports demand. Therefore, considering the specificity and complexity of the shipbuilding industry, this paper will employ the input-output model, together with geographic information system, through decomposing its influencing factors, and research on the dynamic evolution of interdependence of regional shipbuilding industry and its structure changing causes.
3. Methods and Data
3.1. Method Introduction
Input-output method is a quantitative economic research method proposed by American economist Leontief in the 1930s. Input-output analysis is useful in evaluating the impact of changes in demand for the output of an industry or group of industries. Based on the input-output table and the input-output model, input-output method analyzes the quantitative relationship between “input” and “output” of each industry [40]. Input-output model is the theoretical basis for the analysis, and input-output table provides economic development data, which shows the inputs used by each industry, the outputs produced by each industry, and the relationship between industry output and final demand among various users [41]. While researching, we select index coefficients based on the Input-output model. This article will measure the shipbuilding industry interdependence through the intermediate input rate, the intermediate demand rate, induction degree coefficient, influence coefficient, direct consumption and complete consumption, and further explore the influential factors by formula decomposition [42].
3.1.1. The Intermediate Input Coefficients and Intermediate Demand Coefficients
So-called integration refers to the dependence degree between a certain industry and related sectors. The intermediate input rate is an important indicator, which can reflect the above-mentioned dependence degree. It measures the degree of integration in an aspect of input; while the intermediate demand rate measures in the view of demand (in the Equations (1) and (2), where is intermediate input from each industry to industry j, is added value of industry j, is final demand of national economic industries about industry i).
The intermediate input rate:
The intermediate demand rate:
3.1.2. The Influence Coefficient and Induction Degree Coefficient
Influence and induction degree coefficient are main indexes in the shipbuilding industry interdependence analysis, because they can accurately reflect the interaction characteristics among different industries. Influence degree from the shipbuilding industry to other industries is called the influence coefficient. The induction degree coefficient is the influence degree from shipping industry to others. In the Equations (3) and (4), is the coefficient of the i row and j column of Leontief inverse matrix .
The induction degree coefficient:
The influence coefficient:
3.1.3. The Direct Consumption Coefficient and the Total Consumption Coefficient
We introduce the two coefficients to analyze the influence made by shipping industry on two aspects of pushing and pulling the regional economy, then we find the key industry and carry on the analysis from the perspective of industrial agglomeration and industrial chain. The direct consumption coefficient is the amount of direct consumption of other industries when i industry produce unit production. Complete consumption coefficients refers to the complete consumption quantity of j industrial products when i industry produces unit final product. These two indexes can represent direct and indirect consumption amount of other industries when shipping industry produces unit final product, and reflect the pulling of downstream industry in the process of production because of complete consumption. Total Consumption Coefficients Matrix is represented by B (in the Equations (5) and (6), is the total output of industry j, A is direct consumption coefficient matrix and I is unit matrix).
3.2. Influence Factor Decomposition
Using to represent the product demand and supply among industries; final domestic demand of various industries is ; is the exports of i sector; total output is ; the added value of industry j is ; In addition, represents the share of imports in intermediate input. is the share of final import demand. Therefore, the supply and demand balance relations of domestic production can be expressed as follows:
Assume that the relationship between intermediate input and final output of each industry is linear, and then we can get the formula of direct consumption coefficient:
We assume that the relationship between imports and domestic demand is proportional, and then we can handle the imports with inner-producing treatment and respectively define the intermediate and final demand coefficients as follows:
Furthermore, put Equations (9)–(11) into (8), we can get the balance between domestic supply and demand, which is expressed as follows:
The matrix form:
In the Equation (13), X is the total output column vector, A is the intermediate input coefficient matrix, F is the final demand column vector, E is the export demand column vector and is an diagonal matrix with intermediate demand imports coefficient as its diagonal elements, is an diagonal matrix with final demand imports coefficient as its diagonal elements.
Non-competitive import input-output model of domestic equilibrium output model can be obtained by solving the domestic equilibrium output volume X in (13).
If final demand is subdivided into consumption and investment, then:
and are the column vectors of industrial consumer demand and investment demand, .
Formula (17) represents that the total domestic output of each industry is limited and induced by Leontief inverse matrix, consumer demand for domestic products, investment demand and export demand.
With Formula (17), compare the amount of industrial output changes at different time points:
Five factors are obtained by decomposition: the changes effect of domestic final demand (DFD), the effect of changes in foreign export demand (FED), the effect of intermediate inputs change (EII), the effect of changes in import structure of intermediate demand (IID), effects of changes in the structure of imports final demand (FID) [43]. According to the above model decomposition, we can calculate the industry changing indicators in the same industrial area but different years, and also analyze the differences of different regions in the same year by the decomposition model. Through the above model, we analyze changes in the shipbuilding industrial production and factors associated with it. In addition, to avoid the influence of the price index on the calculation results, we set 2012 as the base year and correct the data of other years.
3.3. Data Selection
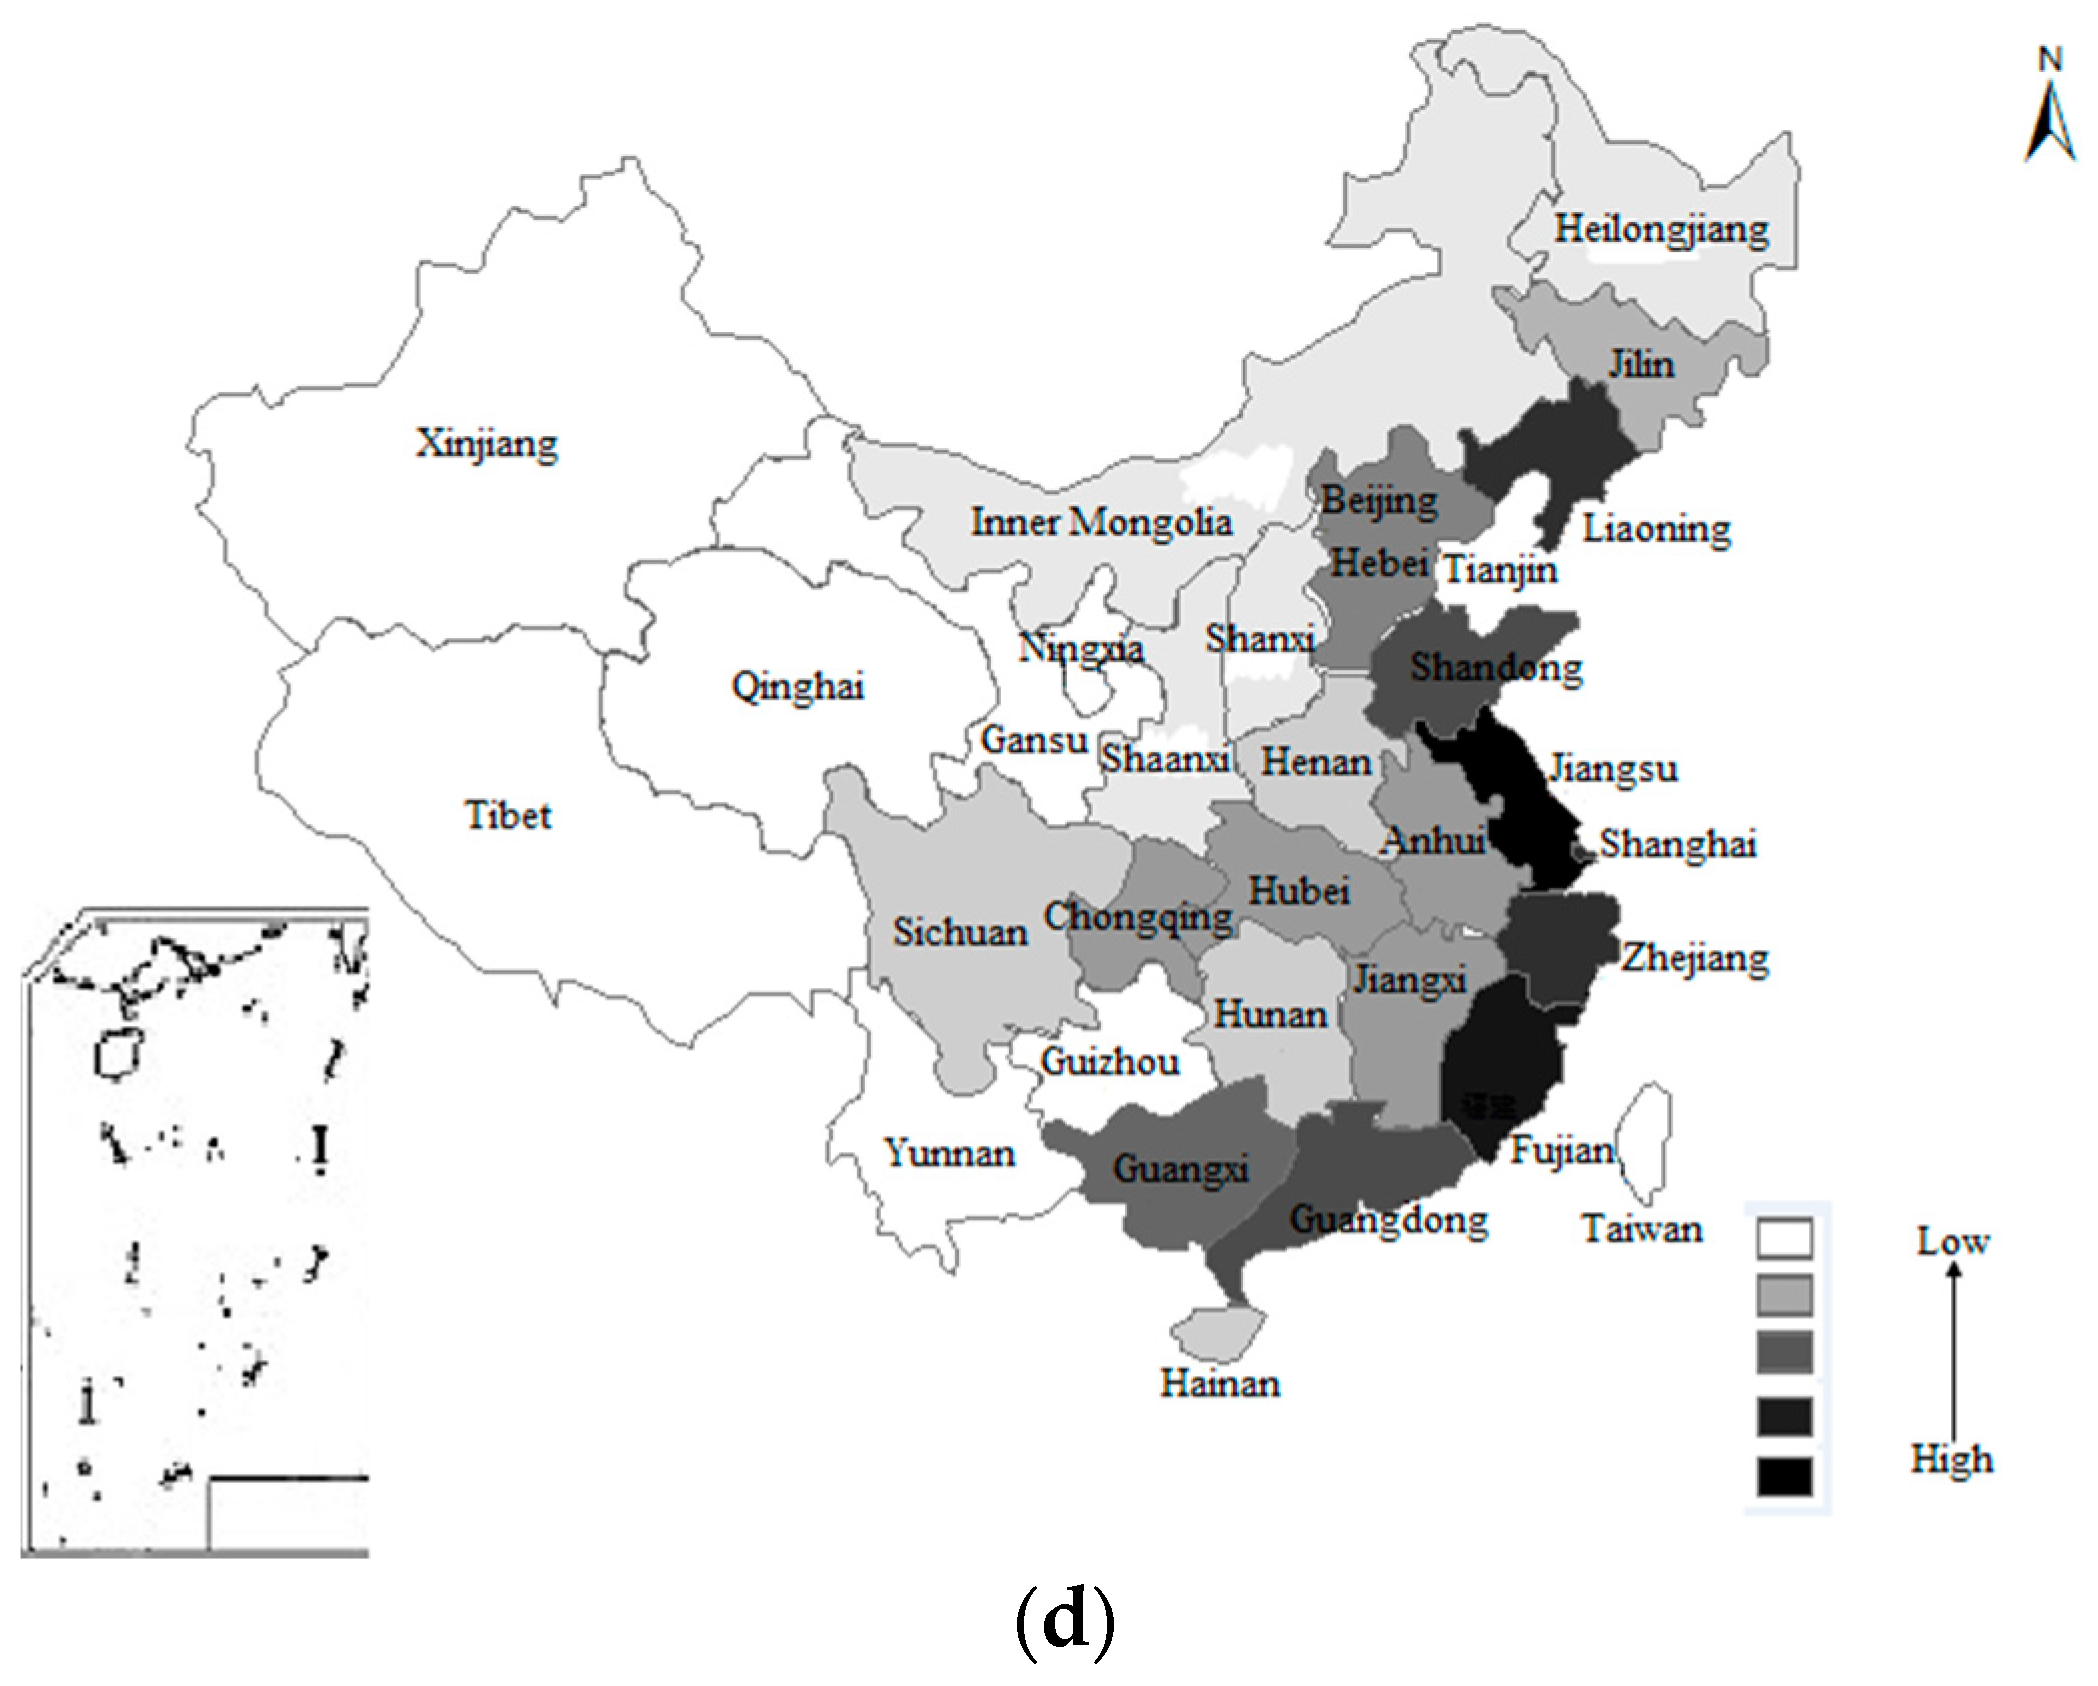
Data mainly from 1997, 2002, 2007 and 2012 input-output tables and the Almanac of China Shipbuilding Industry from 2002 to 2012. From the figure of Chinese shipbuilding industrial output value distribution in 2012, we can see that the level of development of the shipbuilding industry in eastern coastal provinces is higher, while in western and inland provinces, it is relatively slow.
Gaps exist in some provinces such as Xinjiang, Tibet, Qinghai and so on. Because of the lack of statistical data in some provinces, the study is not representative. Therefore, considering the concept of the three major economic regions proposed by Chinese government, we select nine provinces, i.e., Jiangsu, Zhejiang, Shanghai, Guangdong, Guangxi, Fujian, Liaoning, Shandong and Hebei from three regions, i.e., Yangtze River Delta, Pearl River Delta and Circum-Bohai-Sea region, to carry on our study, which are shown in Figure 1.
4. Regional Shipbuilding Industrial Dynamic Interdependence
4.1. Integration of Regional Shipbuilding Industry
In this article, we evaluate the fusion level by using the indexes of intermediate input and demand of shipbuilding industry. According to the degree of intermediate input rate and intermediate demand rate, the industry can be divided into four different categories, including the intermediate product of basic industries, intermediate goods industries, final demand of basic industries and final demand type industries, as shown in Figure 2.
Currently, shipbuilding industry in Circum-Bohai-Sea region and the Pearl River Delta region belongs to final demand industries, and the low intermediate demand and high intermediate input rate, which reflect the periodically characteristics of shipbuilding industry development. However, the Yangtze River Delta shipbuilding industry appertains to intermediate goods industries, for which it has a higher degree of intermediate inputs and intermediate demands. Due to the shipbuilding industry of Yangtze River Delta as a material production sector provides products to other industries, so that the characteristics of basic industries are more prominent. However, with the continuous development of industrial economy and optimization of industries structure, the shipbuilding industry of Yangtze River Delta will transform into the final demand industries.
According to the intermediate demand and intermediate input rate of the regional shipbuilding industry, in Table 1, we analyze that:
- (1)
- Generally, from 1997 to 2012, the intermediate input rate of the shipbuilding industry in Yangtze River Delta and Pearl River Delta region is steady, remaining at around 0.8 and fluctuating in the range of 10%, which reflects balance and stability property of the development of shipbuilding industry. After 2002, the intermediate input rate of Circum-Bohai-Sea region dropped significantly, falling from 0.7161 to 0.5295, indicating that value-added rate of shipbuilding industry in Circum-Bohai-Sea region increased significantly. In 2012, the intermediate input rate of the Circum-Bohai-Sea region was 0.6677, which indicates that about 66.7% of the total output participated in other sectors’ activities in the form of intermediate product, and value-added rate just only 33.3%.
- (2)
- Compared in the same period, the intermediate inputs rate of Circum-Bohai-Sea region shipbuilding industry is lower than the Pearl River Delta and Yangtze River Delta region, and its fluctuation range is higher. It is an important turning point in the year of 2007, during which the proportion of Circum-Bohai-Sea region’s shipbuilding industry goods performed as production of materials is relatively low.
- (3)
- Considering the intermediate demand rate, it rose smoothly from 0.1836 to 0.3569 in Circum-Bohai-Sea region. Pearl River Delta and Yangtze River Delta present synchronous fluctuations, both in the process of firstly dropping, then rising and finally dropping. In 2002, the intermediate demand rate of the Yangtze River Delta increase significantly faster than Pearl River Delta, which was more stable.
- (4)
- By comparing with Circum-Bohai-Sea region and Yangtze River Delta in the same period, the intermediate input and demand rate in Pearl River Delta are higher in general, reflecting that the whole integration between shipbuilding industry and others in Pearl River Delta is higher than other two areas. The intermediate input rate of Yangtze River shipping industry is higher than Pearl River Delta and Circum-Bohai-Sea region in the same period, showing a feature of “high drive, low value-added”. The intermediate input rate of Circum-Bohai-Sea region is lower than the other two economic areas, showing a downward trend. As the development of China’s shipbuilding industry has not yet reached the stage of mature industrialization, it still needs more time for the intermediate input rate to decrease slowly.
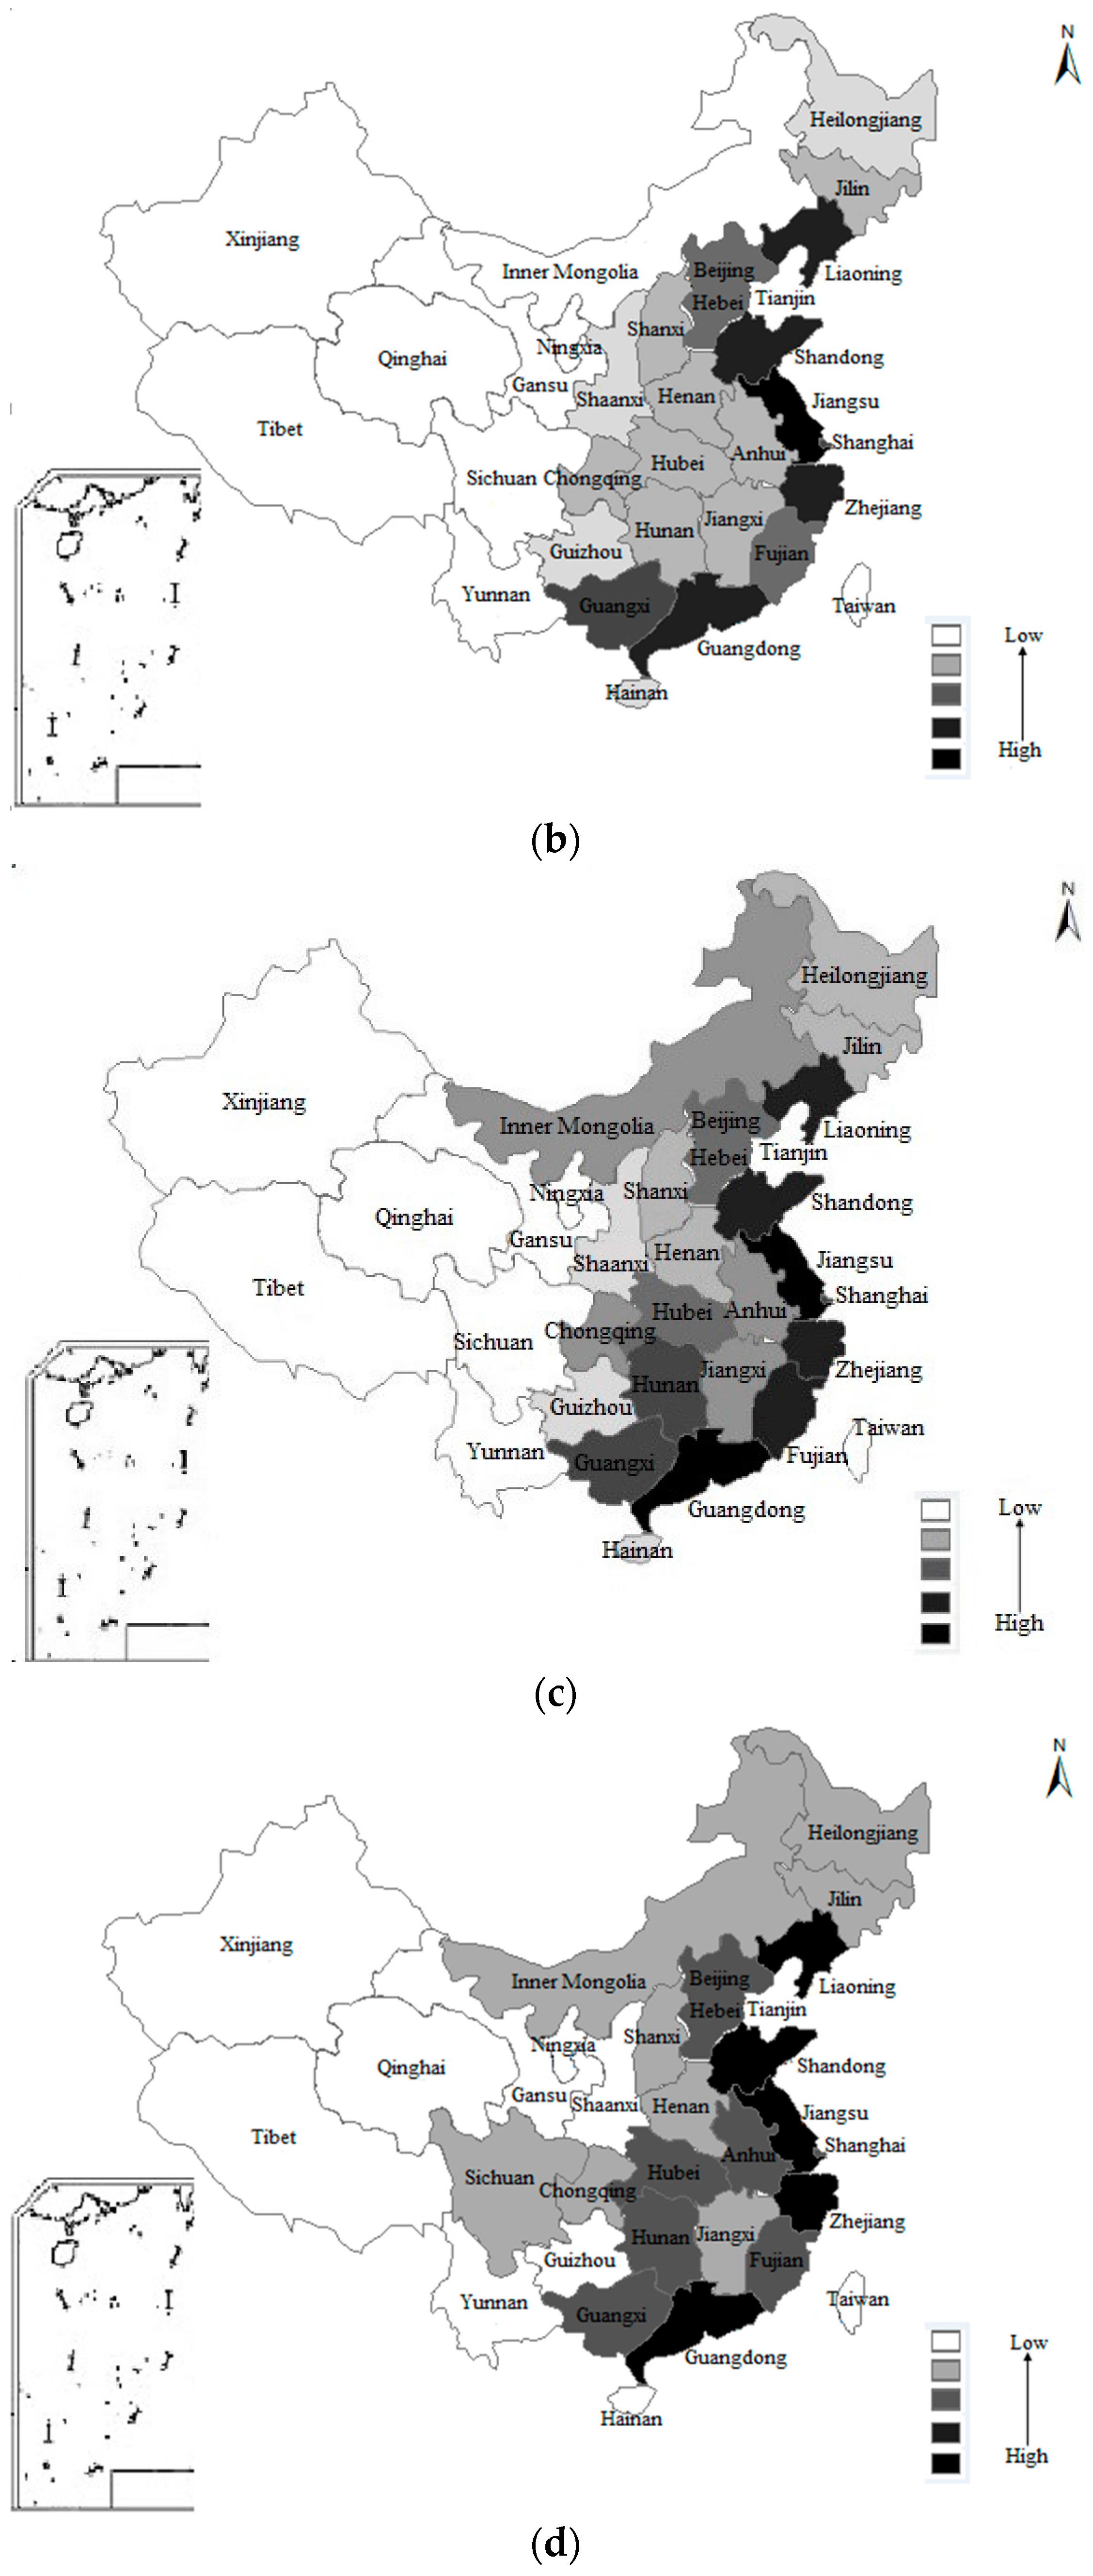
In order to clearly present the evolution of shipbuilding industry integration, we generate the diagram over the years via ArcGIS 10.0 (Esri, Redlands, CA, USA), using natural break point grading method, as shows in Figure 3. Generally, the integration of shipbuilding industry shows diffusion evolution trend, from the initial “S” shape coast distribution to gradually expanding to inland cities. It can be seen that fusion present such a distribution situation that it is high in the east but low in the west, high in the coast but low in inland. While analyzing the local area, the high integration area has transferred from the Pearl River Delta region to the Yangtze River Delta region. In Figure 3a, the shipbuilding industry in the Pearl River Delta region represented with Fujian and Guangzhou has a significant integration with other industries. From Figure 3b–d, it can be seen that the pace of development of shipbuilding industry in Yangtze River Delta region has exceeded a lot. Moreover, it has become a high-integrated economic area in 2012. Simultaneously, shipbuilding industry in Circum-Bohai-Sea region develops well by making good use of national strategies and their own unique advantages in resources.
4.2. Interactivity of Regional Shipbuilding Industry
By means of influence and sensitivity coefficients of 1997, 2002, 2007 and 2012, this paper evaluates the evolution of regional shipbuilding interactivity. By calculating the input-output table of the nine provinces in three regions, we sort out the results as shown in Table 2.
The greater influence coefficient, the more significant role it plays in promoting national economy, and develop such industry can better enhance the overall economy. The regional shipbuilding industries influence coefficient are great at about 1.2, which can effectively play the “high drive” role of the national economic. From the time series analysis, the influence coefficient of Yangtze River Delta region is obviously higher than other two areas in 1997, but it steadily declined from 1.238 to 1.169 in 2012. In contrast, in the Pearl River Delta region, the influence coefficient was only 1.07 in 1997, and then it rose rapidly and eventually reached near 1.20. Influence coefficients in Circum-Bohai-Sea region vary widely, rising firstly and then decreasing. Regional influence coefficient changes at different degrees in areas. The influence coefficient of shipbuilding industry in Yangtze River Delta region has decreased, and the effect in promoting the national economy has declined. Since the formation of new regional economic area and expansion of foreign shipping market, the Pearl River Delta gradually enhances its influence of the regional shipbuilding industry. The influence coefficient of both Yangtze River Delta and Circum-Bohai-Sea region presents a weakening trend. Overall, the influence coefficient is significant, which is above the average level of industrial sectors of the national economy. Therefore, in order to avoid economic growth to be influenced greatly, we should focus on promoting the stable development of the shipbuilding industry.
As for sensitivity coefficient, regional shipbuilding sensitivity showed a rapid rise firstly, then a substantial decline, and finally stabilized near 0.55, which indicates that the shipbuilding industry arrived peak phase in 2002. Sensitivity of Circum-Bohai-Sea regional shipbuilding industry fluctuates mostly, quickly rising from 0.47 to 1.05 (exceeding the community average 1.0), but rapidly declining to 0.65 after 2002, whose decreasing range is more than 40%. Compared with Circum-Bohai-Sea region, sensitivity of Yangtze River Delta and Pearl River Delta region did not change significantly, which showed a steady rise and then slowly decline. Compared with Yangtze River Delta and Pearl River Delta region, the sensitivity coefficient of Circum-Bohai-Sea region in 2007 is lower than the average level of society, which indicates that the sensitivity is smaller, and the stimulating effect it obtained by the national economy is insufficient. Therefore, the development of Circum-Bohai-Sea region should be enhanced. At the same time, on the whole, shipbuilding industry in all regions presents a high quality, which can effectively synchronize with the regional economic development and further promote regional economic development.
According to the above information, the influence of each region shipbuilding industry is greater than 1.0, while the sensitivity is less than 1.0, which illustrates that shipbuilding industry has characteristics of high-pull in demand and low-promote in supply. The influential coefficient is greater than the social average level, which indicates that the shipbuilding industry has relatively great stimulating effect on the national economy. However, after 2002, the coefficient of influence and the intermediate input rate show a synchronous downward trend, indicating the shipbuilding industry is shifting towards final demand industry.
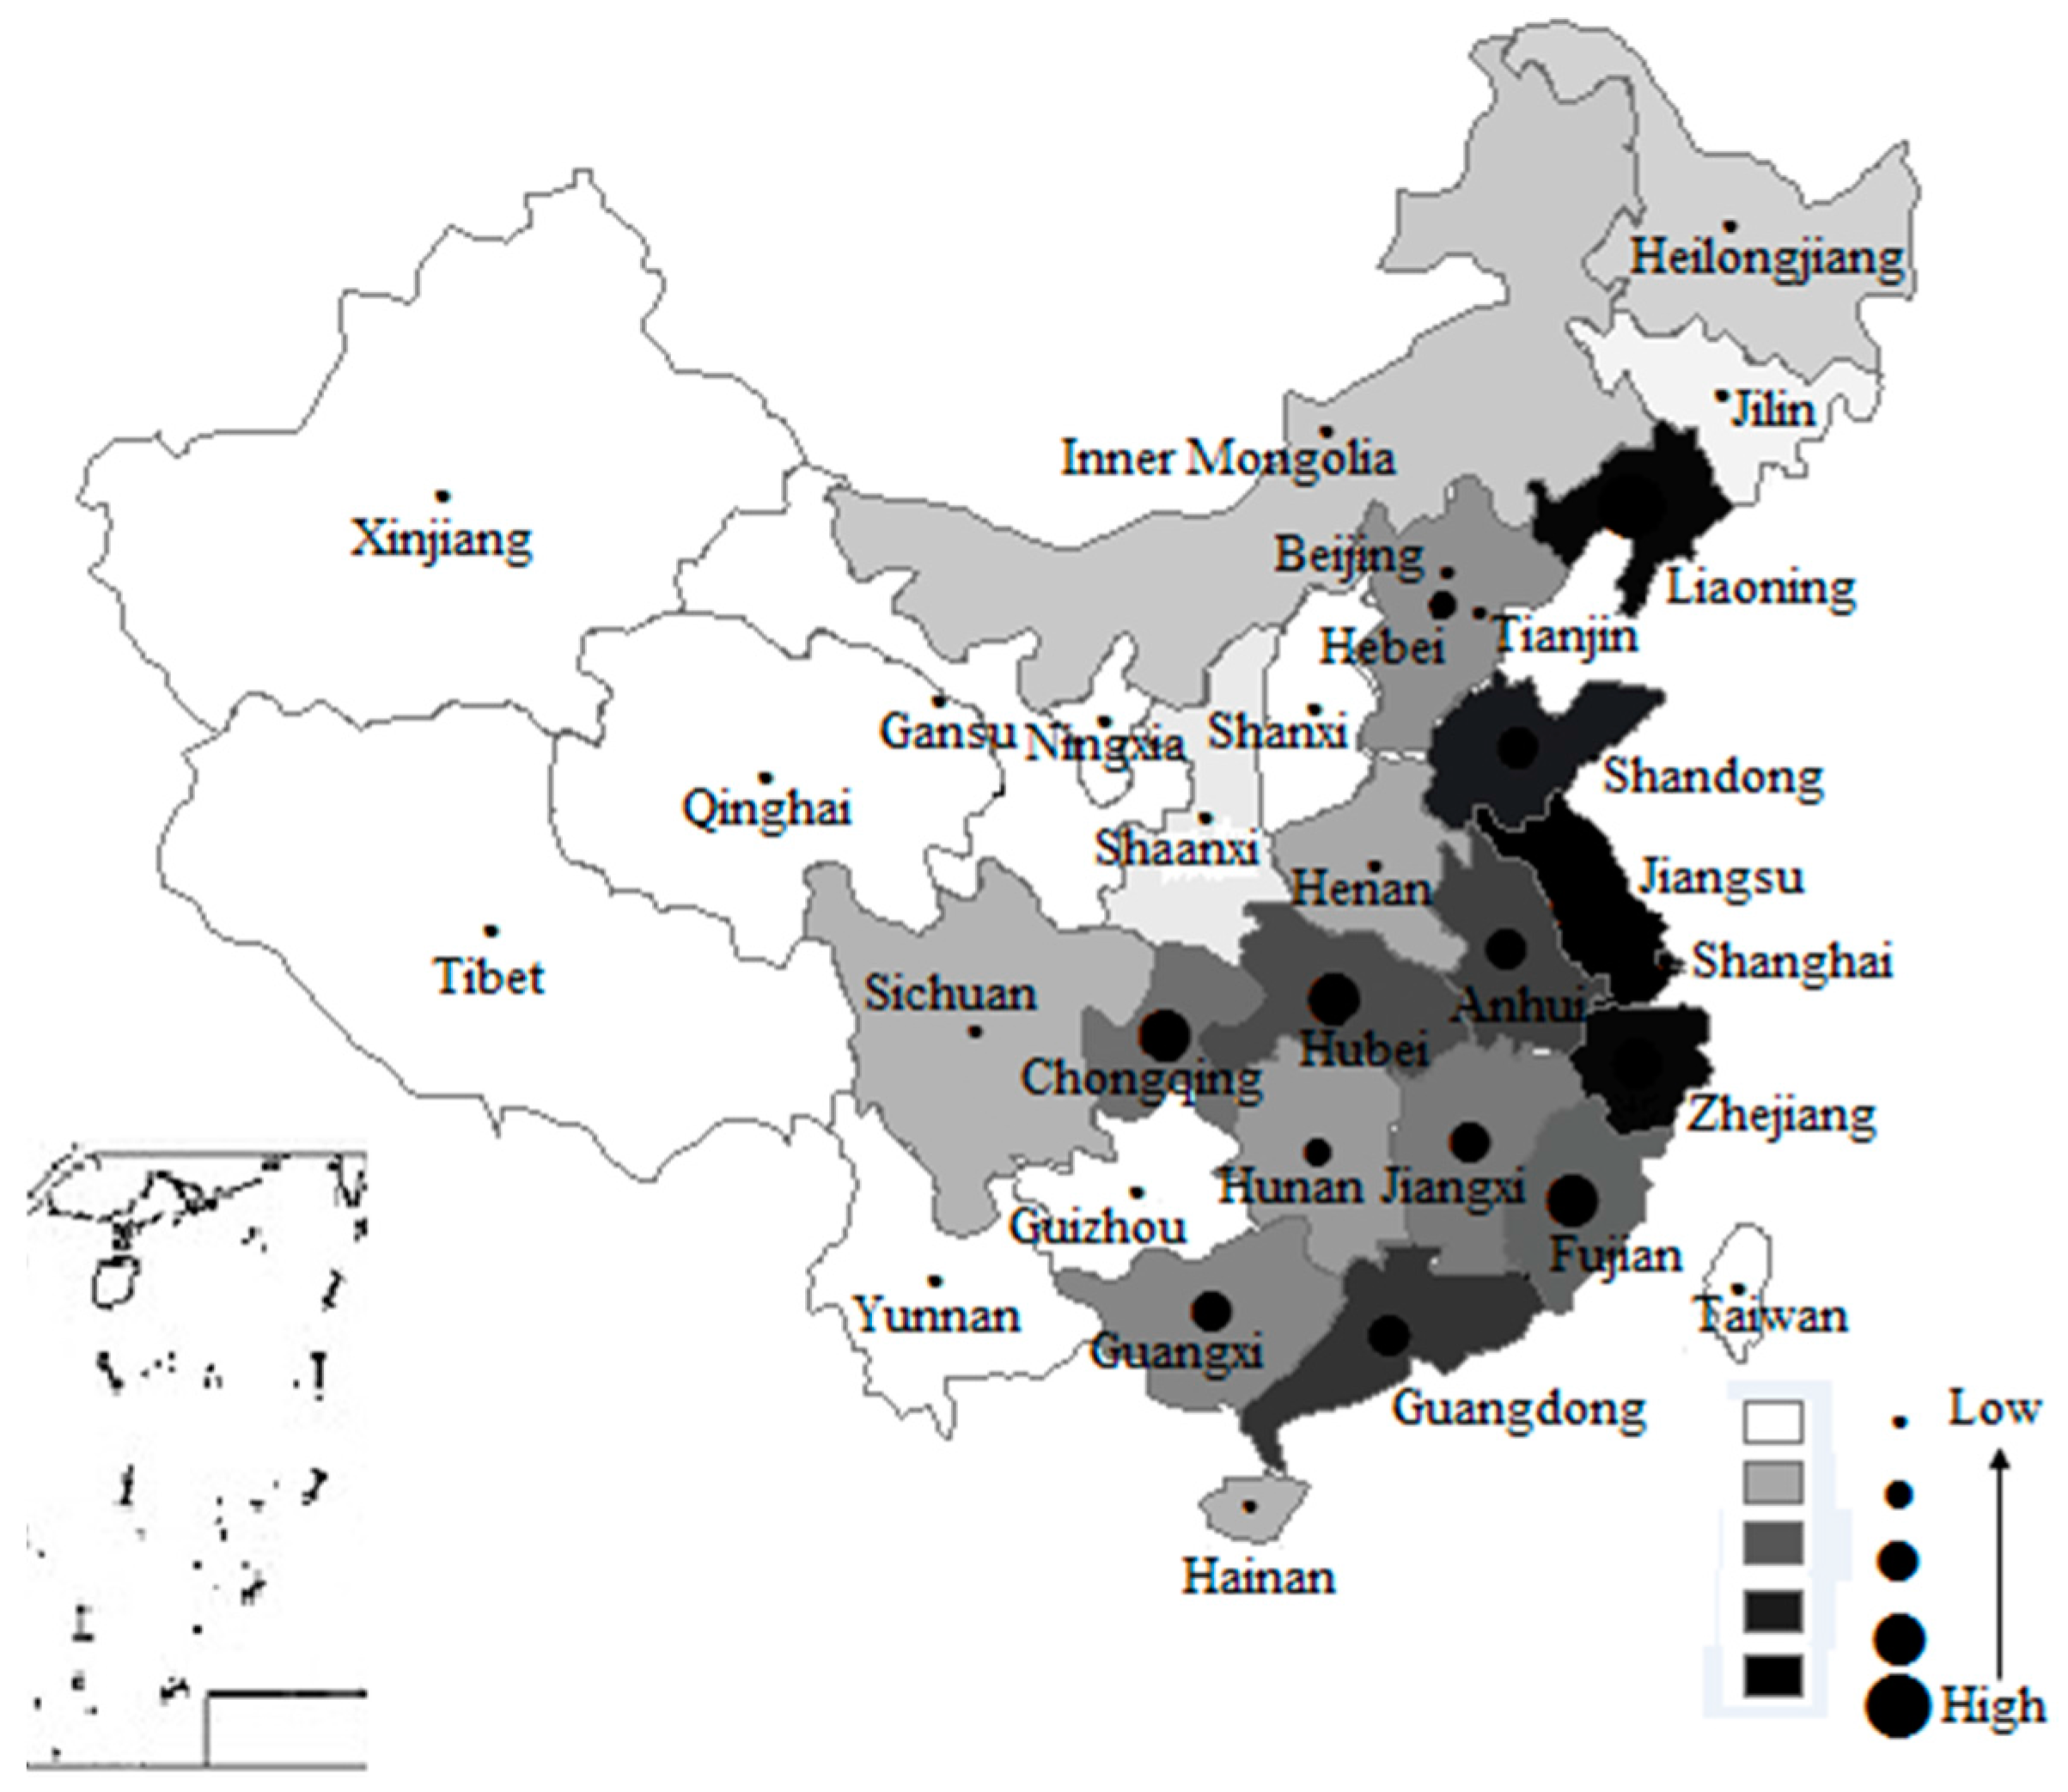
The evolution of regional shipbuilding industry interactivity is showed in Figure 4. It can be found that the interactivity and integration have a simultaneous development trends; the interactivity between regional shipbuilding industry and other related industries is higher. Shipbuilding industry appears an evolutionary feature that “In line with the Mask”, which means that shipbuilding industries in eastern coastal line, promote the development of those ships related industries in central region gradually through mutual inter-industry related effect.
As for local area, the situation of shipbuilding industry interactivity transfers from “two domain counter” to “three pillars”. According to Figure 4a, it can be seen that highly interactive areas are mainly concentrated in the Yangtze River Delta and Pearl River Delta region represented by Jiangsu and Fujian. The Circum-Bohai-Sea region makes good use of the opportunity provided by national strategy to greatly enhance the strength of its shipbuilding industry and makes constant breakthroughs, and ultimately the new pattern of “three pillars” of including the Circum-Bohai-Sea region has been formed, as is shown in Figure 4d.
4.3. The Influence of Industre Interdependence on Economic Development
We adopt the coefficients of direct consumption and total consumption to explore the relationship between regional shipbuilding industry and economic development. It is inconvenient to list all the industrial sectors in the table, so we select the top five sectors each year as objects of analysis in this section, which is presented in the following table.
According to Table 3, it can be found that in Yangtze River Delta and the Circum-Bohai-Sea region, the development of shipbuilding industry is more traditional, of which industries with strong direct demand focus on the metallurgical industry and machinery manufacturing; while Pearl River Delta region shows great direct demand of commerce, finance, wholesale and retail industries.
Overall, the direct consumption coefficient of regional shipbuilding industry to other industries presents a trend of decreasing, indicating that the dependence degree of shipbuilding industry on related industries is decreasing. However, the direct consumption coefficient of all regional ships and floating device manufacturing is increasing year by year. The hoop effect of shipbuilding industry has increased, which suggests the self-support of the shipbuilding industry is strengthening. Main upstream industries of shipbuilding are fisheries, transport, transportation equipment manufacturing, shipbuilding and floating equipment manufacturing. These industries have traditional advantages in China. The direct consumption coefficient of the Circum-Bohai-Sea region to its upstream industries is generally higher than the Pearl River Delta and Yangtze River Delta, indicating that the shipbuilding industry of the Circum-Bohai-Sea region plays a more significant role in promoting the national economy. At the same time, the relationship between shipbuilding industry and downstream industries is comparatively proportionate in different regions.
Combining the direct consumption coefficient and intermediate demand rate, the index of the Circum-Bohai-Sea region is higher than Pearl River Delta region and Yangtze River Delta, indicating that the basic industrial characteristics of the Circum-Bohai-Sea region shipbuilding are more obvious. The development degree of final demand industries is an important symbol of the level of production equipment and the level of people’s material living; meanwhile, the decline of intermediate demand rate reflects that the dependence of shipping industry on upstream and midstream industries is decreasing. Rising industrialization indicates that shipbuilding industry will promote the optimization and upgrading of China’s industrial structure.
Total consumption coefficient from each region of secondary industry is high, mainly concentrated in the vicinity of 2.0 and the difference is very tiny. The associated upstream industries focus mainly on strategic industries such as steel rolling processing industry, boilers and prime mover manufacturing, metallurgy, machinery and equipment manufacturing, showing that within the ship gathering area, the backward industrial chain is relatively perfection.
From the total consumption coefficient table (Table 4), the total consumption coefficient of the regional shipbuilding industry to the national economy is stable and greater than the social average, indicating that the correlation of the shipbuilding industry is high and the leading role in the national economy is significant. Among them, the total consumption coefficient of Yangtze River Delta region’s shipbuilding industry is higher than Pearl River Delta and Circum-Bohai-Sea region, and in each area, shipbuilding industry’s total consumption of secondary industry is significantly stronger than that of the primary and tertiary industry. By boosting production of shipbuilding industry, making use of multiplier effect, to expand demand of shipping industry related products, we can vigorously promote the development of secondary industry.
5. Influencing Factors Analysis of Regional Shipbuilding Industry Structure Change
From the above analysis of dynamic evolution of industry interdependence, the development of regional shipbuilding industry subjects to changes in various degrees. In order to further exploring pertaining the reasons, the article decomposes the input-output model and analyze the influencing factors of the shipbuilding industry change mainly from the aspects of the domestic final demand, foreign export demand, intermediate inputs, and intermediate imports demand, final imports demand. By making good use of the input-output tables to obtain the relevant data in the table below. The relevant data will be analyzed from the following two aspects: Firstly, to break down the data at different times but in the same region and on the other hand to make a comparison and analysis on the decomposed data from different regions.
5.1. The Development Effectiveness in Regional Shipbuilding Industry
According to the input-output model, the change factors can be divided into five aspects which to be calculated by using regional data in different years and obtaining the factors of changes in development of production as in Table 5.
Through the analysis of the data, the total production change effect of all regional industrial is more than 3.0, which reflects that the industry is expanding gradually. Meanwhile, the main influencing factor of interdependence changes is different in various regions. In the Yangtze River Delta, EII plays an important role in the contribution rate of 1.88; however, it is EFD that makes contribution in the Pearl River Delta, while in the Circum-Bohai-Sea region it is the ECD plays the role. As far as the overall change effect of the regional shipbuilding industry, the speed of the Yangtze River Delta’s shipbuilding industrial development is fastest than others. By analyzing the data, the domestic final demand and foreign export demand indexes are positive, indicating that the change effect of the demand pattern has a significant effect on the regional shipbuilding industries. However, both the intermediate and final import demand indexes have negative effects on changes to the shipbuilding industry, which shows the dependence on foreign markets of the three regions has declined. It is able to further enhance the international competitiveness of the shipbuilding industry as well as decrease the risk of the international trade by reducing the dependence on international markets. Although the domestic final demand and foreign export demand of the regions are trending positive, however, the change effect of the domestic final demand was significantly lower than the foreign export demand in the Pearl River Delta. In addition, the intermediate inputs change effect is negative in the Pearl River Delta, indicating that the shipbuilding industry is more sensitive to the final productions, while the intermediate products play a more important role in the production change of the shipbuilding industry in Circum-Bohai-Sea region and the Yangtze River Delta. The change effect of imports demand reduced 1.14% in Pearl River Delta; Yangtze River Delta and the Circum-Bohai-Sea region decreased by 0.72% and 0.79%.
However, the development of the shipbuilding industry in the Circum-Bohai-Sea region is more balanced; the contribution rate of the final domestic demand and export demand is flat. Due to the quality of products and technical performance have improved a lot, the foreign exports demand as well as the domestic final demand will turn into an important factor of production growth. Improving the structure of final demand that provides a vast market for the development and expanding of the regional shipbuilding industry. Improving the demand level will upgrade the structure of demand, thus contributing to the development of high-end industrial structure. Because of the regional division and coordination of labor, the regional shipbuilding industrial structure will be affected by the demand of the other regions, especially the high demand regions. Therefore, the shipbuilding industry in the Yangtze River Delta is vulnerable to the influence of the Pearl River Delta and the Circum-Bohai-Sea region. Under the condition of the international division of labor and export-oriented economy, the structure changes of the Pearl River Delta are sensitive to the demand of the international shipping market. Because of the Circum-Bohai-Sea region is adjacent to Japan and South Korea, the demand structure of the Circum-Bohai-Sea region is closely associate with the international market demand, which matches to the analysis of correlation effect ahead.
5.2. The Differences Effectiveness in Regional Shipbuilding Industry
In this section, we make a comparison and analysis on the decomposed data from different regions. The data as showed in Table 6 below.
By making pairwise comparison among the three regions, the development of the Circum-Bohai-Sea shipbuilding industry is the most prominent. The change of the Circum-Bohai-Sea shipbuilding industry is more than the Pearl River Delta and Yangtze River Delta region by 6.14% and 2.24% respectively, indicating the shipbuilding industry in the Circum-Bohai-Sea region is gradually showing its advantages, and it will become a new regional growth pole.
By decomposing the factors of the development differences of the Circum-Bohai-Sea region and the Pearl River Delta, the factor DFD was essentially flat in the two regions and the factor has the same degree of influence on the development of the shipbuilding industry in the two regions. However, by analyzing the Yangtze River Delta and Circum-Bohai-Sea region, the DFD has a greater impact on the change of the Yangtze River Delta shipbuilding industry, for which the Yangtze River Delta shipbuilding industry takes a higher proportion of the domestic demand. In the Yangtze River Delta, the consumption and investment in the shipbuilding industry are higher than other regions. As for the change factor of the FED, it has more influence on the Circum-Bohai-Sea region than the Pearl River Delta and Yangtze River Delta, up to 1.38% and 2.40%. The Circum-Bohai-Sea regional shipbuilding industry is in the phase of rapid development, which has a stronger competitiveness and a higher level of foreign exports. Due to the special location near to Japan and South Korea, Circum-Bohai-Sea region shows a high-speed development of marine technology. However, the Pearl River Delta shipbuilding industry has the highest sensitivity to the EII, indicating that the input level of the shipbuilding industry to the intermediate productions in the Pearl River Delta is the highest among the three regions. According to the IID and FID, the Circum-Bohai-Sea region is more sensitive to the changes of import demand effect, including IID and FID, and it is more than the Pearl River Delta and Yangtze River Delta by 1.06% and 6.61%. As a new growth pole, the shipping industry of Circum-Bohai-Sea region is too sensitive, which indicates that the industrial structure is not perfect enough and the industrial structure cannot match the development speed of the shipbuilding industry. Individually, the effect of the intermediate import demand is higher than the final import demand in the Circum-Bohai-Sea region, which indicates the supporting industry and ancillary facilities industries have a high dependence on the intermediate import goods. The development of the shipbuilding industry in the Yangtze River Delta and Pearl River Delta is more mature, thus having less dependence on the import demand.
Based on the above analysis, the shipbuilding industry of the Circum-Bohai-Sea region has more advantages, a high level of demand for import and export, thus, by making good use of the features to expand the demand level of production and transform into the new growth pole of the industry. However, the extensive development model of the Pearl River Delta, and lots of intermediate products are put into the shipbuilding industry, the intermediate input is the most important factors to support the development of the shipbuilding industry. The Yangtze River Delta region has a high level of self-demand and low level of intermediate inputs, which reflects the features of the high value-added industry. The structure of the shipbuilding industry in Yangtze River Delta region has been optimized due to the advanced technology and agglomeration of the production factors. At the same time, there is a common phenomenon that the level of domestic demand is high, and the regional shipbuilding industry has a balanced dependence on the export demand. Based on export growth being expected to play an important role in the actual production growth of the shipbuilding industry, however, as for China, the huge scale economic entity, seeking a stable structure, which is more conducive to control the adverse effects to the commercial trade activities, so as to ensure the sustainable development of economy.
6. Conclusions
Under the background of industry sustainable development, we first analyze the interdependence of regional shipbuilding industry by using the Input-output Model based on the data from nine provinces in China from 1997 to 2012. Second, we decompose the change factors of industry structure into the final domestic demand, foreign export demand, intermediate input, intermediate import demand and final import demand by applying the factor decomposition method. Our results indicate that (1) the shipbuilding industry has a significant interdependence, which has showed the characteristics of high integration and interaction. Among the three different regions, the degree of interdependence of the Yangtze River Delta is most significant, followed by the Pearl River Delta and the Bohai Rim region. The shipbuilding industry has a greater effect on the sustainable development of regional economy. According to the downward trend of the degree of association to the backward industry, the shipbuilding industry is changing to the final demand-oriented industry. (2) The interaction and integration of the shipbuilding industry have the trend of synchronous development. From the initial S-shapes of coastal distribution, the interaction gradually expands to inland cities radially. The integration has the characteristics of the eastern coastal high and low inland, through the strong correlation between industries and gradually promote the entire central region of shipbuilding-related industries. (3) The dependence of the shipbuilding industry on the related industries has been reduced, the self-supporting effect of the shipbuilding industry has been continuously strengthened, and the degree of industrialization has been increased, which indicates that the shipbuilding industry will further promote the industrial structure to the advanced development. (4) Shipbuilding industry has been expanding a lot, the main causes of changes in industrial structure are different, the effect of intermediate inputs change plays a significant role in the Yangtze River Delta. In the Pearl River Delta, it is the effect of changes in foreign export demand that counts, while in the Bohai Sea region, it is the effect of the final demand that make contribution.
Based on the above conclusions, we argue that the sustainable development of the shipbuilding industry has an important strategic significance on China’s economic development due to the significant interdependence between the shipbuilding industry and other industries. The shipbuilding industry is in a phase of rapid development, and tremendous efforts have been made in promoting the industrial sustainable development. However, our research suggests that it should make good use of the dislocation competitive advantages to avoid homogeneous competition and form a new growth pole among the three regions as the cause of shipbuilding industry structural changes are different. In addition, it should expand the domestic demand structure to adjust and optimize the industrial structure because the high level of domestic demand structure. It will be more conducive to reducing the impact of international trade risks to ensure a stable and sustainable development of industries.
Acknowledgments
This work was supported by MOE (Ministry of Education in China) Humanities and Social Sciences Research Foundation (Grant No. 15YJC630144), the Fundamental Research Funds for the Central Universities, China (Grant No. 17CX04023B), the Social Science Planning Research Projects of Qingdao, China (Grant No. QDSKL130415).
Author Contributions
All of the authors contributed equally to the research design and to this article. Xiaofeng Xu is the main writer of this paper and contributed to the data collection, empirical modeling and analysis. Jun Hao contributed to the dynamic evolution of regional shipbuilding industry interdependence dynamics. Yirui Deng contributed to the affecting factors analysis of regional shipbuilding industry structure change; she also contributed to the language revisions.
Conflicts of Interest
The authors declare no conflict of interest.
References
- Jia, X.; Foo, D.C.Y.; Tan, R.R.; Li, Z. Sustainable development paths for resource-constrained process industries. Resour. Conserv. Recycl. 2017, 119. [Google Scholar] [CrossRef]
- Chen, L.; Wang, Y.; Lai, F.; Feng, F. An investment analysis for China’s sustainable development based on inverse data envelopment analysis. J. Clean. Prod. 2017, 142, 1638–1649. [Google Scholar] [CrossRef]
- Masud, M.M.; Aldakhil, A.M.; Nassani, A.A.; Azam, M.N. Community-based ecotourism management for sustainable development of marine protected areas in Malaysia. Ocean Coast. Manag. 2017, 136, 104–112. [Google Scholar] [CrossRef]
- Liu, J.; Niu, D.; Song, X. The energy supply and demand pattern of China: A review of evolution and sustainable development. Renew. Sustain. Energy Rev. 2013, 25, 220–228. [Google Scholar] [CrossRef]
- Dijkstra, P.T.; Haan, M.A.; Mulder, M. Industry structure and collusion with uniform yardstick competition: Theory and experiments. Int. J. Ind. Organ. 2017, 50, 1–33. [Google Scholar]
- Editorial Committee of China Shipbuilding Industry Yearbook. China Shipbuilding Industry Yearbook; Editorial Committee of China Shipbuilding Industry Yearbook: Beijing, China, 2015. [Google Scholar]
- Jiang, L.P.; Bastiansen, E.; Strandenes, S.P. The international competitiveness of China’s shipbuilding industry. Transp. Res. Part E Logist. Transp. Rev. 2013, 60, 39–48. [Google Scholar] [CrossRef]
- Xu, X.F.; Liu, J.G.; Hao, J. Integration degree between regional shipbuilding industry and economic system taking Qingdao as an example. J. Harbin Eng. Univ. 2017, 38, 140–146. [Google Scholar]
- Tao, Y.H.; Feng, J.W. Thinking of shipbuilding industry development of China based on industry cluster. Ship Eng. 2005, 27, 63–66. [Google Scholar]
- David, D.; Richard, S.; Diego, F. Québec’ coastal maritime cluster: Its impact on regional economic development, 2001–2011. Mar. Policy 2016, 71, 201–209. [Google Scholar]
- Zhao, R.; Hynes, S.; Guang, S.H. Defining and quantifying China’s ocean economy. Mar. Policy 2014, 43, 164–173. [Google Scholar] [CrossRef]
- Jing, A.H.; Liu, M.J. Industrial structure adjustment based on the concept of low carbon-A case of Qingdao city. Energy Procedia 2011, 5, 1621–1625. [Google Scholar]
- Hitchin, A.O. The Strategy of Economic Development; Yale University Press: New Haven, CT, USA, 1958. [Google Scholar]
- Zhao, W.G.; Li, J. Spatial spillover effects of regional economic linkages and economic growth: A case study of Xinjiang. Financ. Econ. 2015, 3, 131–140. [Google Scholar]
- Zhao, B.X.; Xiao, W.W.; Tong, R.C.; Zhang, J.H.; Wang, L.L. Study on the blue economic connotation and its associated structure effects from the perspective of industrial networks—A case study of Shandong province. China Soft Sci. 2015, 8, 135–147. [Google Scholar]
- Wu, J.Y. The role and contribution of shipping industry to the national economy. J. Mar. Ind. Tech. Econ. Inf. 2001, 189, 8–13. [Google Scholar]
- Lu, J.; Zhang, L.L.; Liang, J. The indirect economic effect of depression of ship manufacturing on non-related industries. J. Bus. Res. 2013, 8, 25–28. [Google Scholar]
- Zhang, G.M.; Zhi, Y.Y.; Zhou, H. The analysis of shipping industry structure of Jiangsu. Mar. Technol. 2012, 5, 6–9. [Google Scholar]
- Zeng, B.; Su, X.Y. Impact of energy consumption on industrial structure alteration in China based on grey relevancy theory and panel-data model. Resour. Ind. 2006, 3, 109–112. [Google Scholar]
- Liu, X.L.; Liu, D.X. Gray relational analysis of Chongqing’s economic growth and industrial structure. Stat. Decis. 2010, 13, 122–124. [Google Scholar]
- Peng, J.Z.; Sun, Z.M.; Huang, X. Empirical analysis of industry structure and economy’s synergetic development based on grey relational theory: Evidence from Jiangxi province. Econ. Geogr. 2015, 8, 123–128. [Google Scholar]
- Ying, C.C. The development situation of the Yangtze River Delta region shipping industry. Nav. Architect. Ocean Eng. 2009, 1, 1–7. [Google Scholar]
- Ji, J.W. The transfer of world shipbuilding industry and the options of pillar industry of our country shipping. Mar. Equip. Mater. Mark. 2012, 2, 23–25. [Google Scholar]
- Xie, R.; Wang, L.F.; Lai, Y.M. The linkage effects of China’s iron and steel industry and international comparison analysis. Stat. Res. 2011, 8, 49–54. [Google Scholar]
- Liu, H.G.; Pan, Q.L.; Xie, S.N. A comparative analysis of the effects of agricultural industries in China and America based on the input-output model. Chin. Rural Econ. 2012, 11, 4–10, 20. (In Chinese) [Google Scholar]
- Heringa, P.W.; Heide, C.M.; Heijman, W.J.M. The economic impact of multifunctional agriculture in Dutch regions: An input-output model. NJAS Wagening. J. Life Sci. 2013, 71, 59–66. [Google Scholar] [CrossRef]
- Zhang, Y.; Su, Q. Industry dynamical relevancy analysis and comparison of the United States and China’s logistics industry. Econ. Geogr. 2011, 11, 1856–1861. [Google Scholar]
- Luo, J.K.; Meng, T.; Si, Z.C. Empirical analysis of the real estate industry association state. Constr. Econ. 2014, 5, 85–87. [Google Scholar]
- Hussain, A.B.; Tahira, Y. Assessment of the global financial crisis effects on energy consumption and economic growth in Malaysia: An input–output analysis. Int. Econ. 2014, 140, 49–70. [Google Scholar]
- Chen, Q.; Dietzenbacher, E.; Los, B.; Yang, C. Modeling the short-run effect of fiscal stimuli on GDP: A new semi-closed input–output model. Econ. Model. 2016, 58, 52–63. [Google Scholar] [CrossRef]
- Fan, Y.; Wu, S.; Lu, Y.; Wang, Y.; Zhao, Y.; Xu, S.; Feng, Y. An approach of measuring environmental protection in Chinese industries: A study using input–output model analysis. J. Clean. Prod. 2016, 137, 1479–1490. [Google Scholar] [CrossRef]
- Guevara, Z.; Domingos, T. The multi-factor energy input–output model. Energy Econ. 2017, 61, 261–269. [Google Scholar]
- Ocampo, L.; Masbad, J.G.; Noel, V.M.; Omega, R.S. Supply-side inoperability input–output model (SIIM) for risk analysis in manufacturing systems. J. Manuf. Syst. 2016, 41, 76–85. [Google Scholar]
- Gao, Y.D.; Zhang, W.G.; Yang, Q. The Factors Influencing of Industrial Structure Upgrade in China. Econ. Geogr. 2015, 6, 96–101. [Google Scholar]
- Zhang, C.J.; Zhang, Z.Y. Analysis on influence factors of China’s provincial industrial structure upgrading from a spatial econometrics perspective. Stat. Res. 2015, 10, 32–37. [Google Scholar]
- Lu, Z.J.; Li, D.K. Empirical study on the factors affecting the evolution of industrial structure. J. Guangxi Univ. Financ. Econ. 2011, 6, 110–114. [Google Scholar]
- Sun, H.J. An empirical analysis of the determination and change of the height of the industrial structure. Popul. Econ. 2012, 3, 39–44. [Google Scholar]
- Zhao, J.W.; Wen, Y.J. An input and output analysis of changes of China s economic structure. Res. Financ. Econ. Issues 2004, 4, 3–12. [Google Scholar]
- Han, Y.; Ni, S.Q. Factor analysis of China’s industrial structure adjustment. Econ. Theory Bus. Manag. 2011, 12, 53–60. [Google Scholar]
- Cai, W.X.; Liu, J. The structure analyzing about the waterway transportation industry association with others. Logist. Eng. Manag. 2010, 23, 105–106. [Google Scholar]
- Liu, J.; Zhu, G.L. An analysis of China’s industrial correlation and industrial structure evolution based on input–output table. Stat. Decis. 2012, 2, 136–139. [Google Scholar]
- Su, S.D. Industrial Economics; Higher Education Press: Beijing, China, 2006. [Google Scholar]
- Hu, Q.Y. China’s Economic Development and Industrial Structure; Economic Science Press: Beijing, China, 2007. [Google Scholar]
Figure 1.
The gross value of the China’s Shipbuilding industrial output, 2012.

Figure 2.
Industry membership matrix.
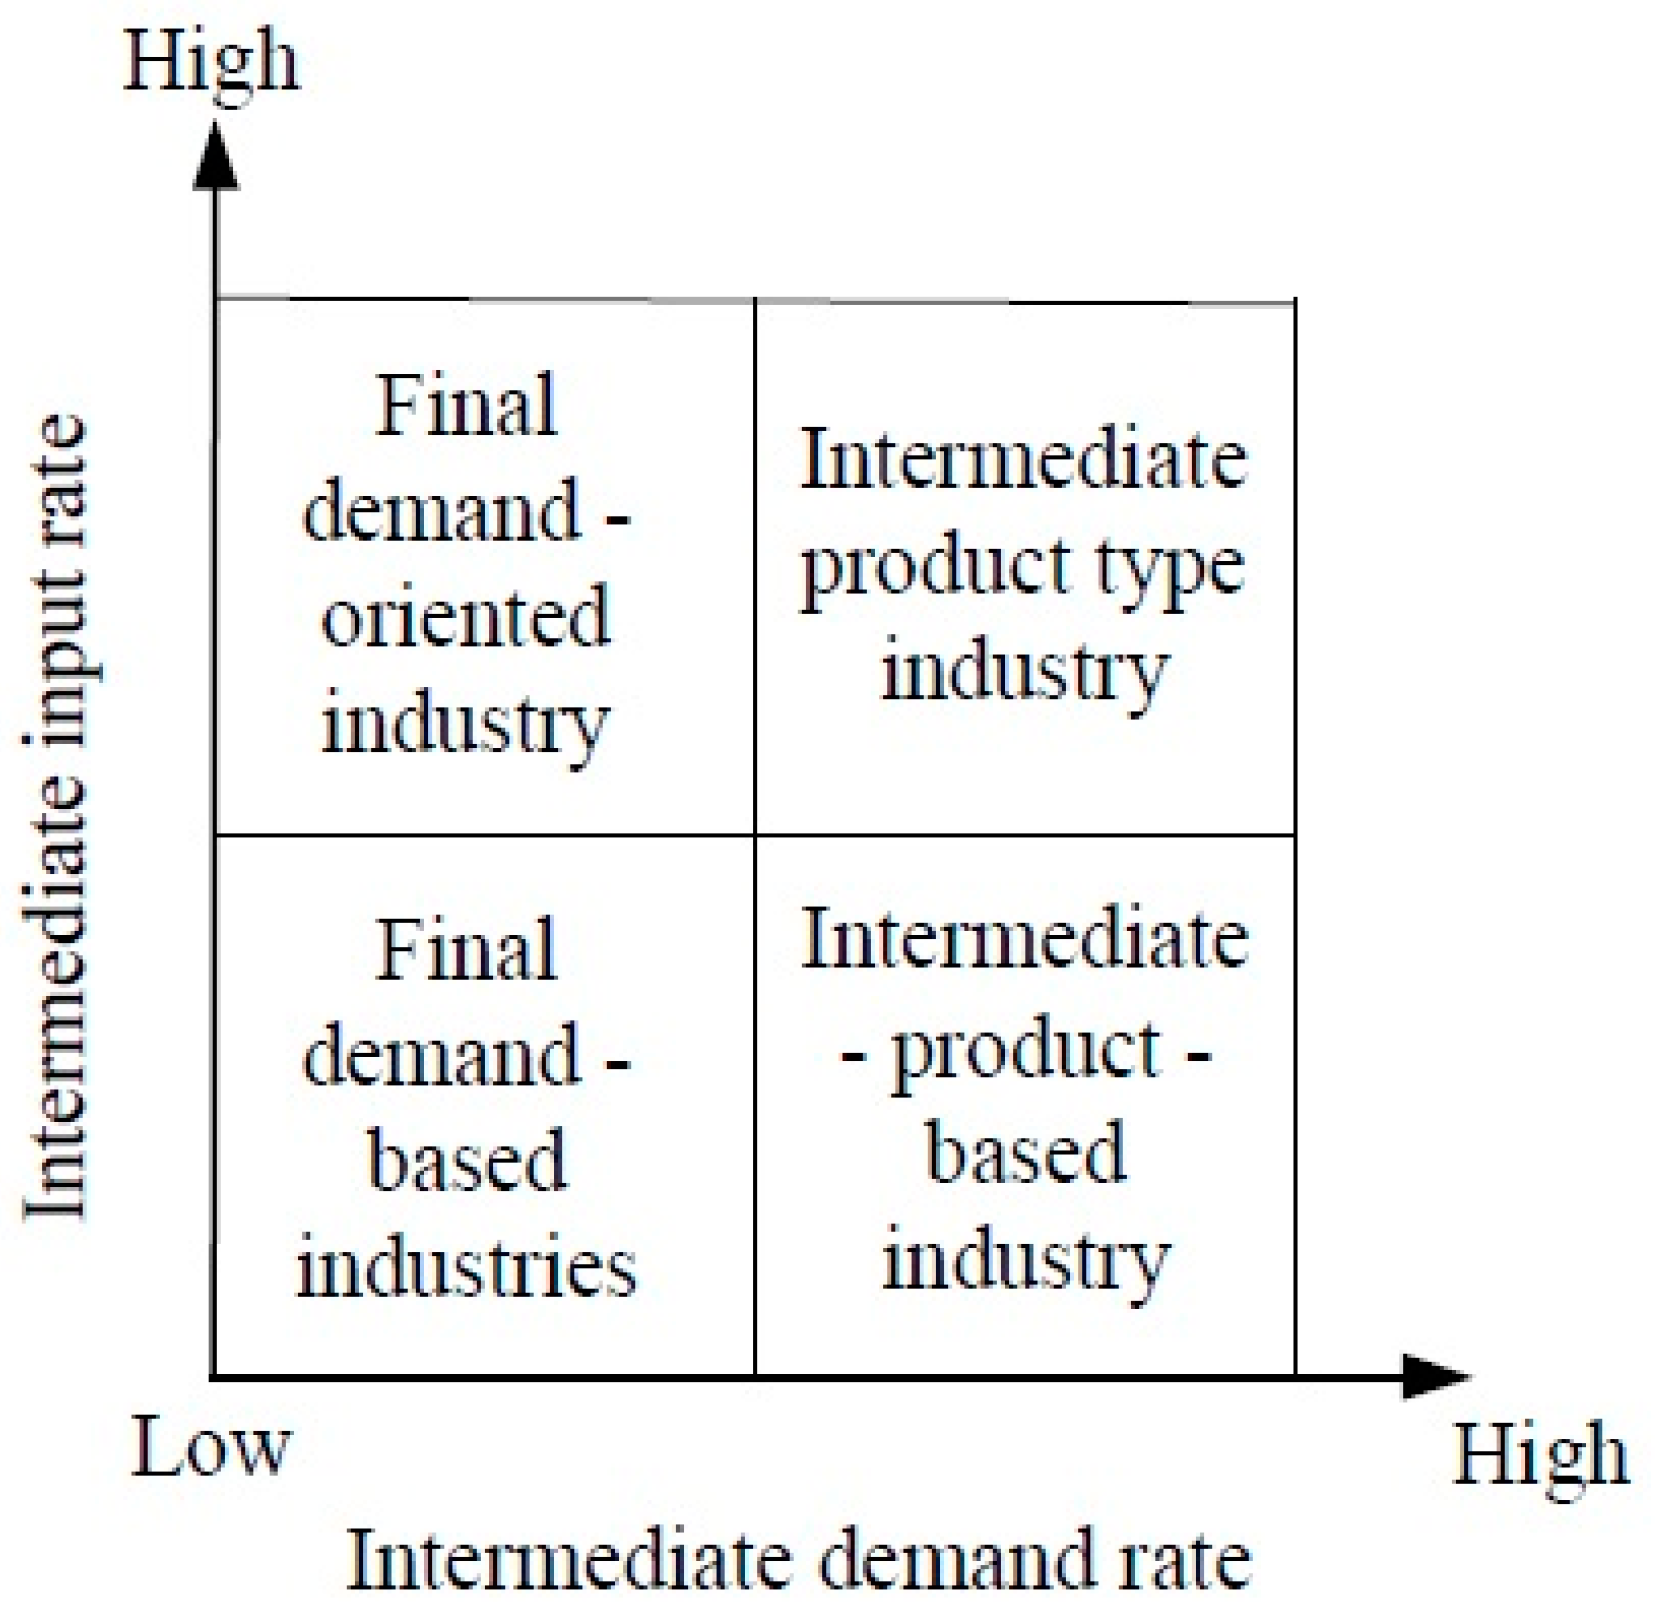
Figure 3.
1997 (a), 2002 (b), 2007 (c), 2012 (d) regional shipbuilding integration distribution.
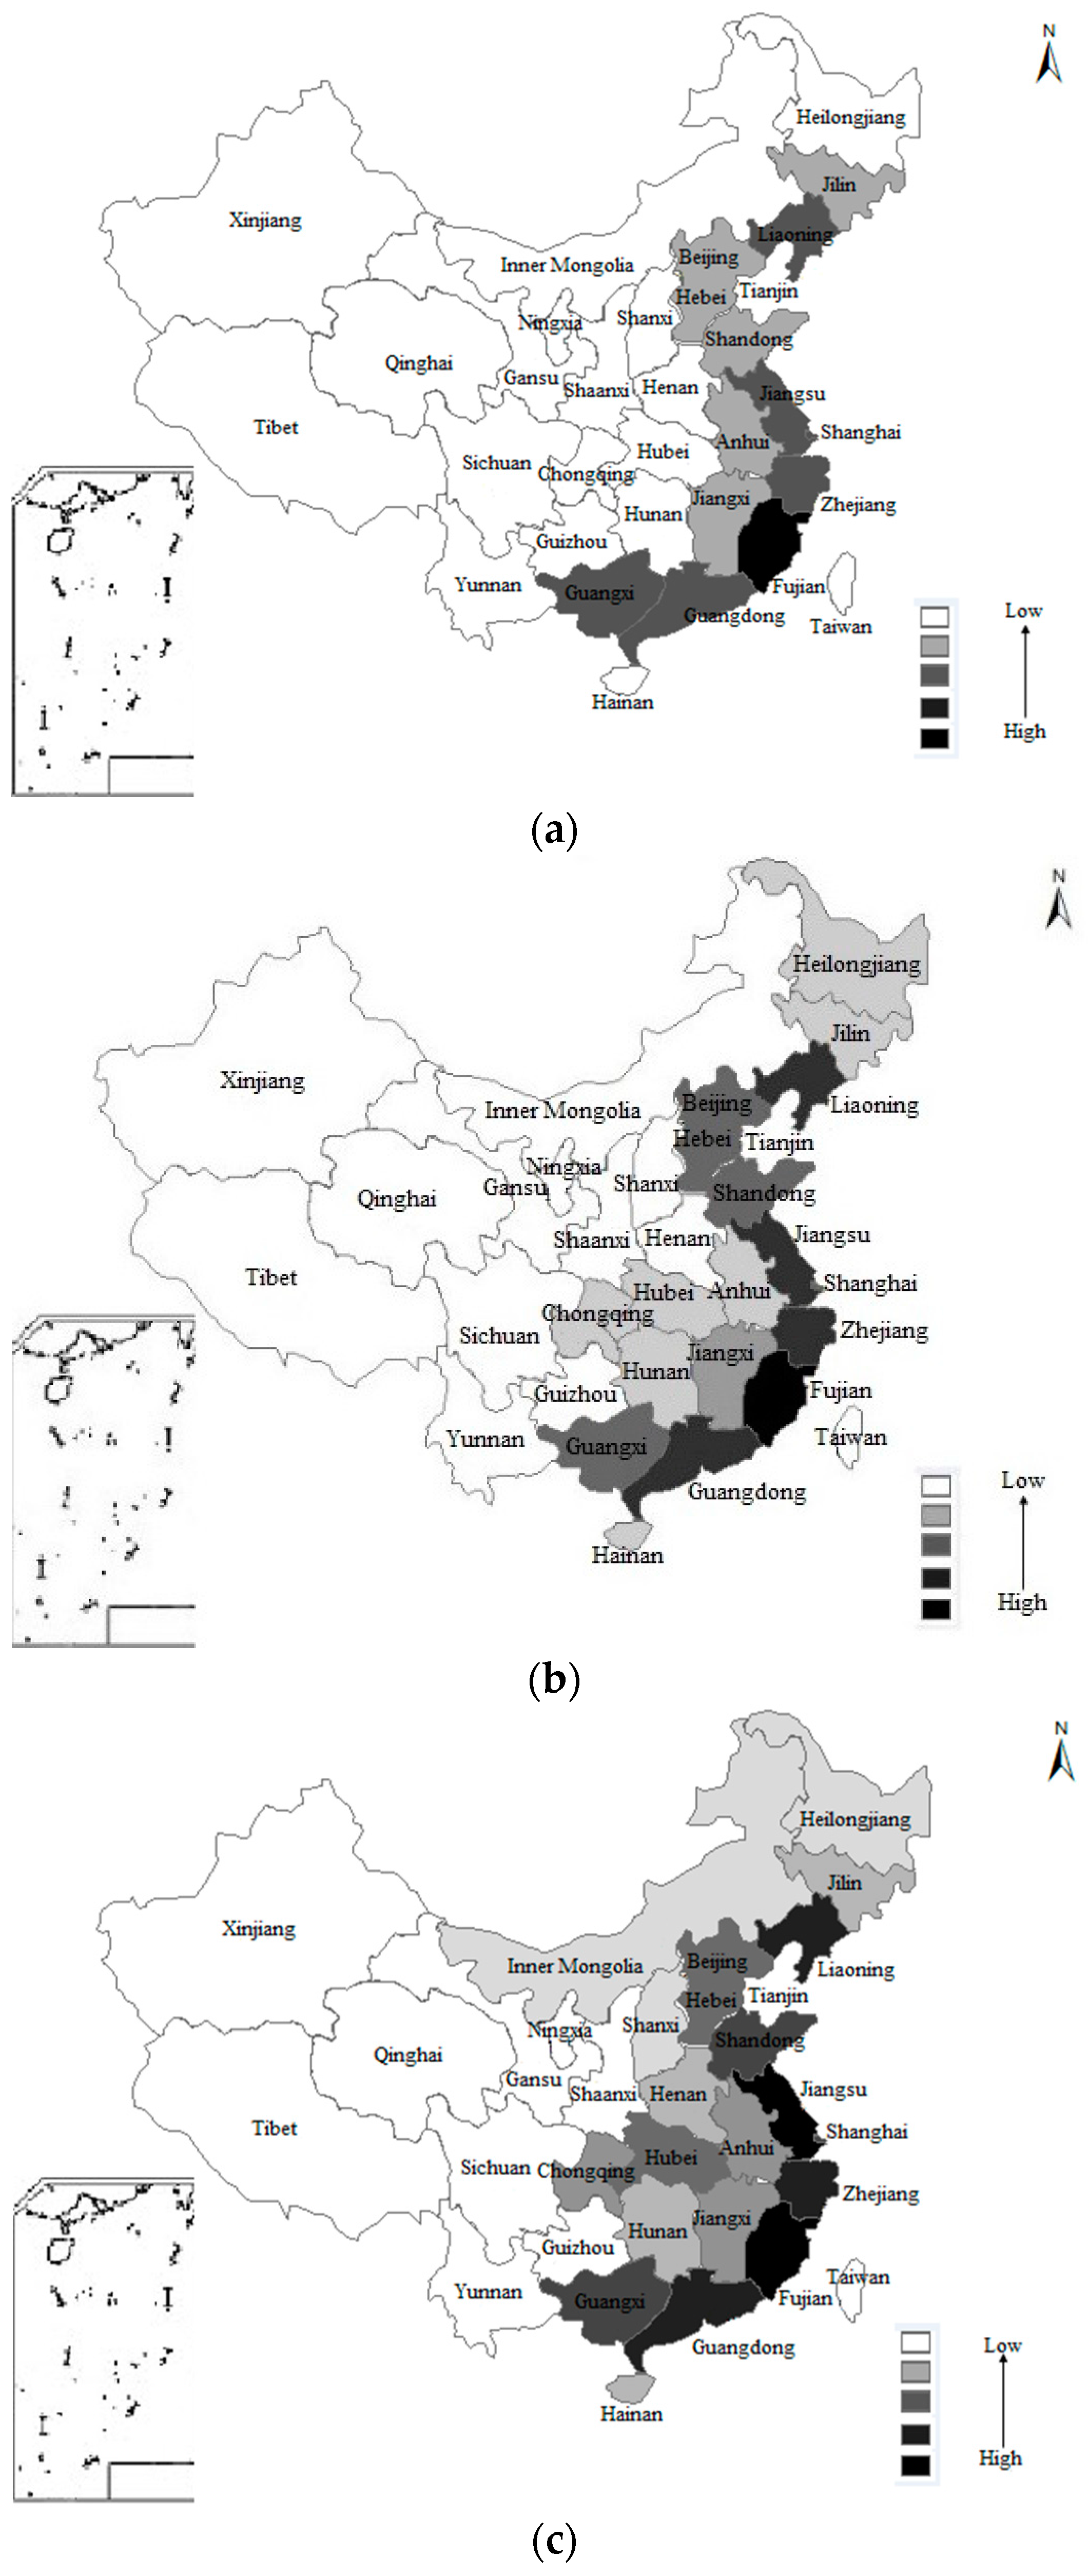

Figure 4.
1997 (a), 2002 (b), 2007 (c), 2012 (d) industrial interaction of the shipbuilding.


Table 1.
1997–2012 the intermediate input and demand rate of the shipbuilding industry.
| Indicators | Years | Yangtze River Delta | Pearl River Delta | Circum-Bohai-Sea |
|---|---|---|---|---|
| Intermediate inputs | 1997 | 0.7917 | 0.7894 | 0.6908 |
| 2002 | 0.7546 | 0.8073 | 0.7161 | |
| 2007 | 0.7843 | 0.7819 | 0.5295 | |
| 2012 | 0.7556 | 0.7461 | 0.6677 | |
| Intermediate demand | 1997 | 0.1237 | 0.3678 | 0.1837 |
| 2002 | 0.1329 | 0.2913 | 0.2747 | |
| 2007 | 0.5728 | 0.5126 | 0.3347 | |
| 2012 | 0.5213 | 0.4027 | 0.3569 |
Source: calculated on the basis of input-output table.
Table 2.
The influence and sensitivity coefficient of regional shipbuilding industry.
| Coefficient | Year | Yangtze River Delta | Pearl River Delta | Circum-Bohai-Sea Region |
|---|---|---|---|---|
| Influence coefficient | 1997 | 1.238342 | 1.073309 | 1.109205 |
| 2002 | 1.211567 | 1.237083 | 1.249792 | |
| 2007 | 1.109421 | 1.213073 | 0.918979 | |
| 2012 | 1.169367 | 1.235600 | 1.1199 | |
| Sensitivity coefficient | 1997 | 0.500511 | 0.442061 | 0.472549 |
| 2002 | 0.675168 | 0.567889 | 1.052084 | |
| 2007 | 0.562295 | 0.556821 | 0.650944 | |
| 2012 | 0.518367 | 0.531607 | 0.684533 |
Source: based on 2012 prices revised and calculated to obtain.
Table 3.
1997–2012 Regional shipbuilding industry direct consumption coefficients (Top 5).
| Year | Yangtze River Delta | Pearl River Delta | Circum-Bohai-Sea Region | |||
|---|---|---|---|---|---|---|
| Industries | DCC | Industries | DCC | Industries | DCC | |
| 1997 | Steel rolling processing | 0.1795 | Wholesale and retail trade | 0.1576 | Boiler manufacturing prime mover | 0.3691 |
| Boiler manufacturing prime mover | 0.1249 | Electricity supply | 0.0753 | Iron industry | 0.0360 | |
| General machinery manufacturing | 0.1048 | General machinery manufacturing | 0.0608 | Agriculture, forestry, animal husbandry and fishery | 0.0329 | |
| Business | 0.0441 | Real Estate | 0.0388 | Fabricated Metal Products | 0.0320 | |
| Non-ferrous metal rolling | 0.0315 | Financial industry | 0.0301 | Other electrical machinery manufacturing | 0.0274 | |
| 2002 | Steel rolling processing | 0.1658 | Fabricated metal products | 0.1162 | Manufacturing of ships and floating devices | 0.2442 |
| Other general equipment manufacturing | 0.1017 | Other transportation equipment manufacturing | 0.0915 | Steel rolling processing | 0.1365 | |
| Boiler and prime mover manufacturing | 0.1006 | Steel rolling processing | 0.0457 | Boiler and prime mover manufacturing | 0.0514 | |
| Coatings, paints, inks and similar products manufacturing | 0.0415 | financial | 0.0357 | Other general equipment manufacturing | 0.0459 | |
| Manufacturing of ships and floating devices | 0.0375 | Manufacturing of ships and floating devices | 0.0355 | Wholesale and retail trade | 0.0451 | |
| 2007 | Steel rolling processing industry | 0.1686 | Other common equipment industry | 0.0845 | Steel rolling | 0.1422 |
| Manufacturing of ships and floating devices | 0.0673 | Steel rolling | 0.0802 | Manufacturing of ships and floating devices | 0.0708 | |
| Fabricated metal products | 0.0515 | Manufacturing of ships and floating devices | 0.0708 | Boiler and prime mover manufacturing | 0.0503 | |
| Other common equipment industry | 0.0433 | Other electronic equipment manufacturing | 0.0595 | Wholesale and retail trade | 0.0328 | |
| Boiler and prime mover manufacturing | 0.0322 | Wholesale and retail trade | 0.0351 | Other common equipment industry | 0.0433 | |
| 2012 | Steel rolling | 0.1537 | Steel rolling | 0.0932 | Manufacturing of ships and floating devices | 0.0891 |
| Boiler and prime mover manufacturing | 0.0732 | Other transportation equipment manufacturing | 0.0873 | Steel rolling | 0.0887 | |
| Manufacturing of ships and floating devices | 0.0695 | Fabricated metal Products | 0.0653 | Other electrical manufacturing | 0.0605 | |
| Transportation equipment manufacturing | 0.0519 | Manufacturing of ships and floating devices | 0.0609 | Boiler and prime mover manufacturing | 0.0598 | |
| Communications equipment manufacturing | 0.0372 | Transportation equipment manufacturing | 0.0437 | Financial | 0.0428 | |
Source: calculated based on input-output table. DDC represents Direct Consumption Coefficients.
Table 4.
The total consumption coefficient of regional shipbuilding industry.
| Region | Year | Primary Industry | Secondary Industry | Tertiary Industry | Completely Consumed |
|---|---|---|---|---|---|
| Yangtze River Delta | 1997 | 0.0140 | 2.0748 | 0.4557 | 2.5445 |
| 2002 | 0.0790 | 2.1124 | 0.4202 | 2.6116 | |
| 2007 | 0.0131 | 1.9372 | 0.3717 | 2.3220 | |
| 2012 | 0.0330 | 2.0172 | 0.4030 | 2.4533 | |
| Pearl River Delta | 1997 | 0.1047 | 1.5925 | 0.7021 | 2.3992 |
| 2002 | 0.0227 | 2.0107 | 0.5235 | 2.5569 | |
| 2007 | 0.0264 | 2.0829 | 0.3372 | 2.4465 | |
| 2012 | 0.0409 | 1.9631 | 0.4660 | 2.4701 | |
| Circum-Bohai-Sea Region | 1997 | 0.0260 | 1.9556 | 0.3594 | 2.3409 |
| 2002 | 0.0401 | 1.9358 | 0.5671 | 2.5430 | |
| 2007 | 0.0159 | 1.9493 | 0.2716 | 2.2368 | |
| 2012 | 0.0251 | 1.9465 | 0.3778 | 2.3494 |
Table 5.
Regional shipbuilding industrial development change causes breakdown (%).
| Region | DFD | FED | EII | IID | FID | Total |
|---|---|---|---|---|---|---|
| Yangtze River Delta | 1.66 | 0.73 | 1.88 | −0.43 | −0.29 | 3.55 |
| Pearl River Delta | 2.01 | 2.47 | −0.07 | −0.72 | −0.42 | 3.27 |
| Circum-Bohai-Sea | 1.87 | 1.82 | 0.16 | −0.36 | −0.43 | 3.05 |
DFD represents the effect of domestic final demand changes; FED represents the effect of foreign export demand changes; EII represents the effect of intermediate inputs change; IID represents the effect of intermediate imports demand changes; FID represents effects of final imports demand changes, similarly hereinafter.
Table 6.
Regional shipbuilding industrial development differences causes breakdown (%).
| Area A-Area B | DFD | FED | EII | IID | FID | Total |
|---|---|---|---|---|---|---|
| CBS-PRD | 0.06 | 1.38 | −1.91 | 5.16 | 1.45 | 6.14 |
| YRD-CBS | 1.16 | −2.4 | 0.06 | 0.56 | −1.62 | −2.24 |
| YRD-PRD | 1.22 | −1.02 | −1.85 | 5.72 | −0.17 | 3.90 |
CBS-PRD represents Circum-Bohai-Sea Region-Pearl River Delta; YRD-CBS represents Yangtze River Delta-Circum-Bohai-Sea Region; YRD-PRD represents Yangtze River Delta-Pearl River Delta.
© 2017 by the authors. Licensee MDPI, Basel, Switzerland. This article is an open access article distributed under the terms and conditions of the Creative Commons Attribution (CC BY) license (http://creativecommons.org/licenses/by/4.0/).
Share and Cite
MDPI and ACS Style
Xu, X.; Hao, J.; Deng, Y. Industry Interdependence Dynamics and Structure Change Causal Analysis: An Empirical Study on China’s Shipbuilding Industry. Sustainability 2017, 9, 517. https://doi.org/10.3390/su9040517
AMA Style
Xu X, Hao J, Deng Y. Industry Interdependence Dynamics and Structure Change Causal Analysis: An Empirical Study on China’s Shipbuilding Industry. Sustainability. 2017; 9(4):517. https://doi.org/10.3390/su9040517
Chicago/Turabian StyleXu, Xiaofeng, Jun Hao, and Yirui Deng. 2017. "Industry Interdependence Dynamics and Structure Change Causal Analysis: An Empirical Study on China’s Shipbuilding Industry" Sustainability 9, no. 4: 517. https://doi.org/10.3390/su9040517
Note that from the first issue of 2016, this journal uses article numbers instead of page numbers. See further details here.